


The human gastrointestinal tract hosts an estimated 100 trillion bacteria, which play a role in key physiological activities, including gastrointestinal immune system maturation and fermentation of nutrients into beneficial metabolites( 1 ). Disruption of this symbiotic relationship between human host and gut microbiota has been implicated in the development of the metabolic syndrome, as well as intestinal pathology, including inflammatory bowel disease and colorectal cancer( Reference Hold, Smith and Grange 2 – Reference Han, Wang and Liu 4 ). A growing number of epidemiological studies have provided increasing evidence that perturbation of microbial community composition in the gut exists in colorectal cancer, with alterations of microbial taxa abundance in cancer cases compared with healthy controls( Reference Sobhani, Tap and Roudot-Thoraval 5 – Reference Weir, Manter and Sheflin 8 ).
Colorectal cancer risk has been attributed to dietary habits, with Western-style diets – low in fibre and high in red meat and fat – associated with higher risk for colorectal cancer( Reference Bouvard, Loomis and Guyton 9 , Reference Aune, Chan and Lau 10 ). Fibre intake, in particular, has remained an appealing modifiable dietary factor, given its postulated beneficial biological effects. Fibre speeds colonic transit and may decrease exposure of colonic epithelial cells to ingested carcinogens. In addition, fibre undergoes fermentation by the microbiota to yield SCFA end products, such as butyrate, which is not only essential for colon energy metabolism and epithelial proliferation, but in mouse models also exhibits tumour-suppressive activity through histone deacetylase inhibition( Reference Donohoe, Holley and Collins 11 ).
Consequently, there has been growing interest to understand the impact of dietary fibre on gut microbiota composition, which may ultimately reduce cancer risk. A diet low in fibre – the ‘fibre gap’ – has been associated with a depletion in human gut microbiota diversity, and potentially beneficial metabolites( Reference Han, Wang and Liu 4 ). Furthermore, although short-term dietary intervention trials have demonstrated that different amounts of fibre intake can significantly alter microbiota composition in a span of a few weeks( Reference O’Keefe, Li and Lahti 12 – Reference Liu, Zhao and Guo 14 ), there remain fewer studies evaluating the effect of long-term dietary habits of fibre intake on the gut microbiota in humans( Reference Wu, Chen and Hoffmann 15 ).
We investigated the association between long-term dietary fibre intake habits and gut microbiota composition in faecal samples of generally healthy adults from two independent study populations: controls from a hospital-based case–control study of colorectal cancer and gut microbiome( Reference Ahn, Sinha and Pei 6 ) and polyp-free adults from a cross-sectional colonoscopy study( Reference Peters, Dominianni and Shapiro 16 ). We sought to examine the relationship between higher dietary fibre intake and overall gut microbiota composition, as well as specific taxa abundance.
Methods
Study population
We assessed faecal samples of adults from two independent study populations: control subjects from a National Cancer Institute (NCI) hospital-based case–control study, hereafter referred to as NCI( Reference Ahn, Sinha and Pei 6 ), and polyp-free adults from a cross-sectional colonoscopy study at New York University (NYU), called the NYU Human Microbiome and Colorectal Tumor study, hereafter referred to as NYU( Reference Peters, Dominianni and Shapiro 16 ).
NCI enrolled participants from three Washington, DC area hospitals from 1985 to 1989( Reference Schiffman, Van Tassell and Robinson 17 , Reference Schiffman, Andrews and Van Tassell 18 ). We included seventy-five control subjects who were awaiting elective surgery for non-oncological, non-gastrointestinal conditions, and reported no antibiotic intake during the year before recruitment. Participants provided 2-d faecal samples that were freeze-dried, and samples with at least 100 mg of lyophilised faecal material available were included for analyses.
NYU enrolled participants from Kips Bay Endoscopy Center in New York City from 2012 to 2014. We included seventy-six polyp-free participants from this study. We excluded subjects with missing colonoscopy reports, history of inflammatory bowel disease, prior surgical anastomosis, prior history of colorectal cancer, history of familial adenomatous polyposis, and with most recent colonoscopy report >3 years before stool sample collection.
In both studies, participants provided written informed consent, reported no long-term antibiotic treatment and completed diet and demographic questionnaires. We excluded subjects with <1000 microbial sequence reads, missing or extreme energetic intake (≤2092 or >16 736 kJ/d) and with a history of other cancers, for a final sample size of 151 (n 75 in NCI, n 76 in NYU). The NYU study was approved by the institutional review board (IRB) of NYU School of Medicine, and the NCI study was approved by the IRB of NYU School of Medicine and the NCI.
Demographic information and dietary fibre assessment
Information on age, sex, height, weight, race and cigarette smoking status was collected by means of a questionnaire at stool collection. BMI was calculated by dividing weight in kg by squared height in m, and was then categorised as underweight or normal weight (<25 kg/m2), overweight (25≤BMI<30 kg/m2) or obese (BMI≥30 kg/m2), based on WHO definition( 19 ). Cigarette smoking status was defined as never, current or former smoker.
Usual dietary intake was calculated from self-administered FFQ, which queried intake frequency and portion size of food types. Nutrient values per portion were multiplied by daily frequency of intake and summed across all relevant food items. Nutrient data were standardised by total energy intake( Reference Willett, Howe and Kushi 20 ). Study-specific quartiles of total fibre intake were used (NCI: <11·3, 11·3–14·3, 14·4–16·6, ≥16·7 g/d; NYU: <19·8, 19·8–23·7, 23·8–31·6, ≥31·7 g/d). In addition, study-specific quartiles of fibre from different dietary sources were assessed: fibre from fruits and vegetables (NCI: <6·5, 6·5–8·7, 8·8–11·0, ≥11·1 g/d; NYU: <11·1, 11·1–14·9, 15·0–21·2, ≥21·3 g/d), fibre from grains (NCI: <2·7, 2·7–3·2, 3·3–4·8, ≥4·9 g/d; NYU: <9·1, 9·1–12·6, 12·7–16·6, ≥16·7 g/d) and fibre from beans (NCI: <0·9, 0·9–1·3, 1·4–2·1, ≥2·2 g/d; NYU: <1·8, 1·8–2·7, 2·8–4·4, ≥4·5 g/d).
Faecal samples
In NCI, faecal samples were collected by participants at home over a 2-d period, before hospitalisation and treatment, and stored in a plastic container in a styrofoam chest containing dry ice. Faecal samples were shipped to a USDA laboratory, lyophilised and stored at a minimum of −40°C in sealed, air-tight containers. Sample aliquots were shipped to NYU for microbiome assay. In NYU, faecal samples were collected by participants onto two sections of Beckman Coulter Hemoccult II SENSA® cards (Beckman Coulter) at home. Samples were shipped to NYU and stored immediately at −80°C.
Microbiota assay
In both NCI and NYU, DNA was extracted from faecal samples using the Mo Bio PowerSoil DNA Isolation Kit (Mo Bio) with bead-beating, as previously reported( Reference Peters, Dominianni and Shapiro 16 ). In NCI, 16S ribosomal RNA (rRNA) gene amplicons covering variable regions V3–V4 were generated using the 347F-5′GG AGGCAGCAGTRRGGAAT′-3′ and 803R 5′-CTACCRGGGTATCTAATCC-3′ primer pair( Reference Ahn, Sinha and Pei 6 , Reference Nossa, Oberdorf and Yang 21 ). Amplicons were sequenced with the 454 Roche FLX Titanium pyrosequencing system, according to the manufacturer’s protocol. In NYU, 16S rRNA gene amplicons covering the V4 region were generated using the F515-5′GTGCCAGCMGCCGCGGTAA′-3′ and R806-5′GGACTACHVGGGTWTCTAAT-3′ primer pair( Reference Caporaso, Lauber and Walters 22 ). Amplicons were sequenced with the Illumina MiSeq platform.
Sequence data processing
Because two different sequencing platforms were used, we processed the sequence data separately. Sequences were demultiplexed, and poor-quality sequences excluded, using the default parameters of Quantitative Insights into Microbial Ecology (QIIME) script split_libraries.py (for NCI) or split_libraries_fastq.py (for NYU)( Reference Caporaso, Kuczynski and Stombaugh 23 ). Filtered sequence reads were clustered into de novo operational taxonomic units (OTU) at 97 % identity, and representative sequence reads for each OTU were assigned taxonomy based on fully sequenced microbial genomes (Integrated Microbial Genomes (IMG)/Greengenes(GG))( Reference Caporaso, Kuczynski and Stombaugh 23 ). Chimeric sequences were removed with ChimeraSlayer( Reference Haas, Gevers and Earl 24 ). Blinded quality control specimens in all sequencing batches showed good reproducibility: high intraclass correlation coefficients for the Shannon diversity index and abundances of bacterial phyla and genera have been previously reported( Reference Ahn, Sinha and Pei 6 , Reference Peters, Dominianni and Shapiro 16 , Reference Love, Huber and Anders 25 ).
Statistical analysis
α-Diversity
We evaluated the association between quartiles of fibre intake and within-subject microbial diversity (α-diversity) indices of Shannon diversity and evenness( Reference Shannon 26 ). In both studies, these indices were calculated in 100 iterations of rarefied OTU tables of 1000 sequence reads per sample. We modelled the Shannon index and evenness as outcomes in linear regression, adjusting for age, sex, race, categorical BMI and cigarette smoking status.
β-Diversity
We assessed the relationship of overall gut microbiota composition and quartiles of dietary fibre intake using weighted (quantitative) and unweighted (qualitative) phylogenetic UniFrac distance matrices( Reference Lozupone, Hamady and Kelley 27 ). Permutational multivariate ANOVA (PERMANOVA) of both weighted and unweighted UniFrac distances was used to evaluate whether fibre intake is associated with overall microbial community composition, after adjusting first for age, sex, race, categorical BMI and cigarette smoking status (adonis function, ‘vegan’ package in R)( Reference McArdle and Anderson 28 ). Principal coordinate analysis plots were generated using the first two principal coordinates, and labelled according to quartile of fibre intake.
Differential abundance testing
We assessed the relationship between higher quartiles of total fibre intake and specific taxa abundance using negative binomial generalised linear models, in the ‘DESeq2’ package in R( Reference Love, Huber and Anders 25 ). Models were adjusted for age, sex, race, categorical BMI and cigarette smoking status. Nominal P values and false discovery rate (FDR) adjusted q-values were calculated( Reference Benjamini and Hochberg 29 ). DESeq2 default outlier replacement, independent filtering of low-count taxa and filtering of count outliers were turned off. Taxa models with maximum Cook’s distance >10 were removed before P value adjustment for the FDR( Reference Benjamini, Drai and Elmer 30 ).
To identify similar taxa associations in both NCI and NYU, we then performed a taxonomy-based meta-analysis to evaluate for genera and species with higher or lower abundance by fibre intake concomitantly in each of the two study populations. In addition, we performed sub-analyses to examine associations between taxon abundance and higher intake of fibre from specific sources, such as fruit and vegetables, grains and beans. We calculated nominal meta-analysis P values based on Z-score methods( Reference Evangelou and Ioannidis 31 ).
All trends were tested using the median values of each quartile of fibre intake. All analyses were performed using R, version 3.3.2.
Results
Subject characteristics
A total of 151 adult subjects were included for analysis: n 75 in NCI and n 76 in NYU. Subject characteristics are reported in Table 1. Among these participants, 73·3 % in NCI and 51·3 % in NYU were male, and 82·7 % in NCI and 85·5 % in NYU were white. Median age in both study groups generally increased with higher fibre intake, although the trends were not statistically significant.
Participant demographic characteristics (Quartiles (Q) and medians)
* NCI, National Cancer Institute; NYU, New York University.
* NCI quartiles of fibre intake: Q1: <11·3 g; Q2: 11·3–14·3 g; Q3: 14·4–16·6 g; Q4: ≥16·7 g.
†P values are calculated from Kruskal–Wallis test (continuous variables) or χ 2 test (categorical variables).
‡NYU quartiles of fibre intake: Q1: <19·8 g; Q2: 19·8–23·7 g; Q3: 23·8–31·6 g; Q4: ≥31·7 g.
Global diversity
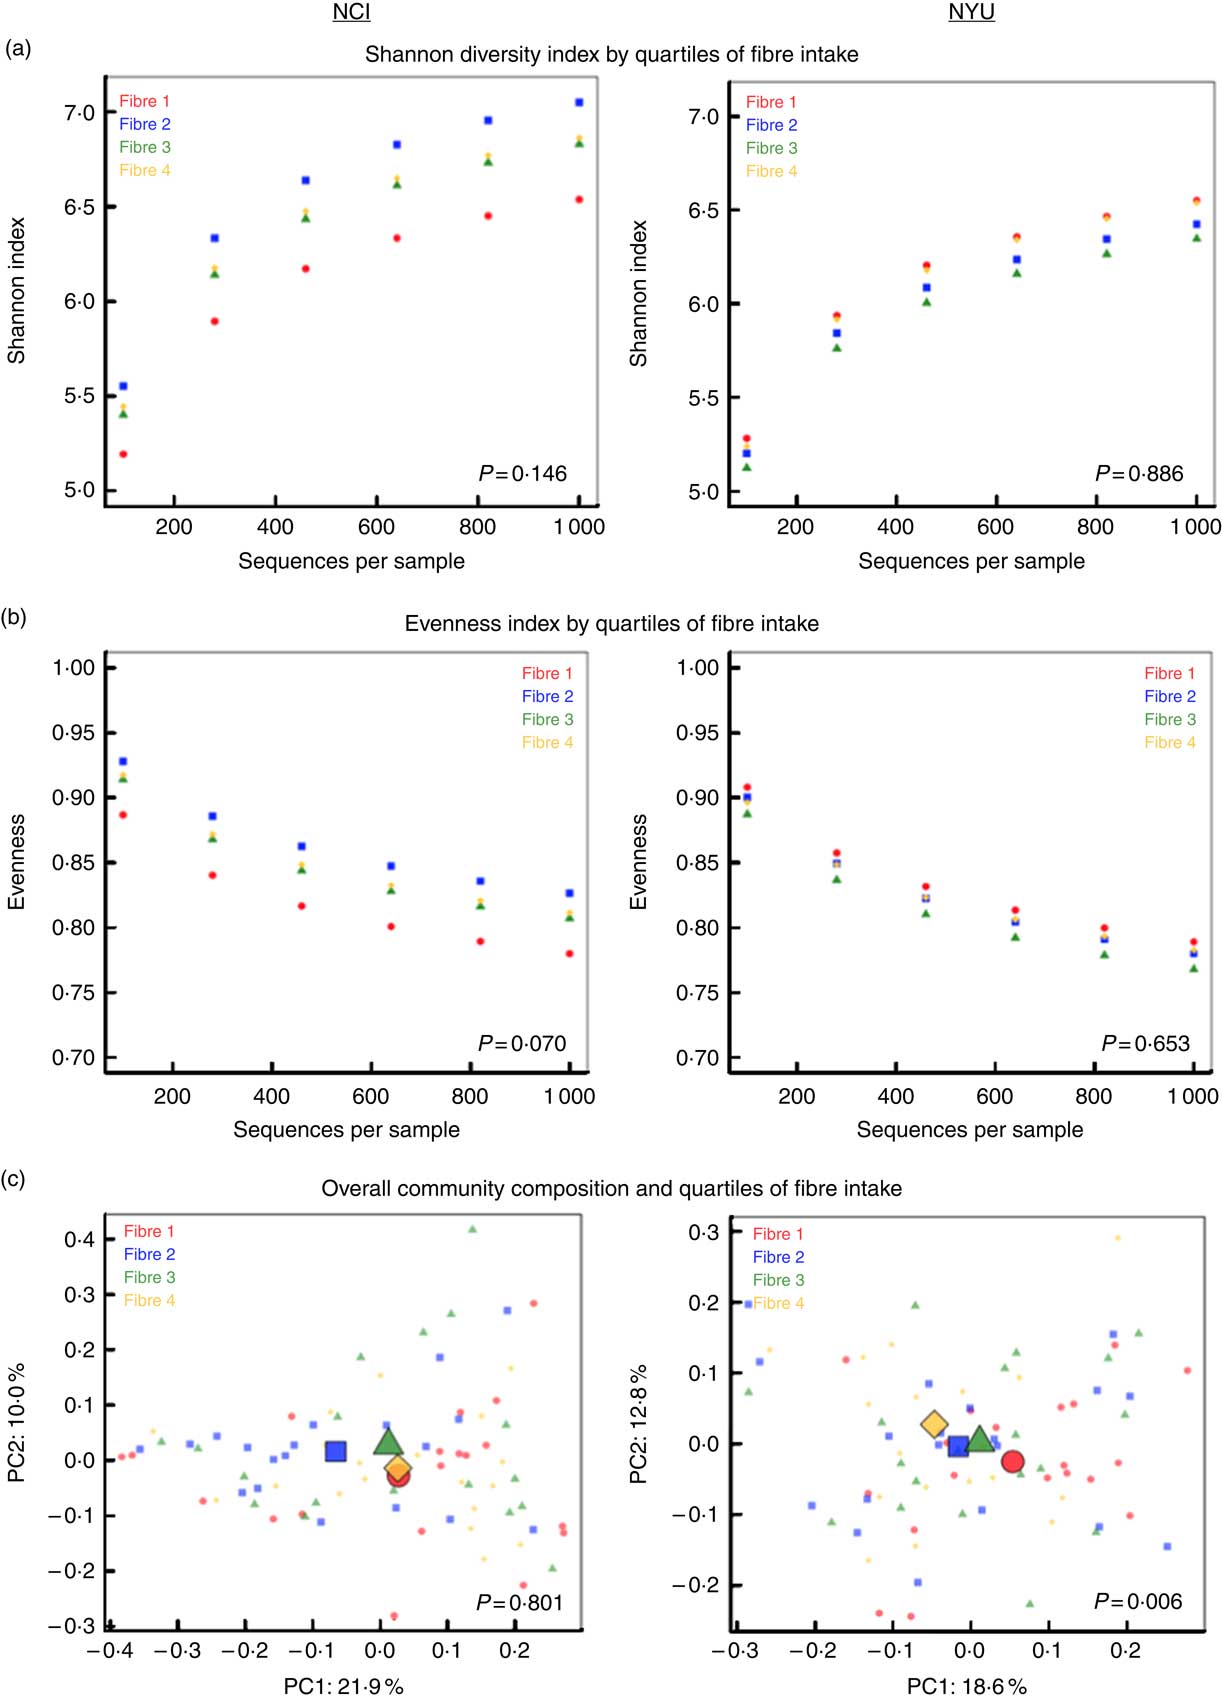
PERMANOVA analyses of between-sample UniFrac distances demonstrated that fibre intake was significantly associated with overall microbial community composition in NYU (weighted UniFrac P=0·008; unweighted UniFrac P=0·01) but not NCI (weighted UniFrac P=0·81; unweighted UniFrac P=0·75) after adjusting for covariates of age, sex, race, BMI and cigarette smoking (Fig. 1(c)). In contrast, in both NCI and NYU, total fibre intake was not significantly associated with microbial community diversity as measured by the Shannon diversity index or evenness (Fig. 1(a)).
α and β diversity in relation to quartiles of total fibre intake (a) Shannon diversity index and (b) evenness index by quartiles of total fibre intake are shown in n 151 healthy adult subjects from two independent study populations (National Cancer Institute (NCI)=75, New York University (NYU)=76). These indices were calculated in 100 iterations of rarefied operational taxonomic units tables of 1000 sequence reads per sample. Fibre 1, fibre 2, fibre 3 and fibre 4 represent increasing quartiles of fibre intake. Shannon index and evenness were modelled as outcomes in linear regression, adjusting for age, sex, race, categorical BMI and cigarette smoking status. P values of fibre variable in regression analysis are reported in the figure. (c) Principal coordinate analysis (PCoA) plots, based on weighted UniFrac phylogenetic distances, showed a difference between lowest and highest fibre intake in NYU. This relationship was not observed in NCI. PCoA plots were generated using the first two principal coordinates (PC): PC1 and PC2. P values reported in the figure are based on permutational multivariate ANOVA of weighted UniFrac distances evaluating the association between fibre intake and overall microbial community composition, after adjusting for age, sex, race, categorical BMI and cigarette smoking status.
Taxon abundance
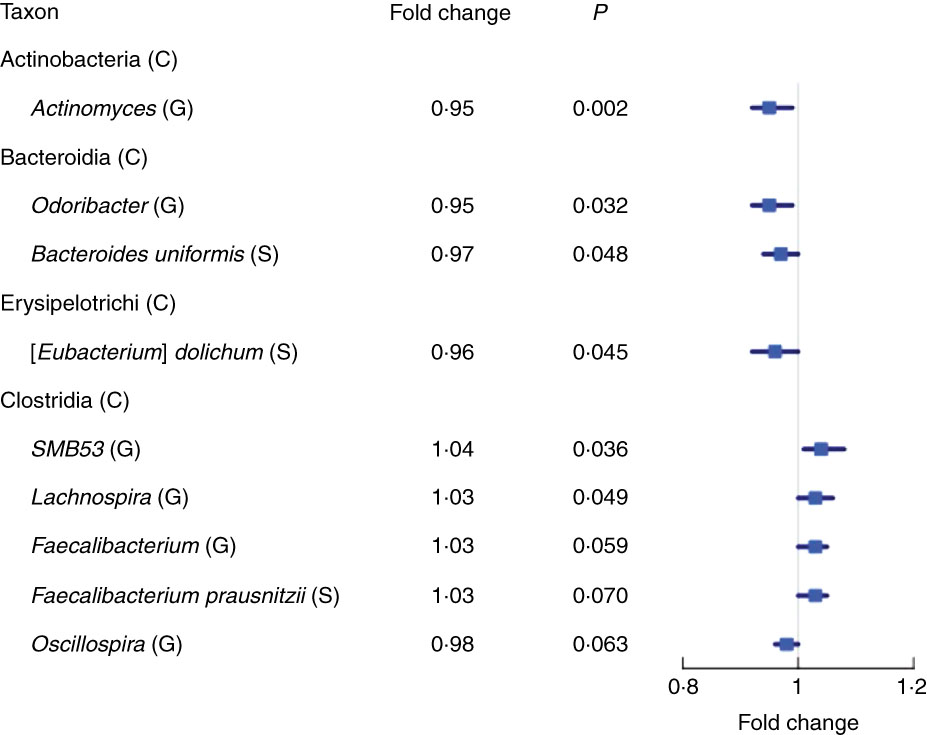
We found fourteen genera with the same direction of association with fibre intake in NCI and NYU, out of twenty-nine total genera that overlapped (i.e. were detected) in both studies. Higher total fibre intake was associated with lower abundance of genera Actinomyces (fold change (FC)=0·95, P=0·002) of class Actinobacteria and Odoribacter (FC=0·95, P=0·03) of class Bacteroidia, and was marginally associated with lower abundance of Oscillospira (FC=0·96, P=0·06) of class Clostridia. Higher total fibre intake also tended to be associated with higher abundance of selected genera of class Clostridia: SMB53 (FC=1·04, P=0·04), Lachnospira (FC=1·03, P=0·05) and Faecalibacterium (FC=1·03, P=0·06) (Fig. 2 and Table 2).
Forest plot of fold change of select genera (G) and species (S) in both the New York University and National Cancer Institute study populations with a significant or marginally significant association with higher total fibre intake, based on meta-anlysis of the two study populations. Meta-analysis nominal P values were calculated based on Z-score methods. C, class.
Meta-analysis of the association between total fibre intake and genera and species in National Cancer Institute (NCI) and New York University (NYU) study populations* (Mean values and 95 % confidence intervals)
FC, fold change; Q, false discovery rate-adjusted q-value; NA, non-applicable.
* Taxa shown were associated with fibre intake in the same direction in both NCI and NYU. Relationship between higher quartiles of total fibre intake and differential taxon abundance was evaluated using negative binomial generalised linear models in the DESeq2 package in R. Models were adjusted for age, sex, race, categorical BMI and cigarette smoking status. Meta-analysis was conducted using Z-score methods.
At the species level, we found eight species with the same direction of association with fibre intake in the two study populations, out of seventeen total species observed overlapping in both studies. A meta-analysis at this taxonomic level showed a marginal association between higher total fibre intake and higher abundance of Faecalibacterium prausnitzii (FC=1·03, P=0·07), and lower abundance of Eubacterium dolichum (FC=0·96, P=0·04) and Bacteroides uniformis (FC=0·97, P=0·05) (Fig. 2 and Table 2).
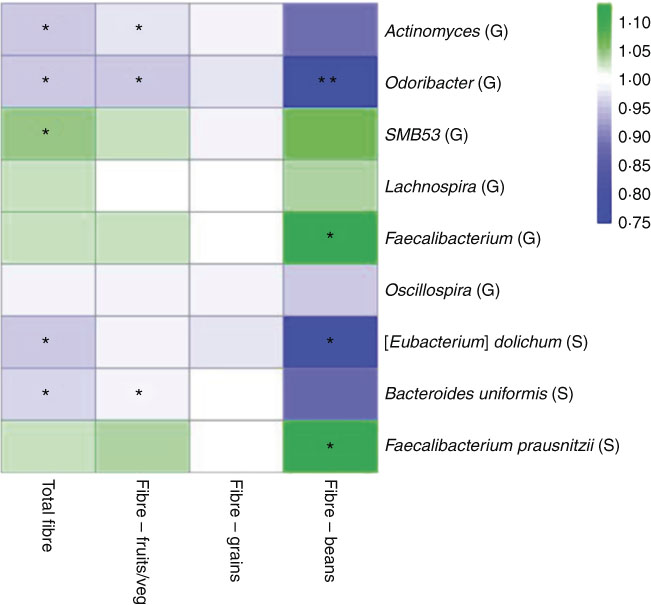
In a sub-analysis to identify associations between taxon abundance and fibre intake from specific dietary sources, we found that higher fibre intake from fruit and vegetables was associated with lower abundance of genera Actinomyces (FC=0·97, P=0·007), Odoribacter (FC=0·96, P=0·04) and Oscillospira (FC=0·99, P=0·06). Higher abundance of genus Faecalibacterium was most significant specifically with higher fibre intake from beans (FC=1·11, P=0·01). At the species level, higher fibre intake from beans was associated with higher abundance of F. prausnitzii (FC=1·11, P=0·01) and lower abundance of B. uniformis (FC=0·87, P=0·08). A heat map representing colour-coded FC of select genera and species, by total fibre and fibre from specific sources (fruits/vegetables, grains and beans), is presented in Fig. 3. Among fibre from different food sources, there was a minimal association between fibre from grains and these specific genera and species.
Heat map representing colour-coded fold changes of select genera (G) and species (S), by total fibre and fibre from specific sources (fruits/vegetables, grains, and beans). * P<0·05 and ** P<0·001 in the meta-analysis of the National Cancer Institute and New York University study populations.
Although we observed similar associations with taxon abundance and fibre intake in both the NCI and NYU studies, we also noted some inconsistent associations (online Supplementary Table S1). For example, at the phylum level, higher total fibre intake was associated with higher abundance of Proteobacteria in NCI (P=0·03) but not in NYU (P=0·53). Higher total fibre intake was also marginally associated with higher abundance of phylum Bacteroidetes in NYU (P=0·07), but not in NCI (P=0·47).
Full results of the meta-analyses examining the association between taxon abundance at each level and dietary fibre intake (total fibre and fibre from different food sources) are reported in online Supplementary Tables S1–S4.
Discussion
In the present study, we examined the association of usual dietary fibre intakes with gut microbiota composition in adults from two independent study populations. In a taxonomy-based meta-analysis, we found that higher total fibre intake is associated with specific taxon abundances, including higher abundance of select genera of Clostridia class. Some of these fibre and taxon abundance associations were consistent with specific fibre food sources, such as fruit and vegetables, grains and beans.
The usual dietary intake of participants measured in our study provides additional insight into the potential effect of longer-term dietary patterns on gut microbiota composition, compared with controlled dietary intervention studies( Reference O’Keefe, Li and Lahti 12 , Reference Tap, Furet and Bensaada 13 ). Although Wu et al.( Reference Wu, Chen and Hoffmann 15 ) demonstrated in a controlled feeding study that certain dietary modifications altered microbiome composition in humans, they did not significantly alter the overall types of microbial communities characterising individuals; the overall structure may be better correlated with long-term diet. Sonnenburg et al.( Reference Sonnenburg, Smits and Tikhonov 32 ) also reported that chronic low-fibre diets in mice may drive changes in microbial diversity. Thus, our study associations derived from long-term dietary habits are more likely to represent microbial composition in an uncontrolled, real-world setting.
We found that higher fibre intake was associated with higher abundance of select genera of Clostridia class. This finding is notable given the particular role of Clostridium spp. in colonocyte metabolism through production of SCFA, including acetate, propionate and butyrate, via fermentation( Reference Liu, Wang and He 33 ). Although butyrate is the least abundant SCFA produced, it serves as the preferred energy source for colonocytes and has garnered attention for its involvement in cell signalling, maintenance of intestinal barrier function and modulation of immune cell chemotaxis and adhesion( Reference Liu, Wang and He 33 – Reference Meijer, de Vos and Priebe 37 ). Butyrate exerts an anti-inflammatory effect through inhibition of inflammatory cytokines, particularly NF-κB( Reference Aguilar, Leonel and Teixeira 38 ). Furthermore, mouse models have shown that butyrate inhibits histone deacetylases and consequently inhibits gene expression and causes tumour suppression( Reference Donohoe, Holley and Collins 11 , Reference Donohoe, Collins and Wali 39 ), carrying implications for colorectal cancer treatment.
Within the Clostridia class, we noted a marginal association between higher fibre intake and higher abundance of species F. prausnitzii. The fibre and F. prausnitzii relationship has also been observed in a cross-sectional cohort of middle-age and older adults in Spain, in which greater adherence to a Mediterranean diet, rich in higher fibre content foods such as fruits, vegetables and whole grains, correlated with higher levels of F. prausnitzii, as well as Clostridium cluster XVIa( Reference Gutierrez-Diaz, Fernandez-Navarro and Salazar 40 ). Faecalibacterium prausnitzii, one of the most abundant species found in the gut and a key producer of butyrate, has been associated with anti-inflammatory activity( Reference Arumugam, Raes and Pelletier 41 – Reference Sokol, Pigneur and Watterlot 43 ). Sokol et al. ( Reference Sokol, Pigneur and Watterlot 43 ) suggested that it exerts its anti-inflammatory effects on colitis mouse models, partly owing to associated metabolites blocking production of the pro-inflammatory molecules, NF-κB and IL-8. Moreover, a reduction in F. prausnitzii was associated with a higher risk of recurrence of Crohn’s disease in patients post resection. In addition to inflammatory bowel disease, Lopez-Siles et al.( Reference Lopez-Siles, Martinez-Medina and Suris-Valls 44 ) reported that lower levels of F. prausnitzii were also found in patients with colorectal cancer compared with healthy controls. Thus, these results suggest a potential therapeutic and preventive role of F. prausnitzii in countering microbial dysbiosis in human disease. Our finding of higher abundance of F. prausnitzii particularly with higher fibre intake from beans lends support to future investigation of specific diet modifications that could affect disease states.
We also observed that higher fibre intake was associated with lower abundance of genera Odoribacter, Actinomyces and Oscillospira, and higher abundance of genus Lachnospira. In mouse models, Zackular et al.( Reference Zackular, Baxter and Iverson 45 ) reported significant microbial shifts found within stool samples of mice with colon tumours, specifically with enrichment of taxa affiliated with members of Odoribacter. Along similar lines, Thomas et al.( Reference Thomas, Jesus and Lopes 46 ) examined human tissue samples collected during colonoscopy from rectal cancer cases and non-cancer controls, and noted higher abundance of Odoribacter in the cancer cases. Kasai et al.( Reference Kasai, Sugimoto and Moritani 47 ) noted higher proportions of several genera, including Actinomyces, in faecal samples from human subjects with colorectal carcinoma. Furthermore, higher abundance of Actinomyces has been reported in both colorectal adenoma and carcinoma cases( Reference Peters, Dominianni and Shapiro 16 , Reference Kasai, Sugimoto and Moritani 47 ). Whether or not enrichment or depletion of these specific microbes reflects cause or consequence of colon tumour development remains uncertain. Nonetheless, the opposite relationship observed between abundance of these microbes and higher fibre intake in our tumour-free adult population compared with cancer cases in prior studies is notable, and merits further examination of diet, microbiota and disease associations.
Similarly, we previously reported an association between lower abundance of Clostridia and both colorectal carcinoma and adenoma( Reference Ahn, Sinha and Pei 6 , Reference Peters, Dominianni and Shapiro 16 ). In a case–control study of colorectal cancer cases and controls, stool samples from colorectal cancer cases were characterised by depletion of phylum Firmicutes, predominantly of class Clostridia, relative to controls( Reference Ahn, Sinha and Pei 6 ). In addition, we noted a depleted abundance of members of Clostridia class in stool samples of colorectal adenoma cases, compared with controls( Reference Peters, Dominianni and Shapiro 16 ). These findings suggest a potential relationship between this shift in Clostridia composition and both pre-cancerous and cancerous events. Thus, our finding that higher dietary fibre intake is associated with a higher abundance of select genera of Clostridia class encourages future investigation of specific dietary strategies and their potential protective role against colorectal cancer risk.
Our results are consistent with our previous report of dietary fibre intake and gut microbiota relationships in the NCI study( Reference Dominianni, Sinha and Goedert 48 ). Our prior analysis of these data showed higher relative abundance of Clostridia class with higher fibre from fruit and vegetable intake, as well as higher relative abundance of phylum Actinobacteria with higher fibre from bean intake. In the present meta-analysis, we confirmed a higher abundance of select genera of Clostridia class with fibre from fruit and vegetables, and a higher abundance of phylum Actinobacteria with fibre from bean intake (online Supplementary Tables S2 and S4). Differences in reported findings between these two studies may be attributed to different statistical methods. Whereas our prior study categorised taxon abundance as a binary variable, in the present study we analysed taxon abundance as a continuous variable in the DESeq2 model, which may increase statistical power.
We note the use of different sequencing platforms for the NCI and NYU studies. As described previously, amplicons in NCI were sequenced using the 454 Roche FLX Titanium pyrosequencing system, whereas the Illumina MiSeq platform was used in NYU. Certain differences in read lengths and error rates have been reported among these two sequencing platforms( Reference Liu, Li and Li 49 ). Nonetheless, comparison of these two platforms in gut microbiome samples by Allali et al.( Reference Allali, Arnold and Roach 50 ) has demonstrated that, although there may be some differences in abundance of specific taxa, similar microbiome compositional profiles were still obtained, and similar biological conclusions could therefore be drawn across both platforms. In addition, we maintained a similar system of sequence data processing using the QIIME pipeline across both of our studies, to ensure consistency in analysis.
Several potential limitations also need to be considered. Measurement error is an inherent limitation in self-reported dietary assessment. Given that the NCI and NYU studies were independent investigations conducted during different time periods, dietary questionnaires utilised differed between studies, which probably contributed to noted differences in quantity of fibre intake in the two cohorts. For this reason, we used study-specific quartile trends of higher fibre intake to evaluate relationships with global microbial diversity and specific taxon abundance. Subjects in both study cohorts were mostly white, and thus our findings may not be generalisable to more racially diverse populations. The cross-sectional design of both studies limits assessment of the temporality of the diet–microbiota relationship. Furthermore, we lacked data in our study cohorts regarding faecal metabolites. Nonetheless, strengths of this study include the relatively large sample size, excellent quality control of microbiome assays in both studies and adjustment for potential confounders. Furthermore, our study hypothesis was tested in two independent study populations, and our meta-analysis findings identified similar taxon abundance associations across both populations.
In summary, we found that fibre intake was associated with gut microbiota composition in generally healthy adults. Fibre from specific food sources may also yield differential effects on gut microbiota. In our analysis, greater fibre intake, particularly from beans, tended to be associated with greater abundance of putatively beneficial bacteria, such as F. prausnitzii, which has demonstrated anti-inflammatory activity. Fibre intake has generally been acknowledged as beneficial in relation to human diseases, such as cancer, and recommendations for sufficient intake have been promoted by the United States Department of Agriculture( Reference Fungwe, Bente and Hiza 51 ). However, there remains a substantial gap in understanding the complex interplay between specific dietary fibre sources, gut microbiota and disease state. Consequently, further investigation is warranted to study microbiota-targeted dietary interventions in both a therapeutic and preventive disease setting. Given the mounting evidence that microbial dysbiosis may affect human health and contribute to the development of colorectal cancer, it is imperative to better elucidate the association of diet–microbiota inter-relationships and their potential impact on colorectal cancer risk. A deeper understanding of diet and the gut microbiome may lay the groundwork needed for future study of diet–microbiota-based colorectal cancer prevention strategies.
Acknowledgements
Research reported in this publication was supported in part by the US National Cancer Institute under award numbers U01CA182370, R01CA164964, R03 159414 and P30CA016087. The content is solely the responsibility of the authors and does not necessarily represent the official views of the National Institutes of Health, the US Department of Veterans Affairs or the United States Government. The National Cancer Institute had no role in the design, analysis or writing of this article.
D. L., B. A. P., R. B. H. and J. A. designed the research, conducted the study, analysed the data, performed statistical analyses and wrote the first draft of the manuscript. C. F., H. J. F., M. A. B., R. S., J. J. G., R. B. H. and J. A. provided reagents or essential materials. J. A. had primary responsibility for final content. All authors critically revised and approved the final manuscript.
The authors declare that there are no conflicts of interest.
Supplementary material
For supplementary material/s referred to in this article, please visit https://doi.org/10.1017/S0007114518002465


