





Non-technical Summary
For millions of years, South America was isolated from other continents, which allowed for the development of a unique native fauna. One of the most intriguing groups was the Macraucheniidae, hoofed animals that went extinct at the end of the last ice age. Our goal was to understand how the body size of these mammals changed over the lineage’s 27 million years of existence and which factors influenced these changes. To do this, we calculated the weight of 15 different genera within this family and investigated whether their evolutionary history had an impact on the size they reached. We discovered that all genera consisted of large-bodied animals, classified as megafauna (mammals weighing more than 44 kg). Our analyses showed that their body weight increased gradually over time and that there was a link between global cooling and an increase in their size. We concluded that the climate changes recorded over the last 27 million years were a crucial factor in determining the body size of these animals, especially the last representatives of the lineage, which grew to weigh nearly a ton.
Introduction
The family Macraucheniidae belongs to the Litopterna, a group of South American native ungulates (SANUs), whose first known member was Macrauchenia patachonica, described by Owen (Reference Owen and Darwin1838) based on fossils discovered by Darwin in a cliff at Port St. Julian, Santa Cruz Province, on the coast of southern Patagonia, Argentina. The most widely accepted hypothesis regarding their phylogenetic relationships with other placental mammals indicates that, together with Notoungulata, they form part of the clade Pan-Perissodactyla, which also includes horses, tapirs, and rhinoceroses (Welker et al. Reference Welker, Collins, Thomas, Wadsley, Brace, Cappellini and Turvey2015; Westbury et al. Reference Westbury, Baleka, Barlow, Hartmann, Paijmans, Kramarz and Forasiepi2017; Croft et al. Reference Croft, Gelfo and López2020). Currently, there are two interpretations regarding the temporal range of this family, depending on its taxonomic composition. The first proposes a temporal range for Macraucheniidae from the late Oligocene to the Late Pleistocene/Holocene (Lobo et al. Reference Lobo, Gelfo and Azevedo2024). The second considers Polymorphis lechei, a species from the late Eocene, to be the earliest occurrence of the clade, thereby extending the temporal range at its base (Ameghino Reference Ameghino1904; Soria Reference Soria1982; Cifelli Reference Cifelli1983; McGrath et al. Reference McGrath, Anaya and Croft2018; Püschel et al. Reference Püschel, Shelley, Williamson, Perini, Wible and Brusatte2024). These competing proposals impose a relatively distinct morphological delimitation for the lineage. The proposal supported by Püschel et al. (Reference Püschel, Shelley, Williamson, Perini, Wible and Brusatte2024) characterizes Macraucheniidae broadly, extending it to a group of small- to large-sized ungulates that also exhibit bunolophodont dentition, characteristics associated with P. lechei. In contrast, the more restricted delimitation, proposed by Lobo et al. (Reference Lobo, Gelfo and Azevedo2024), which we follow here, excludes P. lechei from the Macraucheniidae and considers them to be a group of medium- to large-sized ungulates with tridactyl feet, lophodont dentition, and a dental formula of 3/3, 1/1, 4/4, 3/3. The phylogenetic framework we follow recovers Cramaucheniinae and Macraucheniinae as monophyletic, placing Theosodon within the former, and implying parallel cranial evolution in both subfamilies. In contrast to traditional views—where Theosodon represents an intermediate stage leading to the fully retracted dorsal nostril of Macrauchenia—Lobo et al. (Reference Lobo, Gelfo and Azevedo2024) suggested that nostril retraction evolved independently in each subfamily and to different degrees. Accordingly, the distinctive dorsal nostril morphology of Macrauchenia is better interpreted under a punctuated equilibrium model (Gould and Eldredge Reference Gould and Eldredge1993).
The understanding of body mass or body size in macraucheniids is linked to osteological measurements comparisons, thus leading to the characterization of this family as comprising ungulates ranging from medium to large in size (e.g., Paula-Couto Reference Paula-Couto1979; Croft et al. Reference Croft, Gelfo and López2020). Furthermore, over the last two decades, studies have proposed body-mass estimates for individual taxa or small sets of taxa within the family (Fariña et al. Reference Fariña, Vizcaíno and Bargo1998; Cassini et al. 2012a,b; Vizcaíno et al. Reference Vizcaíno, Cassini, Toledo, Bargo, Patterson and Costa2012; Forasiepi et al. Reference Forasiepi, MacPhee, del Pino, Schmidt, Amson and Grohé2016; McGrath et al. Reference McGrath, Anaya and Croft2018; Dantas Reference Dantas2022; Püschel et al. Reference Püschel, Alarcón‑Muñoz, Soto‑Acuña, Ugalde, Shelley and Brusatte2023; Lorente et al. Reference Lorente, Schmidt and Croft2025). Some of these studies produced mass estimates as part of the description of new materials for a given taxon (e.g., Forasiepi et al. Reference Forasiepi, MacPhee, del Pino, Schmidt, Amson and Grohé2016; McGrath et al. Reference McGrath, Anaya and Croft2018) and were not aimed at a general understanding of changes in this trait within the lineage. Moreover, these aforementioned studies provide estimates based on diverse methods, which results in a mosaic scenario, as each taxon had its body mass estimated using a different approach, and not all Macraucheniidae taxa have available data. This consequently hinders a comprehensive understanding of body-mass evolution in Macraucheniidae.
Phylogenetic comparative methods (PCMs) comprise a set of analytical approaches that allow researchers to understand which evolutionary process is most likely acting upon a given trait (Paradis Reference Paradis and Garamszegi2014). There are two interconnected objectives when using PCMs to study trait evolution. The first involves assessing the timing and mode of trait evolution throughout phylogenetic diversification, and the second focuses on evaluating the relationship between traits themselves and with the environment (Cornwell and Nakagawa Reference Cornwell and Nakagawa2017). However, in comparative analyses aimed at reconstructing macroevolutionary scenarios, PCMs explicitly account for phylogenetic relatedness as a potential source of correlation structure in the data. This arises because sister species or lineages share a common evolutionary history, which can affect the state of the trait under study (Felsenstein Reference Felsenstein1985).
In mammals, one of the traits most commonly examined using PCMs is body mass, which has been investigated across multiple phylogenetic scales: from comparative analyses evaluating body-mass evolution at a high hierarchical level across the entire Mammalia lineage (e.g., Cooper and Purvis Reference Cooper and Purvis2010; Slater Reference Slater2013; Baker et al. Reference Baker, Meade, Pagel and Venditti2015) to more focused studies targeting lower hierarchical levels (e.g., Churchill et al. Reference Churchill, Clementz and Kohno2015; Sanisidro et al. Reference Sanisidro, Mihlbachler and Cantalapiedra2023). Among SANUs, studies evaluating the best model for body-mass evolution are currently limited to the order Notoungulata (Solórzano and Núñez-Flores Reference Solórzano and Núñez-Flores2021). Thus, although several body-mass estimates are available for Macraucheniidae, no hypotheses have yet been proposed to explain how body mass diversified within the lineage or which evolutionary process shaped that change.
In this contribution, we estimate the body mass of the 15 genera assigned to Macraucheniidae and assess which evolutionary hypotheses best explain the diversification of body mass across the lineage during its 27 Myr history. In addition, we examine whether Cenozoic climate change is associated with shifts in body mass within Macraucheniidae.
Materials and Methods
Institutional Abbreviations
MACN: Museo Argentino de Ciencias Naturales “Bernardino Rivadavia,” Buenos Aires, Argentina; MPEF: Museo Paleontológico Egídio Feruglio, Trelew, Argentina; MCL–PUC/MG: Museu de Ciências Naturais da Pontifícia Universidade Católica, Belo Horizonte, Brazil; MLP-PV: División Paleontología de Vertebrados, Museo de La Plata, La Plata, Argentina.
Study Material and Data Analysis
We sampled 86 specimens from 15 genera, representing almost all genera of the Macraucheniidae family (Supplementary Data 1). The dataset consists of linear measurements of skeletal elements. Part of these measurements were taken by L.S.L. at MACN, MCL–PUC/MG, MLP-PV, and MPEF, while the remaining measurements were compiled from the literature: Mercerat (Reference Mercerat1891); Ameghino (Reference Ameghino1904); Scott (Reference Scott1910); Kraglievich and Parodi (Reference Kraglievich and Parodi1931); Soria (Reference Soria1981); Cifelli and Soria (Reference Cifelli and Soria1983); Soria and Hoffstetter (Reference Soria and Hoffstetter1985); Fariña et al. (Reference Fariña, Vizcaíno and Bargo1998); Schmidt and Ferrero (Reference Schmidt and Ferrero2014); Cheme-Arriaga et al. (Reference Cheme-Arriaga, Dozo and Gelfo2016); and McGrath et al. (Reference McGrath, Anaya and Croft2018). It is important to acknowledge the inherent incompleteness of the fossil record, which results in heterogeneous anatomical representation among genera. For instance, the skulls and most postcranial elements of Coniopternium and Cullinia remain unknown, whereas genera such as Theosodon and Macrauchenia are represented by nearly complete skeletons. Consequently, the dataset analyzed here reflects an uneven distribution of predictive information across the family.
We selected univariable predictive equations to include a greater number of predictive models and to ensure that all genera of the family were incorporated in this contribution, given the uneven degree of anatomical knowledge among the representatives of the group described above. Head–body length was not included among the predictors used in this study, although it is a potentially informative proxy for well-preserved taxa and a useful complement to other body-mass estimators (Nelson et al. Reference Nelson, Engelman and Croft2023); however, we did not have the opportunity to obtain such measurements for the present dataset. A total of 49 predictive equations from Damuth (Reference Damuth, Damuth and MacFadden1990), Janis (Reference Janis, Damuth and MacFadden1990), and Scott (Reference Scott, Damuth and MacFadden1990) were selected. These equations were grouped into three anatomical categories: cranial (10 equations), dental (24 equations), and postcranial (15 equations) (see their descriptions in Supplementary Data 2). Although these predictive equations were calibrated on specimen-level datasets, they were applied here to homologous anatomical measurements rather than taxonomic units. Accordingly, all equations were applied to individual specimens, and genus-level body-mass values were obtained by aggregating multiple independent estimates using robust central tendency metrics. This approach reduces the impact of outliers and uneven sampling, which are common in fossil datasets, while ensuring that genera are treated as statistical summaries of specimen-based predictions rather than as direct inputs to the regressions. Consequently, the models are applied within a comparable anatomical framework and remain appropriate for taxa with heterogeneous and incomplete anatomical representation. Although direct validation of prediction ranges is not possible for fossil taxa lacking extant analogues, the use of multiple independent estimators helps mitigate potential departures from the original calibration space. Moreover, because no living relatives are available for direct comparison, the selected predictive equations were applied using the broad ungulate calibration, except for equation (F3), which required the equid calibration, because the third trochanter is absent in Artiodactyla (O’Leary and Gatesy Reference O’Leary and Gatesy2008).
Owing to heterogeneity in the number of equations and specimens across genera, as well as the broad ranges observed in some taxa, the median was selected for the comparative phylogenetic analyses, as it is less sensitive to outliers. This approach has also been adopted in other studies (e.g., Rothier et al. Reference Rothier, Herrel, Benson and Hedrick2025). In addition, the arithmetic mean and a weighted mean were calculated to provide alternative central estimates of genus-specific body mass. The weighted mean was defined to assign greater weight to equations supported by a higher number of observations and lower variability, while reducing the impact of equations based on a few data points and showing high dispersion. To achieve this, the square root of the number of observations (combining taxon and equation) was used, thereby reducing the dominance of overrepresented equations. Additionally, the equation range plus 0.01 was incorporated to penalize equations with high dispersion, while still allowing the inclusion of equations represented by a single estimate. The final formula for the weighted mean is: Final weight = sqrt(n_obs) / (range_eq + 0.01), where sqrt(n_obs) is the square root of the number of observations, and range_eq is the range of the equation. Finally, a box plot was generated for data visualization. All analyses were performed in R v. 4.5.2 (R Core Team 2025) using the following packages: dplyr v. 1.2.1 (Wickham et al. Reference Wickham, François, Henry, Müller and Vaughan2025), ggplot2 v. 4.0.3 (Wickham Reference Wickham2016), and viridis v. 0.6.5 (Garnier et al. Reference Garnier, Ross, Rudis, Camargo, Sciaini and Scherer2024).
Phylogenetic hypotheses and temporal occurrence intervals (first to last appearance dates [FAD–LAD]) for macraucheniid genera were obtained from Lobo et al. (Reference Lobo, Gelfo and Azevedo2024) using the ape v. 5.8.1 R package (Paradis and Schliep Reference Paradis and Schliep2019). The phylogeny adopted here corresponds to the hypothesis of Lobo et al. (Reference Lobo, Gelfo and Azevedo2024), based on an implied-weights analysis with a concavity constant k = 6. Terminal taxa were time calibrated using uniform distributions between their FAD and LAD, and node ages were estimated using the paleotree v. 3.4.7 R package (Bapst Reference Bapst2012) to account for stratigraphic uncertainty. Paleo-temperature data were obtained from Hansen et al. (Reference Hansen, Sato, Russell and Kharecha2013), a database providing global temperature estimates (°C) and their corresponding reliability weights for Cenozoic intervals. For each genus, a weighted mean temperature was calculated using Hansen et al.’s (Reference Hansen, Sato, Russell and Kharecha2013) weight values, restricted to data within the taxon’s temporal range (between its FAD and LAD). This approach approximates the average climatic conditions experienced by each taxon while reducing the impact of anomalous temperature spikes, as isolated extreme values contribute little when assigned low weights. Moreover, the broad temporal windows of older taxa also further smoothed short-term fluctuations.
Phylogenetic signal in body mass was evaluated by estimating Pagel’s λ using the phytools v. 2.5.2 R package (Revell Reference Revell2023). To identify the best-fitting evolutionary model for body-mass evolution in Macraucheniidae, we compared five models: pure Brownian Motion (BM; tested via λ), Early Burst (EB), Kappa, Brownian Motion with directional trend (BMT), and Ornstein-Uhlenbeck (OU) using the geiger v. 2.0.11 R package (Pennell et al. Reference Pennell, Eastman, Slater, Brown, Uyeda, Fitzjohn, Alfaro and Harmon2014). Model selection was based on Akaike information criterion (AICc)/Akaike information criterion weight (AICw) values. Ancestral body-mass states were subsequently reconstructed with anc.trend (BMT model, phytools) to produce a phenogram illustrating node reconstructions alongside terminal taxa across the geological time.
Evolutionary rates of body mass were estimated using RRphylo package 3.0.2 (Castiglione et al. Reference Castiglione, Tesone, Piccolo, Melchionna, Mondanaro, Serio, Febbraro and Raia2018) using phylogenetic ridge regression, and the significance of accelerations and decelerations in rates was assessed with search.shift. Branch-specific rates were extracted using standard (RRphylo$rates) and shift-adjusted regimes (RRphylo$multiple.rates), when significant shifts occurred. To evaluate differences in evolutionary dynamics between Cramaucheniinae and Macraucheniinae, a permutation test (999 iterations) was performed to assess whether they exhibit distinct body-mass regimes.
Given that the directional evolution model provided the best fit according to AIC/AICw criteria, we tested whether changes in body mass were correlated with environmental variation, specifically climate change over the past 30 Myr. Ordinary least squares (OLS) and phylogenetic generalized least squares (PGLS) regressions were performed, with temperature (°C) as the independent variable and log-transformed body mass as the dependent variable. Two PGLS models were fit by varying the λ parameter: (1) PGLS with an estimated λ and (2) PGLS with λ = 1, representing a pure Brownian motion model. Model selection was performed using the sample size–corrected Akaike information criterion (AICc), and model comparison assessed whether the mass–temperature relationship is better explained within a phylogenetic framework (PGLS) or a non-phylogenetic framework (OLS), using the caper v. 1.0.4 R package (Orme et al. Reference Orme, Freckleton, Thomas, Petzoldt, Fritz, Isaac and Pearse2023).
Results
Body-mass estimates for macraucheniids reveal a wide size range across the family’s fossil record, spanning from approximately 27 Ma to 11 ka. The data reflect substantial variation both within and among genera, likely capturing a combination of intra- and interspecific differences as well as methodological and sampling heterogeneity (see Fig. 1, Table 1). Despite this variability, a clear pattern emerges: the two subfamilies within Macraucheniidae exhibit distinct differences in body size. A temporal overlap is observed between the late Cramaucheniinae lineage, represented by Theosodon, and the early Macraucheniinae, represented by Llullataruca. Overall, Cramaucheniinae, comprising four genera, shows median-based estimates ranging from 63.5 kg (Coniopternium) to 198.6 kg (Theosodon). Macraucheniinae, which includes 11 genera, shows median-based estimates ranging from 73.9 kg (Llullataruca) to 932.3 kg (Macraucheniopsis). Notably, some genera have central estimates based on fewer than 20 individual predictions, including Cullinia, Oxyodontherium, Huayqueriana, and Windhausenia. The source of these measurements and their corresponding predictions are detailed individually in the Supplementary Data 3 to 17.
Box plot showing the central tendencies of body-mass estimations for the genera of Macraucheniidae. The box depicts the interquartile range, the horizontal line indicates the median, and individual points represent outliers. Each taxon is represented by a distinct color. The taxa are arranged chronologically, from oldest (left) to most recent (right), and the same color scheme is used in Fig. 4.

Figure 1. Long description
A box plot with a Y-axis labeled Mass kg logarithmic scale, with major tick marks at 10, 100, and 1000. The X-axis lists 15 genera in chronological order from left to right.
From left to right, the taxa and their approximate median masses are:
* Coniopternium (dark purple): ~60 kg.
* Pternoconius (purple): ~90 kg.
* Cramauchenia (purple): ~70 kg.
* Theosodon (medium purple): ~200 kg.
* Llullataruca (light purple): ~80 kg.
* Cullinia (light purple): ~110 kg.
* Paranauchenia (magenta): ~300 kg.
* Scalabrinitherium (pink): ~200 kg, with one outlier below 100 kg.
* Oxyodontherium (light pink): ~210 kg.
* Huayqueriana (peach): ~380 kg, with one outlier above 1000 kg.
* Promacrauchenia (orange): ~300 kg.
* Windhausenia (light orange): ~600 kg.
* Macraucheniopsis (yellow): ~950 kg.
* Macrauchenia (light yellow): ~750 kg, with two outliers near 100 kg.
* Xenorhinotherium (pale yellow): ~800 kg.
The overall trend shows that earlier genera (left) generally weigh between 50 and 300 kg, while more recent genera (right) cluster between 600 and 1000 kg.
Body-mass estimates, evaluated using log-transformed median values, exhibited a strong phylogenetic signal (Pagel’s λ = 0.9999; likelihood ratio = 14.66; p-value < 0.001). This result indicates that variation in body mass among genera is strongly associated with the family evolutionary history.
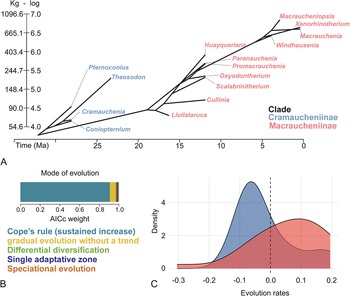
We tested five evolutionary models of trait change: Brownian Motion (BM), Early-Burst (EB), Ornstein-Uhlenbeck (OU), Kappa, and Brownian motion with mean trend (BMMT). Among these, BMMT emerged as the best-fitting and most strongly supported model (see model comparison in Supplementary Data 18). Accordingly, body-mass evolution in Macraucheniidae follows a directional trajectory characterized by a gradual increase through time (drift = 0.109; sigsq = 0.033), a pattern consistent with Cope’s rule (Fig. 2A,B). Under this framework, ancestral-state reconstructions were used to infer the body-mass values at the origin of major lineages. The Macraucheniidae ancestor is estimated to have weighed approximately 43 kg, that of Cramaucheniinae around 51 kg, and that of Macraucheniinae about 85 kg. Additional reconstructions are provided in Supplementary Data 19.
Evolutionary trajectory of macraucheniid body mass. A, Phenogram, generated under a sustained-increase model, illustrating the evolutionary dynamics of body mass in macraucheniids. B, Support of different evolutionary models based on corrected Akaike information criterion (AICc) weights. C, Evolution rates between the two macraucheniid subfamilies.

Figure 2. Long description
Panel A is a phenogram with Time in Ma on the x-axis from 30 to 0 and body mass on the y-axis in Kg and log scale from 54.6 to 1096.6 and 4.0 to 7.0, respectively. A branching tree structure rises from left to right. Blue labels for the Cramaucheniinae clade include Coniopternium, Cramauchenia, Theosodon, and Pternoconius. Red labels for the Macraucheniinae clade include Llullataruca, Cullinia, Scalabrinitherium, Oxyodontherium, Promacrauchenia, Paranauchenia, Huayqueriana, Windhausenia, Macrauchenia, Xenorhinotherium, and Macraucheniopsis.
Panel B is a horizontal stacked bar chart titled Mode of evolution. The x-axis is AICc weight from 0.0 to 1.0. A large blue segment representing Cope’s rule sustained increase dominates the bar from 0 to approximately 0.9. Smaller segments follow: yellow for Gradual evolution without a trend, green for Differential diversification, dark blue for Single adaptive zone, and brown for Speciational evolution.
Panel C is a density plot with Evolution rates on the x-axis from negative 0.3 to 0.2 and Density on the y-axis from 0 to 4. A blue curve representing Cramaucheniinae peaks sharply at a negative evolution rate of approximately negative 0.05. A red curve representing Macraucheniinae is broader and lower, peaking at a positive evolution rate of approximately 0.1. A vertical dashed line marks the 0.0 evolution rate.
The body-mass phenogram (Fig. 2A) highlights noticeable variation in transition rates across genera. Although subfamilies show different rate distributions (Fig. 2C), the difference was not statistically significant (0.065; p = 0.201), indicating that the evolutionary histories of the Cramaucheniinae and Macraucheniinae are not associated with divergent patterns of body-mass evolutionary rates. Only two branches exhibited significant shifts in body-mass evolutionary rates: node 27 (rate difference = −0.044854668; p = 0.033) and node 28 (rate difference = −0.053169514; p = 0.022). These nodes correspond to the end of Macraucheniidae diversification, reflecting increased evolutionary rates for the Plio-Pleistocene taxa Windhausenia, Xenorhinotherium, Macrauchenia, and Macraucheniopsis.
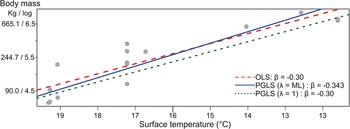
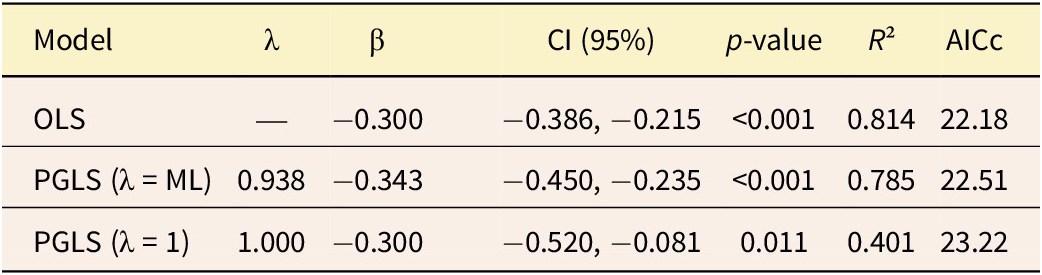
Regression analyses indicate a negative relationship between body mass and temperature across the Macraucheniidae lineage (Fig. 3). This result aligns with the continued increase in body mass within the lineage during the global cooling period of the past 30 Myr. Among the tested models, those with no or minimal phylogenetic information (OLS and PGLS with λ = ML [λ ≈ 0]) showed higher coefficients of determination (R² > 0.75) and better overall fit (lower AICc values). In contrast, the model assuming strong phylogeny dependence (PGLS λ = 1) performed poorly (R² ≈ 0.40; higher AICc). Consequently, the OLS model was identified as the most parsimonious approach for describing this relationship (Table 2). These results support the hypothesis that temperature acted as a key ecological driver shaping body-mass evolution in Macraucheniidae.
Relation between mean temperature (°C) and macraucheniid body mass (kg). Each dot represents a genus, and each line depicts a fitted model; the model parameters are provided in Table 2. OLS, ordinary least squares; PGLS, phylogenetic generalized least squares.

Figure 3. Long description
The X axis represents Surface temperature in degrees Celsius, with values decreasing from left to right from 19 to 13. The Y axis represents Body mass in kilograms and log scale, with three marked intervals: 90.0 / 4.5, 244.7 / 5.5, and 665.1 / 6.5.
Data points are represented by grey dots. A cluster of dots is located at the far left between 19 and 18.5 degrees Celsius with lower body mass. A vertical cluster appears around 17.2 degrees Celsius, spanning from 4.7 to 5.9 on the log scale. Three individual dots are located at the right side of the graph at approximately 14, 12.5, and 12 degrees Celsius, showing higher body mass.
Three fitted models are shown as lines trending upward from left to right, indicating that as temperature decreases, body mass increases:
* A red dashed line for OLS where beta equals negative 0.30.
* A solid blue line for PGLS lambda equals ML where beta equals negative 0.343.
* A green dotted line for PGLS lambda equals 1 where beta equals negative 0.30.
Discussion
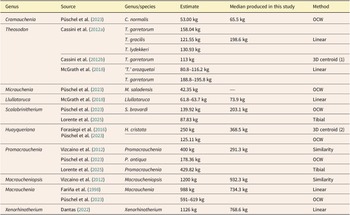
The body-mass estimates presented in this study characterize the Macraucheniidae family as consisting of mammals exceeding 44 kg, classifying them as megafauna according to the definition followed by Barnosky et al. (Reference Barnosky, Lindsey, Villavicencio, Bostelmann, Hadly, Wanket and Marshall2016). These estimates are derived from univariate linear measurement equations applied to nearly all genera within the family. The two subfamilies exhibit distinct body-mass ranges: Cramaucheniinae, represented by Cramauchenia and Theosodon, show median estimates of 65.5 and 198.6 kg, respectively, whereas Macraucheniinae, represented by Llullataruca and Macraucheniopsis, range from 73.9 to 932.3 kg (see Table 1, Fig. 1). Previous studies have provided point estimates of body mass for certain genera and species of the family. Of the 16 genera currently recognized, 10 have published mass estimates (Fariña et al. Reference Fariña, Vizcaíno and Bargo1998; Cassini et al. Reference Cassini, Cerdeño, Villafañe, Muñoz, Vizcaíno, Kay and Bargo2012a,Reference Cassini, Vizcaíno and Bargob; Vizcaíno et al. Reference Vizcaíno, Cassini, Toledo, Bargo, Patterson and Costa2012; Forasiepi et al. Reference Forasiepi, MacPhee, del Pino, Schmidt, Amson and Grohé2016; McGrath et al. Reference McGrath, Anaya and Croft2018; Dantas Reference Dantas2022; Püschel et al. Reference Püschel, Alarcón‑Muñoz, Soto‑Acuña, Ugalde, Shelley and Brusatte2023; see Table 3).
Summary of the body mass estimations (kg) for Macraucheniidae genera. #Sp, number of specimens; #Eq, equation number; #Est, number of estimates; A mean, arithmetic mean; W mean, weighted mean; M, median

Table 1. Long description
The table contains eight columns: Taxon, #Sp (number of specimens), #Eq (number of equations), #Est (number of estimates), Median, A mean (arithmetic mean), W mean (weighted mean), and Range.
* Coniopternium: 12 #Sp, 27 #Eq, 63 #Est, 63.5 Median, 72.7 A mean, 96.3 W mean, 213.9 Range.
* Pternoconius: 6 #Sp, 23 #Eq, 47 #Est, 93.1 Median, 106.8 A mean, 117.3 W mean, 222.3 Range.
* Cramauchenia: 7 #Sp, 33 #Eq, 79 #Est, 65.5 Median, 90.0 A mean, 133.8 W mean, 403.3 Range.
* Theosodon: 13 #Sp, 46 #Eq, 178 #Est, 198.6 Median, 230.0 A mean, 247.6 W mean, 808.7 Range.
* Llullataruca: 4 #Sp, 21 #Eq, 29 #Est, 73.9 Median, 85.9 A mean, 74.0 W mean, 172.6 Range.
* Cullinia: 1 #Sp, 7 #Eq, 7 #Est, 111.4 Median, 111.9 A mean, 111.9 W mean, 124.7 Range.
* Oxyodontherium: 2 #Sp, 6 #Eq, 12 #Est, 210.2 Median, 216.5 A mean, 197.5 W mean, 272.9 Range.
* Paranauchenia: 3 #Sp, 20 #Eq, 26 #Est, 295.1 Median, 301.4 A mean, 323.5 W mean, 322.6 Range.
* Scalabrinitherium: 8 #Sp, 21 #Eq, 45 #Est, 203.1 Median, 248.0 A mean, 352.5 W mean, 478.0 Range.
* Huayqueriana: 1 #Sp, 8 #Eq, 8 #Est, 368.5 Median, 456.7 A mean, 456.7 W mean, 941.0 Range.
* Promacrauchenia: 7 #Sp, 40 #Eq, 91 #Est, 291.3 Median, 370.2 A mean, 581.5 W mean, 1161.8 Range.
* Windhausenia: 2 #Sp, 16 #Eq, 16 #Est, 614.5 Median, 691.1 A mean, 691.1 W mean, 1274.7 Range.
* Macrauchenia: 10 #Sp, 48 #Eq, 162 #Est, 734.3 Median, 841.5 A mean, 777.7 W mean, 2759.8 Range.
* Xenorhinotherium: 6 #Sp, 42 #Eq, 78 #Est, 768.6 Median, 887.9 A mean, 833.0 W mean, 2473.6 Range.
* Macraucheniopsis: 4 #Sp, 30 #Eq, 61 #Est, 932.3 Median, 1076.4 A mean, 1123.3 W mean, 2353.9 Range.
Comparison of regression models evaluating the relationship between body mass and temperature. Models include ordinary least squares (OLS) and phylogenetic generalized least squares (PGLS) with different phylogenetic signal parameters (λ). ML, maximum likelihood estimation; λ, lambda; β, slope; CI, confidence interval; AICc, Akaike information criterion
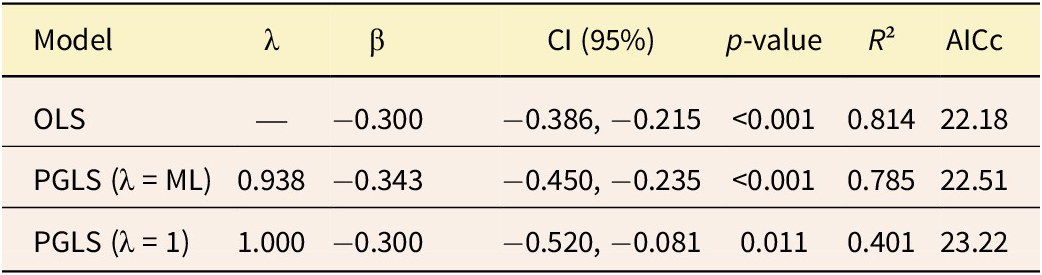
Table 2. Long description
The table consists of seven columns: Model, lambda, beta, CI (95 percent), p-value, R-squared, and AICc.
* Row 1: OLS model. lambda is not applicable. beta is minus 0.300. CI is minus 0.386 to minus 0.215. p-value is less than 0.001. R-squared is 0.814. AICc is 22.18.
* Row 2: PGLS (lambda equals M L) model. lambda is 0.938. beta is minus 0.343. CI is minus 0.450 to minus 0.235. p-value is less than 0.001. R-squared is 0.785. AICc is 22.51.
* Row 3: PGLS (lambda equals 1) model. lambda is 1.000. beta is minus 0.300. CI is minus 0.520 to minus 0.081. p-value is 0.011. R-squared is 0.401. AICc is 23.22.
Comparison of median body mass (kg) estimates for Macraucheniidae genera from this study and previous estimates reported in the literature. The different methods are: OCW: from regression equations of occipital condyle width; Linear: from linear regression equations; 3D centroid (1): from regressions based on centroid size of 3D craniomandibular landmark configurations; Tibial: from allometric equations based on the transverse diameter of the tibial plate; 3D centroid (2): from the centroid size of 36 3D cranial landmarks; Similarity: from geometric similarity
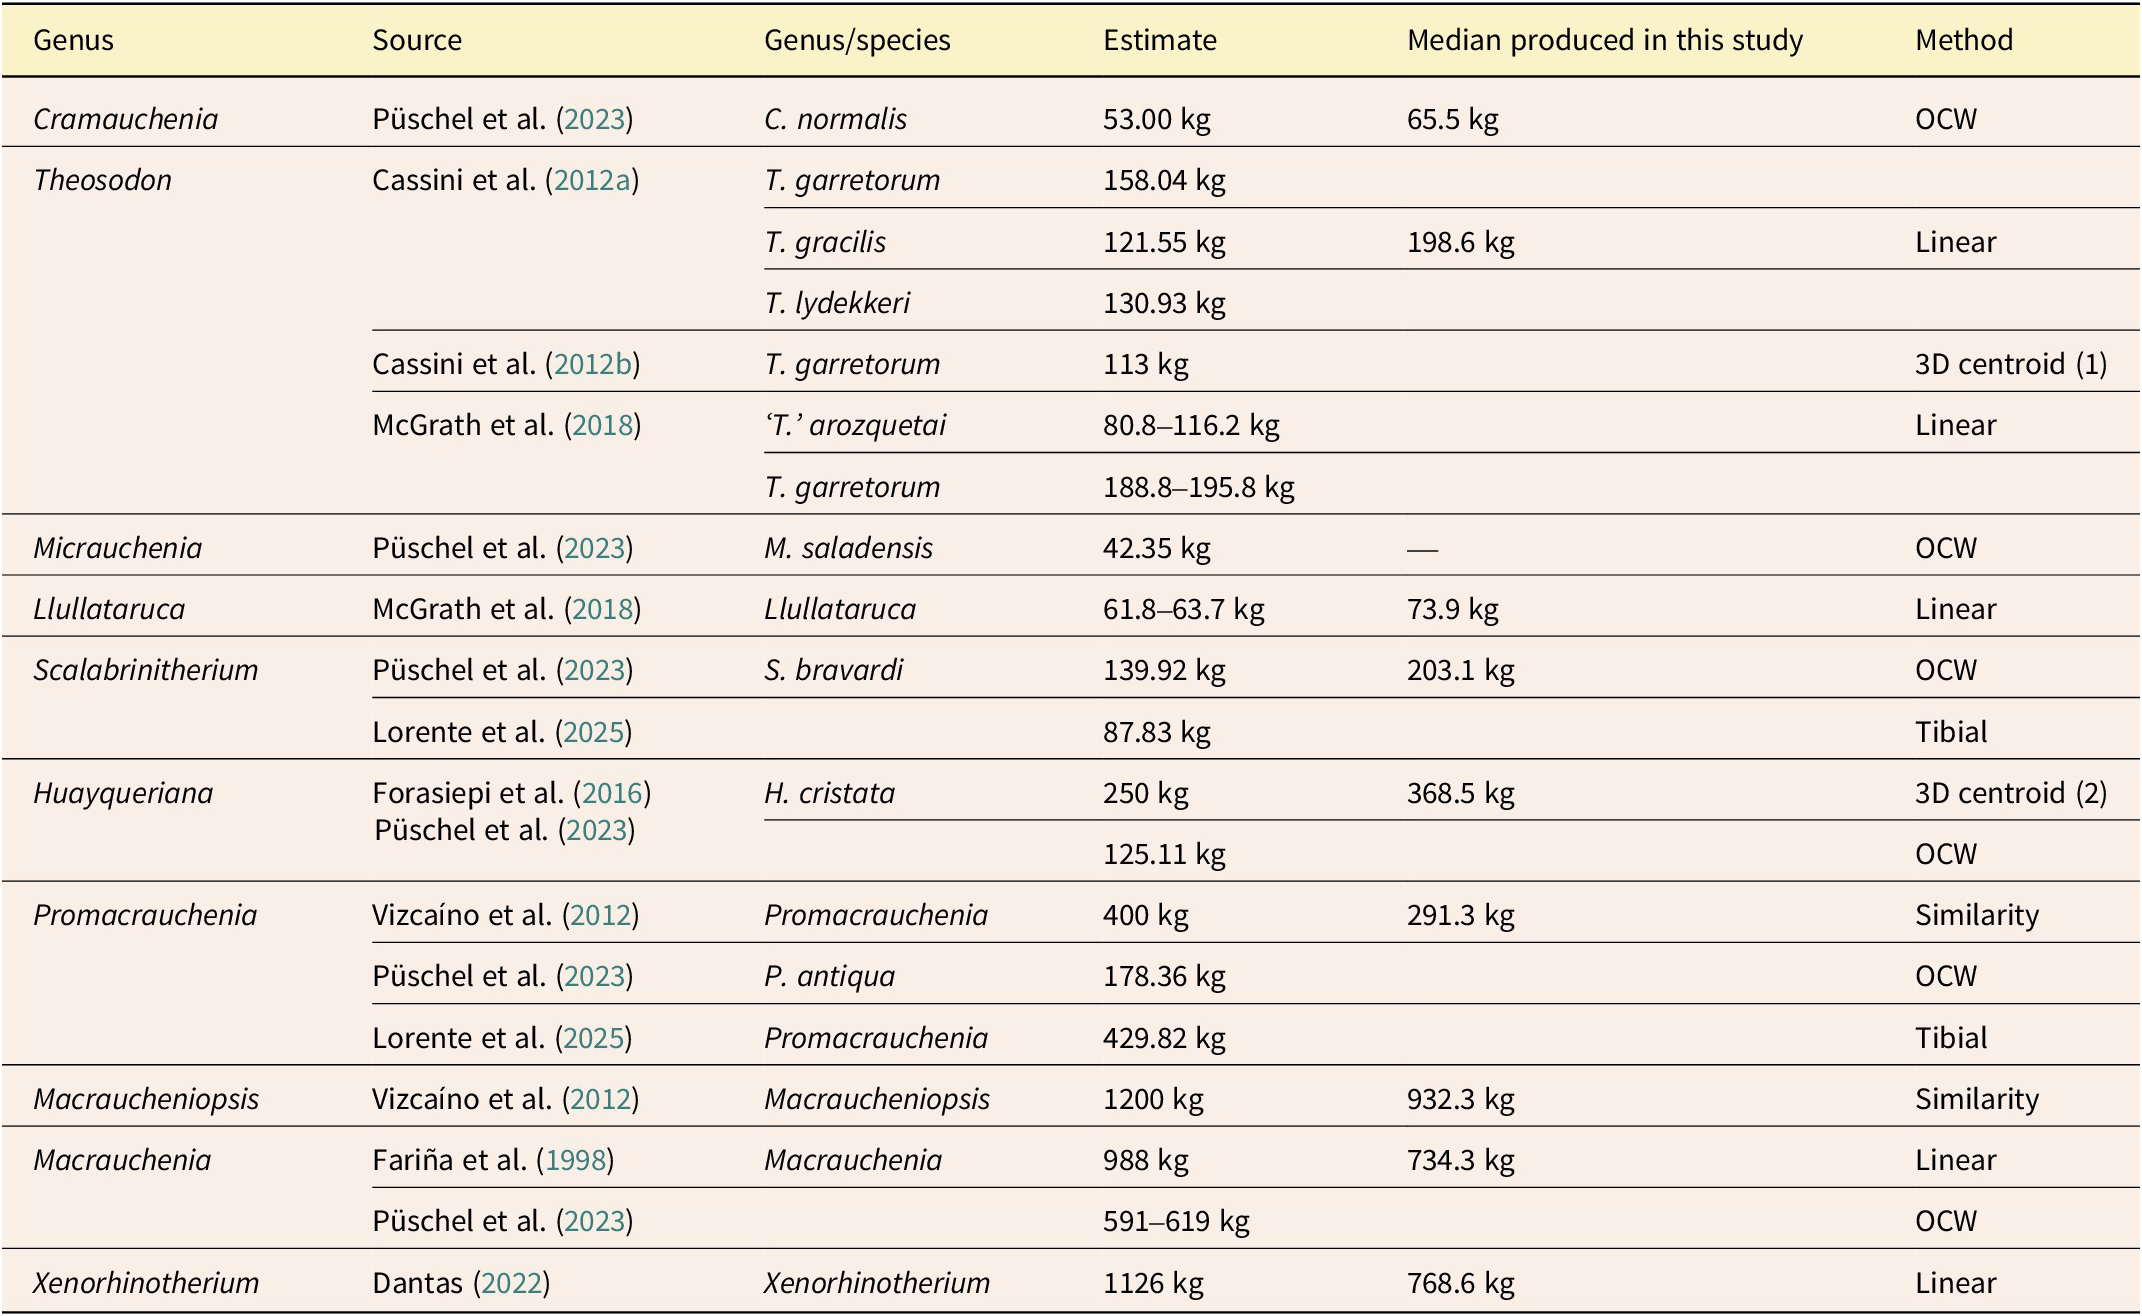
Table 3. Long description
The table contains six columns: Genus, Source, Genus/species, Estimate, Median produced in this study, and Method.
* Cramauchenia: Source Püschel et al. 2023, species C. normalis, estimate 53.00 kg, study median 65.5 kg, method OCW.
* Theosodon: Multiple entries. Cassini et al. 2012a estimates for T. garretorum (158.04 kg), T. gracilis (121.55 kg), and T. lydekkeri (130.93 kg) with a study median of 198.6 kg using Linear method. Cassini et al. 2012b estimate for T. garretorum is 113 kg using 3D centroid 1. McGrath et al. 2018 estimates for ‘T.’ arozquetai (80.8 to 116.2 kg) and T. garretorum (188.8 to 195.8 kg) using Linear method.
* Micrauchenia: Source Püschel et al. 2023, species M. saladensis, estimate 42.35 kg, study median is blank, method OCW.
* Llullataruca: Source McGrath et al. 2018, estimate 61.8 to 63.7 kg, study median 73.9 kg, method Linear.
* Scalabrinitherium: Source Püschel et al. 2023 for S. bravardi (139.92 kg) with study median 203.1 kg via OCW; Lorente et al. 2025 estimate 87.83 kg via Tibial method.
* Huayqueriana: Forasiepi et al. 2016 and Püschel et al. 2023 for H. cristata (250 kg) with study median 368.5 kg via 3D centroid 2; also an OCW estimate of 125.11 kg.
* Promacrauchenia: Vizcaíno et al. 2012 estimate 400 kg with study median 291.3 kg via Similarity; Püschel et al. 2023 estimate 178.36 kg via OCW; Lorente et al. 2025 estimate 429.82 kg via Tibial.
* Macraucheniopsis: Vizcaíno et al. 2012 estimate 1200 kg, study median 932.3 kg, method Similarity.
* Macrauchenia: Fariña et al. 1998 estimate 988 kg, study median 734.3 kg, method Linear; Püschel et al. 2023 estimate 591 to 619 kg via OCW.
* Xenorhinotherium: Dantas Reference Dantas2022 estimate 1126 kg, study median 768.6 kg, method Linear.
The scope of this study did not allow the evaluation of Micrauchenia for two reasons: (1) the incompleteness of the material assigned to this taxon, particularly the absence of dental information, a dataset available for all other genera in the family; and (2) the lack of precise phylogenetic placement for comparative phylogenetic analyses, as the proposed phylogeny by Püschel et al. (Reference Püschel, Alarcón‑Muñoz, Soto‑Acuña, Ugalde, Shelley and Brusatte2023) contains large polytomies. If Micrauchenia is assigned to Macraucheniinae, and the estimate suggested by the authors, which aims to minimize the influence of unusual proportions, is used, this genus would be the smallest Macraucheniinae, rather than Llullataruca. Although in the case of Micrauchenia, the need for additional material, particularly dental and cranial elements, limits a detailed characterization of body mass in Macraucheniidae, other taxa also require thorough reassessment to achieve a comprehensive understanding of the family. The genus Theosodon, like others, was treated as a single unit. It currently comprises 10 species, in contrast with the mostly monospecific nature of other Macraucheniidae genera, underscoring the need for a deep taxonomic analysis and revision as already noted by several authors (e.g., Cifelli and Guerrero Reference Cifelli, Guerrero, Kay, Madden, Cifelli and Flynn1997; Schmidt and Ferrero Reference Schmidt and Ferrero2014; McGrath et al. Reference McGrath, Anaya and Croft2018; Lobo et al. Reference Lobo, Gelfo and Azevedo2024). This revision would also provide a sound basis for subsequent phylogenetic analysis aimed at clarifying body-mass evolution in the last representatives of Cramaucheniinae.
Among the previously proposed body-mass estimates for the genera within the family, our results tend to be generally higher. Previously published estimates are largely based on species-level data; in monotypic genera, these can be directly interpreted at the genus level, whereas in non-monotypic genera, they are treated as comparative references. In total, four of the nine genera with previously published body-mass estimates exhibit masses between 20% and 40% larger: Cramauchenia, Llullataruca, Scalabrinitherium, and Huayqueriana. In contrast, two genera yielded body-mass estimates approximately 20% to 25% lower: Macraucheniopsis and Xenorhinotherium. The remaining three genera (Theosodon, Promacrauchenia, Macrauchenia) showed estimates that were either higher or lower than those obtained in this study, depending on the species or previous work. For Theosodon, estimates exist for different species; for example, T. garretorum yielded values close to our estimate for the genus as a whole. The estimates proposed by Püschel et al. (Reference Püschel, Alarcón‑Muñoz, Soto‑Acuña, Ugalde, Shelley and Brusatte2023), based on the occipital condyle width, were substantially lower than ours for Scalabrinitherium, Huayqueriana, Promacrauchenia, and Macrauchenia, as well as lower than those reported in other studies (Fariña et al. Reference Fariña, Vizcaíno and Bargo1998; Vizcaíno et al. Reference Vizcaíno, Cassini, Toledo, Bargo, Patterson and Costa2012; Forasiepi et al. Reference Forasiepi, MacPhee, del Pino, Schmidt, Amson and Grohé2016).
The body-mass evolution of Macraucheniidae is best explained by Cope’s or Depéret’s rule, which indicates a tendency for size increase (Bokma et al. Reference Bokma, Godinot, Maridet, Ladevèze, Costeur, Solé, Gheerbrant, Peigné, Jacques and Laurin2016). This increase in body mass has traditionally been interpreted as a gradual process occurring within established species in an anagenetic context driven by natural selection. This represents one of the most widely observed evolutionary patterns, frequently proposed for body-mass evolution in higher-level taxa such as mammals (Stanley Reference Stanley1973; Alroy Reference Alroy1998). Alternatively, trends in body-size variation have been linked to the emergence of new species, associating such phenomena with cladogenetic events and indicating it is related to punctuated equilibrium (Eldredge and Gould Reference Eldredge, Gould and Schopf1972; Gould and Eldredge Reference Gould and Eldredge1993; Gould Reference Gould2002). It has been postulated that both morphological and taxonomic diversification in mammals occurred hierarchically, with major shifts in body size coinciding with the origin of large clades, followed by subsequent taxonomic diversification within these emerging groups (Raia et al. Reference Raia, Carotenuto, Passaro, Fulgione and Fortelius2012, Reference Raia, Carotenuto, Passaro, Piras, Fulgione, Werdelin, Saarinen and Fortelius2013). Particularly at the family level, alternative evolutionary models may better reflect the specific history of each lineage. Examples include the speciational model (Kappa), wherein changes occur during speciation events in a punctuated or cladogenetic manner (e.g., Mattila and Bokma Reference Mattila and Bokma2008), as observed in Brontotheriidae (Sansidro et al. 2023); adaptive punctuated evolution, as seen in Notoungulata (Solórzano and Núñez-Flores, Reference Solórzano and Núñez-Flores2021); or passive and random evolution, as observed in Pinnipedimorpha (Churchill et al. Reference Churchill, Clementz and Kohno2015).
The trend of gradual mass increase, as indicated by the best fit of the BMMT model, shows distinct evolutionary rates throughout the family’s diversification while maintaining the overall trend. Nevertheless, some deviations occur: for instance, the genus Llullataruca exhibits a lower estimate than its ancestral node (84 kg), marking a reversal in the trend. Furthermore, at a species-level resolution, the Quebrada Honda locality, the type locality of Llullataruca, records not only the smallest Macraucheniinae but also a species of Theosodon, ‘T.’ arozquetai, which also shows a low mass estimate compared with T. garretorum (McGrath et al. Reference McGrath, Anaya and Croft2018). This could reflect a response to a specific local environmental regime, emphasizing the need for further detailed studies of the Quebrada Honda fauna. Indeed, in the context of warmer global climates during the mid-Miocene climatic optimum (MMCO), Strömberg et al. (Reference Strömberg, Saylor, Engelman, Catena, Hembree, Anaya and Croft2024) interpreted Quebrada Honda as a low-elevation basin occupied by (sub)tropical semi-deciduous/dry forest to wooded savanna vegetation. Consistent with our results, these warmer conditions may be associated with the relatively low body mass of the macraucheniids considered here.
Other significant deviations in the rates of body-mass evolution from the general trend observed by the BMMT parameters are only evident in the late Cenozoic taxa, particularly during the Plio-Pleistocene interval, which records the largest body masses for Macraucheniidae and the lowest temperatures of the last 27 Myr (Hansen et al. Reference Hansen, Sato, Russell and Kharecha2013; Rae et al. Reference Rae, Zhang, Liu, Foster, Stoll and Whiteford2021; Hösinch et al. Reference Hösinch, Royer, Breecker, Bowen, Polissar and Ridgwell2023).
Using the four categories proposed by Vizcaíno et al. (Reference Vizcaíno, Cassini, Toledo, Bargo, Patterson and Costa2012)—(I) <100 kg, (II) 100–500 kg, (III) 500–1000 kg, and (IV) >1000 kg—and considering the median for body-mass categorization of extinct South American mammals, we observe an expansion of taxa into these categories. Category I includes four representatives, three from the late Oligocene (Deseadan South American Land Mammal Age, SALMA) and one from the middle Miocene (five if Micrauchenia is also included). Seven representatives fall into category II, with one from the early–middle Miocene and the remainder from the late Miocene. Category III comprises four members, one from the late Pliocene–early Pleistocene, one from the middle Pleistocene (Lujanian SALMA), and two from the Late Pleistocene–Holocene (Lujanian SALMA). According to the median estimates presented here, the body mass of Macraucheniidae is limited to approximately 900 kg, represented by Macraucheniopsis. It does not reach category IV as defined by Vizcaíno et al. (Reference Vizcaíno, Cassini, Toledo, Bargo, Patterson and Costa2012), but remains close to the threshold. However, values above the median would place Macraucheniopsis within this category, and considering the highest inferred values (Supplementary Data 3 to 17), the Plio-Pleistocene taxa Windhausenia, Macrauchenia, and Xenorhinotherium could also be included.
Here, we demonstrated that within Macraucheniidae, the gradual increase in body mass is significantly correlated with documented climatic changes. Following this hypothesis, these changes may reflect a physiological response of the lineage to climatic fluctuations occurring between the Oligocene and the Holocene (Hansen et al. Reference Hansen, Sato, Russell and Kharecha2013; Rae et al. Reference Rae, Zhang, Liu, Foster, Stoll and Whiteford2021; Hösinch et al. Reference Hösinch, Royer, Breecker, Bowen, Polissar and Ridgwell2023). Considering that body mass or size, as a trait influenced by temperature, should be appropriately weighted as a phylogenetic character (i.e., it should not be interpreted as indicative of evolutionary relationship), this statement supports our previous proposal (Lobo et al. Reference Lobo, Gelfo and Azevedo2024) to exclude this character from previous morphological matrices. Furthermore, by associating temperature data with the temporal range of Macraucheniidae genera and their respective body masses (see Fig. 4), it is observed that the late Miocene, a period following the sudden temperature increase of the middle Miocene, recorded the greatest diversity of macraucheniids, exclusively represented by Macraucheniinae, which is also reflected in a diversity of body-mass estimates.
Genera of Macraucheniidae with their respective temporal ranges and body-mass estimates over geological time, plotted alongside the land surface temperature curve estimated from the benthic δ18O modified from the synthesis of Hansen et al. (Reference Hansen, Sato, Russell and Kharecha2013). MMCO, mid-Miocene climatic optimum; LCIA, late Cenozoic ice age.

Figure 4. Long description
The top panel is a scatter plot with a dual Y-axis on the left representing body mass in Kg and log scale from 54.6 to 1096.6 and 4.0 to 7.0, respectively. Horizontal bars represent the temporal range of different genera. From top-right moving down and left, genera include Macraucheniopsis, Xenorhinotherium, Windhausenia, and Macrauchenia in the highest mass bracket. Below these are Huayqueriana, Paranauchenia, Promacrauchenia, Oxyodontherium, and Scalabrinitherium. Lower mass ranges include Theosodon, Cullinia, Pternoconius, Llullataruca, Cramauchenia, and Coniopternium.
The middle panel is a geological timescale spanning from the Oligocene through the Miocene, Pliocene, and Pleistocene, with numerical markers from 27.8 to 1.8 million years ago.
The bottom panel is a line graph of Temperature in degrees Celsius on the Y-axis from 09 to 21. A fluctuating curve shows a peak at the MMCO mid-Miocene climatic optimum around 15.9 million years ago, followed by a steady decline through the Icehouse phase toward the LCIA late Cenozoic ice age. The curve transitions from yellow to orange to purple as temperature drops.
These results partially contrast with those of McGrath et al. (Reference McGrath, Anaya and Croft2020), who analyzed body size and diversity trends in Proterotheriidae and Macraucheniidae using mesiodistal length of m1. This approach provides a direct metric and avoids additional uncertainty associated with body-mass estimation, but also ties inference to molar dimensions rather than overall body mass. Other differences stem from the phylogenetic frameworks employed. Here we use the genus-level phylogeny of Lobo et al. (Reference Lobo, Gelfo and Azevedo2024), which recovers Cramaucheniinae as monophyletic and places Llullataruca as the earliest Macraucheniinae. In contrast, McGrath et al. (Reference McGrath, Anaya and Croft2020) relied on the species-level phylogeny of McGrath et al. (Reference McGrath, Anaya and Croft2018), where Cramaucheniinae is paraphyletic, and Llullataruca is included in this subfamily. However, because their analyses of diversity and morphological evolution were conducted at the genus level, multispecific genera were treated as polytomies, allowing meaningful comparison with our results.
Although the phylogeny used by McGrath et al. (Reference McGrath, Anaya and Croft2020) recovers Polymorphis as the most basal macraucheniid, and we do not, both studies recover similar trends. Specifically, McGrath et al. (Reference McGrath, Anaya and Croft2020) document a progressive increase in m1 length from early macraucheniids, whereas our results show a corresponding rise in body mass.
However, as noted by McGrath et al. (Reference McGrath, Anaya and Croft2020), macraucheniid body mass may have increased over this interval without being reflected in m1 length. This is illustrated by the late Miocene Huayqueriana, whose body mass is estimated to be roughly twice that of the early Miocene Theosodon garretorum, despite similar m1 lengths. This discrepancy, even considering the uncertainty inherent to our inferences, provides additional resolution in the present analysis.
Conclusion
Macraucheniidae comprise one of the most notable groups of SANU and, unlike many other litopterns, are part of the megafauna, acting as important modifiers of terrestrial ecosystems through their roles as primary consumers and seed dispersers. Median body mass within the family ranges from 63.5 kg (Coniopternium) to 932.3 kg (Macraucheniopsis). The two subfamilies display distinct, albeit partially overlapping, body-mass ranges. The subfamily Cramaucheniinae ranges from 63.5 kg (Coniopternium) to 198.6 kg (Theosodon), whereas Macraucheniinae ranges from 73.9 kg (Llullataruca) to 932.3 kg (Macraucheniopsis).
The model that best explains body-mass diversification within Macraucheniidae is a directional model of gradual increase over time, which in this case exhibits a relatively slow rate across the entire lineage. While the subfamilies do not differ significantly in their overall evolutionary rates, notable increases in body-mass evolution were detected during the Plio-Pleistocene diversification of Macraucheniinae.
Although a phylogenetic signal is associated with body-mass change in the family’s evolutionary history, analysis considering temperature variation over the last 30 Myr indicates that climate likely acted as an ecological driver of body-mass evolution in macraucheniids. This relationship is negatively correlated, with colder periods corresponding to taxa exhibiting larger body masses. This pattern is particularly evident in the early evolutionary history of Macraucheniinae. One of the earliest taxa assigned to this clade, Llullataruca, which has the lowest body mass in the subfamily, occurs during the MMCO, the warmest peak within the time frame studied. In contrast, the largest body masses (Macraucheniopsis, Macrauchenia, and Xenorhinotherium) occur during the late Cenozoic ice age, the coldest period in the interval. Consequently, because body mass is influenced by temperature as an ecological driver, traits associated with size should not be treated as homologous characters in phylogenetic analyses of this family, and the same probably applies to any other group.
A more comprehensive understanding of body-mass dynamics in Macraucheniidae requires taxonomic revisions, particularly for the genus Theosodon. Additionally, investigating the evolutionary mechanisms driving body-mass changes in other endemic groups, such as the Proterotheriidae, may help clarify the broader evolutionary scenario of South American native ungulates.
Acknowledgments
The authors thank all the curators of the collections who allowed access to the specimens analyzed in this research: L. Chornogubsky (Museo Argentino de Ciencias Naturales “Bernardino Rivadavia,” Buenos Aires), M. A. Reguero (Museo de La Plata, La Plata), C. Cartelle (Museu de Ciencias Naturais of PUC-MINAS, Belo Horizonte), M. E. Pérez (Museo Paleontológico Egidio Feruglio), and M. T. Dozo (Instituto Patagónico de Geología y Paleontología, Puerto Madryn). We thank J. L. da Silva for his valuable advice on phylogenetic comparative methods and M. A. T. Dantas for critical review of the first version of the paper. We would like to thank the reviewers D. Croft and L. Hart for their valuable comments and the insightful discussions they generated, which substantially improved the content of this article. This study was part of L.S.L.’s doctoral thesis, which was supported by Aperfeiçoamento de Pessoal de Nível Superior–Brasil (CAPES)–Finance Code 001; and the project “Ungulados nativos de América del Sur y el Continente Antártico: filogenia, paleobiogeografía y biocronología” (UNLP-N1016) directed by J.N.G.
Competing Interests
The authors report there are no competing interests to declare.
Data Availability Statement
All Supplementary Material (Supplementary Data 1 to 19) and the R code used for the analyses are available from the Dryad Digital Repository: https://doi.org/10.5061/dryad.3bk3j9m1j.




 Open access

