


1 Introduction
The physics of bubble growth in mildly supersaturated solutions is potentially relevant to several processes associated with energy production and consumption, e.g. increased production rate in oil generation (Pooladi-Darvish & Firoozabadi Reference Pooladi-Darvish and Firoozabadi1999; Akin & Kovscek Reference Akin and Kovscek2002). Alternative energy generation methods such as syngas (Munasinghe & Khanal Reference Munasinghe and Khanal2010), photo-electrochemical hydrolysis to obtain hydrogen (Leenheer & Atwater Reference Leenheer and Atwater2010; Spurgeon & Lewis Reference Spurgeon and Lewis2011; Fernández et al.
Reference Fernández, Maurer, Martine, Coey and Möbius2014) and catalytic reactions (Somorjai & Li Reference Somorjai and Li2010) must deal with multi-phase systems which are often affected by bubble formation. As one last example, $\text{CO}_{2}$
bubble formation is an undesired event in carbon sequestration, where
$\text{CO}_{2}$
bubble formation is an undesired event in carbon sequestration, where $\text{CO}_{2}$
is injected at high pressures into reservoirs of saline water trapped in porous rocks at depth (Neufeld et al.
Reference Neufeld, Hesse, Riaz, Hallworth, Tchelepi and Huppert2010; Tsai, Riesing & Stone Reference Tsai, Riesing and Stone2013; Bolster Reference Bolster2014). It appears sensible to assume that in liquids at rest such slow bubble growth (or dissolution) takes place exclusively by diffusion, as in the seminal theoretical analysis by Epstein & Plesset (Reference Epstein and Plesset1950), which predicts that the bubble radius
$\text{CO}_{2}$
is injected at high pressures into reservoirs of saline water trapped in porous rocks at depth (Neufeld et al.
Reference Neufeld, Hesse, Riaz, Hallworth, Tchelepi and Huppert2010; Tsai, Riesing & Stone Reference Tsai, Riesing and Stone2013; Bolster Reference Bolster2014). It appears sensible to assume that in liquids at rest such slow bubble growth (or dissolution) takes place exclusively by diffusion, as in the seminal theoretical analysis by Epstein & Plesset (Reference Epstein and Plesset1950), which predicts that the bubble radius $R$
evolves in a pure diffusive regime as
$R$
evolves in a pure diffusive regime as
 $$\begin{eqnarray}R(t)\approx \left(\sqrt{\frac{c_{0}-c_{s}}{2\unicode[STIX]{x03C0}\unicode[STIX]{x1D70C}_{g}}}+\sqrt{1+\frac{c_{0}-c_{s}}{2\unicode[STIX]{x03C0}\unicode[STIX]{x1D70C}_{g}}}\right)\sqrt{\frac{2D(c_{0}-c_{s})}{\unicode[STIX]{x1D70C}_{g}}t}.\end{eqnarray}$$
Here, $c_{0}$
is the concentration in the bulk liquid at the initial saturation pressure
$c_{0}$
is the concentration in the bulk liquid at the initial saturation pressure $P_{0}$
,
$P_{0}$
, $c_{s}$
is the supersaturated concentration at the ambient pressure
$c_{s}$
is the supersaturated concentration at the ambient pressure $P_{s}$
during the experiments,
$P_{s}$
during the experiments, $\unicode[STIX]{x1D70C}_{g}$
is the gas density and
$\unicode[STIX]{x1D70C}_{g}$
is the gas density and $D$
is the diffusion coefficient of the dissolved gas in the liquid. Such time evolution of the bubble radius has been confirmed in several experimental works, with supersaturations
$D$
is the diffusion coefficient of the dissolved gas in the liquid. Such time evolution of the bubble radius has been confirmed in several experimental works, with supersaturations $\unicode[STIX]{x1D701}=(c_{0}-c_{s})/c_{s}$
comparable to that of carbonated beverages (
$\unicode[STIX]{x1D701}=(c_{0}-c_{s})/c_{s}$
comparable to that of carbonated beverages ( $\unicode[STIX]{x1D701}\sim 1{-}3$
) (Bisperink & Prins Reference Bisperink and Prins1994; Jones, Evans & Galvin Reference Jones, Evans and Galvin1999b
; Barker, Jefferson & Judd Reference Barker, Jefferson and Judd2002; Li et al.
Reference Li, Chen, Zhou, Wu, Stoyanov and Pelan2014).
$\unicode[STIX]{x1D701}\sim 1{-}3$
) (Bisperink & Prins Reference Bisperink and Prins1994; Jones, Evans & Galvin Reference Jones, Evans and Galvin1999b
; Barker, Jefferson & Judd Reference Barker, Jefferson and Judd2002; Li et al.
Reference Li, Chen, Zhou, Wu, Stoyanov and Pelan2014).
However, in previous experimental studies of single $\text{CO}_{2}$
bubbles growing on a silicon substrate in very mildly supersaturated solutions with
$\text{CO}_{2}$
bubbles growing on a silicon substrate in very mildly supersaturated solutions with $\unicode[STIX]{x1D701}\sim 0.1{-}0.3$
(Enríquez et al.
Reference Enríquez, Sun, Lohse, Prosperetti and van der Meer2014; Moreno Soto et al.
Reference Moreno Soto, Prosperetti, Lohse and van der Meer2017), significant differences were observed with respect to a purely diffusive growth. The most notable discrepancy consists of an enhanced mass transfer rate towards the later stages of the bubble growth, which exceeds the predicted diffusive growth rate and corresponds to a time evolution of the bubble radius different from
$\unicode[STIX]{x1D701}\sim 0.1{-}0.3$
(Enríquez et al.
Reference Enríquez, Sun, Lohse, Prosperetti and van der Meer2014; Moreno Soto et al.
Reference Moreno Soto, Prosperetti, Lohse and van der Meer2017), significant differences were observed with respect to a purely diffusive growth. The most notable discrepancy consists of an enhanced mass transfer rate towards the later stages of the bubble growth, which exceeds the predicted diffusive growth rate and corresponds to a time evolution of the bubble radius different from $R\propto \sqrt{t}$
. This behaviour originates from the development of buoyancy-driven convection induced by the decreased density of the
$R\propto \sqrt{t}$
. This behaviour originates from the development of buoyancy-driven convection induced by the decreased density of the $\text{CO}_{2}$
-depleted liquid around the bubble. It has been shown that buoyancy-driven convection is also the cause of higher dissolution rates of sessile droplets in a less dense liquid (Dietrich et al.
Reference Dietrich, Wildeman, Visser, Hofhuis, Kooij, Zandvliet and Lohse2016) and during droplet evaporation (Shahidzadeh-Bonn et al.
Reference Shahidzadeh-Bonn, Rafaï, Azouni and Bonn2006). Both situations are physically analogous to growing bubbles and customarily treated as purely diffusion-driven phenomena (Popov Reference Popov2005; Stauber et al.
Reference Stauber, Wilson, Duffy and Sefiane2014; Lohse & Zhang Reference Lohse and Zhang2015), neglecting convective effects.
$\text{CO}_{2}$
-depleted liquid around the bubble. It has been shown that buoyancy-driven convection is also the cause of higher dissolution rates of sessile droplets in a less dense liquid (Dietrich et al.
Reference Dietrich, Wildeman, Visser, Hofhuis, Kooij, Zandvliet and Lohse2016) and during droplet evaporation (Shahidzadeh-Bonn et al.
Reference Shahidzadeh-Bonn, Rafaï, Azouni and Bonn2006). Both situations are physically analogous to growing bubbles and customarily treated as purely diffusion-driven phenomena (Popov Reference Popov2005; Stauber et al.
Reference Stauber, Wilson, Duffy and Sefiane2014; Lohse & Zhang Reference Lohse and Zhang2015), neglecting convective effects.
In this article, we further delve into the development of natural convection around a single growing bubble. We focus in particular on the time that it takes for convection to set in as an appreciable mass transfer mechanism and what external conditions, such as the concentration in the bulk liquid $c_{0}$
and the supersaturation level
$c_{0}$
and the supersaturation level $\unicode[STIX]{x1D701}$
, have more influence on its transition. We present a simple theoretical criterion to predict the time
$\unicode[STIX]{x1D701}$
, have more influence on its transition. We present a simple theoretical criterion to predict the time $t_{conv}$
at which convection becomes important and find a good agreement with experimental measurements using
$t_{conv}$
at which convection becomes important and find a good agreement with experimental measurements using $\text{CO}_{2}$
bubbles. Afterwards, the long-term effects of depletion in a single bubble succession are investigated, showing a significant influence on
$\text{CO}_{2}$
bubbles. Afterwards, the long-term effects of depletion in a single bubble succession are investigated, showing a significant influence on $t_{conv}$
and the strength with which convection sets in. Finally, two different gases in solution (
$t_{conv}$
and the strength with which convection sets in. Finally, two different gases in solution ( $\text{CO}_{2}$
and
$\text{CO}_{2}$
and $\text{N}_{2}$
) are contrasted, revealing a unique behavioural change in the mass transfer rate at the predicted time
$\text{N}_{2}$
) are contrasted, revealing a unique behavioural change in the mass transfer rate at the predicted time $t_{conv}$
due to the different gas properties.
$t_{conv}$
due to the different gas properties.
2 Experimental set-up and theoretical approach
Our experiments start with an equilibrated solution of either $\text{CO}_{2}$
or
$\text{CO}_{2}$
or $\text{N}_{2}$
in ultra-pure degassed water at a starting saturation pressure
$\text{N}_{2}$
in ultra-pure degassed water at a starting saturation pressure $P_{0}$
. The initial dissolved gas concentration
$P_{0}$
. The initial dissolved gas concentration $c_{0}$
is given by Henry’s law, i.e.
$c_{0}$
is given by Henry’s law, i.e. $c_{0}=k_{H}P_{0}$
, where
$c_{0}=k_{H}P_{0}$
, where $k_{H}$
depends on the gas–liquid couple and the temperature
$k_{H}$
depends on the gas–liquid couple and the temperature $T$
. We then drop the pressure isothermally (
$T$
. We then drop the pressure isothermally ( $T\approx 20\,^{\circ }\text{C}$
) to
$T\approx 20\,^{\circ }\text{C}$
) to $P_{s}$
in order to induce a supersaturation
$P_{s}$
in order to induce a supersaturation
 $$\begin{eqnarray}\unicode[STIX]{x1D701}=\frac{c_{0}-c_{s}}{c_{s}}=\frac{P_{0}-P_{s}}{P_{s}}.\end{eqnarray}$$
The pressure controller induces some oscillations after the pressure drop, which can be slightly detected in the figures shown later. Due to this pressure decrease, a bubble grows out of a hydrophobised micro-pit of radius $R_{p}=10~\unicode[STIX]{x03BC}\text{m}$
or
$R_{p}=10~\unicode[STIX]{x03BC}\text{m}$
or $50~\unicode[STIX]{x03BC}\text{m}$
which is covered with black silicon (Jansen et al.
Reference Jansen, de Boer, Legtenberg and Elwenspoek1995) and acts as an artificial bubble nucleation site (Borkent et al.
Reference Borkent, Gekle, Prosperetti and Lohse2009). The size of the pit, etched on a silicon substrate, determines the minimum supersaturation for which a bubble grows (Jones, Evans & Galvin Reference Jones, Evans and Galvin1999a
; Enríquez Reference Enríquez2015; van der Linde et al.
Reference van der Linde, Peñas-López, Moreno Soto, van der Meer, Lohse, Gardeniers and Fernández Rivas2018),
$50~\unicode[STIX]{x03BC}\text{m}$
which is covered with black silicon (Jansen et al.
Reference Jansen, de Boer, Legtenberg and Elwenspoek1995) and acts as an artificial bubble nucleation site (Borkent et al.
Reference Borkent, Gekle, Prosperetti and Lohse2009). The size of the pit, etched on a silicon substrate, determines the minimum supersaturation for which a bubble grows (Jones, Evans & Galvin Reference Jones, Evans and Galvin1999a
; Enríquez Reference Enríquez2015; van der Linde et al.
Reference van der Linde, Peñas-López, Moreno Soto, van der Meer, Lohse, Gardeniers and Fernández Rivas2018), $\unicode[STIX]{x1D701}>2\unicode[STIX]{x1D70E}/P_{s}R_{p}$
, which typically corresponds to a value
$\unicode[STIX]{x1D701}>2\unicode[STIX]{x1D70E}/P_{s}R_{p}$
, which typically corresponds to a value $\unicode[STIX]{x1D701}\approx 0.07$
. However, it is extremely difficult to achieve bubble formation for this value due to the limitations of our set-up. On the other limit, very high
$\unicode[STIX]{x1D701}\approx 0.07$
. However, it is extremely difficult to achieve bubble formation for this value due to the limitations of our set-up. On the other limit, very high $c_{s}$
or
$c_{s}$
or $\unicode[STIX]{x1D701}$
imply uncontrolled bubble nucleation in areas outside the field of view. This interferes with the proper analysis of the target bubble due to massive bubble formation.
$\unicode[STIX]{x1D701}$
imply uncontrolled bubble nucleation in areas outside the field of view. This interferes with the proper analysis of the target bubble due to massive bubble formation. $R_{p}$
also defines the bubble detachment radius (known as the Fritz radius; Fritz (Reference Fritz1935)) by equilibrating capillary and buoyancy forces:
$R_{p}$
also defines the bubble detachment radius (known as the Fritz radius; Fritz (Reference Fritz1935)) by equilibrating capillary and buoyancy forces:
 $$\begin{eqnarray}R_{det}=\left(\frac{3R_{p}\unicode[STIX]{x1D70E}}{2(\unicode[STIX]{x1D70C}_{m}-\unicode[STIX]{x1D70C}_{g})g}\right)^{1/3},\end{eqnarray}$$
where $\unicode[STIX]{x1D70E}$
is the surface tension coefficient,
$\unicode[STIX]{x1D70E}$
is the surface tension coefficient, $\unicode[STIX]{x1D70C}_{m}$
is the solution density and
$\unicode[STIX]{x1D70C}_{m}$
is the solution density and $g$
is the gravitational acceleration. The pit is located so that the bubble growing atop is far from the holding device, where several bubbles usually grow, and also far enough from the edges of the substrates, where parasitic bubbles might grow on the micro-roughness caused by the dicing process through which an original silicon wafer is cut into the shape of the experimental chips. Unless otherwise indicated, the bubbles always grow on top of the substrate and all experiments are done in the range
$g$
is the gravitational acceleration. The pit is located so that the bubble growing atop is far from the holding device, where several bubbles usually grow, and also far enough from the edges of the substrates, where parasitic bubbles might grow on the micro-roughness caused by the dicing process through which an original silicon wafer is cut into the shape of the experimental chips. Unless otherwise indicated, the bubbles always grow on top of the substrate and all experiments are done in the range $0.1<\unicode[STIX]{x1D701}<0.5$
; higher supersaturations already result in too many bubbles on the walls of the tank and on the edges of the silicon substrate and, consequently, it can no longer be ensured that the liquid is at rest. Figure 1(a) shows a sketch of the experimental set-up. A detailed description can be found in Enríquez et al. (Reference Enríquez, Hummelink, Bruggert, Lohse, Prosperetti, van der Meer and Sun2013).
$0.1<\unicode[STIX]{x1D701}<0.5$
; higher supersaturations already result in too many bubbles on the walls of the tank and on the edges of the silicon substrate and, consequently, it can no longer be ensured that the liquid is at rest. Figure 1(a) shows a sketch of the experimental set-up. A detailed description can be found in Enríquez et al. (Reference Enríquez, Hummelink, Bruggert, Lohse, Prosperetti, van der Meer and Sun2013).
Sketches of (a) the experimental set-up and (b) the growing bubble. (a) A saturated water– $\text{CO}_{2}$
solution is prepared in the reservoir tank at a pressure
$\text{CO}_{2}$
solution is prepared in the reservoir tank at a pressure $P_{0}$
. After transferring part of the mix to the observation tank, the pressure is dropped to
$P_{0}$
. After transferring part of the mix to the observation tank, the pressure is dropped to $P_{s}$
in order to produce a small supersaturation. A bubble grows from a nucleation site defined by a single hydrophobic cavity etched in a silicon substrate. We record the process using a long distance microscope objective through a lateral window of the tank. (b) As the bubble radius
$P_{s}$
in order to produce a small supersaturation. A bubble grows from a nucleation site defined by a single hydrophobic cavity etched in a silicon substrate. We record the process using a long distance microscope objective through a lateral window of the tank. (b) As the bubble radius $R$
grows, it develops a concentration
$R$
grows, it develops a concentration $c$
and density
$c$
and density $\unicode[STIX]{x1D70C}_{m}$
profile of thickness
$\unicode[STIX]{x1D70C}_{m}$
profile of thickness $\unicode[STIX]{x1D6FF}(t)$
.
$\unicode[STIX]{x1D6FF}(t)$
.
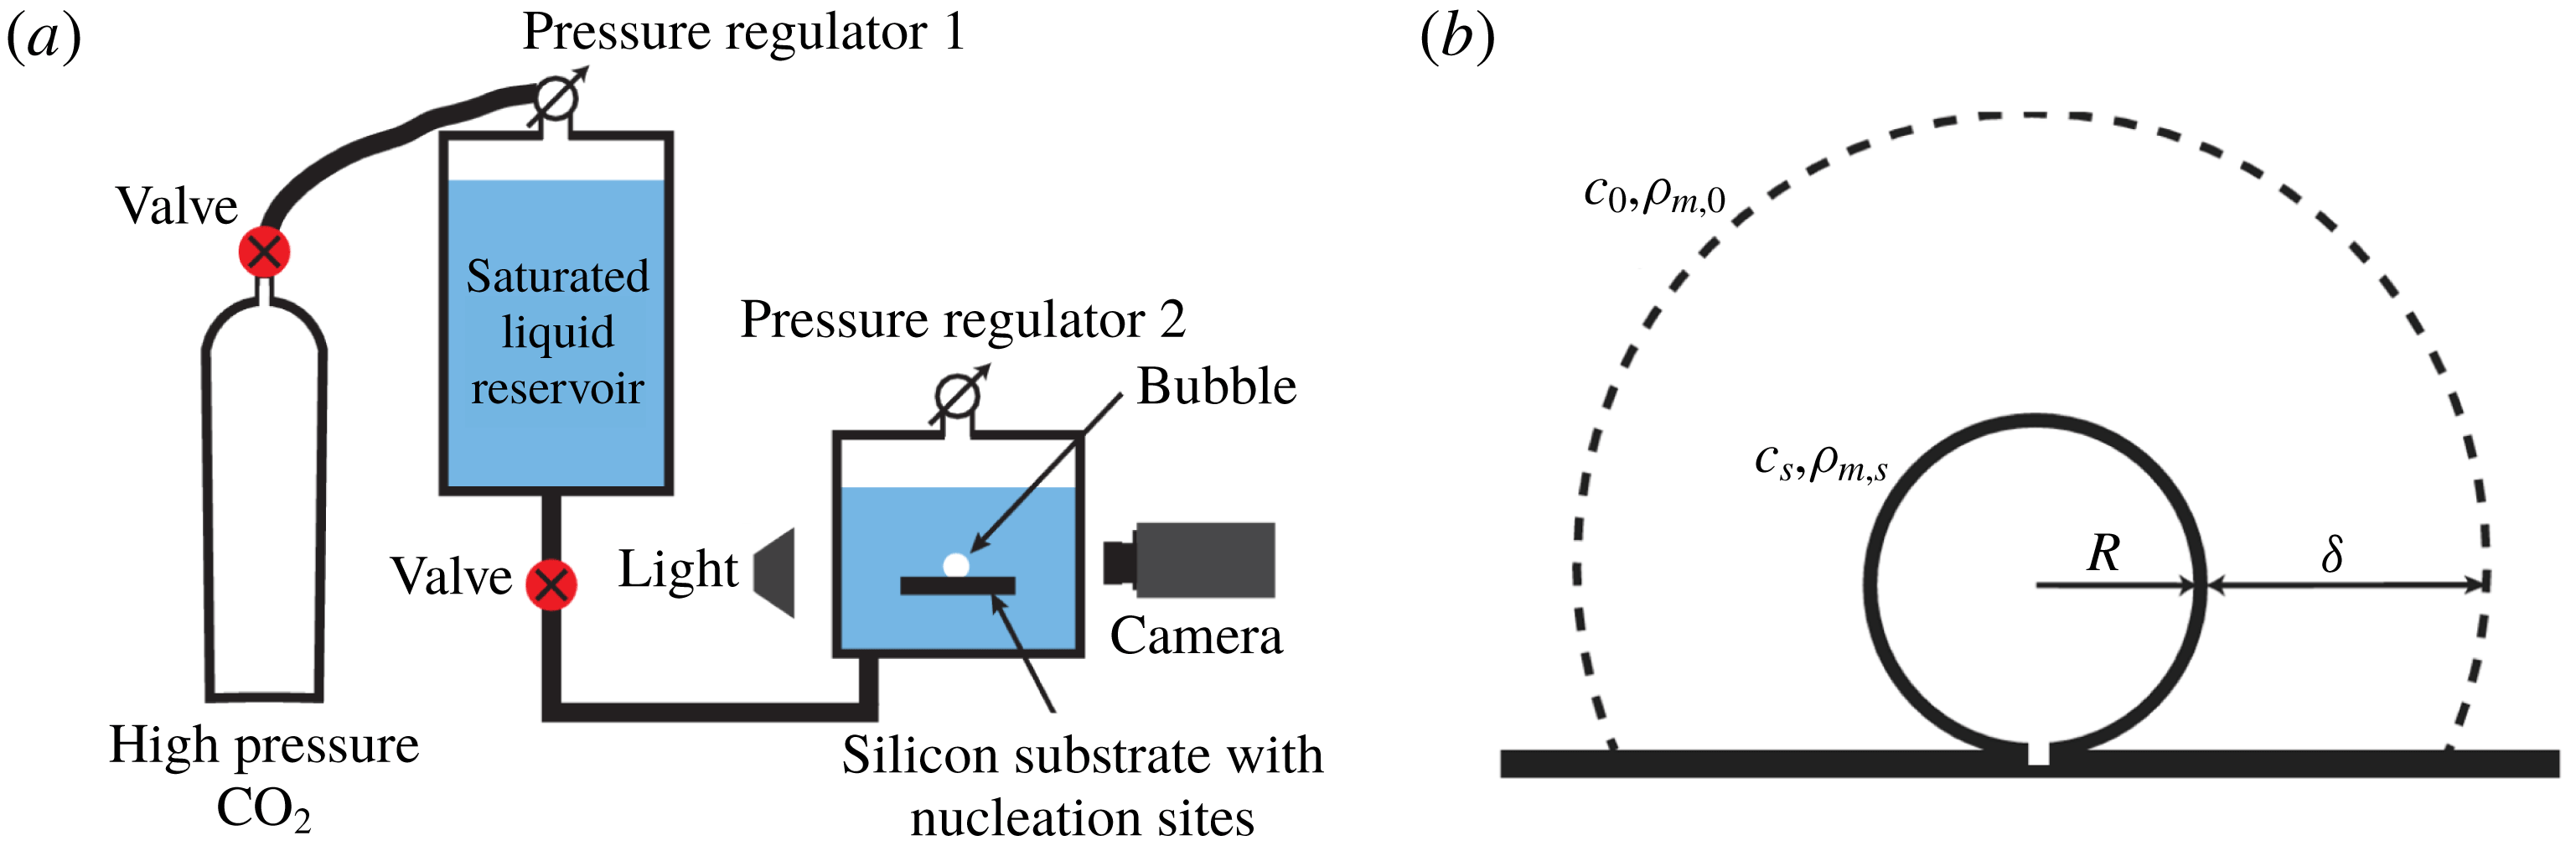
Figure 1(b) shows a sketch of a growing bubble. The Laplace pressure due to the surface tension is in our case very small compared to $P_{s}$
and can be safely neglected. Hence, the gas concentration at the interface can be considered constant and equal to
$P_{s}$
and can be safely neglected. Hence, the gas concentration at the interface can be considered constant and equal to $c_{s}$
and, therefore, the bubble grows due to the diffusive gas flow driven by the concentration difference
$c_{s}$
and, therefore, the bubble grows due to the diffusive gas flow driven by the concentration difference $c_{s}\unicode[STIX]{x1D701}$
and the gas diffusivity
$c_{s}\unicode[STIX]{x1D701}$
and the gas diffusivity $D$
. The idealised initial condition is that the bubble grows from a radius
$D$
. The idealised initial condition is that the bubble grows from a radius $R_{p}$
with concentration
$R_{p}$
with concentration $c_{s}$
at the interface and
$c_{s}$
at the interface and $c_{0}$
everywhere else. The asymptotic solution for the growth of a bubble in an infinite medium with the aforementioned initial conditions (1.1) (Epstein & Plesset Reference Epstein and Plesset1950) needs to be adapted to account for the presence of the silicon substrate below the bubble interface (Enríquez et al.
Reference Enríquez, Sun, Lohse, Prosperetti and van der Meer2014), which obstructs the mass transfer towards the bubble. The corrected asymptotic solution thus reads:
$c_{0}$
everywhere else. The asymptotic solution for the growth of a bubble in an infinite medium with the aforementioned initial conditions (1.1) (Epstein & Plesset Reference Epstein and Plesset1950) needs to be adapted to account for the presence of the silicon substrate below the bubble interface (Enríquez et al.
Reference Enríquez, Sun, Lohse, Prosperetti and van der Meer2014), which obstructs the mass transfer towards the bubble. The corrected asymptotic solution thus reads:
 $$\begin{eqnarray}\unicode[STIX]{x1D716}\approx \left(\sqrt{\frac{c_{s}\unicode[STIX]{x1D701}}{2\unicode[STIX]{x03C0}\unicode[STIX]{x1D70C}_{g}}}+\sqrt{\frac{1}{2}+\frac{c_{s}\unicode[STIX]{x1D701}}{2\unicode[STIX]{x03C0}\unicode[STIX]{x1D70C}_{g}}}\right)x\equiv S^{\ast }x,\end{eqnarray}$$
where $\unicode[STIX]{x1D716}=R/R_{p}$
is the dimensionless bubble radius and
$\unicode[STIX]{x1D716}=R/R_{p}$
is the dimensionless bubble radius and $x=\sqrt{(2Dc_{s}\unicode[STIX]{x1D701}~t)/(\unicode[STIX]{x1D70C}_{g}R_{p}^{2})}$
. Note that
$x=\sqrt{(2Dc_{s}\unicode[STIX]{x1D701}~t)/(\unicode[STIX]{x1D70C}_{g}R_{p}^{2})}$
. Note that $R_{p}$
works in (2.3) as a reference value and does not directly affect the growth rate (Barker et al.
Reference Barker, Jefferson and Judd2002).
$R_{p}$
works in (2.3) as a reference value and does not directly affect the growth rate (Barker et al.
Reference Barker, Jefferson and Judd2002). $S^{\ast }$
typically reaches values around 0.9 and it increases with higher
$S^{\ast }$
typically reaches values around 0.9 and it increases with higher $\unicode[STIX]{x1D701}$
and
$\unicode[STIX]{x1D701}$
and $P_{0}$
. To compare experiments with this theoretical behaviour, a time origin needs to be determined. We measure it in two steps: firstly, we identify
$P_{0}$
. To compare experiments with this theoretical behaviour, a time origin needs to be determined. We measure it in two steps: firstly, we identify $t_{0}=0$
with the moment in which we first detect a bubble protruding from the pit; secondly, we numerically fit a function
$t_{0}=0$
with the moment in which we first detect a bubble protruding from the pit; secondly, we numerically fit a function $\sqrt{t}$
(i.e. the theoretical behaviour for pure diffusion) to the early stages of the experimental bubble growth (ignoring the first few data points associated with the growth of the bubble out of the pit). We correct the former
$\sqrt{t}$
(i.e. the theoretical behaviour for pure diffusion) to the early stages of the experimental bubble growth (ignoring the first few data points associated with the growth of the bubble out of the pit). We correct the former $t_{0}$
, which was already within the error limit
$t_{0}$
, which was already within the error limit $\pm 0.5~\text{s}$
.
$\pm 0.5~\text{s}$
.
As the bubble grows, it depletes its surroundings of gas (Moreno Soto et al.
Reference Moreno Soto, Prosperetti, Lohse and van der Meer2017), developing a diffusively growing concentration profile that extends a distance $\unicode[STIX]{x1D6FF}=\sqrt{\unicode[STIX]{x03C0}Dt}$
into the liquid solution (figure 1
b). Variations in concentration imply changes in the solution density, determined by the concentration expansion coefficient
$\unicode[STIX]{x1D6FF}=\sqrt{\unicode[STIX]{x03C0}Dt}$
into the liquid solution (figure 1
b). Variations in concentration imply changes in the solution density, determined by the concentration expansion coefficient $\unicode[STIX]{x1D706}_{c}$
, which for a dilute solution of gas in water can be approximated as (Gebhart & Pera Reference Gebhart and Pera1971; Moreno Soto et al.
Reference Moreno Soto, Prosperetti, Lohse and van der Meer2017; Peñas-López et al.
Reference Peñas-López, Moreno Soto, Parrales, van der Meer, Lohse and Rodríguez-Rodríguez2017):
$\unicode[STIX]{x1D706}_{c}$
, which for a dilute solution of gas in water can be approximated as (Gebhart & Pera Reference Gebhart and Pera1971; Moreno Soto et al.
Reference Moreno Soto, Prosperetti, Lohse and van der Meer2017; Peñas-López et al.
Reference Peñas-López, Moreno Soto, Parrales, van der Meer, Lohse and Rodríguez-Rodríguez2017):
 $$\begin{eqnarray}\unicode[STIX]{x1D706}_{c}=\frac{1}{\unicode[STIX]{x1D70C}}\left(\frac{\unicode[STIX]{x2202}\unicode[STIX]{x1D70C}}{\unicode[STIX]{x2202}c}\right)_{P,T}\approx \frac{1}{\unicode[STIX]{x1D70C}_{m,0}}\frac{\unicode[STIX]{x1D70C}_{m,0}-\unicode[STIX]{x1D70C}_{m,s}}{c_{0}-c_{s}}.\end{eqnarray}$$
Hence, a positive $\unicode[STIX]{x1D706}_{c}$
means that the density of the solution increases with the gas concentration. If the density of the saturated solution is
$\unicode[STIX]{x1D706}_{c}$
means that the density of the solution increases with the gas concentration. If the density of the saturated solution is $\unicode[STIX]{x1D70C}_{m,0}$
, the density value at the bubble surface is given by
$\unicode[STIX]{x1D70C}_{m,0}$
, the density value at the bubble surface is given by $\unicode[STIX]{x1D70C}_{m,s}=\unicode[STIX]{x1D70C}_{m,0}(1-\unicode[STIX]{x1D706}_{c}c_{s}\unicode[STIX]{x1D701})$
. The different gas properties of
$\unicode[STIX]{x1D70C}_{m,s}=\unicode[STIX]{x1D70C}_{m,0}(1-\unicode[STIX]{x1D706}_{c}c_{s}\unicode[STIX]{x1D701})$
. The different gas properties of $\text{CO}_{2}$
and
$\text{CO}_{2}$
and $\text{N}_{2}$
are listed in table 1. Combining
$\text{N}_{2}$
are listed in table 1. Combining $\unicode[STIX]{x1D706}_{c}$
with
$\unicode[STIX]{x1D706}_{c}$
with $c_{s}\unicode[STIX]{x1D701}\approx 2~\text{kg}~\text{m}^{-3}$
(for the
$c_{s}\unicode[STIX]{x1D701}\approx 2~\text{kg}~\text{m}^{-3}$
(for the $\text{CO}_{2}$
experiments;
$\text{CO}_{2}$
experiments; $c_{s}\unicode[STIX]{x1D701}$
is much smaller for the
$c_{s}\unicode[STIX]{x1D701}$
is much smaller for the $\text{N}_{2}$
case) implies that
$\text{N}_{2}$
case) implies that $|\unicode[STIX]{x1D706}_{c}c_{s}\unicode[STIX]{x1D701}|\ll 1$
and makes it tempting to neglect the changes in density, which has been routinely done in most earlier works on bubble growth in supersaturated solutions. However, the long growth times of the bubbles require that we do take long term density changes into consideration.
$|\unicode[STIX]{x1D706}_{c}c_{s}\unicode[STIX]{x1D701}|\ll 1$
and makes it tempting to neglect the changes in density, which has been routinely done in most earlier works on bubble growth in supersaturated solutions. However, the long growth times of the bubbles require that we do take long term density changes into consideration.
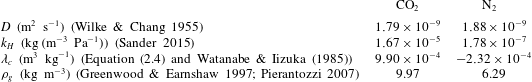
Properties of $\text{CO}_{2}$
and
$\text{CO}_{2}$
and $\text{N}_{2}$
when dissolved in water at
$\text{N}_{2}$
when dissolved in water at $P=0.55~\text{MPa}$
and
$P=0.55~\text{MPa}$
and $T=21\,^{\circ }\text{C}$
. The large difference in the values of Henry’s constant
$T=21\,^{\circ }\text{C}$
. The large difference in the values of Henry’s constant $k_{H}$
accounts for the two orders of magnitude change in solubility.
$k_{H}$
accounts for the two orders of magnitude change in solubility.
As will be thoroughly explained in the following section, after an initial diffusive growth, a transition to density-driven natural convection occurs. In order to experimentally measure the time in which this transition takes place, two methods are used and compared. An analytical model comparing buoyant and viscous forces will be defined to theoretically approximate this transition time, which only depends on the properties of the solution and the supersaturation level $\unicode[STIX]{x1D701}$
at which bubbles grow. Whereas for a purely diffusively growing bubble (2.3) the ratio between the bubble radius and its diffusive concentration boundary layer
$\unicode[STIX]{x1D701}$
at which bubbles grow. Whereas for a purely diffusively growing bubble (2.3) the ratio between the bubble radius and its diffusive concentration boundary layer $R/\unicode[STIX]{x1D6FF}=S^{\ast }\sqrt{2c_{s}\unicode[STIX]{x1D701}/\unicode[STIX]{x03C0}\unicode[STIX]{x1D70C}_{g}}$
remains constant through time, the transition to convection enhances the bubble growth rate but does not influence
$R/\unicode[STIX]{x1D6FF}=S^{\ast }\sqrt{2c_{s}\unicode[STIX]{x1D701}/\unicode[STIX]{x03C0}\unicode[STIX]{x1D70C}_{g}}$
remains constant through time, the transition to convection enhances the bubble growth rate but does not influence $\unicode[STIX]{x1D6FF}$
. Thus, the ratio
$\unicode[STIX]{x1D6FF}$
. Thus, the ratio $R/\unicode[STIX]{x1D6FF}$
increases as compared to a purely diffusive case. Higher supersaturation levels
$R/\unicode[STIX]{x1D6FF}$
increases as compared to a purely diffusive case. Higher supersaturation levels $\unicode[STIX]{x1D701}$
and
$\unicode[STIX]{x1D701}$
and $P_{0}$
(which directly relates to
$P_{0}$
(which directly relates to $c_{s}$
) also make this ratio increase. However, within this relatively smaller concentration layer, higher concentration gradients are reached, which results in higher and intensified onset to natural convection, as we will analyse in the following section.
$c_{s}$
) also make this ratio increase. However, within this relatively smaller concentration layer, higher concentration gradients are reached, which results in higher and intensified onset to natural convection, as we will analyse in the following section.
3 The case of $\text{CO}_{2}$
bubbles
$\text{CO}_{2}$
bubbles

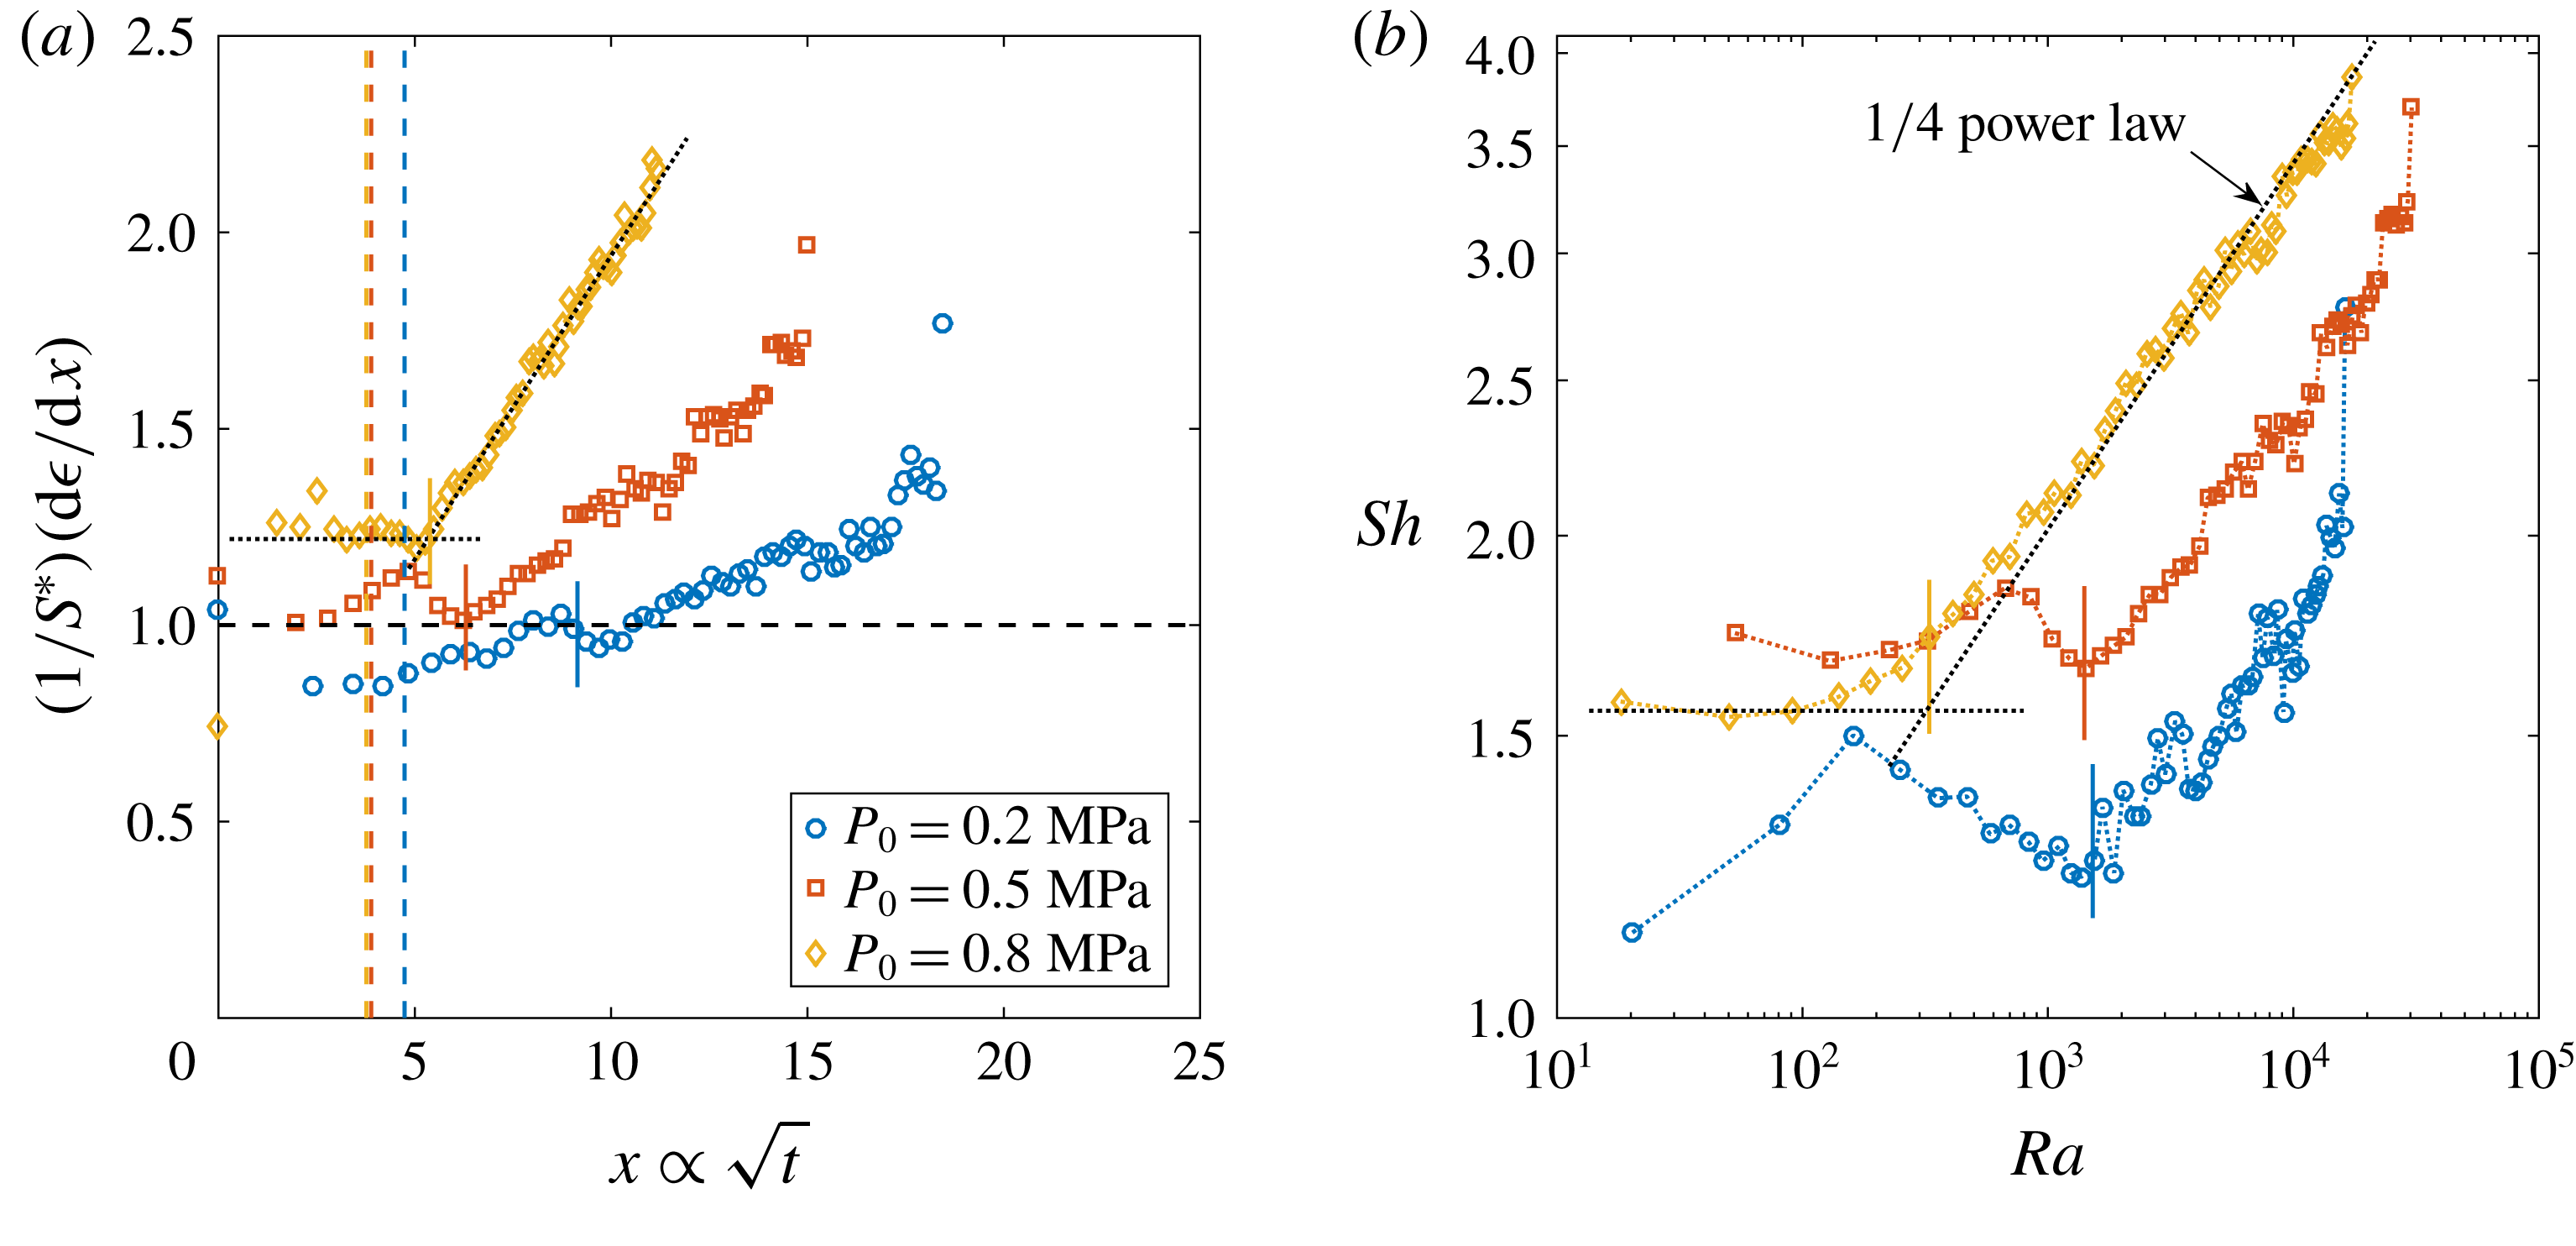
Dimensionless bubble growth rate (or, equivalently, the dimensionless change in the bubble surface over time) divided by $S^{\ast }$
as a function of
$S^{\ast }$
as a function of $x\propto \sqrt{t}$
. The leftmost rising part associated with the sudden growth of the bubble out of the pit and the following horizontal plateau are expected from a diffusion-driven growth; the right-hand slope suggests the influence of convection. The horizontal dashed line represents the purely diffusive evolution according to (2.3). (a) Experiments at
$x\propto \sqrt{t}$
. The leftmost rising part associated with the sudden growth of the bubble out of the pit and the following horizontal plateau are expected from a diffusion-driven growth; the right-hand slope suggests the influence of convection. The horizontal dashed line represents the purely diffusive evolution according to (2.3). (a) Experiments at $P_{0}=0.35~\text{MPa}$
and a pit of
$P_{0}=0.35~\text{MPa}$
and a pit of $R_{p}=50~\unicode[STIX]{x03BC}\text{m}$
with various supersaturation levels
$R_{p}=50~\unicode[STIX]{x03BC}\text{m}$
with various supersaturation levels $\unicode[STIX]{x1D701}$
. In all cases, the bubble grows on top of the silicon chip. The vertical solid lines in corresponding colours indicate the experimentally measured dimensionless square root of the transition time
$\unicode[STIX]{x1D701}$
. In all cases, the bubble grows on top of the silicon chip. The vertical solid lines in corresponding colours indicate the experimentally measured dimensionless square root of the transition time $x_{c}$
for each
$x_{c}$
for each $\unicode[STIX]{x1D701}$
. The two reference lines used on its calculation are shown as dotted lines for
$\unicode[STIX]{x1D701}$
. The two reference lines used on its calculation are shown as dotted lines for $\unicode[STIX]{x1D701}=0.10$
. (b) Experiments at
$\unicode[STIX]{x1D701}=0.10$
. (b) Experiments at $P_{0}=0.65~\text{MPa}$
, a pit of
$P_{0}=0.65~\text{MPa}$
, a pit of $R_{p}=10~\unicode[STIX]{x03BC}\text{m}$
and
$R_{p}=10~\unicode[STIX]{x03BC}\text{m}$
and $\unicode[STIX]{x1D701}\approx 0.2$
with the bubble growing in different geometrical configurations, indicated by the sketches next to the corresponding curves.
$\unicode[STIX]{x1D701}\approx 0.2$
with the bubble growing in different geometrical configurations, indicated by the sketches next to the corresponding curves.
(a) Sherwood number $Sh$
as a function of Rayleigh number
$Sh$
as a function of Rayleigh number $Ra$
in double logarithmic scale from the same data presented in figure 2(a). The dashed line represents a
$Ra$
in double logarithmic scale from the same data presented in figure 2(a). The dashed line represents a $1/4$
power law, which indicates that in the advanced stages, growth is driven by natural convection (Enríquez et al.
Reference Enríquez, Sun, Lohse, Prosperetti and van der Meer2014; Moreno Soto et al.
Reference Moreno Soto, Prosperetti, Lohse and van der Meer2017). The dotted horizontal line stands for a purely diffusive growth and its intersection with the power law indicates the transition to convection. The vertical solid lines in corresponding colours indicate the measured
$1/4$
power law, which indicates that in the advanced stages, growth is driven by natural convection (Enríquez et al.
Reference Enríquez, Sun, Lohse, Prosperetti and van der Meer2014; Moreno Soto et al.
Reference Moreno Soto, Prosperetti, Lohse and van der Meer2017). The dotted horizontal line stands for a purely diffusive growth and its intersection with the power law indicates the transition to convection. The vertical solid lines in corresponding colours indicate the measured $Ra_{c}$
for each curve. (b) Rayleigh number
$Ra_{c}$
for each curve. (b) Rayleigh number $Ra_{c}$
at the cross-over to convection-driven growth as a function of the supersaturation
$Ra_{c}$
at the cross-over to convection-driven growth as a function of the supersaturation $\unicode[STIX]{x1D701}$
. Blue circles correspond to experiments with
$\unicode[STIX]{x1D701}$
. Blue circles correspond to experiments with $P_{0}=0.35~\text{MPa}$
and
$P_{0}=0.35~\text{MPa}$
and $R_{p}=50~\unicode[STIX]{x03BC}\text{m}$
and red diamonds to
$R_{p}=50~\unicode[STIX]{x03BC}\text{m}$
and red diamonds to $P_{0}=0.65~\text{MPa}$
and
$P_{0}=0.65~\text{MPa}$
and $R_{p}=10~\unicode[STIX]{x03BC}\text{m}$
. The solid black line represents the theoretical
$R_{p}=10~\unicode[STIX]{x03BC}\text{m}$
. The solid black line represents the theoretical $Ra_{c}$
as given by (3.7), which does not depend on
$Ra_{c}$
as given by (3.7), which does not depend on $P_{0}$
and therefore is coincidental for the two cases presented.
$P_{0}$
and therefore is coincidental for the two cases presented.

The typical bubble growth from our experiments is best appreciated by plotting the derivative $\text{d}\unicode[STIX]{x1D716}/\text{d}x$
, which represents the dimensionless rate of change of the bubble area. Following (2.3) this should be constant and approximately equal to
$\text{d}\unicode[STIX]{x1D716}/\text{d}x$
, which represents the dimensionless rate of change of the bubble area. Following (2.3) this should be constant and approximately equal to $S^{\ast }$
. Figure 2(a) shows
$S^{\ast }$
. Figure 2(a) shows $\text{d}\unicode[STIX]{x1D716}/\text{d}x$
divided by
$\text{d}\unicode[STIX]{x1D716}/\text{d}x$
divided by $S^{\ast }$
for some experiments with
$S^{\ast }$
for some experiments with $\text{CO}_{2}$
solutions at
$\text{CO}_{2}$
solutions at $P_{0}=0.35~\text{MPa}$
and different
$P_{0}=0.35~\text{MPa}$
and different $\unicode[STIX]{x1D701}$
. After the initial transient associated with the sudden growth of the bubble out of the pit, there is indeed a plateau around
$\unicode[STIX]{x1D701}$
. After the initial transient associated with the sudden growth of the bubble out of the pit, there is indeed a plateau around $(1/S^{\ast })(\text{d}\unicode[STIX]{x1D716}/\text{d}x)\approx 1$
, which indicates a diffusion-driven growth. The plateau reaches larger values with increasing
$(1/S^{\ast })(\text{d}\unicode[STIX]{x1D716}/\text{d}x)\approx 1$
, which indicates a diffusion-driven growth. The plateau reaches larger values with increasing $\unicode[STIX]{x1D701}$
. This originates from the stronger bubble growth rate at larger supersaturation levels
$\unicode[STIX]{x1D701}$
. This originates from the stronger bubble growth rate at larger supersaturation levels $\unicode[STIX]{x1D701}$
, which the asymptotic model (2.3) cannot follow any longer. Nevertheless, for the experimental range studied, the expected plateau corresponding to a diffusive process is always found. Afterwards, the curves start to rise as a result of the enhancement of mass transfer caused by natural convection. To properly associate this effect with a transition to natural convection, following Enríquez et al. (Reference Enríquez, Sun, Lohse, Prosperetti and van der Meer2014), we introduce the Sherwood number
$\unicode[STIX]{x1D701}$
, which the asymptotic model (2.3) cannot follow any longer. Nevertheless, for the experimental range studied, the expected plateau corresponding to a diffusive process is always found. Afterwards, the curves start to rise as a result of the enhancement of mass transfer caused by natural convection. To properly associate this effect with a transition to natural convection, following Enríquez et al. (Reference Enríquez, Sun, Lohse, Prosperetti and van der Meer2014), we introduce the Sherwood number $Sh$
and the mass Rayleigh number
$Sh$
and the mass Rayleigh number $Ra$
, respectively defined as:
$Ra$
, respectively defined as:
 $$\begin{eqnarray}Sh=\frac{2R{\dot{R}}\unicode[STIX]{x1D70C}_{g}}{Dc_{s}\unicode[STIX]{x1D701}},\quad Ra=\frac{g\unicode[STIX]{x1D706}_{c}c_{s}\unicode[STIX]{x1D701}(2R)^{3}}{\unicode[STIX]{x1D708}D},\end{eqnarray}$$
where ${\dot{R}}$
is the (dimensional) bubble growth rate and
${\dot{R}}$
is the (dimensional) bubble growth rate and $\unicode[STIX]{x1D708}$
is the kinematic viscosity of water. Defined this way,
$\unicode[STIX]{x1D708}$
is the kinematic viscosity of water. Defined this way, $Sh$
stands for the dimensionless mass transfer rate towards the bubble and
$Sh$
stands for the dimensionless mass transfer rate towards the bubble and $Ra$
for the dimensionless buoyancy force due to the concentration difference in the liquid. When
$Ra$
for the dimensionless buoyancy force due to the concentration difference in the liquid. When $Sh$
is plotted against
$Sh$
is plotted against $Ra$
(figure 3
a), two main phases can be distinguished. Firstly, an initial transient stabilises to a plateau value which reads
$Ra$
(figure 3
a), two main phases can be distinguished. Firstly, an initial transient stabilises to a plateau value which reads $Sh=2{S^{\ast }}^{2}$
for pure diffusive growth. For higher supersaturation
$Sh=2{S^{\ast }}^{2}$
for pure diffusive growth. For higher supersaturation $\unicode[STIX]{x1D701}$
, this plateau is expected to reach slightly higher values, as
$\unicode[STIX]{x1D701}$
, this plateau is expected to reach slightly higher values, as $S^{\ast }$
increases accordingly with
$S^{\ast }$
increases accordingly with $\unicode[STIX]{x1D701}$
, equation (2.3). Secondly, the rising part of the curve follows a power law
$\unicode[STIX]{x1D701}$
, equation (2.3). Secondly, the rising part of the curve follows a power law $Sh\propto Ra^{1/4}$
, which is the expected relation between
$Sh\propto Ra^{1/4}$
, which is the expected relation between $Sh$
and
$Sh$
and $Ra$
for natural convection around a sphere (see e.g. Potter & Riley Reference Potter and Riley1980; Bejan Reference Bejan1993). Further experimental confirmation of the presence and influence of natural convection is obtained by comparing the bubble growth in different geometrical configurations, such as the situation where the bubble grows underneath the substrate and where it grows between two horizontal parallel plates with a vertical separation of 1 mm (a distance approximately 2.5 times larger than the bubble detachment radius), figure 2(b). In the first case, an increase of the growth rate is still observed, but at a slower pace, which is to be expected because of the geometrical inversion of the problem where the buoyant depleted liquid needs to move sideways due to the presence of the substrate. In the second case, the growth rate starts to rise but decreases again as the bubble surface approaches the other wall, which inhibits the possibility of convection developing further. We anticipate the different configurations to affect the Riley scaling law, more precisely on the prefactor multiplying
$Ra$
for natural convection around a sphere (see e.g. Potter & Riley Reference Potter and Riley1980; Bejan Reference Bejan1993). Further experimental confirmation of the presence and influence of natural convection is obtained by comparing the bubble growth in different geometrical configurations, such as the situation where the bubble grows underneath the substrate and where it grows between two horizontal parallel plates with a vertical separation of 1 mm (a distance approximately 2.5 times larger than the bubble detachment radius), figure 2(b). In the first case, an increase of the growth rate is still observed, but at a slower pace, which is to be expected because of the geometrical inversion of the problem where the buoyant depleted liquid needs to move sideways due to the presence of the substrate. In the second case, the growth rate starts to rise but decreases again as the bubble surface approaches the other wall, which inhibits the possibility of convection developing further. We anticipate the different configurations to affect the Riley scaling law, more precisely on the prefactor multiplying $Ra^{1/4}$
. This power law has also been demonstrated for natural convection above and below a heated plate (Bejan Reference Bejan1993, chap. 7, § 7.3.3).
$Ra^{1/4}$
. This power law has also been demonstrated for natural convection above and below a heated plate (Bejan Reference Bejan1993, chap. 7, § 7.3.3).
3.1 Transition to convection-driven growth
To characterise the cross-over to convection-driven growth in experiments, we fit a horizontal line to the plateau region of the $Sh$
versus
$Sh$
versus $Ra$
curves (figure 3
a) and a
$Ra$
curves (figure 3
a) and a $1/4$
-power law to their rising part and assume that the transition takes place at the intersection of those two lines. The crossing
$1/4$
-power law to their rising part and assume that the transition takes place at the intersection of those two lines. The crossing $Ra_{c}$
can be directly associated with a bubble radius
$Ra_{c}$
can be directly associated with a bubble radius $R$
and thus directly translated to a transition time
$R$
and thus directly translated to a transition time $t_{conv}$
. Equivalently, we also fit a horizontal line to the plateau in the derivative curves in figure 2(a) and a best-fit ascending straight line on their slope, measuring their intersection. From there, we obtain
$t_{conv}$
. Equivalently, we also fit a horizontal line to the plateau in the derivative curves in figure 2(a) and a best-fit ascending straight line on their slope, measuring their intersection. From there, we obtain $x_{c}$
, which by its definition is easily converted to
$x_{c}$
, which by its definition is easily converted to $t_{conv}$
. The fitting of the plateau was sometimes troublesome due to its short duration and the proximity to the initial transient; for this reason, the determination of the transition
$t_{conv}$
. The fitting of the plateau was sometimes troublesome due to its short duration and the proximity to the initial transient; for this reason, the determination of the transition $Ra_{c}$
(or
$Ra_{c}$
(or $x_{c}$
) cannot be made very precisely, which explains the scatter in the data. The experimental points determined by the latter method appear to be more accurate than the ones obtained by the former. However, the spread in data remains within a reasonable tolerance of
$x_{c}$
) cannot be made very precisely, which explains the scatter in the data. The experimental points determined by the latter method appear to be more accurate than the ones obtained by the former. However, the spread in data remains within a reasonable tolerance of $\pm 5~\text{s}$
. Nonetheless, the cross-over
$\pm 5~\text{s}$
. Nonetheless, the cross-over $Ra_{c}$
values increase with increasing
$Ra_{c}$
values increase with increasing $\unicode[STIX]{x1D701}$
(see figure 3
b). The origin of this behaviour will be explained later in the text.
$\unicode[STIX]{x1D701}$
(see figure 3
b). The origin of this behaviour will be explained later in the text.
The gas-depleted region that develops around the bubble is subjected to an upward buoyant force due to its lower density compared to the fluid bulk. In order to estimate the force magnitude, we calculate the volume $V_{b}$
of the buoyant region determined by the spherical segment (of horizontal diameter
$V_{b}$
of the buoyant region determined by the spherical segment (of horizontal diameter $2R+2\unicode[STIX]{x1D6FF}$
and height
$2R+2\unicode[STIX]{x1D6FF}$
and height $2R+\unicode[STIX]{x1D6FF}$
) denoted by the dotted line in figure 1(b) minus the volume of the bubble. With the bubble radius and buoyant region growing as
$2R+\unicode[STIX]{x1D6FF}$
) denoted by the dotted line in figure 1(b) minus the volume of the bubble. With the bubble radius and buoyant region growing as $R\approx S^{\ast }\sqrt{2\mathit{D }c_{s}\unicode[STIX]{x1D701}~t/\unicode[STIX]{x1D70C}_{g}}$
and
$R\approx S^{\ast }\sqrt{2\mathit{D }c_{s}\unicode[STIX]{x1D701}~t/\unicode[STIX]{x1D70C}_{g}}$
and $\unicode[STIX]{x1D6FF}\approx \sqrt{\unicode[STIX]{x03C0}\mathit{D }t}$
, respectively, the buoyant volume is given by
$\unicode[STIX]{x1D6FF}\approx \sqrt{\unicode[STIX]{x03C0}\mathit{D }t}$
, respectively, the buoyant volume is given by
 $$\begin{eqnarray}V_{b}=\frac{1}{3}(\unicode[STIX]{x03C0}Dt)^{3/2}\left(24S^{\ast 2}\frac{c_{s}\unicode[STIX]{x1D701}}{\unicode[STIX]{x1D70C}_{g}}+9S^{\ast }\sqrt{\frac{2\unicode[STIX]{x03C0}c_{s}\unicode[STIX]{x1D701}}{\unicode[STIX]{x1D70C}_{g}}}+2\unicode[STIX]{x03C0}\right)\equiv f_{V}t^{3/2},\end{eqnarray}$$
where $f_{V}$
stands for a volumetric buoyant factor. We stress that
$f_{V}$
stands for a volumetric buoyant factor. We stress that $f_{V}$
is a dimensional constant that depends on the liquid–gas properties and, most importantly, on the supersaturation
$f_{V}$
is a dimensional constant that depends on the liquid–gas properties and, most importantly, on the supersaturation $\unicode[STIX]{x1D701}$
.
$\unicode[STIX]{x1D701}$
.
We then estimate the terminal rising velocity $u_{b}$
of the buoyant region by recognising that the only relevant forces acting upon it are buoyancy
$u_{b}$
of the buoyant region by recognising that the only relevant forces acting upon it are buoyancy $F_{b}$
and the viscous drag
$F_{b}$
and the viscous drag $F_{d}$
, which for definiteness we estimate from the Stokes’ flow. This last assumption is reasonable since the Reynolds number
$F_{d}$
, which for definiteness we estimate from the Stokes’ flow. This last assumption is reasonable since the Reynolds number $Re$
is small at all times, as we will see later. The small density difference and ‘quasi-static’ (extremely slow) growth of
$Re$
is small at all times, as we will see later. The small density difference and ‘quasi-static’ (extremely slow) growth of $V_{b}$
in the small supersatured regime result in a negligible acceleration, and therefore, negligible added mass force on
$V_{b}$
in the small supersatured regime result in a negligible acceleration, and therefore, negligible added mass force on $V_{b}$
. Hence, we define:
$V_{b}$
. Hence, we define:
 $$\begin{eqnarray}F_{b}=c_{s}\unicode[STIX]{x1D701}\unicode[STIX]{x1D706}_{c}\unicode[STIX]{x1D70C}_{m,0}gV_{b},\quad F_{d}=6\unicode[STIX]{x03C0}u_{b}(R+\unicode[STIX]{x1D6FF})\unicode[STIX]{x1D707},\end{eqnarray}$$
which once equated lead to
 $$\begin{eqnarray}u_{b}=\frac{c_{s}\unicode[STIX]{x1D701}\unicode[STIX]{x1D706}_{c}gV_{b}}{6\unicode[STIX]{x03C0}\unicode[STIX]{x1D708}(R+\unicode[STIX]{x1D6FF})}=\frac{c_{s}\unicode[STIX]{x1D701}\unicode[STIX]{x1D706}_{c}gf_{V}}{6\unicode[STIX]{x03C0}\unicode[STIX]{x1D708}(R+\unicode[STIX]{x1D6FF})}t^{3/2}.\end{eqnarray}$$
Note that, in the end, the final scaling is $u_{b}\propto t$
and that the expression presented above has been written as
$u_{b}\propto t$
and that the expression presented above has been written as $u_{b}\propto t^{3/2}/(R+\unicode[STIX]{x1D6FF})$
for convenience.
$u_{b}\propto t^{3/2}/(R+\unicode[STIX]{x1D6FF})$
for convenience.
The lighter liquid around the bubble will thus rise with the velocity $u_{b}$
which sets up a flow of similar magnitude over the substrate to which the bubble is attached. This will lead to a viscous boundary layer that is described by a Reynolds number
$u_{b}$
which sets up a flow of similar magnitude over the substrate to which the bubble is attached. This will lead to a viscous boundary layer that is described by a Reynolds number
 $$\begin{eqnarray}Re=\frac{u_{b}(R+\unicode[STIX]{x1D6FF})}{\unicode[STIX]{x1D708}}=\frac{c_{s}\unicode[STIX]{x1D701}\unicode[STIX]{x1D706}_{c}gV_{b}}{6\unicode[STIX]{x03C0}\unicode[STIX]{x1D708}^{2}}=\frac{c_{s}\unicode[STIX]{x1D701}\unicode[STIX]{x1D706}_{c}gf_{V}}{6\unicode[STIX]{x03C0}\unicode[STIX]{x1D708}^{2}}t^{3/2}.\end{eqnarray}$$
Only if the buoyant velocity $u_{b}$
is large enough to overcome the viscous velocity
$u_{b}$
is large enough to overcome the viscous velocity $\unicode[STIX]{x1D708}/(R+\unicode[STIX]{x1D6FF})$
in a boundary layer over a substrate of similar size as the buoyant volume will the liquid start to rise and convective mass transport begin to set in. This implies that
$\unicode[STIX]{x1D708}/(R+\unicode[STIX]{x1D6FF})$
in a boundary layer over a substrate of similar size as the buoyant volume will the liquid start to rise and convective mass transport begin to set in. This implies that $Re>1$
, and that the threshold value, i.e.
$Re>1$
, and that the threshold value, i.e. $Re\approx 1$
, marks the moment in time
$Re\approx 1$
, marks the moment in time $t_{conv}$
at which convection sets in,
$t_{conv}$
at which convection sets in,
 $$\begin{eqnarray}t_{conv}\approx \left(\frac{6\unicode[STIX]{x03C0}\unicode[STIX]{x1D708}^{2}}{c_{s}\unicode[STIX]{x1D701}\unicode[STIX]{x1D706}_{c}gf_{V}}\right)^{2/3}.\end{eqnarray}$$
If we consider a pure diffusive growth until the moment of transition, the crossing $Ra_{c}$
can be directly calculated by combining (2.3), (3.1) and (3.6),
$Ra_{c}$
can be directly calculated by combining (2.3), (3.1) and (3.6),
 $$\begin{eqnarray}Ra_{c}=\frac{48\unicode[STIX]{x03C0}\unicode[STIX]{x1D708}{S^{\ast }}^{3}}{Df_{V}}\left(\frac{2Dc_{s}\unicode[STIX]{x1D701}}{\unicode[STIX]{x1D70C}_{g}}\right)^{3/2},\end{eqnarray}$$
an expression which depends only on the properties of the solution and the supersaturation $\unicode[STIX]{x1D701}$
. Note that this occurs because we are performing a quasi-steady-state analysis on a growing bubble with a boundary layer that grows at the same pace. Incidentally, the Reynolds number defined in (3.5) can be easily interpreted as a Grashof number based on the length scale
$\unicode[STIX]{x1D701}$
. Note that this occurs because we are performing a quasi-steady-state analysis on a growing bubble with a boundary layer that grows at the same pace. Incidentally, the Reynolds number defined in (3.5) can be easily interpreted as a Grashof number based on the length scale $(V_{b}/6\unicode[STIX]{x03C0})^{1/3}$
. By the definition in (3.5), the higher the buoyant velocity
$(V_{b}/6\unicode[STIX]{x03C0})^{1/3}$
. By the definition in (3.5), the higher the buoyant velocity $u_{b}$
, the earlier and more intensified the onset of convection occurs and the more the mass transfer is enhanced.
$u_{b}$
, the earlier and more intensified the onset of convection occurs and the more the mass transfer is enhanced.
(a) Experimental and theoretical convection transition times $t_{conv}$
(solid symbols and solid lines, respectively) as functions of the supersaturation level
$t_{conv}$
(solid symbols and solid lines, respectively) as functions of the supersaturation level $\unicode[STIX]{x1D701}$
for
$\unicode[STIX]{x1D701}$
for $P_{0}=0.35~\text{MPa}$
(blue circles) and
$P_{0}=0.35~\text{MPa}$
(blue circles) and $P_{0}=0.65~\text{MPa}$
(red diamonds). Open symbols show the experimental detachment times
$P_{0}=0.65~\text{MPa}$
(red diamonds). Open symbols show the experimental detachment times $t_{det}$
, whereas the dashed line represents the theoretical one for a bubble growing until
$t_{det}$
, whereas the dashed line represents the theoretical one for a bubble growing until $R_{det}$
(2.2) following the growth law (2.3). Inset: detachment times of bubbles in the experiments by Bisperink & Prins (Reference Bisperink and Prins1994) (diamond) and Jones et al. (Reference Jones, Evans and Galvin1999b
) (square). They reported no influence of natural convection. (b) Theoretical cross-over
$R_{det}$
(2.2) following the growth law (2.3). Inset: detachment times of bubbles in the experiments by Bisperink & Prins (Reference Bisperink and Prins1994) (diamond) and Jones et al. (Reference Jones, Evans and Galvin1999b
) (square). They reported no influence of natural convection. (b) Theoretical cross-over $t_{conv}$
(solid) and detachment
$t_{conv}$
(solid) and detachment $t_{det}$
(dashed) times as function of the supersaturation
$t_{det}$
(dashed) times as function of the supersaturation $\unicode[STIX]{x1D701}$
for
$\unicode[STIX]{x1D701}$
for $\text{CO}_{2}$
(blue) and
$\text{CO}_{2}$
(blue) and $\text{N}_{2}$
(red) bubbles. For thick solid lines,
$\text{N}_{2}$
(red) bubbles. For thick solid lines, $P_{0}=0.65~\text{MPa}$
, and for thin solid ones,
$P_{0}=0.65~\text{MPa}$
, and for thin solid ones, $P_{0}=0.35~\text{MPa}$
. The detachment curves are calculated considering pure diffusive growth until a radius
$P_{0}=0.35~\text{MPa}$
. The detachment curves are calculated considering pure diffusive growth until a radius $R_{det}=500~\unicode[STIX]{x03BC}\text{m}$
(2.2), corresponding to a pit radius of
$R_{det}=500~\unicode[STIX]{x03BC}\text{m}$
(2.2), corresponding to a pit radius of $R_{p}=10~\unicode[STIX]{x03BC}\text{m}$
.
$R_{p}=10~\unicode[STIX]{x03BC}\text{m}$
.

In figures 3(b) and 4(a), we see that the cross-over time prediction agrees well with experimental measurements. In figure 3(b), there seems to be a slight dependence on $P_{0}$
which our model (3.7) does not account for. In figure 4(a) we also show, for reference, the experimental detachment times
$P_{0}$
which our model (3.7) does not account for. In figure 4(a) we also show, for reference, the experimental detachment times $t_{det}$
and the theoretical ones if the bubbles would have grown only by diffusion (2.3) to a radius of
$t_{det}$
and the theoretical ones if the bubbles would have grown only by diffusion (2.3) to a radius of $500~\unicode[STIX]{x03BC}\text{m}$
, i.e. the approximate detachment size (2.2) from a pit of
$500~\unicode[STIX]{x03BC}\text{m}$
, i.e. the approximate detachment size (2.2) from a pit of $R_{p}=10~\unicode[STIX]{x03BC}\text{m}$
. Furthermore, we include the detachment times of experiments by other authors (Bisperink & Prins Reference Bisperink and Prins1994; Jones et al.
Reference Jones, Evans and Galvin1999b
) who reported no influence of natural convection during bubble growth. Those times are only slightly larger than our prediction for
$R_{p}=10~\unicode[STIX]{x03BC}\text{m}$
. Furthermore, we include the detachment times of experiments by other authors (Bisperink & Prins Reference Bisperink and Prins1994; Jones et al.
Reference Jones, Evans and Galvin1999b
) who reported no influence of natural convection during bubble growth. Those times are only slightly larger than our prediction for $t_{conv}$
, which suggests that in their experiments there was not enough time to observe this phenomenon. In addition, at higher supersaturation values (such as in those studies) the advective flow induced by the expanding bubble surface is no longer negligible and could possibly overwhelm the influence of natural convection.
$t_{conv}$
, which suggests that in their experiments there was not enough time to observe this phenomenon. In addition, at higher supersaturation values (such as in those studies) the advective flow induced by the expanding bubble surface is no longer negligible and could possibly overwhelm the influence of natural convection.
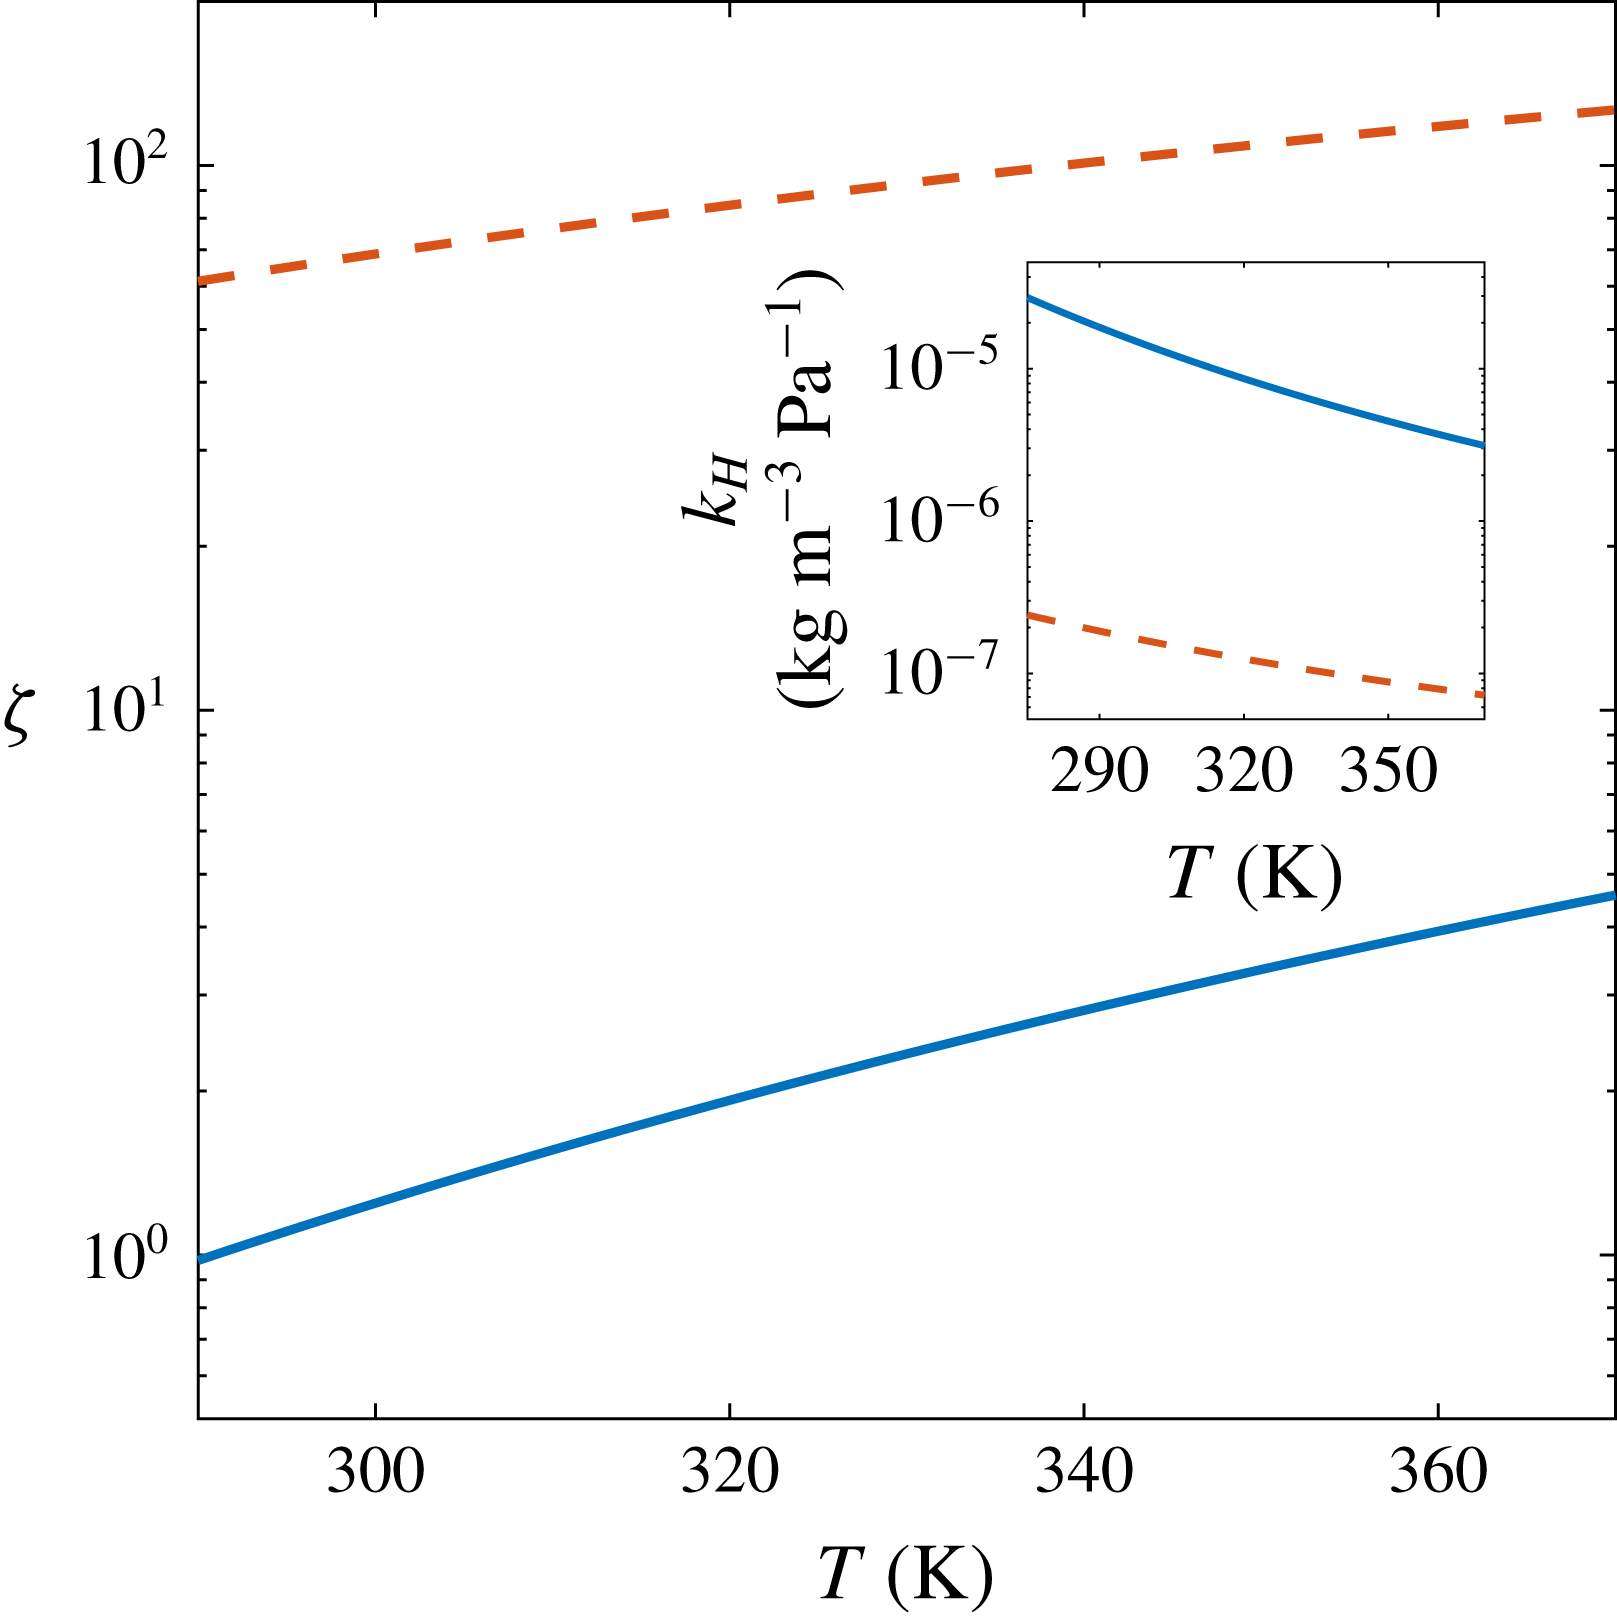
To analyse the supersaturation range in which convection may become dominant, we compare the Sherwood number $Sh$
(3.1) with the Péclet number
$Sh$
(3.1) with the Péclet number $Pe=2R{\dot{R}}/D$
, i.e. we compare advective mass transport to the total mass transport:
$Pe=2R{\dot{R}}/D$
, i.e. we compare advective mass transport to the total mass transport:
 $$\begin{eqnarray}\frac{Pe}{Sh}=\frac{c_{s}\unicode[STIX]{x1D701}}{\unicode[STIX]{x1D70C}_{g}}=\unicode[STIX]{x1D701}k_{H}r_{\text{CO}_{2}}T,\end{eqnarray}$$
where we have used both Henry’s law and the ideal gas law. Here the specific gas constant for $\text{CO}_{2}$
equals
$\text{CO}_{2}$
equals $r_{\text{CO}_{2}}=188.95~\text{J}~\text{kg}~\text{K}^{-1}$
. A necessary condition for natural convection to eventually become dominant is that
$r_{\text{CO}_{2}}=188.95~\text{J}~\text{kg}~\text{K}^{-1}$
. A necessary condition for natural convection to eventually become dominant is that $Pe/Sh<1$
, i.e. that advective transport is less relevant than the total mass transfer process including natural convection. Importantly, the threshold only depends on the specific gas, the supersaturation level
$Pe/Sh<1$
, i.e. that advective transport is less relevant than the total mass transfer process including natural convection. Importantly, the threshold only depends on the specific gas, the supersaturation level $\unicode[STIX]{x1D701}$
and the temperature
$\unicode[STIX]{x1D701}$
and the temperature $T$
. In figure 5 we show the temperature dependence of the values of
$T$
. In figure 5 we show the temperature dependence of the values of $\unicode[STIX]{x1D701}$
corresponding to
$\unicode[STIX]{x1D701}$
corresponding to $Pe/Sh=1$
and of
$Pe/Sh=1$
and of $k_{H}$
. At our experimental temperature (
$k_{H}$
. At our experimental temperature ( $T\approx 293~\text{K}$
), convection becomes dominant for supersaturation levels below
$T\approx 293~\text{K}$
), convection becomes dominant for supersaturation levels below $\unicode[STIX]{x1D701}=1.08$
, including the entire range of our experiments. Therefore, we always observe a transition to density-driven convection during bubble growth. Larger
$\unicode[STIX]{x1D701}=1.08$
, including the entire range of our experiments. Therefore, we always observe a transition to density-driven convection during bubble growth. Larger $\unicode[STIX]{x1D701}$
may then cause advective effects due to the bubble interface expansion and detachment to set in earlier than natural convection. The experiments from Bisperink & Prins (Reference Bisperink and Prins1994) and Jones et al. (Reference Jones, Evans and Galvin1999b
) had supersaturations of 1.78 and 1.07, with corresponding temperatures of 294 and 299 K. For these,
$\unicode[STIX]{x1D701}$
may then cause advective effects due to the bubble interface expansion and detachment to set in earlier than natural convection. The experiments from Bisperink & Prins (Reference Bisperink and Prins1994) and Jones et al. (Reference Jones, Evans and Galvin1999b
) had supersaturations of 1.78 and 1.07, with corresponding temperatures of 294 and 299 K. For these, $Pe/Sh=1.65$
and 0.88, respectively, which puts them very close to the limit where, given enough time and experimental precision, convection might have been noticeable.
$Pe/Sh=1.65$
and 0.88, respectively, which puts them very close to the limit where, given enough time and experimental precision, convection might have been noticeable.
Values of $\unicode[STIX]{x1D701}$
for which
$\unicode[STIX]{x1D701}$
for which $Pe/Sh=1$
and (inset) Henry’s constant
$Pe/Sh=1$
and (inset) Henry’s constant $k_{H}$
in water as function of temperature for
$k_{H}$
in water as function of temperature for $\text{CO}_{2}$
(solid blue lines) and
$\text{CO}_{2}$
(solid blue lines) and $\text{N}_{2}$
(dashed red lines). In both cases, the region
$\text{N}_{2}$
(dashed red lines). In both cases, the region $Pe/Sh<1$
is below the respective curve.
$Pe/Sh<1$
is below the respective curve.
3.2 Effect of the initial saturation pressure
$P_{0}$
on the transition to convection

As already indicated, the gas concentration in a liquid $c_{0}$
depends on the properties of the gas–liquid couple, the temperature
$c_{0}$
depends on the properties of the gas–liquid couple, the temperature $T$
and the saturation pressure
$T$
and the saturation pressure $P_{0}$
. At constant
$P_{0}$
. At constant $T$
,
$T$
, $c_{s}$
is directly proportional to
$c_{s}$
is directly proportional to $P_{s}$
, and therefore the supersaturation level
$P_{s}$
, and therefore the supersaturation level $\unicode[STIX]{x1D701}$
can be easily controlled by pressure change. The time evolution of the radius in the diffusive regime is fixed by providing
$\unicode[STIX]{x1D701}$
can be easily controlled by pressure change. The time evolution of the radius in the diffusive regime is fixed by providing $\unicode[STIX]{x1D701}$
(Epstein & Plesset Reference Epstein and Plesset1950; Enríquez et al.
Reference Enríquez, Sun, Lohse, Prosperetti and van der Meer2014; Moreno Soto et al.
Reference Moreno Soto, Prosperetti, Lohse and van der Meer2017). This can be easily realised by noting that in (1.1) and (2.3), the factor
$\unicode[STIX]{x1D701}$
(Epstein & Plesset Reference Epstein and Plesset1950; Enríquez et al.
Reference Enríquez, Sun, Lohse, Prosperetti and van der Meer2014; Moreno Soto et al.
Reference Moreno Soto, Prosperetti, Lohse and van der Meer2017). This can be easily realised by noting that in (1.1) and (2.3), the factor $c_{s}\unicode[STIX]{x1D701}/\unicode[STIX]{x1D70C}_{g}=\unicode[STIX]{x1D701}k_{H}rT$
depends on
$c_{s}\unicode[STIX]{x1D701}/\unicode[STIX]{x1D70C}_{g}=\unicode[STIX]{x1D701}k_{H}rT$
depends on $\unicode[STIX]{x1D701}$
. The situation is different in the case of buoyancy. Since the buoyant force is directly determined by the density difference
$\unicode[STIX]{x1D701}$
. The situation is different in the case of buoyancy. Since the buoyant force is directly determined by the density difference $\unicode[STIX]{x0394}\unicode[STIX]{x1D70C}=\unicode[STIX]{x1D70C}_{m,0}\unicode[STIX]{x1D706}_{c}c_{s}\unicode[STIX]{x1D701}=\unicode[STIX]{x1D70C}_{m,0}\unicode[STIX]{x1D706}_{c}\unicode[STIX]{x1D701}k_{H}P_{s}$
, its effect is expected to depend on both the supersaturation
$\unicode[STIX]{x0394}\unicode[STIX]{x1D70C}=\unicode[STIX]{x1D70C}_{m,0}\unicode[STIX]{x1D706}_{c}c_{s}\unicode[STIX]{x1D701}=\unicode[STIX]{x1D70C}_{m,0}\unicode[STIX]{x1D706}_{c}\unicode[STIX]{x1D701}k_{H}P_{s}$
, its effect is expected to depend on both the supersaturation $\unicode[STIX]{x1D701}$
and the pressure
$\unicode[STIX]{x1D701}$
and the pressure $P_{s}$
(or, alternatively,
$P_{s}$
(or, alternatively, $P_{0}$
). This implies that, when by fixing
$P_{0}$
). This implies that, when by fixing $\unicode[STIX]{x1D701}$
the zeroth-order diffusive bubble growth is fixed, the time for convection to set in should still depend on the absolute pressure values.
$\unicode[STIX]{x1D701}$
the zeroth-order diffusive bubble growth is fixed, the time for convection to set in should still depend on the absolute pressure values.
(a) Derivative of the dimensionless bubble radius $\unicode[STIX]{x1D716}$
against the dimensionless time
$\unicode[STIX]{x1D716}$
against the dimensionless time $x$
for experiments with different
$x$
for experiments with different $P_{0}$
but same
$P_{0}$
but same $\unicode[STIX]{x1D701}\approx 0.15$
and
$\unicode[STIX]{x1D701}\approx 0.15$
and $R_{p}=50~\unicode[STIX]{x03BC}\text{m}$
. The corresponding coloured dashed vertical lines stand for the theoretical
$R_{p}=50~\unicode[STIX]{x03BC}\text{m}$
. The corresponding coloured dashed vertical lines stand for the theoretical $t_{conv}$
, whereas the solid lines indicate the experimentally measured one. The guidelines to calculate the latter are indicated as dotted lines for
$t_{conv}$
, whereas the solid lines indicate the experimentally measured one. The guidelines to calculate the latter are indicated as dotted lines for $P_{0}=0.8~\text{MPa}$
. The horizontal black dashed line indicates the theoretical behaviour for pure diffusion according to (2.3) (Enríquez et al.
Reference Enríquez, Sun, Lohse, Prosperetti and van der Meer2014). Note that for purely diffusively growing bubbles, the experimental curves would be expected to coincide. (b)
$P_{0}=0.8~\text{MPa}$
. The horizontal black dashed line indicates the theoretical behaviour for pure diffusion according to (2.3) (Enríquez et al.
Reference Enríquez, Sun, Lohse, Prosperetti and van der Meer2014). Note that for purely diffusively growing bubbles, the experimental curves would be expected to coincide. (b) $Sh$
versus
$Sh$
versus $Ra$
for the first bubble after the pressure decrease at different
$Ra$
for the first bubble after the pressure decrease at different $P_{0}$
and
$P_{0}$
and $\unicode[STIX]{x1D701}=0.15$
in logarithmic scale. The differences present in (a) are directly translated and better visualised in this representation, where for the same
$\unicode[STIX]{x1D701}=0.15$
in logarithmic scale. The differences present in (a) are directly translated and better visualised in this representation, where for the same $Ra$
,
$Ra$
, $Sh$
, i.e. the dimensionless mass transfer, increases with higher
$Sh$
, i.e. the dimensionless mass transfer, increases with higher $P_{0}$
. A
$P_{0}$
. A $1/4$
power law has been fitted to one of the experimental curves for comparison with the natural convective behaviour. The transition
$1/4$
power law has been fitted to one of the experimental curves for comparison with the natural convective behaviour. The transition $Ra_{c}$
is calculated as the intersection with the horizontal dotted line which represents a purely diffusive growth. The vertical solid lines in corresponding colour indicate the different
$Ra_{c}$
is calculated as the intersection with the horizontal dotted line which represents a purely diffusive growth. The vertical solid lines in corresponding colour indicate the different $Ra_{c}$
for each curve. The same colour palette in (a) applies to (b).
$Ra_{c}$
for each curve. The same colour palette in (a) applies to (b).
To analyse this phenomenon, we performed experiments at a constant supersaturation level $\unicode[STIX]{x1D701}=0.15\pm 0.02$
but initially saturating the solution at a different
$\unicode[STIX]{x1D701}=0.15\pm 0.02$
but initially saturating the solution at a different $P_{0}$
. Consequently, the pressure drop to
$P_{0}$
. Consequently, the pressure drop to $P_{s}=P_{0}/(\unicode[STIX]{x1D701}+1)$
is defined from (2.1). Figure 6(a) shows some representative curves of the derivatives of the dimensionless radius
$P_{s}=P_{0}/(\unicode[STIX]{x1D701}+1)$
is defined from (2.1). Figure 6(a) shows some representative curves of the derivatives of the dimensionless radius $\unicode[STIX]{x1D716}$
with respect to the dimensionless time
$\unicode[STIX]{x1D716}$
with respect to the dimensionless time $x$
for three different initial saturation pressures
$x$
for three different initial saturation pressures $P_{0}$
. The influence of the onset of convection is evident: not only do we observe a shift in the onset time, but even more importantly, the plateau that represents diffusion reaching a higher value for higher
$P_{0}$
. The influence of the onset of convection is evident: not only do we observe a shift in the onset time, but even more importantly, the plateau that represents diffusion reaching a higher value for higher $P_{0}$
, which indicates an intensified diffusive growth rate associated with larger concentration differences (but still of the same order of
$P_{0}$
, which indicates an intensified diffusive growth rate associated with larger concentration differences (but still of the same order of $S^{\ast }$
). The slope of the convective portion of each curve also increases with
$S^{\ast }$
). The slope of the convective portion of each curve also increases with $P_{0}$
, as can be determined by examining figure 6(b). In the latter, the data from figure 6(a) are replotted in dimensionless form as
$P_{0}$
, as can be determined by examining figure 6(b). In the latter, the data from figure 6(a) are replotted in dimensionless form as $Sh$
versus
$Sh$
versus $Ra$
. Clearly, for the same
$Ra$
. Clearly, for the same $Ra$
,
$Ra$
, $Sh$
is larger at higher
$Sh$
is larger at higher $P_{0}$
, indicating a stronger convection and an earlier onset. This intensification of the convective regime with increasing
$P_{0}$
, indicating a stronger convection and an earlier onset. This intensification of the convective regime with increasing $P_{0}$
originates from the larger concentration change (and consequently, the larger solution density variation) to achieve a constant supersaturation level. Thus according to (3.4), the buoyant velocity
$P_{0}$
originates from the larger concentration change (and consequently, the larger solution density variation) to achieve a constant supersaturation level. Thus according to (3.4), the buoyant velocity $u_{b}$
increases with
$u_{b}$
increases with $P_{0}$
, which results in a stronger convection and an earlier transition time
$P_{0}$
, which results in a stronger convection and an earlier transition time $t_{conv}$
. However, as reflected in (3.7), the pressure dependence disappears when defining
$t_{conv}$
. However, as reflected in (3.7), the pressure dependence disappears when defining $Ra_{c}$
, as the increase in the concentration difference and expansion of the buoyant depleted volume is counteracted by a faster transition time
$Ra_{c}$
, as the increase in the concentration difference and expansion of the buoyant depleted volume is counteracted by a faster transition time $t_{conv}$
. The discrepancies in this aspect observed in figure 6(b) still lie within our experimental error.
$t_{conv}$
. The discrepancies in this aspect observed in figure 6(b) still lie within our experimental error.
(a) Value of $t_{conv}$
for the different initial saturation pressure
$t_{conv}$
for the different initial saturation pressure $P_{0}$
at
$P_{0}$
at $\unicode[STIX]{x1D701}=0.15$
. Experiments are represented by error bars, whereas the theoretical estimation (3.9) is plotted as a solid blue line. Despite the imprecisions in the experimental measurements, especially for lower
$\unicode[STIX]{x1D701}=0.15$
. Experiments are represented by error bars, whereas the theoretical estimation (3.9) is plotted as a solid blue line. Despite the imprecisions in the experimental measurements, especially for lower $P_{0}$
, theory agrees qualitatively with experiments, i.e.
$P_{0}$
, theory agrees qualitatively with experiments, i.e. $t_{conv}$
decreases with increasing
$t_{conv}$
decreases with increasing $P_{0}$
. (b) Effect of depletion on the transitional time to convection
$P_{0}$
. (b) Effect of depletion on the transitional time to convection $\tilde{t}_{conv}$
. Blue circles correspond to
$\tilde{t}_{conv}$
. Blue circles correspond to $P_{0}=0.3~\text{MPa}$
, whereas red diamonds refer to
$P_{0}=0.3~\text{MPa}$
, whereas red diamonds refer to $P_{0}=0.7~\text{MPa}$
. For both curves,
$P_{0}=0.7~\text{MPa}$
. For both curves, $\unicode[STIX]{x1D701}=0.15$
. Note that the numbers in the
$\unicode[STIX]{x1D701}=0.15$
. Note that the numbers in the $x$
-axis are presented in decreasing order. Even though theory (solid lines) indicates a gradual delay in
$x$
-axis are presented in decreasing order. Even though theory (solid lines) indicates a gradual delay in $\tilde{t}_{conv}$
, experiments show an intensified effect.
$\tilde{t}_{conv}$
, experiments show an intensified effect.
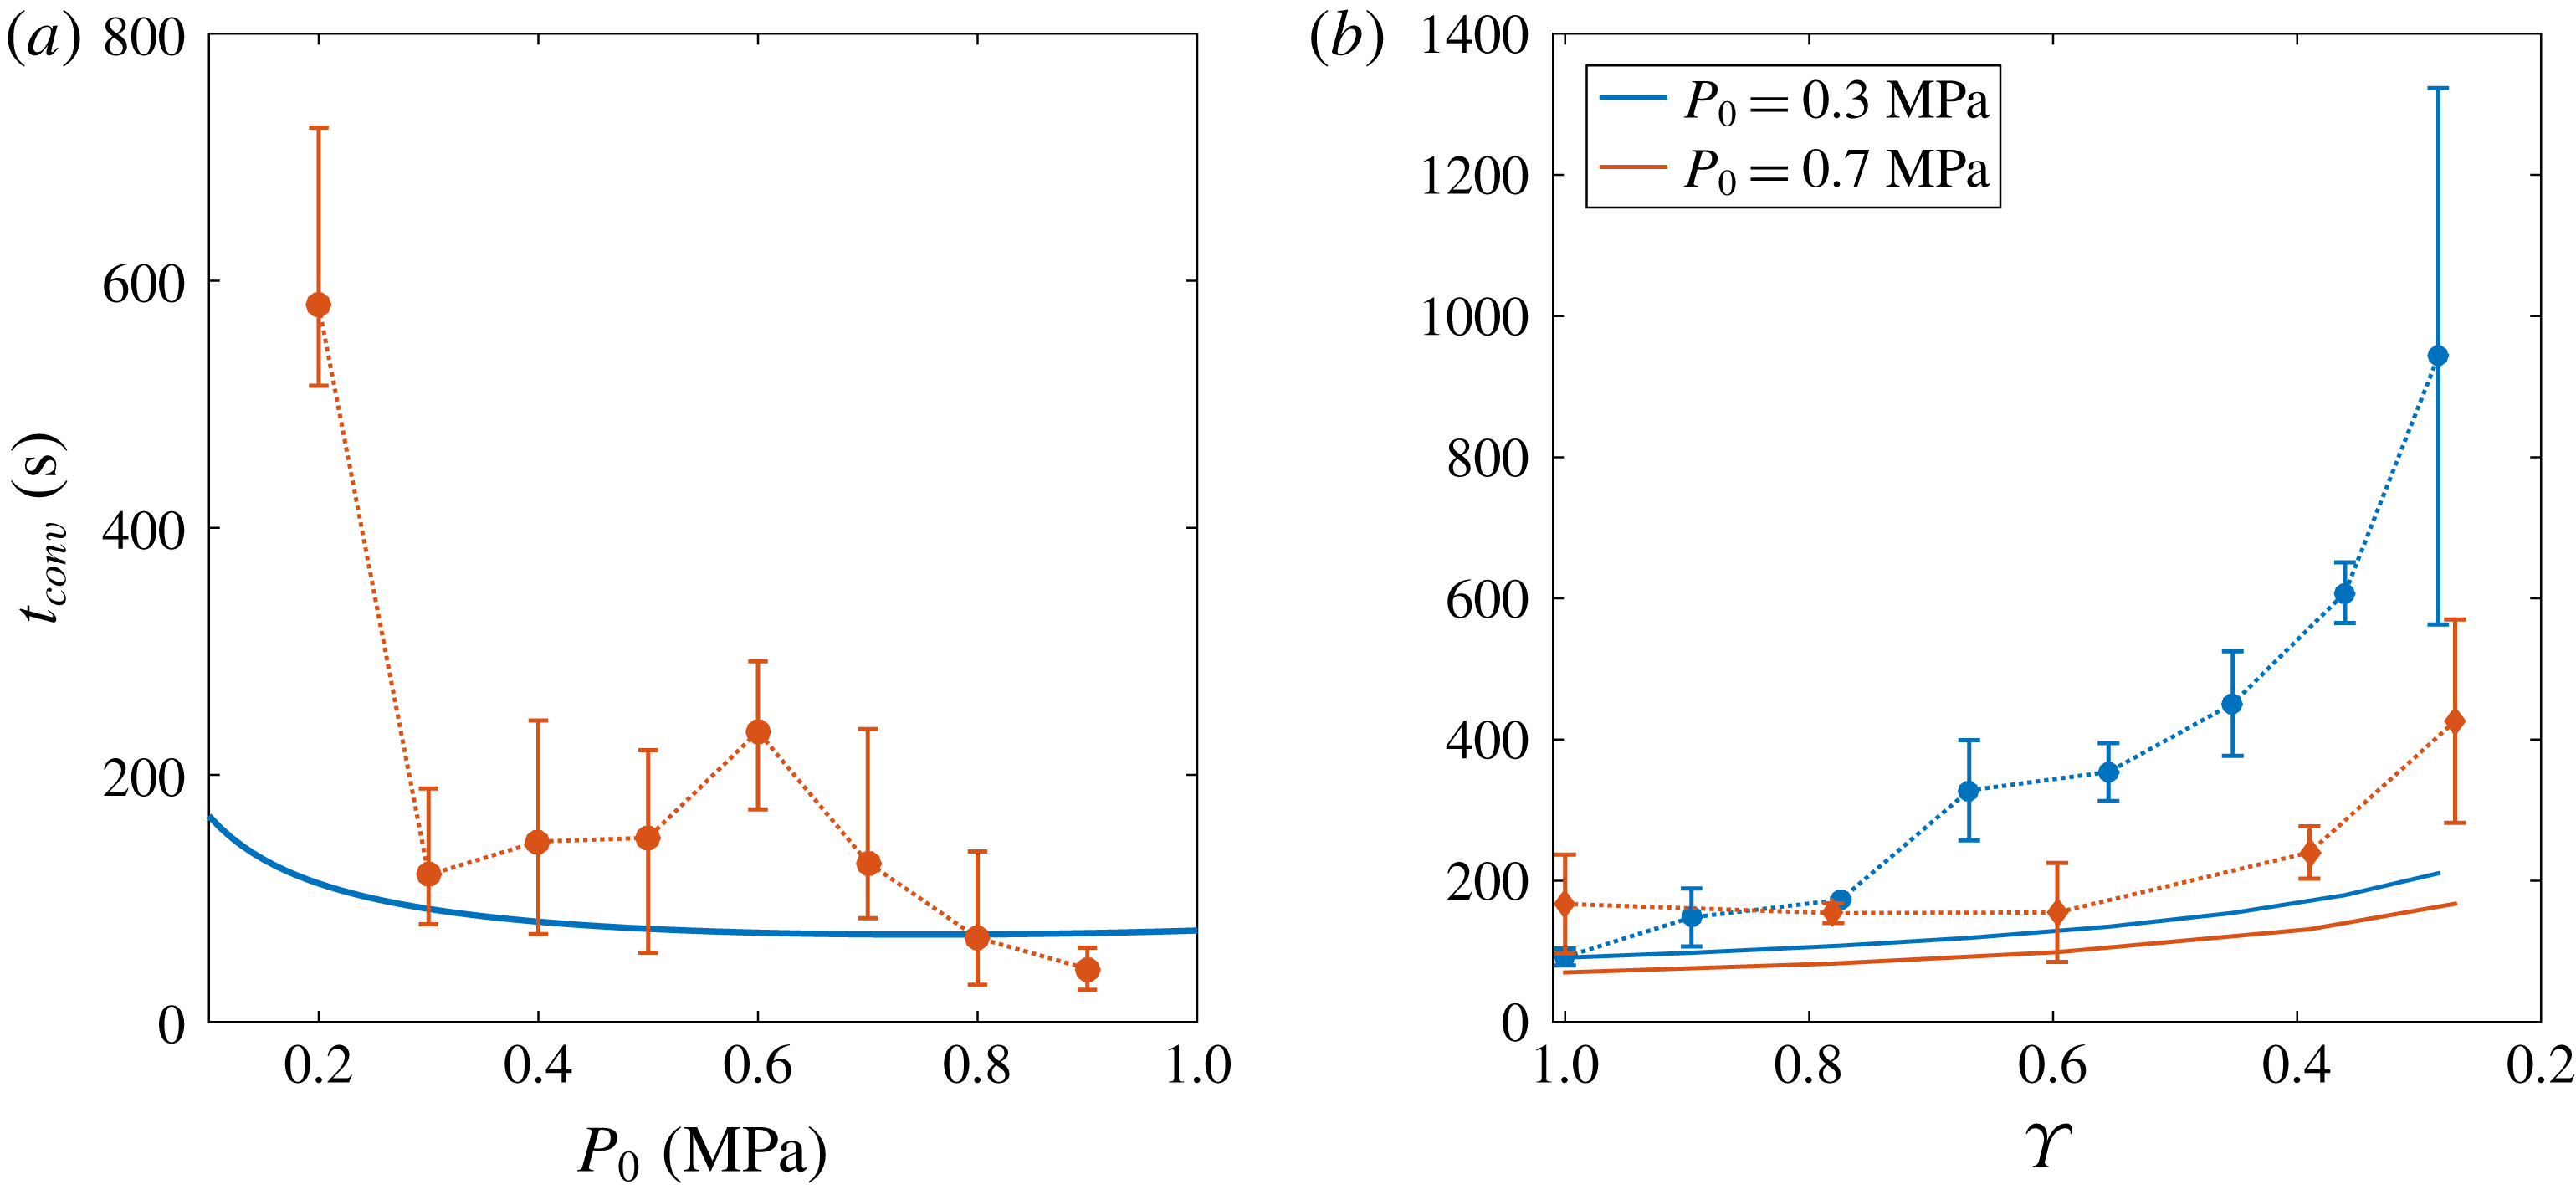
Turning to the prediction (3.6), we observe that $t_{conv}$
is inversely proportional to the gas concentration difference
$t_{conv}$
is inversely proportional to the gas concentration difference $c_{s}\unicode[STIX]{x1D701}$
. By applying Henry’s law, it can be rewritten as
$c_{s}\unicode[STIX]{x1D701}$
. By applying Henry’s law, it can be rewritten as $c_{s}\unicode[STIX]{x1D701}=k_{H}P_{0}\unicode[STIX]{x1D701}/(\unicode[STIX]{x1D701}+1)$
. Thus, we may reformulate the approximate model (3.6) and obtain:
$c_{s}\unicode[STIX]{x1D701}=k_{H}P_{0}\unicode[STIX]{x1D701}/(\unicode[STIX]{x1D701}+1)$
. Thus, we may reformulate the approximate model (3.6) and obtain:
 $$\begin{eqnarray}t_{conv}\approx \left(\frac{6\unicode[STIX]{x03C0}\unicode[STIX]{x1D708}^{2}}{k_{H}P_{0}\left({\displaystyle \frac{\unicode[STIX]{x1D701}}{\unicode[STIX]{x1D701}+1}}\right)\unicode[STIX]{x1D706}_{c}gf_{V}}\right)^{2/3}.\end{eqnarray}$$
Note that the volumetric buoyant factor $f_{V}$
(3.2) also depends slightly on
$f_{V}$
(3.2) also depends slightly on $P_{0}$
as the product
$P_{0}$
as the product $c_{s}\unicode[STIX]{x1D701}/\unicode[STIX]{x1D70C}_{g}$
in its definition refers to a difference in concentration
$c_{s}\unicode[STIX]{x1D701}/\unicode[STIX]{x1D70C}_{g}$
in its definition refers to a difference in concentration $(c_{0}-c_{s})$
, where
$(c_{0}-c_{s})$
, where $c_{0}$
is directly proportional to
$c_{0}$
is directly proportional to $P_{0}$
, divided by the gas density, which also depends on this pressure. The experimental results are plotted in figure 7(a). Despite the difficulties in measuring a proper
$P_{0}$
, divided by the gas density, which also depends on this pressure. The experimental results are plotted in figure 7(a). Despite the difficulties in measuring a proper $t_{conv}$
, especially for the lower values of
$t_{conv}$
, especially for the lower values of $P_{0}$
in which there is not a clear transition towards convection, theory and experiments follow the same trend and qualitatively agree, i.e.
$P_{0}$
in which there is not a clear transition towards convection, theory and experiments follow the same trend and qualitatively agree, i.e. $t_{conv}$
decreases with increasing
$t_{conv}$
decreases with increasing $P_{0}$
.
$P_{0}$
.
3.3 Long-term effects on the convective transition during a single bubble succession
(a) Evolution of the depletion number $\unicode[STIX]{x1D6F6}$
in time with different supersaturation level
$\unicode[STIX]{x1D6F6}$
in time with different supersaturation level $\unicode[STIX]{x1D701}$
and fixed
$\unicode[STIX]{x1D701}$
and fixed $P_{0}=0.9~\text{MPa}$
. An evident faster depletion occurs with larger
$P_{0}=0.9~\text{MPa}$
. An evident faster depletion occurs with larger $\unicode[STIX]{x1D701}$
. The solid line stands for the theoretical behaviour by Moreno Soto et al. (Reference Moreno Soto, Prosperetti, Lohse and van der Meer2017) with
$\unicode[STIX]{x1D701}$
. The solid line stands for the theoretical behaviour by Moreno Soto et al. (Reference Moreno Soto, Prosperetti, Lohse and van der Meer2017) with $\unicode[STIX]{x1D6FC}=0.42$
for the case
$\unicode[STIX]{x1D6FC}=0.42$
for the case $\unicode[STIX]{x1D701}=0.25$
. (b) Evolution of
$\unicode[STIX]{x1D701}=0.25$
. (b) Evolution of $\unicode[STIX]{x1D6F6}$
in time for different starting saturation pressure
$\unicode[STIX]{x1D6F6}$
in time for different starting saturation pressure $P_{0}$
and
$P_{0}$
and $\unicode[STIX]{x1D701}=0.15$
. The experimental results make it reasonable to suggest that
$\unicode[STIX]{x1D701}=0.15$
. The experimental results make it reasonable to suggest that $P_{0}$
, and therefore the intensity of the transition to convection, plays a secondary role in the speed of depletion.
$P_{0}$
, and therefore the intensity of the transition to convection, plays a secondary role in the speed of depletion.
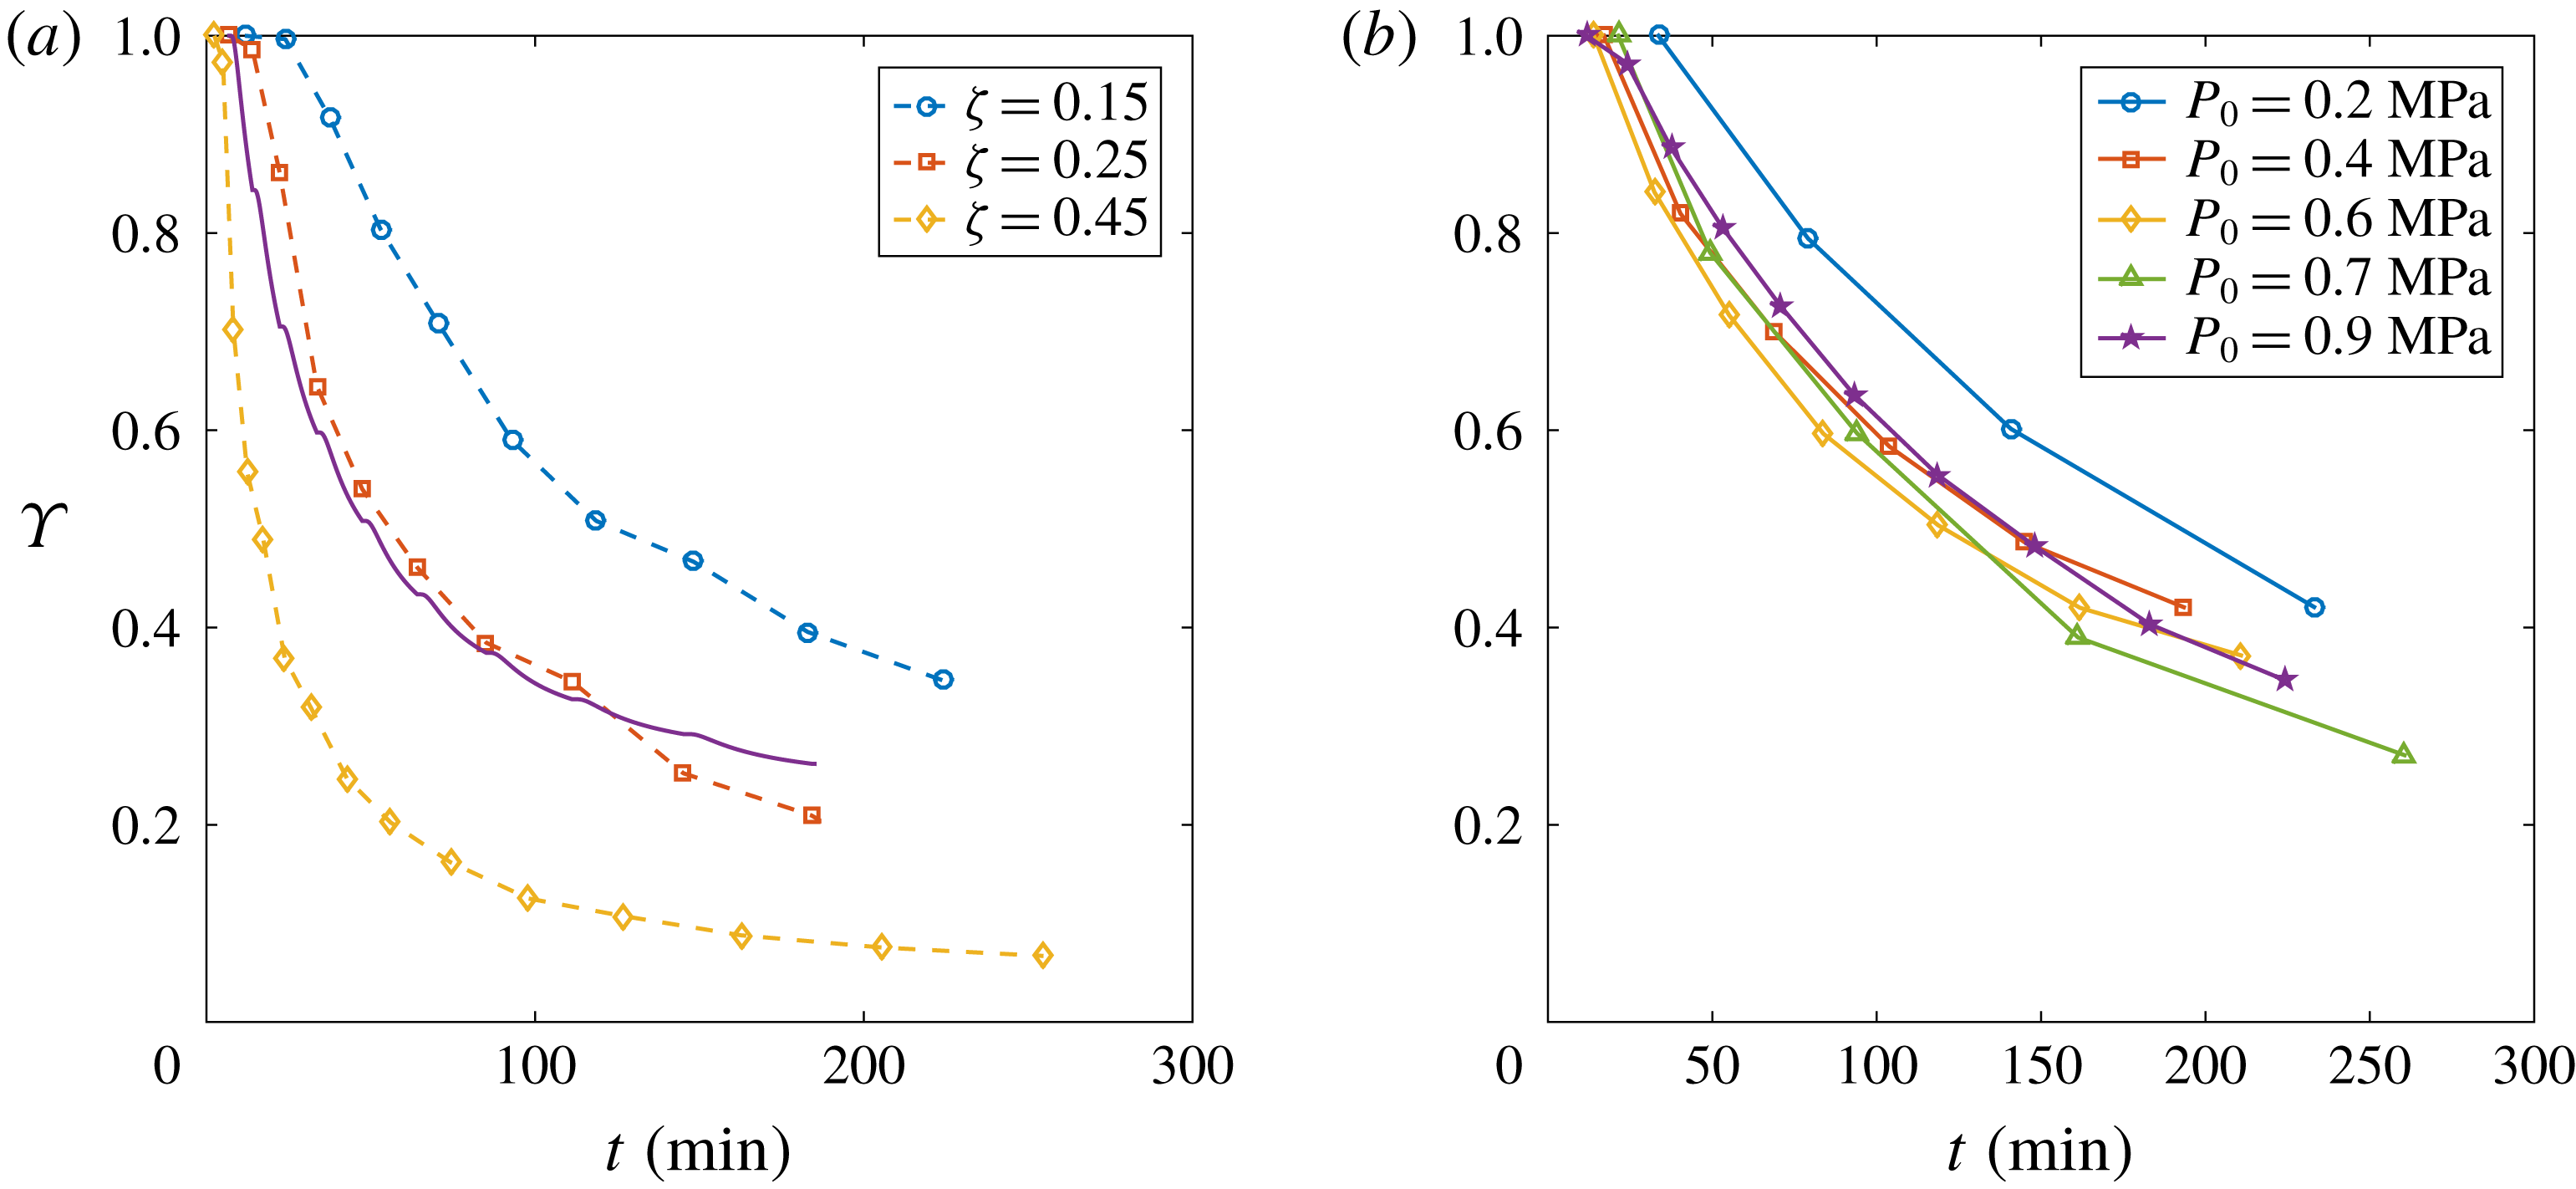
As singles bubbles grow in succession, they will suffer the accumulated depletion which originates from the previous bubbles absorbing the gas from their surroundings. This cumulative depletion remarkably affects subsequent bubbles and significantly delays their growth rate and inhibits the transition to convection (Moreno Soto et al.
Reference Moreno Soto, Prosperetti, Lohse and van der Meer2017). We account for the effect of depletion by defining the discrete depletion number $\unicode[STIX]{x1D6F6}_{n}$
:
$\unicode[STIX]{x1D6F6}_{n}$
:
 $$\begin{eqnarray}\unicode[STIX]{x1D6F6}_{n}=\frac{\tilde{c}_{n}-c_{s}}{c_{0}-c_{s}},\end{eqnarray}$$
where $\tilde{c}_{n}$
is the apparent bulk concentration that the
$\tilde{c}_{n}$
is the apparent bulk concentration that the $n$
th bubble in the succession observes. By definition, the first bubble in the succession,
$n$
th bubble in the succession observes. By definition, the first bubble in the succession, $n=1$
, grows in a non-depleted domain and therefore,
$n=1$
, grows in a non-depleted domain and therefore, $\unicode[STIX]{x1D6F6}_{1}=1$
. The subsequent values of
$\unicode[STIX]{x1D6F6}_{1}=1$
. The subsequent values of $\unicode[STIX]{x1D6F6}_{n}$
are calculated by collapsing the different curves
$\unicode[STIX]{x1D6F6}_{n}$
are calculated by collapsing the different curves $Sh_{n}$
versus
$Sh_{n}$
versus $Ra_{n}$
into one universal curve
$Ra_{n}$
into one universal curve $\widetilde{Sh}=f(\unicode[STIX]{x1D6F6}_{n},\widetilde{Ra})$
, where
$\widetilde{Sh}=f(\unicode[STIX]{x1D6F6}_{n},\widetilde{Ra})$
, where $\widetilde{Sh}=Sh_{n}/\unicode[STIX]{x1D6F6}_{n}$
and
$\widetilde{Sh}=Sh_{n}/\unicode[STIX]{x1D6F6}_{n}$
and $\widetilde{Ra}=Ra_{n}\unicode[STIX]{x1D6F6}_{n}$
, following the approach of Moreno Soto et al. (Reference Moreno Soto, Prosperetti, Lohse and van der Meer2017), who also calculated a simplified analytical expression for
$\widetilde{Ra}=Ra_{n}\unicode[STIX]{x1D6F6}_{n}$
, following the approach of Moreno Soto et al. (Reference Moreno Soto, Prosperetti, Lohse and van der Meer2017), who also calculated a simplified analytical expression for $\unicode[STIX]{x1D6F6}_{n}$
. By obtaining the different values of
$\unicode[STIX]{x1D6F6}_{n}$
. By obtaining the different values of $\unicode[STIX]{x1D6F6}_{n}$
, figure 8, different responses can be identified. Firstly, increasing the supersaturation level
$\unicode[STIX]{x1D6F6}_{n}$
, figure 8, different responses can be identified. Firstly, increasing the supersaturation level $\unicode[STIX]{x1D701}$
at the same starting
$\unicode[STIX]{x1D701}$
at the same starting $P_{0}$
results in a faster depletion, and therefore,
$P_{0}$
results in a faster depletion, and therefore, $\unicode[STIX]{x1D6F6}$
decreases faster, as can be seen in figure 8(a). Secondly, saturating the solution at different
$\unicode[STIX]{x1D6F6}$
decreases faster, as can be seen in figure 8(a). Secondly, saturating the solution at different $P_{0}$
does not play a significant role in the evolution of
$P_{0}$
does not play a significant role in the evolution of $\unicode[STIX]{x1D6F6}$
, figure 8(b). In general, it is true that higher
$\unicode[STIX]{x1D6F6}$
, figure 8(b). In general, it is true that higher $P_{0}$
results in a slightly slower depletion, except for the case of
$P_{0}$
results in a slightly slower depletion, except for the case of $P_{0}=0.2~\text{MPa}$
, in which depletion is much slower than in the others. We identify this effect as originating from the difficulty in achieving a specific value of
$P_{0}=0.2~\text{MPa}$
, in which depletion is much slower than in the others. We identify this effect as originating from the difficulty in achieving a specific value of $\unicode[STIX]{x1D701}$
, which becomes more challenging at lower
$\unicode[STIX]{x1D701}$
, which becomes more challenging at lower $P_{0}$
.
$P_{0}$
.
Depletion also affects the time at which convection sets in. By assuming that the effective concentration difference $c_{s}\unicode[STIX]{x1D701}$
which affects the transition to convection is governed by the apparent bulk concentration
$c_{s}\unicode[STIX]{x1D701}$
which affects the transition to convection is governed by the apparent bulk concentration $\tilde{c}$
, equation (3.6) can be redefined as
$\tilde{c}$
, equation (3.6) can be redefined as
 $$\begin{eqnarray}\tilde{t}_{conv}\approx \left(\frac{6\unicode[STIX]{x03C0}\unicode[STIX]{x1D708}^{2}}{(\tilde{c}-c_{s})\unicode[STIX]{x1D706}_{c}gf_{V}}\right)^{2/3}=\left(\frac{6\unicode[STIX]{x03C0}\unicode[STIX]{x1D708}^{2}}{\unicode[STIX]{x1D6F6}c_{s}\unicode[STIX]{x1D701}\unicode[STIX]{x1D706}_{c}gf_{V}}\right)^{2/3}.\end{eqnarray}$$
This equation relates the delay in the transition to convection as depletion intensifies. We plot some experimental results and compare them to this theoretical expression in figure 7(b). Despite the toughness in calculating $\tilde{t}_{conv}$
, which becomes even more difficult as depletion increases and there is no longer a defined transition from plateau to slope in the curves
$\tilde{t}_{conv}$
, which becomes even more difficult as depletion increases and there is no longer a defined transition from plateau to slope in the curves $\text{d}\unicode[STIX]{x1D716}/\text{d}x(x)$
nor
$\text{d}\unicode[STIX]{x1D716}/\text{d}x(x)$
nor $Sh(Ra)$
(Moreno Soto et al.
Reference Moreno Soto, Prosperetti, Lohse and van der Meer2017), experimental results indicate a significant delay in the transitional time to convection, which is in accordance with (3.11).
$Sh(Ra)$
(Moreno Soto et al.
Reference Moreno Soto, Prosperetti, Lohse and van der Meer2017), experimental results indicate a significant delay in the transitional time to convection, which is in accordance with (3.11).
Derivative of the dimensionless bubble radius $\unicode[STIX]{x1D716}$
versus the dimensionless time
$\unicode[STIX]{x1D716}$
versus the dimensionless time $x$
for one
$x$
for one $\text{CO}_{2}$
(yellow squares) and two
$\text{CO}_{2}$
(yellow squares) and two $\text{N}_{2}$
(blue and red circles) bubbles. The vertical dashed lines in corresponding colours indicate the predicted convection cross-over times
$\text{N}_{2}$
(blue and red circles) bubbles. The vertical dashed lines in corresponding colours indicate the predicted convection cross-over times $x_{conv}$
for each case (refer to figure 4
b). The horizontal dashed line stands for (2.3).
$x_{conv}$
for each case (refer to figure 4
b). The horizontal dashed line stands for (2.3).
4 The case of
$\text{N}_{2}$
bubbles
 $\text{CO}_{2}$
is a gas with a very high solubility in water, indicated by Henry’s constant
$\text{CO}_{2}$
is a gas with a very high solubility in water, indicated by Henry’s constant $k_{H}$
, whereas
$k_{H}$
, whereas $\text{N}_{2}$
has a lower solubility (refer to table 1). The diffusivity
$\text{N}_{2}$
has a lower solubility (refer to table 1). The diffusivity $D$
and the expansion coefficient
$D$
and the expansion coefficient $\unicode[STIX]{x1D706}_{c}$
in aqueous solutions are however of the same order of magnitude (in absolute terms) for both gases. That
$\unicode[STIX]{x1D706}_{c}$
in aqueous solutions are however of the same order of magnitude (in absolute terms) for both gases. That $c_{s}$
is approximately one hundred times smaller for
$c_{s}$
is approximately one hundred times smaller for $\text{N}_{2}$
leads to a much smaller
$\text{N}_{2}$
leads to a much smaller $c_{s}\unicode[STIX]{x1D701}$
if the supersaturation
$c_{s}\unicode[STIX]{x1D701}$
if the supersaturation $\unicode[STIX]{x1D701}$
is the same as in the
$\unicode[STIX]{x1D701}$
is the same as in the $\text{CO}_{2}$
experiments. Consequently, since the radius grows as
$\text{CO}_{2}$
experiments. Consequently, since the radius grows as $R(t)\propto \sqrt{2Dc_{s}\unicode[STIX]{x1D701}~t/\unicode[STIX]{x1D70C}_{g}}$
,
$R(t)\propto \sqrt{2Dc_{s}\unicode[STIX]{x1D701}~t/\unicode[STIX]{x1D70C}_{g}}$
, $\text{N}_{2}$
bubbles grow more slowly and
$\text{N}_{2}$
bubbles grow more slowly and $t_{conv}$
is expected to be much larger. Figure 4(b) compares the theoretical cross-over
$t_{conv}$
is expected to be much larger. Figure 4(b) compares the theoretical cross-over $t_{conv}$
and detachment
$t_{conv}$
and detachment $t_{det}$
times for the two gases, showing the indeed much longer times to achieve convection and detachment for
$t_{det}$
times for the two gases, showing the indeed much longer times to achieve convection and detachment for $\text{N}_{2}$
. Our estimation of
$\text{N}_{2}$
. Our estimation of $t_{conv}$
remains valid for negative
$t_{conv}$
remains valid for negative $\unicode[STIX]{x1D706}_{c}$
, where in the final expression (3.6),
$\unicode[STIX]{x1D706}_{c}$
, where in the final expression (3.6), $\unicode[STIX]{x1D706}_{c}$
needs to be replaced with its absolute value
$\unicode[STIX]{x1D706}_{c}$
needs to be replaced with its absolute value $|\unicode[STIX]{x1D706}_{c}|$
. Some experimental
$|\unicode[STIX]{x1D706}_{c}|$
. Some experimental $\text{d}\unicode[STIX]{x1D716}/\text{d}x$
curves are shown in figure 9 along with a reference curve for
$\text{d}\unicode[STIX]{x1D716}/\text{d}x$
curves are shown in figure 9 along with a reference curve for $\text{CO}_{2}$
. Note that, although the time scales are very different in experiments with each gas,
$\text{CO}_{2}$
. Note that, although the time scales are very different in experiments with each gas, $x$
is similar for
$x$
is similar for $\text{N}_{2}$
and
$\text{N}_{2}$
and $\text{CO}_{2}$
. The early stages look very similar; in fact, the slow growth of
$\text{CO}_{2}$
. The early stages look very similar; in fact, the slow growth of $\text{N}_{2}$
bubbles allows for a smoother plateau region, avoiding the slight oscillations of the
$\text{N}_{2}$
bubbles allows for a smoother plateau region, avoiding the slight oscillations of the $\text{CO}_{2}$
curve caused by the pressure controller after the pressure drop. At the predicted
$\text{CO}_{2}$
curve caused by the pressure controller after the pressure drop. At the predicted $t_{conv}$
there is a clear change in behaviour for the
$t_{conv}$
there is a clear change in behaviour for the $\text{N}_{2}$
bubbles, but very different from that of the
$\text{N}_{2}$
bubbles, but very different from that of the $\text{CO}_{2}$
case. In this case,
$\text{CO}_{2}$
case. In this case, $\unicode[STIX]{x1D706}_{c}$
is negative and therefore, the stratified density profile is stable: the solution is then denser close to the bubble than in the bulk liquid, i.e. the depleted volume may stay on the substrate and sink. The subsequent convective stream flows in the opposite direction to that in the
$\unicode[STIX]{x1D706}_{c}$
is negative and therefore, the stratified density profile is stable: the solution is then denser close to the bubble than in the bulk liquid, i.e. the depleted volume may stay on the substrate and sink. The subsequent convective stream flows in the opposite direction to that in the $\text{CO}_{2}$
case. Still, the transition to natural convection occurs since additional gas is brought from the bulk to the bubble interface. However, the behaviour is totally different from that of
$\text{CO}_{2}$
case. Still, the transition to natural convection occurs since additional gas is brought from the bulk to the bubble interface. However, the behaviour is totally different from that of $\text{CO}_{2}$
bubbles: now the growth rate oscillates around the solution for purely diffusive growth. Thus, the Riley scaling of the convective flux, i.e.
$\text{CO}_{2}$
bubbles: now the growth rate oscillates around the solution for purely diffusive growth. Thus, the Riley scaling of the convective flux, i.e. $Sh\propto Ra^{1/4}$
, may not apply any longer to this scenario. The different transition times for
$Sh\propto Ra^{1/4}$
, may not apply any longer to this scenario. The different transition times for $\text{CO}_{2}$
and
$\text{CO}_{2}$
and $\text{N}_{2}$
are listed in table 2. As one can see from the data in the table, the cross-over radius
$\text{N}_{2}$
are listed in table 2. As one can see from the data in the table, the cross-over radius $R(t_{conv})$
is of the same order for both gases. However, the cross-over time
$R(t_{conv})$
is of the same order for both gases. However, the cross-over time $t_{conv}$
and consequently the boundary layer thickness
$t_{conv}$
and consequently the boundary layer thickness $\unicode[STIX]{x1D6FF}(t_{conv})$
are much larger for
$\unicode[STIX]{x1D6FF}(t_{conv})$
are much larger for $\text{N}_{2}$
.
$\text{N}_{2}$
.
Comparison of cross-over time $t_{conv}$
, bubble radius at cross-over time
$t_{conv}$
, bubble radius at cross-over time $R(t_{conv})$
and boundary layer thickness at cross-over time
$R(t_{conv})$
and boundary layer thickness at cross-over time $\unicode[STIX]{x1D6FF}(t_{conv})$
for
$\unicode[STIX]{x1D6FF}(t_{conv})$
for $\text{CO}_{2}$
and
$\text{CO}_{2}$
and $\text{N}_{2}$
bubbles.
$\text{N}_{2}$
bubbles.
As we previously mentioned in § 2, it is not uncommon that some bubbles grow on the edges of the silicon substrate during the experiments, which are at least 4 mm away from the target bubble. For $\text{CO}_{2}$
bubbles this is not a problem, since that distance is much larger than the boundary layer thickness at the time convection sets in,
$\text{CO}_{2}$
bubbles this is not a problem, since that distance is much larger than the boundary layer thickness at the time convection sets in, $\unicode[STIX]{x1D6FF}(t_{conv})$
, and hence beyond the range in which they might interact (Enríquez Reference Enríquez2015, chap. 5). However for
$\unicode[STIX]{x1D6FF}(t_{conv})$
, and hence beyond the range in which they might interact (Enríquez Reference Enríquez2015, chap. 5). However for $\text{N}_{2}$
, this distance allows for considerable overlap of buoyant regions, which may cause that the mixing due to natural convection brings liquid that is already depleted of gas to the bubble surface. This is consistent with the irregular growth rates and the lack of reproducibility that we observe in all our
$\text{N}_{2}$
, this distance allows for considerable overlap of buoyant regions, which may cause that the mixing due to natural convection brings liquid that is already depleted of gas to the bubble surface. This is consistent with the irregular growth rates and the lack of reproducibility that we observe in all our $\text{N}_{2}$
experiments after
$\text{N}_{2}$
experiments after $t_{conv}$
even though the initial growth is reproducible and similar to
$t_{conv}$
even though the initial growth is reproducible and similar to $\text{CO}_{2}$
bubbles in dimensionless units (figure 9). In addition, the mixing process itself might be significantly altered in the case of
$\text{CO}_{2}$
bubbles in dimensionless units (figure 9). In addition, the mixing process itself might be significantly altered in the case of $\text{N}_{2}$
bubbles where, despite the similar magnitude of the buoyant force (in absolute terms), the buoyant depleted volume is much larger than for
$\text{N}_{2}$
bubbles where, despite the similar magnitude of the buoyant force (in absolute terms), the buoyant depleted volume is much larger than for $\text{CO}_{2}$
bubbles. Finally, and regarding the supersaturation range where diffusion effects should prevail over convection in the case of
$\text{CO}_{2}$
bubbles. Finally, and regarding the supersaturation range where diffusion effects should prevail over convection in the case of $\text{N}_{2}$
, we can see in figure 5 that the small solubility of this gas in principle sets a very high supersaturation limit to this phenomenon, which again is indicated by the threshold
$\text{N}_{2}$
, we can see in figure 5 that the small solubility of this gas in principle sets a very high supersaturation limit to this phenomenon, which again is indicated by the threshold $Pe/Sh=1$
. The transition to convection is therefore most likely to occur in the majority of applications involving
$Pe/Sh=1$
. The transition to convection is therefore most likely to occur in the majority of applications involving $\text{N}_{2}$
bubbles.
$\text{N}_{2}$
bubbles.
5 Conclusions
We have shown that diffusive bubble growth driven by a small gas supersaturation in a liquid solution can lead to natural convection and, thereby, enhance the bubble growth rate (figures 2 and 3
a). This transition to natural convection or density-driven convection originates from the change in density experienced by the solution surrounding the bubble as it absorbs the dissolved gas and the liquid becomes depleted. For experiments with $\text{CO}_{2}$
, the prediction for the cross-over time
$\text{CO}_{2}$
, the prediction for the cross-over time $t_{conv}$
agrees with measurements, despite the difficulty in precisely determining
$t_{conv}$
agrees with measurements, despite the difficulty in precisely determining $t_{conv}$
(figures 3
b, 4
a and 7
a). The analytical prediction of
$t_{conv}$
(figures 3
b, 4
a and 7
a). The analytical prediction of $t_{conv}$
suggests that, in principle, density-driven convection around a growing bubble can occur at any value of supersaturation
$t_{conv}$
suggests that, in principle, density-driven convection around a growing bubble can occur at any value of supersaturation $\unicode[STIX]{x1D701}$
as long as the detachment radius is large enough (figure 4). However, the balance between the expansive motion of the bubble surface and the convection due to concentration differences establishes a supersaturation threshold for which convection is expected to become relevant (figure 5). The initial saturation pressure
$\unicode[STIX]{x1D701}$
as long as the detachment radius is large enough (figure 4). However, the balance between the expansive motion of the bubble surface and the convection due to concentration differences establishes a supersaturation threshold for which convection is expected to become relevant (figure 5). The initial saturation pressure $P_{0}$
at which the solution is prepared significantly affects results as well. At constant supersaturation
$P_{0}$
at which the solution is prepared significantly affects results as well. At constant supersaturation $\unicode[STIX]{x1D701}$
, a higher
$\unicode[STIX]{x1D701}$
, a higher $P_{0}$
implies a larger pressure drop, and consequently, a larger concentration and density change. As a result, convection sets in at earlier
$P_{0}$
implies a larger pressure drop, and consequently, a larger concentration and density change. As a result, convection sets in at earlier $t_{conv}$
and with intensified effects, indicated by the different convective slopes in the derivative analysis (figure 6
a).
$t_{conv}$
and with intensified effects, indicated by the different convective slopes in the derivative analysis (figure 6
a).
Single bubbles growing in a succession are also extremely affected by the transition to convection. The study of the depletion number $\unicode[STIX]{x1D6F6}$
yields that depletion is highly dependent on the supersaturation level, whereas the initial starting pressure
$\unicode[STIX]{x1D6F6}$
yields that depletion is highly dependent on the supersaturation level, whereas the initial starting pressure $P_{0}$
has a secondary role and barely influences the results. This sheds some more light in the possible origin of depletion: even though the transition to convection may be relatively important, the major cause of depletion emerges from the evident fact that bubbles absorb gas as they grow (gas that cannot be fully replaced by the diffusive transport through the bulk) and from the way bubbles alter their surroundings while detaching. Besides, depletion causes a significant delay in the transition to convection, which becomes less relevant as subsequent bubbles keep growing and detaching.
$P_{0}$
has a secondary role and barely influences the results. This sheds some more light in the possible origin of depletion: even though the transition to convection may be relatively important, the major cause of depletion emerges from the evident fact that bubbles absorb gas as they grow (gas that cannot be fully replaced by the diffusive transport through the bulk) and from the way bubbles alter their surroundings while detaching. Besides, depletion causes a significant delay in the transition to convection, which becomes less relevant as subsequent bubbles keep growing and detaching.
For $\text{N}_{2}$
bubbles, there is a clear transition occurring at
$\text{N}_{2}$
bubbles, there is a clear transition occurring at $t_{conv}$
, consistent with the presence of natural convection, but different from the
$t_{conv}$
, consistent with the presence of natural convection, but different from the $\text{CO}_{2}$
case. This originates from the different solubilities and the different way in which the solution density changes with the gas concentration, which is reflected in an opposite sign of
$\text{CO}_{2}$
case. This originates from the different solubilities and the different way in which the solution density changes with the gas concentration, which is reflected in an opposite sign of $\unicode[STIX]{x1D706}_{c}$
as that for the
$\unicode[STIX]{x1D706}_{c}$
as that for the $\text{CO}_{2}$
bubbles. The convective plumes flow in the reverse direction and consequently, the bubble evolution during the convective regime and the time needed for it to set in behave differently, as depicted in both tables 1 and 2 and figures 4(b), 5 and 9. Nevertheless, that we observe such transition with a gas one hundred times less soluble suggests that this can happen for any gas–liquid solution as long as its density changes with the gas concentration.
$\text{CO}_{2}$
bubbles. The convective plumes flow in the reverse direction and consequently, the bubble evolution during the convective regime and the time needed for it to set in behave differently, as depicted in both tables 1 and 2 and figures 4(b), 5 and 9. Nevertheless, that we observe such transition with a gas one hundred times less soluble suggests that this can happen for any gas–liquid solution as long as its density changes with the gas concentration.
Acknowledgements
We want to thank S. Schlautmann for the preparation of the substrates to perform the experiments. This work was supported by the Netherlands Centre for Multiscale Catalytic Energy Conversion (MCEC), an NWO Gravitation programme funded by the Ministry of Education, Culture and Science of the government of the Netherlands.


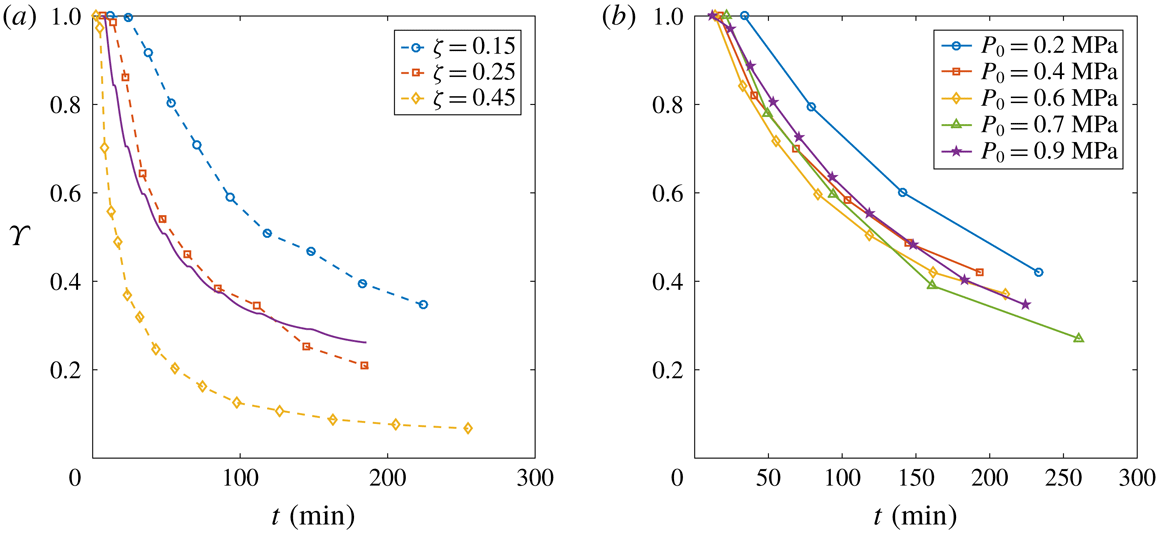


 Open access