1. Introduction
In recent years, exoskeletons have attracted extensive interest for their potential to enhance human performance and reduce metabolic cost in dynamic activities [Reference Bettella, Tortora, Menegatti, Petrone and Felice1–Reference Viteckova, Kutilek, de Boisboissel, Krupicka, Galajdova, Kauler, Lhotska and Szabo4]. While much prior work has focused on medical and rehabilitative applications of exoskeletons, there is also growing interest – in both industrial workplaces and performance-enhancement contexts – for lightweight, high-efficiency devices that reduce metabolic cost or musculoskeletal load under dynamic or repetitive tasks [Reference Kansal, Zubair, Suthar and Mukherjee5–Reference Guo, Yang, Chen, Yan and Liu7] Among the lower limb joints, the ankle joint plays a crucial role in walking, contributing approximately 58.8% of the positive mechanical work output, compared to 22.1% and 19.1% for the hip and knee joints, respectively [Reference Han and Wang8]. However, much of this mechanical work is generated passively by elastic structures such as the Achilles tendon, with relatively little direct metabolic cost [Reference Sawicki and Ferris9, Reference Blazevich and Fletcher10]. Despite this efficiency, the ankle muscles – particularly the soleus – remain a primary source of metabolic energy consumption due to sustained isometric contractions required for posture and stability. This makes the ankle an attractive target for assistance: reducing muscular demand at this joint has direct potential to lower whole-body metabolic cost during walking.
Despite substantial progress in the mechanical structure and actuation systems of exoskeletons [Reference Zhang, Fiers, Witte, Jackson, Poggensee, Atkeson and Collins11–Reference Sutrisno and Braun18], several persistent challenges continue to limit the practical effectiveness of existing devices. One major difficulty lies in the precise timing of assistance. Human gait is highly dynamic, and small deviations in when assistive torque is delivered can not only reduce energy-saving benefits but also disrupt natural locomotion. Active exoskeletons address this problem by using powered actuators and closed-loop controllers to achieve accurate torque tracking [Reference Koller, Gates, Ferris and Remy19–Reference Mooney and Herr22]. However, these systems inevitably introduce significant trade-offs in terms of bulk, battery life, and mechanical complexity, which reduce portability and hinder widespread adoption. Passive devices, in contrast, excel in simplicity and efficiency but typically rely on fixed spring-clutch mechanisms [Reference Collins, Wiggin and Sawicki23, Reference Pardoel and Doumit24] that cannot adapt seamlessly to the timing demands of different gait phases, thereby limiting their assistive efficacy.
A second critical challenge is the trade-off between providing meaningful assistance and maintaining user comfort and wearability. While strong assistive forces can reduce muscle demand, heavy or rigid structures often compromise natural movement, cause discomfort, or discourage long-term use [Reference Mooney and Herr22, Reference Quinto, Pinheiro, Goncalves, Roupa, Simoes and Silva25]. Many passive designs attempt to minimize weight, but doing so often reduces the magnitude of effective energy return. Collins et al. [Reference Collins, Wiggin and Sawicki23] designed a spring-clutch-based passive ankle exoskeleton that effectively reduced metabolic cost by approximately 7.2% during walking by employing a variable-stiffness spring. However, this is not the ultimate potential of passive structures. For instance, exploring novel energy storage materials or nonlinear storage elements could enable better matching with human gait dynamics and thereby achieve greater efficiency. Conversely, designs that incorporate stiffer or bulkier assistive elements risk impeding joint mobility or producing unnatural gait patterns. Achieving both lightweight design and high assistance efficiency remains a central bottleneck for the field.
Motivated by these gaps, the present study proposes a gait-adaptive lightweight and flexible passive ankle exoskeleton (LFPA-EXO) featuring two key innovations – a gait-adaptive clutch (GA-clutch) and a super-elastic composite booster (SC-booster) – that together ensure precise assistance timing and reduce the metabolic cost of walking. The GA-clutch incorporates a dynamic mechanical switching mechanism that enables phase-specific engagement without external power, thereby directly addressing the timing limitations of existing passive devices. To characterize this adaptive behavior, the study introduces two quantitative indicators – Clutch Assistance (CA) and Clutch Interference (CI). In parallel, the SC-booster leverages a super-elastic composite layup with an L-shaped nonlinear force–displacement profile, providing high energy return while maintaining low weight and flexibility. By focusing on timing adaptability and efficient energy storage, this design aims to improve the functional effectiveness and wearability of passive ankle exoskeletons, laying a foundation for the subsequent biomechanical evaluation presented in this work.
2. Working principle
This research develops a LFPA-EXO, depicted in Figure 1(a). The system comprises a SC-booster, a GA-clutch, a toe cap, and a binding structure. Fabricated from composite materials, the SC-booster acts as a customizable energy storage spring, enhancing ankle mobility. The GA-clutch facilitates the transition between energy storage and release modes. The toe cap and binding structure secure the LFPA-EXO to the human lower limb, ensuring stability and alignment.
Schematic diagram of LFPA-EXO. (a) Components of LFPA-EXO. (b) Working principle of LFPA-EXO. (Eg represents gravitational potential energy, Ee represents elastic potential energy).

The working principle of the LFPA-EXO is illustrated in Figure 1(b). During the free-swinging phase of the gait, when the foot is off the ground, the clutch remains unlocked. This state changes upon foot landing, marking the beginning of the compression phase, at which point the clutch locks. During ankle dorsiflexion, the booster captures gravitational potential energy, converting it into stored elastic potential energy. As the body advances, the ankle plantarflexes, triggering the release of this stored energy, which is then converted into kinetic energy propelling the body forward. Finally, as the foot leaves the ground, the system returns to the free-swinging phase of the gait, thereby completing a full cycle of the gait sequence. To ensure that LFPA-EXO meets functional requirements while maintaining good utility and comfort, the design needs to take into account several key factors such as weight, assistive effects, and ease of wear.
3. Design
3.1. SC-booster design
The SC-booster adopts a sandwich structure design, as shown in Figure 2, to prevent surface fiber cracking and deformation. The outer layer is made of carbon fiber fabric prepreg (3K,200g), consisting of SYT45 carbon fibers impregnated with high-strength resin (WP-R5603W3K). The interlayer uses T700 unidirectional prepreg, impregnated with high-toughness resin (WP-S5001). Experimental results have confirmed that this resin system and layup arrangement provide the composite material with optimal bending toughness and assistance symmetry. Additionally, to further enhance the durability of the booster, single-walled carbon nanotubes (SWCNTs, 99%wt%) are dispersed between the layers to improve interlayer mechanical properties and service life.
Schematic diagram of SC-booster structure.

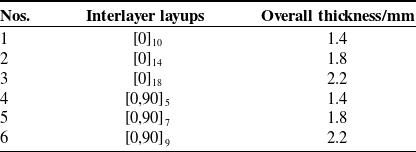
Finite element simulations were conducted to verify the structural feasibility of the composite booster and to guide the optimal layup design. The simulations were performed using ABAQUS 2019, with a three-dimensional 8-node linear brick element (C3D8R) employed for the composite layers. The material properties of the composite prepreg layers were specified based on the manufacturer-provided data, as summarized in Table I. As shown in Table II, several different interlayer layup configurations were designed to achieve higher assistance torque while avoiding discomfort caused by excessive torque. It is worth noting that the ±45° layup induces unintended torsional moments along the width direction of the composite material, and therefore, layups in the ±45° direction are not considered here.
During ankle motion, the deformation of the SC-booster is analyzed based on the dimensions of the human lower limb and kinematic models [Reference Winter26, Reference Zhao, Ran, Liu and Li27]. This deformation serves as a load input for finite element simulations, which evaluate the SC-booster under various bending configurations to prevent bodily interference post-bending and optimize energy storage. Crucially, this analysis aids in minimizing stress concentrations that could lead to localized fractures. Figure 3(a) displays the bending shape, load, and boundary conditions set for the simulation, while Figure 3(b) shows the prototype’s deformation under load. Simulations indicate that with a bending radius below 260 mm, the SC-booster would interfere with the calf’s anterior side. Notably, stress concentration escalates as the bending radius decreases.
Material properties of the composite prepreg layers.

Ply layups of SC-booster.

Note: [0/90]7 denotes an alternating sequence of 0° and 90° layers, repeated 7 times for a total of 14 layers.
Simulation of SC-booster under working conditions. (a) Loads and boundary conditions for simulation. (b) Flexion status of the SC-booster after ankle movement.

The reaction force on the human body and the maximum assisting moment provided by different radii of the SC-boosters are shown in Figure 4(a). Further analysis of the simulation results reveals that the assisting moment provided by the SC-booster increases as the bending radius increases, but the magnitude of the increase decreases. At the same time, the reaction force on the human body increases, and the magnitude of the increase also increases. Not only that, it is also found in the wearing test that a bending radius of more than 320 mm would easily lead to unintended bending of the SC-booster during movement as shown in Figure 4(b), which greatly reduces the booster efficiency. Integrating the simulation insights and participant feedback on the LFPA-EXO, the SC-booster’s bending radius was definitively set at 260 mm. All participants used an SC-booster with this fixed 260 mm radius, which is suitable for normal human ankle curvature. To accommodate participants of different heights and weights, the long-side mounting holes of the booster were adjustable (pre-reserved) to ensure proper fit and alignment. This configuration ensures an optimal assistive moment exceeding 23 Nm, with a reaction force on the human body under 100 N, satisfying the requirements for ankle movement support and wearer comfort [Reference Fan and Wang28].
Simulation results of SC-booster under working conditions. (a) Performance under different radii in No.5 layup. (b) Schematic of unintended deformation of SC-booster. (c) Performance under different interlayer layups. (d) Failure simulation under extreme loading.

Simulation analysis of the SC-booster with different layup configurations, as shown in Table II, was conducted to provide design guidance for various assistance requirements. Additionally, the Hashin failure criterion was employed to evaluate the failure behavior of the SC-booster under extreme bending conditions. The assistance torques provided by the different layup configurations are presented in Figure 4(c). Compared to the [0/90] layup, the [0] layup provides a higher assistance torque, but the resulting reaction force on the wearer significantly increases. Excessive reaction force may lead to discomfort during wear. Considering the previously mentioned design criteria, layups No. 2 and No. 5 are the most suitable for the walking assistance requirements of this study. The results of the extreme bending simulation are shown in Figure 4(d). When the failure coefficient reaches 1.0, the corresponding failure mode occurs. The [0]14 layup is most prone to failure, with the SC-booster failing when the bending displacement exceeds 150 mm. In contrast, the [0/90]7 layup demonstrates superior bending performance. Even when the bending displacement exceeds 200 mm, it does not reach failure, which surpasses the extreme dorsiflexion position. Based on the experimental results, the [0/90]7 layup was selected as the final configuration for the SC-booster.
3.2. GA-clutch design
As illustrated in Figure 5, the GA-clutch is configured as a combination of a gear-rack and a ratchet-gear sleeve to fulfill the functional requirements of the clutch mechanism. Two ratchets are symmetrically positioned on either side of the rack, facilitating the conversion of the linear motion of the booster – induced by ankle joint movement – into rotational motion. The ratchet and gear sleeve are loosely coupled, allowing the gear sleeve to remain inactive during small-angle movements of the ankle joint. While the ankle joint moves beyond a certain angle, the ratchet will drive the gear sleeve to move together, causing the clutch to switch modes.
Schematic diagram of GA-clutch structure.

The design dimensions of the GA-clutch are detailed in Figure 6. Where $\mathit{a}$
is the horizontal distance from the fixed surface on the clutch of the composite booster to the center of the ankle joint,
$\mathit{a}$
is the horizontal distance from the fixed surface on the clutch of the composite booster to the center of the ankle joint, $\mathit{L}$
is the length of both ends of the composite booster, and
$\mathit{L}$
is the length of both ends of the composite booster, and $\mathit{d}$
is the distance from the lower connection point of the composite booster to the center of the ankle joint.
$\mathit{d}$
is the distance from the lower connection point of the composite booster to the center of the ankle joint. $\theta$
is the rotation angle of the ankle joint and
$\theta$
is the rotation angle of the ankle joint and $\mathit{X}$
means the vertical distance from the connection point on the composite booster to the center of the ankle joint.
$\mathit{X}$
means the vertical distance from the connection point on the composite booster to the center of the ankle joint. $\Delta \mathit{x}$
is the change in rack movement and also the arc of rotation of the corresponding meshing gear, which can be obtained by Eqs. (1) and (2):
$\Delta \mathit{x}$
is the change in rack movement and also the arc of rotation of the corresponding meshing gear, which can be obtained by Eqs. (1) and (2):
 \begin{align}X-\Delta x=\sqrt{L^{2}-\left(d\cos \theta -a\right)^{2}} \\[-28pt] \nonumber \end{align}
 \begin{align}\Delta x=d\sin \theta \\[0pt] \nonumber \end{align}
The number of gear teeth $(\mathit{z})$
is 25 and the modulus
$(\mathit{z})$
is 25 and the modulus $(\mathit{m})$
is 2. The relationship between the clutch chuck’s rotation angle
$(\mathit{m})$
is 2. The relationship between the clutch chuck’s rotation angle $\Delta \alpha$
and
$\Delta \alpha$
and $\Delta \mathit{x}$
is established through Eqs. (3) and (4):
$\Delta \mathit{x}$
is established through Eqs. (3) and (4):
 \begin{align}\mathit{R}=\frac{\mathit{mz}}{2} \\[-28pt] \nonumber \end{align}
 \begin{align}\Delta \alpha =\Delta \mathit{x}\times \frac{180^{\circ}}{\pi \mathit{R}} \\[0pt] \nonumber \end{align}
The initial angle of $\Delta$
α and
$\Delta$
α and $\theta$
is 0°, representing the position of the sole perpendicular to the tibia. Referring to the gait cycle corresponding clutch state diagram in Figure 7 and the values of
$\theta$
is 0°, representing the position of the sole perpendicular to the tibia. Referring to the gait cycle corresponding clutch state diagram in Figure 7 and the values of $\theta$
and
$\theta$
and $\Delta \mathit{x}$
corresponding to several key nodes shown in Table III, the clutch chuck rotation angle
$\Delta \mathit{x}$
corresponding to several key nodes shown in Table III, the clutch chuck rotation angle $\Delta \alpha$
can be precisely calculated. Then the position of the ratchet slot can be designed according to the proportion of the gait position where the heel strikes the ground in the entire gait cycle.
$\Delta \alpha$
can be precisely calculated. Then the position of the ratchet slot can be designed according to the proportion of the gait position where the heel strikes the ground in the entire gait cycle.
Schematic diagram of GA-clutch design.

Schematic diagram of clutch status changing with the gait cycle.

Clutch design parameters.

The clutch state corresponding to the gait cycle is illustrated in Figure 7. In Stage A–B, the ankle joint angle increases slightly to about 95° at the end of the swing period until the heel touches the ground. At this point, the clutch remains unlocked, allowing the booster to slide freely. The ratchet rotates clockwise, causing the ratchet claw to engage with and move along the ratchet groove. However, it is important to note that the angle at this time is insufficient for the ratchet claw to reach the ratchet baffle position. In Stage B–D, as the body’s center of gravity lowers, the ankle joint angle decreases to approximately 75° from heel strike to the end of the support phase. The ratchet rotates counterclockwise, and the ratchet claw snaps into the ratchet slot, locking the clutch. Concurrently, as the body’s center of gravity descends, the booster compresses, converting the body’s potential energy into the elastic potential energy of the booster. In Stage E–F, the ankle joint angle increases to about 110° from toe-off to mid-swing, with the ratchet rotating clockwise again. At this point, the ratchet claw moves past the ratchet baffle position not merely due to a static angle but primarily because of the inertia (dynamic overshoot) generated by the rapid ankle movement during push-off, unlocking the clutch and allowing it to rotate freely with the booster. The stored elastic potential energy is then released, providing a plantarflexion moment to the body. In Stage F–A, the ankle joint angle reduces to approximately 85° from mid to end swing, with the ratchet rotating counterclockwise. At this time, the ratchet claw is near the ratchet baffle, which is positioned with its front end raised, allowing rotation relative to the stationary ratchet baffle. As the ratchet moves counterclockwise, the pawl avoids the ratchet groove under the influence of the ratchet baffle, ensuring free rotation without obstruction. The clutch then returns to its initial position, preparing for the next gait cycle.
4. Manufacture
4.1. Manufacturing of SC-booster
The SC-booster is made using the materials described in Section 3.1. It is manufactured through a molding process, as shown in Figure 8. Initially, the prepreg is cut to dimensions of 400 mm by 50 mm. Subsequently, an ethanol solution of SWCNTs, with a concentration of 1 g/30 ml, is prepared and thoroughly mixed using an IKA MS 3 Basic vortex mixer. The solution is then evenly applied to the surface of the prepreg. The concentration of carbon nanotubes in each layer is 1.2 g/m2, and all unidirectional prepregs in the interlayers are coated [Reference Chen, Cai, Xie and Jing29–Reference Cai, Chen, Xie and Jing33]. Once the ethanol has evaporated, the prepregs are layered in a curved aluminum mold in the sequence of Table II. The dimensions of the prepreg and the orientation of the 0° layup are illustrated in Figure 8(a). The booster is then cured and formed in a hot press (XTM-106SF-30T, Jinan, China), following the curing parameters displayed in Figure 8(b). After demolding, the booster undergoes cutting and drilling according to the predefined dimensions through machining to produce the final SC-booster.
Manufacturing process of SC-booster. (a) The manufacturing process of SC-booster. (b) Curing and forming parameters of SC-booster.

Although the SC-booster and GA-clutch involve multi-step fabrication and advanced materials, the process is largely compatible with standard composite manufacturing techniques, including prepreg cutting, CNT coating, molding, and hot pressing. This enables potential scalability for small-batch or customized production. For mass production, the processes could be streamlined using automated cutting, spray-coating, or roll-to-roll CNT deposition, which would reduce labor and material costs. Moreover, the design allows for modular adjustments (e.g., varying clutch engagement thresholds or booster layups) to accommodate different user sizes or performance requirements, supporting both personalization and translational applications. Overall, while the current laboratory fabrication involves multiple steps, the methods and materials are compatible with industrial processes, making scale-up feasible with moderate optimization.
4.2. Manufacturing of other components
The clutch assembly comprises racks, rack-and-slide installation plates, gears, ratchets, ratchet claws, ratchet claw shafts, wheel disc shafts, shaft sleeves, shaft end presses, ratchet baffles, slider platens, toe connecting splints, and mounting plates, as depicted in Figure 5. The gears and racks are precision-crafted from 3k carbon fiber plates using CNC machining. Ratchet baffles are produced through PLA 3D printing. The rack-and-slide installation plates, ratchets, ratchet claw, ratchet claw bushings, shaft sleeves, shaft end presses, slider platens, and toe connecting splints are all fabricated from aluminum via CNC machining, whereas the wheel disc shafts are crafted from hardened stainless steel by turning, and the mounting plates are formed from stainless steel using sheet metal processing techniques.
The specific toe cap is constructed through a process of 3D printing using aluminum alloy. Initially, the toe cap is digitally captured via a 3D scanning method. Subsequently, dense point clouds of the toe cap are generated using a blue-light 3D scanner (COMET L3D-5 M, China). These point clouds are then processed using Geomagic series software to create a precise 3D model of the toe cap, which is finally 3D-printed. Aluminum alloy is chosen for its high strength-to-weight ratio and excellent formability, which ensures the toe cap meets the demanding strength requirements while achieving a high degree of shape conformity with the user’s foot. The binding structure incorporates a standard knee protection design, including a soft knee pad and sponge lining to enhance wearing comfort and reduce localized pressure during prolonged use. The clutch mounting plate is modified to ensure proper assembly, and all components are joined using bolt connections to secure the structure. To further enhance the operational stability of the GA-clutch, the clutch cover is fabricated from polycarbonate material using 3D printing, providing both lightweight and high-impact resistance. The overall final wearing state of the LFPA-EXO is illustrated in Figure 9, with a total device weight of 1.755 kg.
5. Mechanical testing
5.1. SC-booster mechanical test
The first test evaluates the accuracy of the simulation analysis by conducting a bending test on the SC-booster under actual working conditions. This test analyzes the supported force as it varies with the ankle angle and the maximum assisted moment that can be achieved. The second test assesses the bending performance of the booster through a booster-centric compression test, confirming the suitability of the super-elastic composite material for use as a booster [Reference Hong, Sarfraz, Jeong, Kim, Choi, Kong, Park and Kim34]. Both tests were carried out using a universal testing machine (WDW-20G, 20 kN, Jinan, China). The booster was affixed to a specially designed fixture, which was connected to an adapter via a hinge joint, allowing bending deformation to occur without any imposed moments. The lower fixture was secured to the universal testing machine, while the upper fixture was subjected to a constant displacement loading rate of 10 mm/min at a sampling frequency of 10 Hz. The methodologies for these tests are depicted in Figure 10. All tests were performed at room temperature (20 °C).
LFPA-EXO wearing state.

Performance test of SC-booster. (a) Working condition bending test. (b) Concentric compression test.

5.2. SC-booster mechanical test
To objectively evaluate the matching performance of the GA-clutch with the LFPA-EXO, this study introduces two functions: the Clutch Assistance Degree function CA(t) and the Clutch Interference Degree function CI(t). These two functions provide an intuitive way to assess the compatibility of the clutch with the LFPA-EXO. The Clutch Assistance Degree function is shown in Eq. (5), and the Clutch Interference Degree function is shown in Eq. (6). The detailed physical interpretations of these two functions are provided in the supplementary materials (SI Figure 2 and the SI Figure 2 Note):
 \begin{align}\mathit{CA}\left(\mathit{t}\right)=\frac{\int _{\mathit{t}_{\text{lock}}}^{\mathit{t}_{\text{swing}}}\mathit{M}\left(\mathit{t}\right)-\mathit{M}_{\mathrm{exo}}\left(\mathit{t}\right)\,{\text{d}t}}{\int _{\mathit{t}_{0}}^{\mathit{t}_{1}}\mathit{M}\left(\mathit{t}\right)-\mathit{M}_{\mathrm{exo}}\left(\mathit{t}\right)\,{\text{d}t}} \\[-28pt] \nonumber \end{align}
 \begin{align}\mathit{CI}\left(\mathit{t}\right)=\alpha \int _{\mathit{t}_{\text{swing}}}^{\mathit{t}_{\text{lock}}}\frac{|\theta \left(\mathit{t}\right)-\theta _{\mathrm{exo}}\left(\mathit{t}\right)|}{|\theta \left(\mathit{t}\right)|}\,{\text{d}t}+(1-\alpha )\int _{\mathit{t}_{\text{swing}}}^{\mathit{t}_{\text{lock}}}\frac{|\mathit{M}\left(\mathit{t}\right)-\mathit{M}_{\mathrm{exo}}\left(\mathit{t}\right)|}{|\mathit{M}\left(\mathit{t}\right)|}\,{\text{d}t} \\[-28pt] \nonumber \end{align}
 \begin{align}\mathit{t}_{\mathrm{exo}}=\mathit{t}_{\text{swing}}-\mathit{t}_{\text{lock}} \\[0pt] \nonumber \end{align}
In the equations, $\mathit{t}_{\text{lock}}$
and
$\mathit{t}_{\text{lock}}$
and $\mathit{t}_{\text{swing}}$
represent the time of clutch locking and the time when the gait enters the free-swinging phase, respectively, within the normalized gait cycle.
$\mathit{t}_{\text{swing}}$
represent the time of clutch locking and the time when the gait enters the free-swinging phase, respectively, within the normalized gait cycle. $\mathit{t}_{\mathrm{exo}}$
represent the duration of the assistance phase provided by the exoskeleton.
$\mathit{t}_{\mathrm{exo}}$
represent the duration of the assistance phase provided by the exoskeleton. $\mathit{t}_{0}$
and
$\mathit{t}_{0}$
and $\mathit{t}_{1}$
, respectively, represent the start and end times of a gait cycle.
$\mathit{t}_{1}$
, respectively, represent the start and end times of a gait cycle. $\mathit{M}_{\mathrm{exo}}(\mathit{t})$
and
$\mathit{M}_{\mathrm{exo}}(\mathit{t})$
and $\mathit{M}(\mathit{t})$
represent the biological moment functions when wearing and not wearing the exoskeleton, respectively.
$\mathit{M}(\mathit{t})$
represent the biological moment functions when wearing and not wearing the exoskeleton, respectively. $\theta _{\mathrm{exo}}(\mathit{t})$
and
$\theta _{\mathrm{exo}}(\mathit{t})$
and $\theta (\mathit{t})$
represent the ankle joint angle functions when wearing and not wearing the exoskeleton, respectively.
$\theta (\mathit{t})$
represent the ankle joint angle functions when wearing and not wearing the exoskeleton, respectively. $\alpha$
indicates the influence of the ankle joint angle on the clutch interference function.
$\alpha$
indicates the influence of the ankle joint angle on the clutch interference function.
(a) Result of bending test under working conditions. (b) Result of concentric compression test.

5.3. Data analysis
Analysis of the test results reveals that when the displacement reaches 80 mm (equivalent displacement under working conditions), the support reaction force (F) generated by the booster is 89.30 N, as indicated in the bending test results under working conditions shown in Figure 11(a). The output moment is calculated using the formula in Eq. (8), with the moment arm d measured as 275 mm. From this, the peak assist moment is determined to be 24.56 Nm, which aligns closely with the 86.74 N reaction force and 23.68 Nm assist moment predicted in the simulations. The discrepancy falls within a 5% error range, affirming the accuracy of the simulation results:
 \begin{align}M=d\times F \\[-25pt] \nonumber \end{align}
The results of the concentric compression test are shown in Figure 11(b). When the vertical displacement of the testing machine reached 200 mm, the booster consistently bent beyond 90°. After 5,000 repeated cycles under the same deformation conditions, no structural failure or degradation was observed. These findings highlight the excellent super-elasticity and fatigue resistance of the material. Previous studies have shown that fiber-reinforced composites exhibit superior fatigue performance [Reference Kumar and Vijayarangan35–Reference Natarajan, Gangarao and Shekar37] and have widely replaced metals in aerospace and sports equipment applications [Reference Childers and Takahashi38, Reference Zhang, Chen and Hu39]. Additionally, the SC-booster is designed for easy replacement, further ensuring reliable performance during extended exoskeleton operation.
Clutch assist and clutch interference of different subjects.

Abbreviations: SD, standard deviation; CI 95%, confidence interval 95%; ICC, intraclass correlation coefficient.
The calculation of CA(t) and CI(t) is based on the biomechanical torque profile shown in Figure 13(b) and the ankle joint angle curve in Figure 13(c), both measured through human experiments. Table IV presents the statistical results of the Clutch Assistance Degree (CA) and Clutch Interference Degree (CI) across 10 subjects. The results show a high degree of assistance (mean CA: 87.24% ± 5.71, 95% CI: 83.01–91.47%) and low interference (mean CI: 4.34% ± 1.48, 95% CI: 3.42–5.26%) during the gait cycle. Except for Subject 4, all participants exhibited CI values below 5% and CA values above 85%. Subject 4 presented a relatively lower CA value, likely due to insufficient adaptation to the LFPA-EXO. However, even in this case, CI remained below 8%, indicating minimal disruption to the natural gait. The intraclass correlation coefficients (ICCs) for both CA and CI were high (CA: 0.936, CI: 0.911), suggesting strong reliability across measurements. Statistically significant differences (p < 0.01) further support the consistency and effectiveness of the GA-clutch system. These results highlight the excellent biomechanical compatibility between the GA-clutch and LFPA-EXO, which enables efficient SC-booster engagement through mode switching while maintaining minimal gait interference.
6. Human test
Fourteen healthy participants (seven males and seven females) were recruited for this study. Their average age was 30 ± 6 years (mean ± SD), with an average height of 1.76 ± 0.15 m and an average weight of 72.3 ± 14.2 kg. All participants were recruited from local logistics and delivery service personnel, who represent a typical target population for energy-saving lower-limb exoskeletons due to the walking-intensive nature of their occupation. None of the participants had a history of lower limb injuries or gait impairments. The study was approved by the Ethics Committee of Beihang University. All participants provided written informed consent before participation.
Each subject was asked to walk on a treadmill (Cosmos Treadmill, Germany) at a constant speed of 5 km/h. The measurement phase spanned from the overlap of the two legs to the end of the next overlap, defining a complete gait cycle. Five primary metrics were assessed to evaluate the impact of the LFPA-EXO on human walking performance: ankle joint angle, surface electromyography (sEMG), biological ankle moment, human energy metabolism, and subjective perception. For each condition (with and without the exoskeleton), the following parameters were calculated: the average ankle joint angle variation per gait cycle, the normalized average sEMG signals, the average biological ankle moment normalized to body mass, and the net metabolic rate normalized to body mass. Additionally, the average walking heart rate was measured and normalized to the resting heart rate to further assess the energetic response. Subjective perceptions regarding comfort and exertion were also collected to complement the physiological and biomechanical analyses. The measurement setup and environment are illustrated in Figure 12.
Test equipment and scene.

6.1. Test methods
6.1.1. Kinesiology test
A reflective marker motion capture system, consisting of eight Optitrack V100: R2 infrared cameras, was employed to capture kinematic data, with calibration performed before each test. Utilizing the lower body marker setting of the Motive software, 20 marker points were affixed to the subjects’ lower limbs and pelvis in the T-pose. Due to the LFPA-EXO covering significant areas on the front of the calf, adjustments were made to some marker placements to maintain consistent data collection locations before and after wearing the device. Changes in ankle joint angle throughout the gait cycle were recorded for each subject pre- and post-wearing the LFPA-EXO. The collected data were then utilized for human musculoskeletal modeling and analysis in OpenSim software. Individual gait cycles were isolated from the trial data and averaged across multiple tests.
6.1.2. Biomechanical measurement
Initially, body motion and ground reaction forces were captured using the same reflective marker motion capture system and Kistler 9260AA force plates. This data facilitated the calculation of biological ankle moments and the contribution of the LFPA-EXO to these moments. Analysis was conducted in Opensim software, where models were adjusted (gait2392_simbody model) to align closely with measured landmark locations through modification of landmark numbers and locations, and model scaling. The scaled models were required to have a root mean square (RMS) error of landmark points below 0.02, with a maximum error of less than 0.04. Ankle joint angle curves combined with ground reaction forces underwent inverse dynamics simulation analysis, and the ankle moment curve was derived through low-pass filtering at a cutoff frequency of 12 Hz. By comparing the biological ankle moments before and after wearing the exoskeleton, the contribution of the exoskeleton to the ankle joint moment could be calculated.
6.1.3. sEMG measurement
A wireless sEMG system (Cometa, Italy) was used to collect muscle activity signals and record the sEMG signal of the tibialis anterior, soleus, medial gastrocnemius, and lateral gastrocnemius muscles. To facilitate data analysis, the sEMG data of the medial gastrocnemius and lateral gastrocnemius were combined and analyzed. The reason for choosing these four muscles was that they play a large role in the movement of the lower limb ankle joint. Referring to SENIAM (Surface Electromyography for Non-Invasive Assessment of Muscle) guidelines [Reference Merletti, Rainoldi and Farina40], disposable medical gel electrode pads with a recording diameter of 10 mm were placed. The sEMG signals were sampled at 2000 Hz and synchronized with the motion capture and force plate data using the system’s built-in trigger. The measured data collected by the pads were analyzed and processed in sEMG and Motion software. The sEMG signals recorded in each test were band-pass filtered (10–450 Hz), full-wave rectified, and smoothed using low-pass filtering. Then, the trial data were trimmed into individual gait cycles and averaged across multiple tests. Finally, the sEMG signals were normalized based on the maximum value.
6.1.4. Energetics measurement
Oxygen consumption and carbon dioxide production were measured using an indirect calorimetry system (COSMED K5, Italy) under both resting-standing and walking conditions. Heart rate was continuously monitored using a chest-strap monitor (IGPSPORT HR40, China). To ensure steady-state measurements, each walking trial was initiated only after a clear transition from rest to walking was completed, and data collection began once a metabolic plateau was reached, defined as a change in oxygen consumption of <100 ml/min over a 1-min window. Each condition was recorded for 5 minutes during the plateau period. A minimum 10-min rest interval (or until heart rate returned to within 5% of the resting value) was provided between trials to avoid carry-over effects. The total metabolic cost was calculated using standard indirect calorimetry equations. The net metabolic cost of walking was obtained by subtracting the resting metabolic cost and was then normalized to each participant’s body mass. Similarly, mean walking heart rate was normalized to the resting value. Additionally, the effect sizes and 95% confidence intervals are provided in SI Table 1 in Supplementary Information.
6.1.5. Subjective perception test
Immediately after each walking trial, participants recorded their perceived exertion using the Borg CR10 scale and rated overall comfort on a 5-point Likert scale (1 = very uncomfortable and 5 = very comfortable), including fit, pressure points, and any perceived foreign-body sensation. Borg CR10 scores and comfort ratings were analyzed to assess subjective fatigue and wearing comfort. Data analysis included (1) the Borg CR10 score for subjective fatigue and (2) the mean comfort rating across all questionnaire items.
To account for potential learning effects and user adaptation, participants were given a familiarization session of approximately 10–15 min prior to formal testing, during which they walked with the device to acclimate to its mechanics and fit. This procedure aimed to minimize initial discomfort and allow participants’ gait patterns to stabilize, thereby reducing variability in energy cost measurements attributable to unfamiliarity with the device.
6.2. Results analysis
The statistical data processing and error band results of the above four tests are combined in Figure 13. The gait cycle is divided into three periods: (1) the energy storage period, which is from heel strike (clutch lock) to heel off the ground (maximum ankle dorsiflexion angle), corresponding to 15–50% of the stride length. (2) The energy release period, from heel-off to toe-off (maximum ankle plantarflexion angle), covers 50–80% of the stride length. (3) The free swing period, from toe-off to heel-touch, corresponds to 80–15% of the stride length.
Human test results. (a) Normalized sEMG signals of tibialis anterior, soleus, and gastrocnemius. (a1) RMS and (a2) iEMG values of tibialis anterior, soleus, and gastrocnemius. (b) Changes in normalized ankle joint biological moments. (b1) Normalized ankle joint biological moments. (c) Ankle joint angle variation curve during the gait cycle. (d) Metabolic cost normalized to body mass.

Figure 13(a) and (a1–a2) display the normalized sEMG signal, RMS value, and integral sEMG (iEMG) value of the tibialis anterior, soleus, and gastrocnemius muscles within a gait cycle. (1) When the subject walks wearing the exoskeleton, the sEMG signal of the tibialis anterior muscle only decreases slightly in the late period of the free swing, while it increases near the maximum dorsiflexion angle of the ankle joint with a noticeable amplitude and remains unchanged in other periods. Additionally, the tibialis anterior muscle’s RMS value is not significantly different before and after wearing the exoskeleton. (2) The activation degree of the soleus muscle is reduced throughout the energy storage period, the early part of the energy release period, and the late part of the free swing period. Compared with normal walking, the RMS and iEMG values of the soleus muscle decreased by 29.55% and 29.41%, respectively. (3) The activation degree of the gastrocnemius muscle decreases throughout the free swing period and the energy storage period. The activation remains constant for the rest of the period. Compared with normal walking, the RMS and iEMG values of the gastrocnemius muscle decreased by 13.16% and 8.16%, respectively.
The reasons are as follows: During the storage period, the tibialis anterior muscle, which provides dorsiflexion, should have reduced sEMG activity in response to the booster. However, the exoskeleton is mounted directly in front of the tibialis anterior muscle, and the booster’s branching reaction force on the tibialis anterior muscle causes it to be slightly compressed. This slight external compression may alter the sEMG signal pattern due to mechanical interference with the muscle surface electrodes. This results in a slight elevation and fluctuation of the sEMG signal, leading to an unremarkable effect before and after wear. However, the booster continues to provide gravity-opposed support to the body, reducing the activity of the soleus and gastrocnemius muscles, which support the stance and ankle stabilization. Here, ankle stabilization refers to the coordinated co-contraction of plantarflexion and dorsiflexors that helps maintain ankle angle during stance. The exoskeleton partially substitutes this stabilization function, thereby reducing muscle demand.
During the energy release period, the sEMG signal of the soleus muscle, which provides the primary plantarflexion action, is reduced as the booster releases energy to assist. During the free-swinging period, the release of stored energy by the booster improves exercise performance. However, a constant exercise speed is maintained on the treadmill, which in turn reduces the activation level of the three muscles and makes the subjects more energy-efficient while walking. Maintaining a fixed walking speed reduces variability in gait adaptation and highlights how the exoskeleton provides consistent mechanical assistance. This may contribute to energy-efficient walking by limiting motor adaptation demands.
Figures 13(b) and (b1) demonstrate the changes in ankle joint biological moments normalized to the subject’s mass and the mean and peak values of the moments. In conjunction with the ankle joint angles shown in Figure 13(c), the ankle joint angles and biological moments remain statistically indistinguishable during the free-swinging period and the later part of the energy-release period compared to not wearing the exoskeleton. The GA-clutch prevents the exoskeleton from interfering with the normal gait motion of the human body during the unassisted period, which indirectly confirms that the exoskeleton does not hinder the body’s motion. Additionally, the CA(t) illustrated in Eq. (5) quantifies the proportion of biological moment reduction contributed by the assistance phase relative to the total reduction over the gait cycle. This function effectively reflects the phase-dependent mechanical work distribution between the assistance and swing periods, providing an indirect visualization of how the GA-clutch and SC-booster modulate ankle joint kinetics across the gait cycle.
The biological moment of the ankle joint is lower after wearing the exoskeleton during the storage and early release periods. Combined with the sEMG of the soleus muscle in Figure 13(a), it can be seen that the sEMG signal of the corresponding purple-filled area decreases in synchronization with the subject’s biological moment. This is due to the conversion of human gravitational potential energy into elastic potential energy stored in the booster after clutch locking. The booster provides the lower limb with a support and reaction force that is different from the direction of gravity, and the biological moment required for the subject’s movement is reduced. At the same time, during the early stage of energy release, the ankle joint is in plantarflexion, and the booster releases the elastic potential energy to assist the subject. The sEMG activity of the soleus muscle, which is an important muscle that provides the main plantarflexion force for ankle joint movement, is reduced. Notably, the ankle plantarflexion angle increases at the end of the energy release and the beginning of the free swing. This also confirms that the release of elastic potential energy from the booster during the energy release period provides a boost to the plantarflexion movement.
Figure 13(d) shows the average net metabolic values of subjects normalized to body mass. The error bars represent the range interval of the measured data for all subjects. The average net metabolism of the subjects is reduced by 12.22% compared to not wearing the exoskeleton, with a 95% confidence interval of [4.18%, 16.72%]. Similarly, the average heart rate decreased by 11.17%, with a 95% confidence interval of [5.34%, 14.08%]. Only one subject in the data measured a slightly higher net metabolic rate than without the exoskeleton, which is strongly related to the subject’s discomfort with the device and occasional mechanical malfunctions during the test. The span of these confidence intervals reflects inter-subject variability, likely due to differences in gait patterns, device familiarity, and minor discomforts. Importantly, even the lower bounds indicate a substantial metabolic benefit, supporting the robust effectiveness of the GA-clutch and SC-booster combination. This relatively large metabolic reduction, which surpasses the ∼ 7% reduction reported in a landmark study by Collins et al. [Reference Collins, Wiggin and Sawicki23], may be attributed to several unique features of our device. First, the GA-clutch is specifically designed in accordance with the wearer’s gait pattern, achieving complete disengagement during the swing phase. This gait-adaptive feature minimizes unnecessary resistance and enhances adaptability to natural walking. Second, the SC-booster with its nonlinear elastic properties provides assistance that better matches the varying demands of human locomotion, thereby enabling a more efficient energy storage and release process. Finally, the participant pool (logistics and delivery personnel accustomed to long walking durations) may have exhibited enhanced responsiveness to the assistance provided. Together, these factors explain why our system delivers a higher-than-expected metabolic benefit.
Results of subjective perception test.

As shown in Table V, the subjective perception results indicate that the LFPA-EXO effectively reduced walking effort while providing a high level of comfort. Specifically, the average Borg CR10 score, which reflects perceived exertion, decreased from 3.8 in the no-exo condition to 2.8 when using the LFPA-EXO. This reduction suggests that the exoskeleton assisted users in minimizing physical effort during walking. In terms of comfort, participants rated the walking experience with the LFPA-EXO an average of 4.2 out of 5, indicating a generally comfortable walking experience. These findings confirm that the LFPA-EXO offers both functional support and good user comfort, supporting its practical value in gait assistance applications.
Overall, the LFPA-EXO has an enhanced effect on reducing metabolic cost in walking, mainly in the form of reducing sEMG signal activity of the soleus and gastrocnemius muscles, reducing ankle biological moment, and human net metabolic rate. It is worth noting that although the average ankle joint biological moment is only reduced by 6.30%, the net peak ankle joint biological moment is reduced by 24.02%, which may greatly reduce the risk of ankle injury during exercise. The exoskeleton also exhibits a greater assistance effect during jogging. This improvement is partly due to the increased dynamic gait frequency, which results in more frequent clutch engagements within a short period. More importantly, the significantly larger ankle dorsiflexion angle during jogging requires reconsideration of the clutch stroke design; a longer or differently tuned stroke enables the clutch–spring system to store and release energy more effectively under high-dorsiflexion conditions, thereby enhancing propulsion assistance. To further account for these dynamics, future work will evaluate different running speeds and redesign the SC-booster and GA-clutch parameters to better match the kinematic characteristics of high-frequency gait.
7. Conclusions
This study presents the design of a LFPA-EXO, with a mass of 1.755 kg, which effectively reduces the metabolic cost of walking by 12.22%. Reducing the overall device mass is also a key factor contributing to metabolic reduction [Reference Coifman, Kram and Riemer41, Reference Mooney, Rouse and Herr42], and the substantially lower weight of the LFPA-EXO offers an energetic advantage compared with higher-mass exoskeleton designs [Reference Tang, Wang, Ji, Zhou, Yang, Wei and Zhang12, Reference Pardoel and Doumit24]. The LFPA-EXO integrates a GA-clutch and a SC-booster, which reduce biological moments at the ankle joint and decrease sEMG activity of the soleus and gastrocnemius muscles. The GA-clutch operates with an interference degree of less than 5% and an assistance degree greater than 85%, ensuring that the device does not disrupt natural gait while providing substantial assistance. This balance is crucial for enhancing the subjects’ comfort and walking performance without imposing excessive mechanical interference.
Limitations: This study was conducted solely on healthy participants, and the LFPA-EXO has not yet been evaluated in individuals with impaired gait patterns. For potential clinical or rehabilitation applications, several adaptations may be required. For example, individuals with gait asymmetries, reduced plantarflexion strength, or limited dorsiflexion may benefit from an adjustable clutch engagement threshold, customized booster stiffness, or tailored alignment to accommodate abnormal joint trajectories. These modifications would help ensure safe, comfortable, and effective assistance in populations whose biomechanics differ significantly from healthy adults.
Future directions: Although the LFPA-EXO has demonstrated effective metabolic cost reduction during walking, it also shows promise for enhancing performance in dynamic activities such as running and jumping. The SC-booster’s assistive torque increases at larger dorsiflexion angles, suggesting benefits for movements that require deep ankle flexion. Future research will focus on optimizing the booster layup and clutch mechanism to extend applicability to varied motion scenarios, including running and jumping. Additionally, extending the evaluation to real-world environments and clinical populations will be a priority, enabling refinement of the device for rehabilitation use and validation of its long-term functional benefits.
Supplementary material
The supplementary material for this article can be found at https://doi.org/10.1017/S0263574726103142.
Acknowledgements
We wish to express our gratitude to the participants who took part in this article.
Authors contributions
Xishuang Jing: Methodology and Resources. Longfei Cai: Data curation, Writing – Original draft preparation. Zhe Zhao: Validation and Funding acquisition. Siyu Chen: Writing – Review & Editing and Formal analysis. Xiao Chen: Software and Acquisition of data. Jihao Ran: Conceptualization and Data curation. Chengyang Zhang: Investigation and Acquisition of data. Fubao Xie: Visualization and Project Administration. Xiliang Wang: Supervision and Acquisition of data.
Availability of data and material
The data generated and analyzed during the current study are not publicly available as the data also form part of the ongoing study.
Funding
This work is supported by Beijing Institute of Precision Mechatronic and Controls (Grant No.13000002023146006).
Conflict of interest
The authors declare that they have no known competing financial interests or personal relationships that could have appeared to influence the work reported in this paper.
Ethical approval and consent to participate
This work involved human subjects or animals in its research. Approval of all ethical and experimental procedures and protocols was granted by the Ethical Committee of Beihang University. All participants have consented to take part in the experiments of this research study.
Consent for publication
Informed consent and publication consent were obtained from all individual participants included in the study. The authors affirm that human research participants provided informed consent for the publication of the images in Figure 12.