

Drug-induced hepatotoxicity (DIH) is a well-known complication in the treatment of tuberculosis (TB). This may sometimes require interruption of therapy with anti-TB drugs. Incidence of hepatotoxicity during treatment of TB disease varies from 5 to 33 %. It depends on the study population, definition of hepatotoxicity, anti-TB drugs used, and the way of monitoring(Reference Saukkonen, Cohn and Jasmer1). Many factors have been associated with DIH. These include TB morbidity(Reference Dossing, Wilcke and Askgaard2–Reference Sharma, Balamurugan and Saha5), co-infections such as HIV and hepatitis B and C(Reference Fernandez-Villar, Sopena and Garcia6–Reference Yimer, Aderaye and Amogne12), malnutrition(Reference Shakya, Rao and Shrestha4, Reference Singh, Arora and Garg13), old age(Reference Teleman, Chee and Earnest14), female sex(Reference Dossing, Wilcke and Askgaard2, Reference Shakya, Rao and Shrestha4, Reference Lee, Mennone and Jones15), elevated transaminases at baseline(Reference Teleman, Chee and Earnest14, Reference Fernandez-Villar, Sopena and Fernandez-Villar16–Reference Sun, Chen and Gau18), and high alcohol intake(Reference Pande, Singh and Khilnani3, Reference Fernandez-Villar, Sopena and Garcia6).
Malnutrition, as assessed by a low BMI, has been associated with the occurrence of TB-DIH in two studies(Reference Shakya, Rao and Shrestha4, Reference Singh, Arora and Garg13). BMI at the start of TB treatment is a frequently used static nutritional risk factor in TB research(Reference Johnston, Shahidi and Sadatsafavi19, Reference Hanrahan, Golub and Mohapi20). Body weight (BW) change after the start of TB treatment may reflect an improving or a worsening nutritional status during TB treatment. In this study we intended to assess the link between this BW change and drug-induced liver toxicity necessitating interruption of anti-TB drugs.
Methods
Patients
A retrospective review of patients records, admitted between January 2005 and July 2008 at TB Centre Beatrixoord of University Medical Center Groningen, Netherlands, was conducted. All patients>14 years of age diagnosed with active Mycobacterium tuberculosis infection(Reference Maher, Chaulet and Spinaci21) were included. Interrupters were patients who had to stop one or more anti-TB drugs for reasons of hepatotoxicity based on international guidelines(Reference Saukkonen, Cohn and Jasmer1, 22).
Controls (non-interrupters) were all other patients admitted during the same study period. The following data about the cases were collected: age, sex, addictions, time to interruption, nutritional status, morbidity, medication and drug sensitivity test results. Because this was a retrospective chart review with anonymised reporting, approval by the ethics committee was not required.
Nutritional status
Nutritional status was defined by BW change. BW gain after the start of anti-TB drugs was classified as a gain ≥ 2 kg within 4 weeks after the start of anti-TB drugs. Weight loss was defined as a decrease in BW ≥ 2 kg within 4 weeks after the start of anti-TB drugs. If either weight gain or loss was < 2 kg, BW was considered as stable. If anti-TB drugs were interrupted after more than 4 weeks of treatment, the BW data of the 4 weeks before interruption were used to assess the nature of BW change.
Medication
Gradual introduction of anti-TB drugs at the start of treatment was defined as an increasing day dose over time or sequential introduction of the drugs. If anti-TB drugs were administered for at least 2 weeks, medication was classified into three possible anti-TB drugs schedules: (1) isoniazid (H), rifampicin (R), pyrazinamid (Z), ethambutol (E); (2) HRZ; (3) other, including drugs for multi-drug-resistant TB (MDR-TB). Day dose was defined as the highest dose of anti-TB drugs in mg per kg baseline BW that had been administered for at least 2 weeks. If interruption of anti-TB drugs occurred within the first 2 weeks of treatment, the day dose was defined as the highest dose given until interruption. Co-medication administered to anti-TB treatment was classified into no, low or high risk for DIH(Reference van Hest, Baars and Kik23).
Tuberculosis morbidity
Patients were classified based on the severity of TB using WHO criteria(Reference Maher, Chaulet and Spinaci21). Classifications were performed independently by two lung specialists. In case of discordance, cases were reviewed and final classifications were reached by consensus.
Comorbidity
The effect of comorbidity on hepatotoxicity was assessed by applying the Charlson Comorbidity Index(Reference Hall, Ramachandran and Narayan24, Reference de Groot, Beckerman and Lankhorst25). Infection due to the hepatitis B virus (HBV), hepatitis C virus (HCV) and HIV were noted as autonomous morbidity and not included in the Charlson Comorbidity Index. HBV, HCV and HIV status were listed positive if medical files noted presence of HBV surface antigen, HCV antibodies and HIV antibodies, respectively.
Statistical analysis
SPSS for Windows (version 16.0; SPSS, Inc., Chicago, IL, USA) was used for all statistical analyses. Differences in categorical variables between interrupters and non-interrupters were compared using Pearson's χ2 test, or Fisher's exact test for dichotomous variables. Differences in parametric variables were assessed by Student's unpaired t test, and in non-parametric variables by the Mann–Whitney U test. All the statistical tests were two sided, and a P-value < 0·05 was considered statistically significant. Variables associated with interruption at a P-value < 0·1 in the monovariate analysis and variables that were considered relevant in previous TB hepatotoxicity studies were analysed using multivariate logistical regression. Using the enter method we aimed for a final multivariate model containing the least possible variables that explained the most – the parsimonious model. Cox proportional hazards regression analysis was used to evaluate the simultaneous effect of different variables on time to interruption during TB treatment. Time to interruption in days was measured from the day of start of anti-TB drugs until the day of interruption. Non-interrupters were censored at 300 d counted from the start of anti-TB drugs. Kaplan–Meier hazard curves were generated for the primary outcome.
Results
Study population
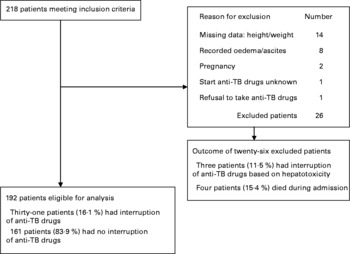
Of the 218 patients admitted during the study period, twenty-six (11·9 %) were excluded from the analysis; the reasons are given in the flow diagram (Fig. 1). Of the remaining 192 patients, thirty-one (16·1 %) developed hepatotoxicity, necessitating interruption of anti-TB drugs.
Flow diagram of study subjects. TB, tuberculosis.
Demographic data
There were 148 (77·1 %) males. The median age of the study population was 38 (range 16–84) years. Patients with interruption of anti-TB drugs were comparable in age, sex, origin, history of alcohol abuse and smoking to non-interrupters. More patients with a history of drug abuse were observed among the non-interrupters (Table 1).
(Mean values and standard deviations; numbers and percentages)

TB, tuberculosis.
Values were significantly different: **P < 0·01; ***P < 0·001.
† The number of analysed/tested patients is 192, unless otherwise specified.
‡ Mediterranean countries: patients originated from Morocco, and Turkey.
§ Drugs abuse of cocaine, heroine, marijuana.
Nutritional status
A majority of 163 patients (85·3 %) reported BW loss before the start of treatment v. twenty-six patients (13·6 %) who reported no BW change, and two patients (1·0 %) who reported BW gain. The reported BW change before the start of TB treatment was not significantly different between interrupters ( − 12·6 %, sd 7·1) and non-interrupters ( − 15·0 %, sd 11·1). BMI at the start of treatment did not show any significant difference between interrupters and non-interrupters either. During TB treatment twenty-eight patients (14·6 %) lost BW, sixty-four patients (33·3 %) gained weight and 100 patients (52·1 %) had a stable BW (Table 1).
Medication
The interrupters and non-interrupters were comparable in all medication characteristics studied, except for the pyrazinamid dose and the number of patients above the recommended upper BW dose of pyrazinamid, which were both lower for the interrupters(26). In the interrupters, BMI was significantly lower and BW doses higher after interruption (Table 2).
(Mean values and standard deviations; numbers and percentages)

TB, tuberculosis; H, isoniazid; R, rifampicin; Z, pyrazinamid; E, ethambutol; DIH, drug-induced hepatotoxicity.
Values are significantly different: **P < 0·01; ***P < 0·001.
† The number of analysed/tested patients is 192, unless otherwise specified.
‡ Other, the anti-TB drugs schedule consists other than the sets HRZE or HZE, with the following drugs: amikacin, capreomycin, clarithromycin, clofazimine, cycloserine, doxycycline, ethambutol, isoniazid, levofloxacin, linozelid, moxifloxacin, prothionamide, pyrazinamide, rifabutin, rifampicin, thioacetazone.
§ The Wilcoxon signed-rank test was used to compare BMI and body weight doses at the start of treatment with those after interruption.
Morbidity and tuberculosis drug susceptibility
Both the groups were comparable in disease severity, comorbidity, baseline transaminases, TB drug susceptibility of M. tuberculosis isolates. Only the proportion of HIV-positive patients was significantly higher among the interrupters than among the non-interrupters (Table 3).
(Mean values and standard deviations; numbers and percentage)

HBV, hepatitis B virus; pos, positive; HCV, hepatitis C virus; AST, aspartate transaminase; ALT, alanine transaminases.
* P < 0·05.
† The number of analysed/tested patients is 192, unless otherwise specified.
‡ Untested patients with: HBV status n 123; HCV status n 121; HIV status: n 28.
§ Untested patients with TB drug susceptibility of strains (n 32).
Independent risk factors for interruption
BW loss after the start anti-TB drugs, HCV infection, age>60 years and presence of MDR-TB were significant independent risk factors for interruption in a multivariate model. Sex and age were forced into this multivariate model. Age as a continuous variable did not prove linearity in classes of 10 years, therefore we decided to enter the variable of age into two classes (>60 and ≤ 60 years), based on the results from prior publications(Reference Schaberg, Rebhan and Lode27, Reference Yee, Valiquette and Pelletier28). HBV infection, abnormal baseline aspartate transaminase and drug abuse were not independent risk factors for interruption. These three factors did not contribute to the significance of the other independent risk factors either. For these two reasons they were not added to the final multivariate model. HIV infection was not an independent risk factor for interruption either, nor was it a confounder as it did not alter the main risk factor of interest (weight loss after the start of anti-TB drugs) for more than 10 % of the adjusted OR. For explanatory reasons, HIV infection was kept in the final model. Results of univariate and multivariate analysis for risk factors for interruption in time are shown in Table 4.
(Odds ratios and hazard ratios with 95 % confidence intervals)

HBV, hepatitis B virus; HCV, hepatitis C virus; MDR-TB, multi-drug resistant tuberculosis i.e., resistance to isoniazid and rifampicin; AST, aspartate transaminase.
Values were significantly different: *P < 0·05; **P < 0·01; ***P < 0·001.
† OR are estimated from logistic regression to obtain risk factors for interruption in time. Hazard ratios are estimated from Cox multivariate proportional hazards modelling to obtain hazards for interruption over time.
‡ Unadjusted OR and unadjusted hazard ratio's for HIV status, HBV status, HCV status, baseline ASAT and drug susceptibility of strains are corrected for their missing data.
§ Adjusted OR and hazard ratios are corrected for the data of age>60 years, sex, weight loss ≥ 2 kg, HIV status, HCV status, drug susceptibility of strains.
¶ Abnormal baseline AST, AST>40 IU/l.
Time to interruption
The median time to interruption was 15 (range 3–270) d. Significant adjusted hazard ratios for time to interruption were age>60 years, BW loss, and HIV- and HCV-infections, and are presented in Table 4. For a patient at the start of TB treatment, the cumulative hazard of interrupting anti-TB drugs within 60 d was 0·034 (Fig. 2(a)). The cumulative hazard for patients interrupting anti-TB drugs between 60 and 270 d after the start of TB treatment was 0·058 − 0·034 = 0·024. The adjusted hazard ratio for HIV-positivity was 4·2 (95 % CI 1·40, 12·9) (Table 4, Fig. 2(b)).
(a) Cox proportional hazard function of a patient at mean of covariates. (b) Cox proportional hazard function for the HIV status. TB, tuberculosis. ![]() , No HIV;
, No HIV; ![]() , HIV;
, HIV; ![]() , not tested for HIV.
, not tested for HIV.

Interrupters who lost BW discontinued their anti-TB drugs predominantly in the beginning of treatment: 67 % of those loosing BW interrupted anti-TB drugs within the first 15 d of treatment, v. 33 % after 15 d (P = 0·046, Table 5, Fig. 3(a)). In contrast, all interrupters who were HCV-positive discontinued their anti-TB drugs after 30 d (P = 0·023; Table 5, Fig. 3(b)). All the interrupters who were MDR-TB patients had to discontinue their anti-TB drugs after 30 d of TB treatment too (P = 0·009; Table 5).
(Numbers and percentages)

HCV, hepatitis C virus; M. tb, Mycobacterium tuberculosis.
Values were significantly different: *P < 0·05; **P < 0·01.
Kaplan–Meier curve of the hazard for interruption of (a) weight change after start TB treatment and (b) hepatitis C status. TB, tuberculosis; HCV, hepatitis C virus. (a) ![]() , Weight loss;
, Weight loss; ![]() , stable weight;
, stable weight; ![]() , weight gain. (b)
, weight gain. (b) ![]() , No HCV;
, No HCV; ![]() , HCV;
, HCV; ![]() , not tested for HCV.
, not tested for HCV.

Discussion
This retrospective study demonstrated that TB treatment had to be interrupted due to DIH in 16·1 % of the admitted TB patients. Weight loss after the start of anti-TB drugs, HCV infection, age>60 years and MDR-TB were independent and significant risk factors for interruption. The median time to interruption was 15 (range 3–270) d, and 73 % of the interrupters had to discontinue anti-TB drugs within the first 60 d of TB treatment.
This is the first report to show that weight loss of 2 kg or more, developed within 4 weeks during TB treatment, appears to be a highly significant independent risk factor for TB-DIH. Other nutritional factors such as self-reported weight loss before treatment and BMI at the start were not associated with interruption.
In most patients (85·4 %) in this study BW stabilized or increased during treatment, whereas a small proportion (14·6 %) demonstrated weight loss. Not the BMI at the start of treatment, but the ability to adequate food intake seems to be important during treatment. To our knowledge, research on factors associated with weight loss during TB treatment has not been performed yet. We suggest that side effects of anti-TB drugs, such as gastrointestinal symptoms, which are relatively common in the first few weeks of TB treatment(Reference Blumberg, Burman and Chaisson29) may result in inadequate food intake(Reference Warmelink, Poels and van Altena30) and might cause weight loss if gastrointestinal symptoms persist or worsen. Indeed gastrointestinal symptoms have been identified as risk factors for predominantly early interruptions(Reference Baghaei, Tabarsi and Chitsaz31), which is in line with weight loss-associated early interruptions in this study (Fig. 3(a), Table 5).
AIDS as a comorbidity might add to weight loss during TB treatment. In this study the BMI at the start of TB treatment was not different between HIV-positive patients and non-HIV positive patients. However, self-reported weight loss noted as the percentage of the normal BW before disease was significantly higher in HIV-positive patients (21·2 %) than in the non-HIV-positive patients (14·0 %). This weight loss before TB treatment might have caused associated illness and disability to adequate food intake for sustaining or increasing BW during TB treatment in AIDS patients.
An adequate intake of nutrients is important for the integrity of liver metabolism and detoxicification of TB drugs, as the cytochrome P-450 enzyme system is affected by nutrient intake and fasting(Reference Guengerich32).
Although BW doses of anti-TB drugs were higher after interruption due to weight loss compared to the start of TB treatment (Table 2), we do not consider these higher doses relevant for the development of DIH. There was no difference between interrupters and non-interrupters with regard to BW doses above the recommended upper BW dose of isoniazid and rifampicin(26). Moreover, a significantly smaller part of interrupters received BW doses of pyrazinamid above the recommended upper BW dose than non-interrupters.
Interrupters who were HCV-positive patients had to interrupt their treatment after 30 d of treatment, in contrast to those with BW loss who had to interrupt early. This may be caused by a delayed inflammatory immune response against HCV occurring only after several weeks of TB treatment, resulting in hepatic cell damage. At the start of TB treatment the inflammatory response against HCV-infected liver cells is probably suppressed as a result of untreated TB and associated malnourishment. Shortly after the introduction of successful treatment the inflammatory immune response may restore and target the HCV-infected liver cells. An immune reactivation to HCV during TB treatment with interruption of anti-TB drugs as a result has not been described before and needs further investigation.
Age above 60 years was an independent risk factor for DIH in our model; this has been reported earlier(Reference Teleman, Chee and Earnest14). Increased susceptibility for hepatotoxicity with higher age could be partly due to physiological changes. Intravascular, organ, muscle and distribution volumes are usually smaller in the elderly(Reference Schwartz33), which might result in depressed hepatic drug metabolism and elimination, particularly of drugs metabolised by the cytochrome enzyme system(Reference Cusack34, Reference Jorquera, Culebras and Gonzalez-Gallego35). Another mechanism may be that elderly people have a reduced food intake(Reference Alix, Berrut and Bore36), causing lower availability of nutrients for liver detoxification of anti-TB drugs.
MDR-TB as an independent risk factor for TB-DIH has not been reported earlier. MDR-TB treatment lasts longer (typically 18–24 months) and requires drugs which are more toxic than standard treatment drugs for TB. Toxicity developed relatively late (Table 5), and this might reflect immune enhancement as discussed above.
Interruption of anti-TB drugs because of hepatotoxicity typically occurred within the first 2 months of treatment. This is in accordance with other TB-DIH studies(Reference Shakya, Rao and Shrestha4, Reference Sharma, Balamurugan and Saha5, Reference Teleman, Chee and Earnest14, Reference Sharifzadeh, Rasoulinejad and Valipour37). The cumulative hazard for interruption was highest during the first 60 d of treatment (Fig. 2(a)). Concerning the identified factors for interruption, 66·7 % of the weight-losing interrupters had to interrupt anti-TB drugs within the first 15 d of treatment v. 33·3 % after 15 d of treatment (P = 0·046; Table 5; Fig. 3(a)). In contrast, all the HCV-infected and all MDR-TB interrupters had to stop anti-TB drugs after 30 d of treatment (Fig. 3(b), Table 5). To our knowledge this is the first study identifying risk factors for TB-DIH related with time to interruption.
In contrast to other studies, neither HIV(Reference Ungo, Jones and Ashkin11, Reference Yimer, Aderaye and Amogne12) nor HBV co-infection(Reference Lee, Koh and Choi8, Reference Patel and Voigt10) were identified as independent risk factors, but in the studied population only three patients (1·2 %) had HBV. Although HIV infection was not identified as a risk factor, a significant hazard ratio of 4·2 for interruption of HIV-positivity was found. This hazard ratio implies that the simultaneous effects of risk factors of the HIV-positive patients together exerted a hazard over time to cause interruption (Fig. 2(b)). Because in five of the six HIV-positive interrupters weight loss was identified, we speculate that weight loss is an important risk factor for HIV-positive patients in TB-DIH.
In contrast to other studies(Reference Dossing, Wilcke and Askgaard2–Reference Sharma, Balamurugan and Saha5), severity of TB disease was not associated with hepatotoxicity. Of the 192 patients, most (70·3 %) were classified in the pulmonary TB class. This large class of pulmonary TB probably included patients with a very broad range of clinical disease severity, decreasing the possible association between the disease severity and interruption.
The strength of the study is the heterogeneous study population with many risk factors for hepatotoxicity. The limitations of the study are the retrospective design and the primary outcome measure of interruption which is not based on strictly defined criteria.
Interruption of treatment of TB prolongs treatment, increasing the social and economic burden for the patient and the community. This study shows that weight loss was the most important risk factor. Prospective studies are urgently needed to assess the cause-and-effect relationship between weight loss and an evolving DIH during TB treatment.
In conclusion, weight loss of 2 kg or more during TB treatment was a significant independent risk factor for interruption of anti-TB drugs. For interruption, which occurs predominantly within the first 60 d of TB treatment, HCV infection, age>60 years and MDR-TB were also identified as significant risk factors.
Acknowledgements
The authors thank Judith Vonk for statistical advice. Alie de Boer and Natascha van Weerlee are thanked for their administrative support. I. W. was sponsored by a grant from the Netherlands Beatrixoord Foundation (grant no. WO 210.093). There is no conflict of interest to report. I. W. was the principal investigator and in charge of data collection, analysis and writing the manuscript. N. H. t. H., T. S. v. d. W. and R. A. contributed to the design of the study. R. v. A. helped in the data collection. N. H. t. H. contributed to the data analysis and writing of the manuscript, and provided advice and consultation. R. v. A. and T. S. v. d. W. were responsible for classification of the TB disease severity. Final manuscript review and approval was done by I. W., N. H. t. H., T. S. v. d. W. and R. v. A.


