

- CCK
cholecystokinin
- GE
gastric emptying
- GI
gastrointestinal
- HF
high-fat
- LF
low-fat
- MCTT
mouth-to-caecum transit time
Obesity
Obesity is defined as a condition of abnormal or excessive fat accumulation in adipose tissue to the extent that health may be impaired(Reference Sherwood1). The obesity epidemic began to escalate in the early 1980s and has continued to rise relentlessly(Reference James2). The WHO now recognises obesity as a growing threat to the global population, touching both developed and developing countries(3). However, this threat to health has now augmented as growing rates of chronic diseases arise from the current obesity problem(4). It was estimated in 2002 that ≥135 million EU citizens were affected by obesity and that, perhaps, another 70 million were affected in those countries seeking to join the EU at that time(Reference Deitel5). Currently, in many European countries more than half the population are overweight and ⩽30% of adults are clinically obese(Reference Deitel5).
A high-fat diet as a cause of obesity
The causes of obesity are numerous; genetic(Reference Bouchard, Savard and Despres6–Reference Stunkard and Messick9), physiological(Reference Haapanen, Miilunpalo and Vuori10, Reference Slattery, McDonald and Bild11), psychological(Reference Saelens and Epstein12) and dietary factors(Reference Hill and Melanson13, Reference Lissner, Levitsky and Strupp14) have all been outlined as causative. The primary instigator of obesity is the body being in a state of positive energy balance over a prolonged period of time. When the body is in a state of energy balance energy intake is equal to energy expenditure and body mass does not fluctuate.
Dietary lipids are both energy rich and palatable. Since the 1950s dietary fat intake has increased from approximately 30% energy intake to 40% energy intake(Reference Dreon, Frey-Hewitt and Ellsworth15). It has been suggested that the appetite control system may have only weak inhibitory mechanisms to prevent the overconsumption of dietary fat(Reference Blundell, Burley and Cotton16). This situation could result in a positive energy balance and gradual upward drift in adiposity. The available data on dietary intake are problematic as they have been obtained through self-reports, which have been shown to misrepresent the actual amount of energy consumed(Reference Heitmann and Lissner17). A large proportion of underreporting is a result of the increase in food portion size over the past few decades. It can be seen in the form of ‘supersizing’ in fast-food restaurants, in the larger portions served in other restaurants and in the increase in the unit size of products such as confectionery bars and soft drinks(Reference Hill and Melanson13). Clearly, there exists ‘a mismatch between our physiology and our modern world’(Reference Peters, Wyatt and Donahoo18).
The common perception that sugar contributes to overeating and obesity is not supported by the available data(Reference Anderson19). It has been stated that ‘the current public health recommendations to lower dietary fat intake appear to be appropriate’(Reference Hill, Melanson and Wyatt20). A high-fat (HF) diet has been found to lead to a 15·4% surfeit and a low-fat (LF) diet to an 11% deficit in energy intake compared with a medium-fat diet, resulting in changes in body mass(Reference Lissner, Levitsky and Strupp14). Such changes occur because individuals on a HF diet are more likely to overconsume energy as a result of the higher energy density of fatty food in comparison with other food groups, so they may consume the same mass of food but more energy(Reference Stubbs, Harbron and Murgatroyd21). Several other studies have also suggested that reducing dietary fat intake may help reduce total energy intake(Reference Kasim, Martino and Kim22–Reference Ello-Martin, Roe and Ledikwe24). Additionally, when dietary fat is covertly reduced by replacement with non-energetic fat substitutes, most volunteers do not compensate by increasing voluntary fat intake or by increasing energy intake from other macronutrients(Reference Hill and Peters25).
The role of dietary fat in obesity can be explained in several other ways. First, dietary-induced thermogenesis is lower when HF diets are consumed compared with LF diets(Reference Flatt, Ravussin and Acheson26). Second, a greater percentage of excess energy is stored as fat during fat overfeeding (90–95%) compared with the corresponding amount stored during carbohydrate overfeeding (75–85%)(Reference Horton, Drougas and Brachey27). The reason that an HF intake has such serious implications is that fat intake is not oxidised in proportion to its consumption, in contrast to dietary carbohydrate(Reference Thomas, Peters and Reed28). As the rate of fat and carbohydrate oxidation is not influenced by the fat content of the meal, fat may be the macronutrient for which metabolic regulation is least effective(Reference Flatt, Ravussin and Acheson26). It has been shown that an increase in fat intake does not stimulate fat oxidation, with the suggestion that ‘obesity is therefore due to a long-standing positive fat-balance, which may simply be due to a high fat diet’(Reference Swinburn and Ravussin29). A review of a variety of research on a wide range of mammals has concluded that ‘animal models point to dietary fat as one potentially important component in the aetiology of human obesity’(Reference West and York30). Furthermore, dietary obesity can be reversed by switching rodents from an HF diet to an LF diet(Reference Rolls, Rowe and Turner31). The inference from these findings is that dietary fat is implicated in overconsumption of energy and the development of obesity as a result of both its high energy density and the capacity of the body to utilise it.
Gastric emptying and satiety
The satiating effect of distension of the stomach has been repeatedly demonstrated. A barostatic balloon has been used to demonstrate that gastric distension increases fullness(Reference Feinle, Grundy and Fried32). It has also been shown that the presence of an inflated gastric balloon in the stomach can be used as a treatment for obesity as it reduces food intake and hunger in obese individuals(Reference Nieben and Harboe33, Reference Rigaud, Trostler and Rozen34). The threshold volume for a gastric balloon to reduce food intake is approximately 400 ml(Reference Geliebter35). This effect of gastric distension does not appear to be nutrient specific. The stomach is able to sense some aspects of nutrients, which does not appear to affect satiety. Perceptions of fullness and satiety have been found to be linearly associated with postprandial gastric volumes, but not with macronutrient composition(Reference Goetze, Steingoetter and Menne36).
Gastric satiety is primarily regulated by neural pathways via the vagal nerve, which has been demonstrated in rat vagotomy studies. Completely-vagotomised animals do not inhibit feeding in response to 5 ml and 10 ml loads, and there is a similar response following different selective vagotomies, with the extent of suppression after vagotomy being proportional to the density of the afferent innervation respective branches supplied to the stomach(Reference Phillips and Powley37). Studies performed by primarily keeping the innervation of the gastrointestinal tract intact and recording the neurophysiological response from the vagal afferent fibres have similarly shown increased recordings from vagal afferents with increasing gastric saline loads(Reference Schwartz and Moran38).
Gastric emptying (GE) refers to the rate at which food empties from the stomach into the duodenum. GE plays a major role in the regulation of gut distension and hence satiety. A significant correlation between the postprandial increase in hunger ratings and the time for 90% of the meal to empty from the stomach (r 0·75) has previously been reported(Reference Sepple and Read39).
However, although stomach distension leads to satiation via the vagal nerve, it must be emphasised that gastric distension in combination with the administration of nutrient into the duodenum results in even greater satiation. The sensory responses to gastric distension are modified by duodenal nutrients; the arrival of nutrients, especially fat, in the small intestine during GE can reinforce the effects of gastric filling(Reference Feinle, Christen and Grundy40). Duodenal lipid primarily exacerbates gastrointestinal sensations during gastric distension. Cholecystokinin (CCK)-A and serotonin receptors are involved in the effects of duodenal lipid on gastrointestinal sensations during gastric distension(Reference Feinle, Grundy and Fried32, Reference Feinle and Read41), suggesting a modulatory role for small intestinal receptors to CCK and serotonin. GE regulates both the provision of nutrients into the stomach and the level of distension of the stomach; in doing so it controls the levels of satiety and subsequent food intake.
Gastric emptying in obesity
Theoretically, gastric distension in combination with the delivery of nutrients to the small intestine contributes to satiety in human subjects(Reference Read, French and Cunningham42). The difference in GE in obese individuals compared with lean individuals remains equivocal in the extant literature(Reference Gallagher, Geoghegan and Baird43) (Table 1). Several publications have reported shorter GE times for solid food in the obese population(Reference Zahorska-Markiewicz, Jonderko and Lelek44–Reference Cardoso-Junior, Coelho and Savassi-Rocha47) and in heavier-weight individuals(Reference Johansson and Ekelund48). In addition, results have shown faster transit of liquids(Reference Basilisco, Camboni and Bozzani49) and a decreased lag phase(Reference Glasbrenner, Pieramico and Brecht-Krauss50). The proposal that rapid GE is a predisposing factor in the genesis of increased food intake and obesity(Reference Hunt, Cash and Newland51) has received support(Reference Wright, Krinsky and Fleeman45, Reference Johansson and Ekelund48). It was hypothesised that obese individuals have different osmolar receptors and size receptors for ingested foodstuff(Reference Hunt, Cash and Newland51). On the other hand, it has been suggested that obese individuals may have a more efficient antral grinding mechanism or secrete more gastric fluid to enhance early emulsification of solid food(Reference Wright, Krinsky and Fleeman45). However, a review of the latter study suggests that it is not enhanced GE that obese subjects are actually expressing but instead enhanced liquification, as GE of liquids is similar for both obese and normal-weight individuals; alternatively, non-liquefied particles are emptied from the stomach of obese individuals(Reference Dubois52). It has also been suggested that obese individuals have increased GE as a result of a fat-mediated intestinal feedback mechanism(Reference Tosetti, Corinaldesi and Stanghellini46).
Studies examining differences in gastric emptying between lean and obese individuals

M, males; F, females; CHO, carbohydrate; LF, low fat; HF, high fat; –, was not tested or not specified; no change; ↓, delayed or longer emptying times; ↑, accelerated or shorter emptying times.
A study comparing the mouth-to-caecum transit time (MCTT) and dietary intake of eight obese males with that of eight age- and height-matched lean males has shown that an LF meal has a longer transit time than an HF meal (Fig. 1). This difference is a result of the meals not being of the same mass, although they were isoenergetic; the LF meal had a greater mass and hence a longer MCTT. Obese participants were found to have a shorter transit time following both LF and HF meals (P=0·036). When expressed as a percentage daily energy intake, dietary fat is higher in the obese group (38·3 (sd 7·5)) compared with the lean group (28·6 (sd 3·6); P=0·012) and dietary carbohydrate is lower in the obese group (40·2 (sd 6·7)) compared with the lean group (50·7 (sd 5·9); P=0·048). To test the possible role of dietary fat in gastrointestinal (GI) alterations in chronic obesity, MCTT has been further analysed using the dietary energy intake from fat as a covariant. Dietary fat from energy was found to significantly affect the way the subject's MCTT responds to the fat content of the test meals (P=0·024). After adjusting for dietary fat the interaction between obesity and MCTT of the meal was shown to be significant (P=0·011). These results can be summarised as follows: all HF meals have faster GI transit compared with LF meals; this acceleration is more pronounced in obese subjects eating a diet higher in fat(Reference Clegg and Shafat53). These findings support earlier research that shows that obese individuals have a faster transfer of energy from the stomach to the duodenum than lean individuals(Reference Hunt and Stubbs54).
Mouth-to-caecum transit time (MCTT) in obese (•) and lean (○) males following low-fat and high-fat breakfasts. Values are means and standard deviations represented by vertical bars for eight subjects per group. The obese group had shorter MCTT following both the low-fat and high-fat meals (P=0·036). (From Clegg & Shafat(Reference Clegg and Shafat53).)

It has also been reported in the literature that GE times are longer in the obese population for solid food(Reference Horowitz, Collins and Shearman55–Reference Jackson, Leahy and McGowan58) and for liquids(Reference Horowitz, Collins and Shearman55, Reference Maddox, Horowitz and Wishart57). A delayed lag time has also been observed(Reference Horowitz, Collins and Shearman55–Reference Jackson, Leahy and McGowan58). It has been postulated that disordered GE is not a major factor in the pathogenesis of obesity but secondary to weight gain and may be related to increased gallbladder volume and reduced postprandial gallbladder emptying in obese patients(Reference Maddox, Horowitz and Wishart57). It has also been suggested that the delay in GE can be attributed to slower distribution of the meal as a result of a reduction in fundal tone, altered sensitivity of the stretch receptors or a change in antral area and mixing(Reference Jackson, Leahy and McGowan58). These changes may be a consequence of increased gastric distension and HF diets. As obese individuals have been shown to possess increased gastric capacity(Reference Geliebter and Hashim59), the continual distension may result in poor fundal and antral tone with reduced sensitivity of the stomach stretch receptors. The poor fundal and antral tone may delay GE, as it causes slower distribution of food from the fundus down to the antrum. The increases in antral area will cause decreased ability to mix the foods and slower liquification, leading to longer GE times. GE of liquid is therefore unaffected, as liquification is not necessary and hence GE occurs at the same rate in obese and normal-weight individuals. A further theory that supports delayed GE is that it may actually contribute to obesity rather than be a consequence of obesity(Reference Jackson, Leahy and McGowan58). A lack of nutrients in the duodenum resulting from reduced GE means that GI hormones responsible for the regulation of both GE and satiety are not released in high enough concentrations. In the case of a lack of hormones such as CCK, the feedback mechanism is interrupted and satiety signals are not sent to the brain. In this way the individual continues feeding. Similarly, the distension that should occur with eating that stimulates the mechanoreceptors in the stomach wall and inhibits hunger sensations is diminished leading to a decrease in satiety and continued consumption. However, there is no experimental evidence that these proposed mechanisms may be a cause of delayed GE.
Inconsistencies and the controversial nature of the literature may be attributed to the variety of different techniques and poorly-controlled research practices used. Studies on obesity that have used test meals with a HF and energy content(Reference Zahorska-Markiewicz, Jonderko and Lelek44, Reference Tosetti, Corinaldesi and Stanghellini46) have found acceleration in GE as compared with studies that used test meals low in fat and energy content. It has been suggested that the repeated finding that GE is decreased in obese subjects(Reference Horowitz, Collins and Shearman55, Reference Horowitz, Collins and Cook56) is because low-energy LF test meals were used(Reference Wright, Krinsky and Fleeman45); thus, explaining why no differences in GE rates were found between obese and lean individuals with low-energy LF test meals(Reference Horowitz, Collins and Shearman55). However, one study that has compared GE in lean and obese individuals using both HF and LF meals has found no differences between the groups for both meals(Reference French, Murray and Rumsey60).
There are gender differences in GE rates (GE half time (min); males 111·2 (se 8·6) v. females 158·2 (se 6·4))(Reference Hermansson and Sivertsson61), which have been shown in both obese and non-obese individuals(Reference Wright, Krinsky and Fleeman45). Females have a lower rate of GE than males, which is attributed to female steroid hormones and progesterone reducing the contractile responses of GI smooth muscle to hormonal and pharmacological stimulations(Reference Datz, Christian and Moore62, Reference Hutson and Wald63). However, it has been shown that GE rates for pre- and post-menopausal women are the same, suggesting that the difference is not hormone related(Reference Wright, Krinsky and Fleeman45). The question remains unresolved, as other studies have failed to detect differences between males and females(Reference Madsen64). This outcome may be a result of experimental differences, such as the use of non-digestible solids that are insufficiently sensitive to detect a potential effect of gender, or the test taking place during the follicular phase of the menstrual cycle, which is the phase least affected by female hormones. Many studies on GE and obesity have used control or lean groups that do not match the obese group in terms of gender(Reference Basilisco, Camboni and Bozzani49, Reference Glasbrenner, Pieramico and Brecht-Krauss50, Reference Horowitz, Collins and Shearman55, Reference Hutson and Wald63, Reference Christian, Datz and Moore65–Reference Wisen and Johansson67), leading to inaccuracies in the research practice that will be reflected in the results. It should be noted that in all these studies GE either did not change or was reduced when normal-weight and obese individuals were compared. Furthermore, although it is recognised that GE varies at different stages of the menstrual cycle(Reference Gill, Murphy and Hooper68), many of the studies of GE and obesity that have used female volunteers have not considered testing all female volunteers at the same stage of the menstrual cycle(Reference Zahorska-Markiewicz, Jonderko and Lelek44–Reference Tosetti, Corinaldesi and Stanghellini46, Reference Glasbrenner, Pieramico and Brecht-Krauss50, Reference Horowitz, Collins and Shearman55–Reference Maddox, Horowitz and Wishart57, Reference Sasaki, Nagulesparan and Dubois66, Reference Wisen and Johansson67, Reference Teff, Alavi and Chen69, Reference Christian, Moore and Sorenson70). It is evident that discrepancies in the literature exist especially in much of the older work; clarification of these issues is important so they can be eliminated from consideration in future work on GI transit.
Fat delays gastric emptying
Fat has been shown to delay GE compared with other macronutrients(Reference Ravdin71). Comparison of an HF soup with a high-carbohydrate soup of equal mass, volume and energy content ingested orally has shown that the HF soup slows GE (GE half time (min); high-carbohydrate soup 76·1 (se 3·9) v. HF soup 91·9 (se 4·3))(Reference Cecil, Francis and Read72). Fatty acid chain length also alters GE rate; longer-chain fatty acids slow GE to a greater extent than SCFA(Reference Hunt and Knox73).
Infusion studies have demonstrated that the ‘intestinal phase of gastric function is directed mainly toward regulation of the reservoir function of the stomach, to adapt the gastric delivery of nutrients and fluid’(Reference Miller, Malagelada and Taylor74). The intestinal control of gastric secretion and satiety was investigated using an occluding balloon to separate the jejuno-ileal segment of the gut from the proximal segment. When mixed meals of different energy contents (1255 and 2510 kJ) were administered while varying the jejunal perfusate the jejuno-ileal chyme was found to inhibit GE, with protein, carbohydrate and fat all acting as inhibitors. In a study in which the transit of lactulose solution through the small intestine was measured following the infusion of fat emulsions, a protein hydrolysate, glucose or saline (9 g NaCl/l) into the jejunum, ileum and colon, ileal infusion of the fat emulsion Intralipid or the protein hydrolysate was found to result in delays in small bowel transit compared with saline(Reference Read, McFarlane and Kinsman75). A second series of experiments has found that infusion of Intralipid in the ileum delays the transit of a solid meal through both the stomach and small intestine(Reference Welch, Saunders and Read76). When comparing ileal infusion of a lipid emulsion with that of albumin and saline it was found that ileal infusion of the lipid emulsion delays GE compared with albumin and saline (GE half time (min); lipid 203 (se 48) v. albumin and saline 68 (se 12)). Furthermore, infusion of lipid into the ileum delays GE compared with hypertonic saline, distilled water, an isotonic solution containing protein hydrolysate or glucose(Reference Welch, Sepple and Read77). It was concluded, based on the earlier findings(Reference Read, McFarlane and Kinsman75), that since protein hydrolysate can delay small intestinal transit, then GE and small intestinal transit through the ileum are mediated by different mechanisms.
It has been found that C≥12 long-chain fatty acids infused into the gut cause a similar and consistent elevation in plasma CCK(Reference McLaughlin, Grazia Luca and Jones78). This response also coincides with a reduced antral contractile amplitude that is abolished by the addition of loxiglumide (a CCK-A receptor antagonist). C⩽11 fatty acids do not induce such a change in CCK. Furthermore, GE half time is delayed more by infusion of C12 fatty acid than by infusion of C10 fatty acid (C10 53 (se 2) min v. C12 67 (se 3) min). The volume of water that can be delivered into the stomach to maximum tolerance is reduced with C12 fatty acid and this effect is abolished by dexloxiglumide. CCK release is increased to a greater extent with C12 fatty acid than with C10 fatty acid. Finally, duration of gastric relaxation is also longer after C12 fatty acid(Reference Lal, McLaughlin and Barlow79).
However, very different results are obtained with orally-consumed preloads as compared with studies in which macronutrients are infused directly into the gut. This difference in the effect of eating food and infusion of food has been shown by comparing an HF soup with an LF soup of equal mass, volume and energy content given either intragastically or ingested orally(Reference Cecil, Francis and Read72). It was found that when the soups are introduced intragastically there are no differences between the two soups for GE, ratings of hunger and fullness or food intake from a test meal given 2 h after the soup(Reference Cecil, Francis and Read72). When the soups are ingested orally the HF soup suppresses hunger, induces fullness, slows GE and tends to reduce food intake from a test meal in a more pronounced manner than the LF soup. Based on these findings, a study has been conducted on the effect of fat in breakfast on GE of lunch to simulate the role of infused fat in in vivo conditions(Reference Clegg and Shafat80). Volunteers were fed an HF pancake breakfast, an LF pancake breakfast of equal energy content to the HF breakfast or an LF pancake breakfast of equal mass to the HF breakfast in a randomised order on three separate days. At 3 h after breakfast a soup lunch was provided. The GE of the soup lunch was measured using the sodium [13C]acetate breath test. Sodium [13C]acetate was used to measure GE as acetate is hydrophilic, poorly absorbed in the stomach and rapidly metabolised after absorption. Sodium [13C]acetate GE half time has been shown to be closely correlated with radioscintigraphy for liquids (r 0·95)(Reference Braden, Adams and Duan81). At 4 h after lunch an ad libitum buffet meal was provided. The GE half time of lunch was found to be significantly affected by the composition of the breakfast meal (P=0·028), with lag phase approaching significance (P=0·054). The GE times were found to be longest at lunch time following the HF breakfast (see Table 2). Significant differences were found between the intake at the buffet between the three test days for energy consumed (P=0·018), fat consumed (g; P=0·013) and protein consumed (g; P=0·036), but no differences for carbohydrate consumed (P=0·169) and total amount (g) consumed from food and beverage (P=0·236). Food intake was found to be greatest following the HF breakfast and lowest following the LF breakfast of equal energy content(Reference Clegg and Shafat80). These findings indicate that fat delays GE to such an extent that it affects subsequent GE times, without increasing satiety.
Gastric emptying of a soup lunch following a high-fat breakfast (HF), a low-fat breakfast isoenergetic to HF (LFE) or a low-fat breakfast of equal mass to HF (LFM) in male subjects (from Clegg & Shafat(Reference Clegg and Shafat80))
(Mean values and standard deviations for nine subjects)
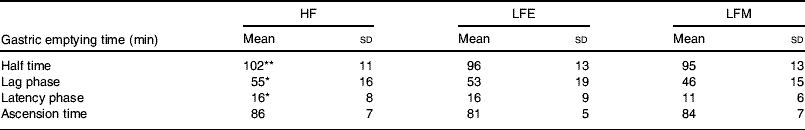
Mean values were significantly different from those for LFM:
* P<0·05, **P<0·01.
High-fat diets accelerate gastric emptying
Chronic exposure to fat has an alternative effect to acute exposure. The findings of the first study in human subjects to establish that feeding a HF diet adapts GI function to accelerate GI emptying rates in comparison with a LF diet(Reference Cunningham, Daly and Horowitz82) are shown in Fig. 2. Similar subsequent findings have shown that an HF diet for 14 d increases the GE rate of HF food (%/min; pre-diet 0·36 (se 0·05) v. post diet 0·47 (se 0·03)) but not LF food(Reference Castiglione, Read and French83) (Fig. 3). These changes may reflect the acceleration seen in GE data for obese individuals who consume an HF diet.
Differences in gastric emptying (GE) half time (P<0·05) and mouth-to-caecum transit time (P<0·05) for six male subjects following 2 weeks on a low-fat or high-fat diet. (From Cunningham et al.(Reference Cunningham, Daly and Horowitz82); reproduced with permission from British Medical Journal.)

Differences in gastric emptying half time (A), lag phase (B) and percentage emptied/min (C) for high-fat and high-carbohydrate (CHO) test meals before (pre-diet; ▪) and after (post diet; ![]() ) a high-fat diet for 2 weeks. Values are means with their standard errors represented by vertical bars for eight subjects per group. The effect of the diet was significant for percentage emptied/min for the high-fat test meal: *P<0·05. (From Castiglione et al.(Reference Castiglione, Read and French83); reproduced with permission.)
) a high-fat diet for 2 weeks. Values are means with their standard errors represented by vertical bars for eight subjects per group. The effect of the diet was significant for percentage emptied/min for the high-fat test meal: *P<0·05. (From Castiglione et al.(Reference Castiglione, Read and French83); reproduced with permission.)

A recent study has found that although 3-weeks on an HF diet increases plasma CCK, it does not affect antropyloro-duodenal motility(Reference Little, Feltrin and Horowitz84). These findings conflict with previous results that show that after 14 d on a HF diet pyloric tonic and phasic pressures are attenuated and the number of antropyloro-duodenal pressure-wave sequences are increased when compared with an LF diet, and there are no changes in CCK(Reference Boyd, O'Donovan and Doran85). Thus, accelerated GE could be causing the increased CCK response in human subjects as a result of the faster delivery of nutrients into the small intestine(Reference Little, Horowitz and Feinle-Bisset86). Until recently, the majority of studies examining the effect of HF diets on GE have used interventions of ≥2 weeks. However, it has now been shown that an HF diet for only 3 d is sufficient to shorten gastrointestinal transit(Reference Clegg, Shafat and McKenna87). MCTT decreases significantly following an HF diet when compared with a control diet (control 280 (sd 60) min, HF diet 226 (sd 84) min; P=0·025). The results for GE show significant differences between the diets in latency phase (the onset of gastric emptying; P=0·004) and time of peak percentage dose recovered (P=0·017). The GE times are all shortest following the HF diet, which suggests that recent dietary history may play an important role in GI transit. HF diets have been shown to increase the tendency to overeat high-energy foods and fat in human subjects(Reference Lissner, Levitsky and Strupp14) and in rats(Reference Gaysinskaya, Karatayev and Chang88). These studies have shown that exposure to fat results in a reduced satiating action of fat(Reference Warwick and Weingarten89).
Conclusions and future work
In the present paper the role of dietary fat in the control of GE and the development of obesity has been discussed. Gastric capacity and GE play an important role in satiety and the provision of nutrients to the body. In obese individuals GE appears to be faster than that in lean individuals and a HF intake has been implicated. Fat in a single meal delays GE and can even delay emptying of a subsequent meal. However, an HF diet accelerates GE, and this effect can occur after dietary intervention for only 3 d. This finding may imply that the repeated fasting and binging that is associated with the eating habits of obese individuals, especially those with dietary restraint, may promote the variable GE patterns observed in the literature. Further work is required in this area to follow the eating patterns and subsequent effects on GI transit and satiety in obese individuals.
Acknowledgements
Miriam Clegg was funded by an individual research grant from the Irish Research Council for Science, Engineering and Technology. There were no conflicts of interest.


