

Introduction
This article analyses the readiness of employers to employ people with disabilities (PWD), using the COM-B model as its theoretical framework (Michie et al., Reference Michie, Van Stralen and West2011). Framed in terms of the topic of this article, this model argues that employers will be more likely to employ PWD when they have the capabilities, opportunities, and motivations to do so. Following Olejniczak and colleagues’ (Olejniczak et al., Reference Olejniczak, Sliwowski and Leeuw2020) framework for policy designers, the COM-B model can help policymakers in hypothesising about obstructing problems: in this case, gaps in employers’ capabilities, opportunities, and motivations to employ PWD. Insight in these gaps can then be helpful in designing policy interventions that address them.
The labour-market participation of PWD has received considerable attention of policymakers across the world. It remains low, in absolute terms as well as relative to the labour-market participation of people without disabilities (for the EU, see Van der Zwan and De Beer, Reference Van der Zwan and De Beer2021). In line with the World Health Organization’s definition of disability (World Health Organization, 2011), which emphasises the interaction between individuals with an impairment and their environment, researchers as well as policymakers have focused attention to the demand-side of the labour market and the role of employers in obstructing and promoting the labour-market participation of PWD (Lengnick-Hall et al., Reference Lengnick-Hall, Gaunt and Kulkarni2008; Chan et al., Reference Chan, Strauser, Maher, Lee, Jones and Johnson2010; Van Berkel, Reference Van Berkel2021). This process of employer engagement (Ingold and Stuart, Reference Ingold and Stuart2015; Orton et al., Reference Orton, Green, Atfield and Barnes2018) takes different forms. A report on the labour-market integration of PWD in the EU (Eurofound, 2021) distinguished various policy measures aimed at employers that reflect the diversity of obstructing problems policymakers identify when it comes to engaging employers.
Social policy scholars have focused mainly on employers’ motivation as a core factor in their readiness to hire and employ PWD (Bredgaard and Halkjær, Reference Bredgaard and Halkjær2016; Hemphill and Kulik, Reference Hemphill and Kulik2016a; Bredgaard, Reference Bredgaard2018; Østerud and Vedeler, Reference Østerud and Vedeler2022). Well-known policy tools aimed at engaging employers, such as quota, anti-discrimination legislation, and subsidies, reflect this focus. In terms of Schneider and Ingram’s (Reference Schneider and Ingram1990) typology of policy tools, these are authority and incentive tools: they prescribe or stimulate desired behaviour. At the same time, scholars have argued that while motivation may be a necessary factor in employing PWD, it is not sufficient (Araten-Bergman, Reference Araten-Bergman2016; Bredgaard, Reference Bredgaard2018). In addition, studies have pointed at the limited effects on actual hiring behaviour of these policy tools (Ameri et al., Reference Ameri, Schur, Adya, Bentley, McKay and Kruse2018; Sargeant et al., Reference Sargeant, Radevich-Katsaroumpa and Innesti2018; Jiménez-Martin et al., Reference Jiménez Martín, Mestres and Vall Castelló2019; Derbyshire et al., Reference Derbyshire, Jeanes, Khedmati Morasae, Reh and Rogers2024). Against this background, the COM-B model provides scholars with a broader scope of factors influencing hiring and employing PWD. It also provides policymakers the opportunity to diversify the set of policy tools aimed at influencing employers’ hiring behaviour (Nagtegaal et al., Reference Nagtegaal, De Boer, Van Berkel, Derks and Tummers2023). These may include the other types of policy tools Schneider and Ingram (Reference Schneider and Ingram1990) distinguished: capacity tools that ‘provide information, training, education, and resources to enable individuals, groups, or agencies to make decisions or carry out activities’ (Schneider and Ingram, Reference Schneider and Ingram1990: 517); symbolic tools that encourage compliance by communication and persuasion; and learning tools providing room to experiment with approaches to discover ‘what works’. In this article we will argue that broadening our scope in identifying obstructing problems emphasises the relevance of policy tools beyond authority and incentive tools. Additional policy tools, we propose, should include employer-directed services supporting employers in employing PWD. While these services have a tradition in vocational rehabilitation approaches such as Individual Placement and Support (IPS) and Supported Employment (Frøland et al., Reference Frøland, Andreassen and Innvaer2019; Drake and Bond, Reference Drake and Bond2023), they are still in their infancy in mainstream public employment services (Van Berkel, Reference Van Berkel2021; Dall et al., Reference Dall, Larsen, Bo Madsen, Ingold and McGurk2023; Ingold et al., Reference Ingold, Knox, Macaulay and Senewiratne2023).
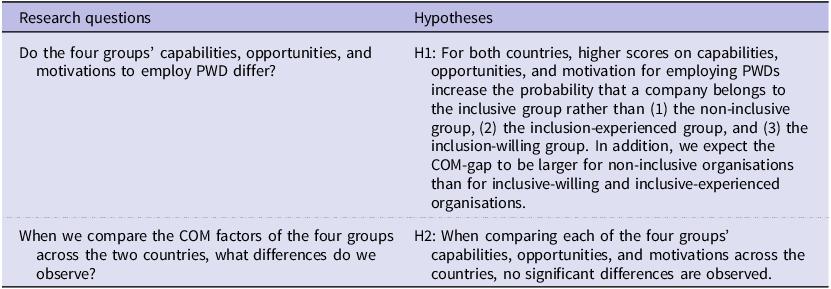
Two research questions are examined in this article. First, we compare the capabilities, opportunities, and motivations of four groups of employers, addressing the question: Do the four groups’ capabilities, opportunities, and motivations to employ PWD differ? The four groups of employers are: employers who currently are employing PWD (inclusive current), employers who have employed PWD in the past but do not so currently (inclusion-experienced), employers who have the intention to employ PWD (inclusion-willing), and employers who are not employing PWD and do not have experience with employing PWD nor the intention to do so (non-inclusive). Our study focused on small and medium-sized enterprises (SMEs), that is, private sector organisations with less than 250 employees. The second research question explored differences between two countries, the Netherlands and Norway, in more detail: when we compare the COM factors of the four groups across the two countries, what differences do we observe? For the purpose of this article, inclusion is defined as employing PWD.
The article aims to contribute to scholarly debates and policymaking in the area of employing PWD in the following ways. First, the COM-B model provides a theoretically grounded model of factors relevant to employers’ hiring behaviour. As will be elaborated below, the model captures a broad range of factors that previous studies have found as influencing such behaviour (Burke et al., Reference Burke, Bezyak, Fraser, Pete, Ditchman and Chan2013; Shaw et al., Reference Shaw, Daraz, Bezzina, Patel, Gorfine, Altman and Barnartt2014, Wu et al., Reference Wu, Iwanaga, Grenawalt, Mpofu, Chan, Lee and Tanseye2023). Secondly, as elaborated by Olejniczak and colleagues (Reference Olejniczak, Sliwowski and Leeuw2020), the model can assist policymakers in developing policy tools that address obstructing problems and stimulate the desired behaviour. In our case, it can help in identifying gaps in employers’ capabilities, opportunities, and motivations that policies could address. Thirdly, the article uses a comparative approach, examining employers in the Netherlands and Norway. Comparative studies of employers’ hiring and employing PWD are scarce (Van Berkel and Breit, Reference Van Berkel and Breit2024). Our comparative approach can identify potential policy gaps. It is not our intention to evaluate policies in the two countries: our research design is not appropriate for that. Our reasoning follows the opposite direction: identifying obstructing problems by analysing the COM factors helps us to hypothesise about policies that might address these problems.
Theoretical framework
The COM-B model
The COM-B model was originally developed by Michie et al. (Reference Michie, Johnston, Francis, Hardeman and Eccles2008). Their starting point was that public interventions that aim to change behaviour should be theoretically grounded and draw on theories of behaviour and behavioural change. The COM-B model that is grounded in the synthesis of many behaviour change theories (Michie et al., Reference Michie, Van Stralen and West2011; Olejniczak et al., Reference Olejniczak, Sliwowski and Leeuw2020) provides such a theory. The model posits that for any behaviour to occur, three key components must be present: capability, that is, the capacity to perform the behaviour; opportunity, that is, an environment that enables the behaviour; and motivation to engage in the behaviour. Behaviour results from an interaction between these three components, and changing any one of them can influence it. In other words, developing policy interventions that address actors’ capability, opportunity, or motivation to engage in the desired behaviour is expected to increase the likelihood that actors will indeed behave as desired. Michie et al. (Reference Michie, Van Stralen and West2011) developed the behaviour change wheel that links deficits in the capability, motivation, or opportunity of policy target groups with policy interventions, that is, mechanisms to address these deficits. For example, education can strengthen capabilities, coercion, or incentivisation may enhance motivation, and enablement (e.g., behavioural support) may strengthen opportunity.
Michie et al. (Reference Michie, Van Stralen and West2011) mainly focused on individual behaviour in a public health context. However, Olejniczak and colleagues (Reference Olejniczak, Sliwowski and Leeuw2020) argued that the COM-B model can also be used when focusing on collective behaviour, such as organisational behaviour. In that context, they refer to broader discussions in behavioural public policy (BPP), e.g. the work of Ewert who concluded that ‘not only the behaviour of citizens but also that of public administrators and entire organisations could be addressed by BPP’ (Ewert, Reference Ewert2020: 356). This is relevant for our study in the sense that employing PWD is not (merely) the individual decision of a hirer in an organisation, but an organisational decision. In other words, it is not the capabilities, opportunities, or motivations of an individual in an organisation that are at stake, but the capabilities, opportunities, and motivation of the organisation as a collective.
Olejniczak and colleagues’ framework for policy designers described policy problem-solving as a process of hypothesis testing. First, policymakers frame the policy issue in terms of the problem behaviours of policy addressees: in our case, not hiring of PWD by employers (and their organisations). In the next step, they hypothesise about obstructing problems: the gap in capabilities, opportunities, and motivation to engage in the desired behaviour. Once these hypothesised problems are clear, policymakers hypothesise about intervention types that may address the identified gaps. Effect evaluations of the interventions will then shed light on the adequacy of the hypotheses that were developed.
Capabilities, opportunities, and motivations as antecedents of inclusion
There are numerous studies that have examined barriers – in public policy theory: ‘behavioural gaps’ or ‘compliance barriers’ – for employers to hire and employ PWD. Many of these studies did so by comparing characteristics and practices of inclusive employers with those of non-inclusive employers. Some studies operationalised inclusion as actually hiring or employing PWD. Others used proxies of actual hiring or employing PWD, such as the intention to hire or actively recruiting PWD (Van Berkel and Breit, Reference Van Berkel and Breit2024).
The COM-B model has hardly been used as a theoretical model in these studies (Nagtegaal et al., Reference Nagtegaal, De Boer, Van Berkel, Derks and Tummers2023), although some studies were built on behavioural theories (Van Berkel and Breit, Reference Van Berkel and Breit2025) such as the Theory of Planned Behaviour (Araten-Bergman, Reference Araten-Bergman2016; McDonnall and Lund, Reference McDonnall and Lund2020) and the Integrative Model of Behavioural Prediction (Hulsegge et al., Reference Hulsegge, Otten, van de Ven, Hazelzet and Blonk2022). Nevertheless, a considerable part of the factors identified in the literature can be captured by the elements of the COM-B model. Capabilities were referred to when studies pointed at lack of knowledge as a barrier for employers. This included knowledge about PWD, their employability, and their job performance (Wiggett-Barnard and Swartz, Reference Wiggett-Barnard and Swartz2012; Henry et al., Reference Henry, Petkauskosa, Stanislawzyka and Vogt2014; Hemphill and Kulik, Reference Hemphill and Kulik2016a; McDonnall, Reference McDonnall2018; Grzeskowiak et al., Reference Grzeskowiak, Zaluska, Kwiatkowska-Ciotucha and Kozyra2021). Lack of knowledge may also relate to legislation and support schemes or services available for employers (Chan et al., Reference Chan, Strauser, Maher, Lee, Jones and Johnson2010; Chan et al., Reference Chan, Tansey, Iwanaga, Bezyak, Wehman, Phillips, Strauser and Anderson2021; Berre, Reference Berre2023). Lack of knowledge may be particularly relevant for SMEs, as many of them do not have dedicated HR staff (Ameri and Kurtzberg, Reference Ameri and Kurtzberg2023).
Opportunities are at stake when studies point to the importance of relationships and collaboration with external partners in inclusion efforts, such as public or private agencies with a role in promoting the labour-market (re-)integration of PWD in the context of rehabilitation and activation processes. These partners can provide employers with opportunities to enhance their capabilities – an example of how the COM factors are interrelated. They may also support employers in contacting PWD in recruitment, provide them with support and advice concerning accommodations and job coaching, et cetera (McDonnall, Reference McDonnall2018; Chan et al., Reference Chan, Tansey, Iwanaga, Bezyak, Wehman, Phillips, Strauser and Anderson2021). Opportunities may also be more internal, such as the availability of vacancies and job tasks that are suitable for PWD (Borghouts-van de Pas and Freese, Reference Borghouts-van de Pas and Freese2021), accessibility of buildings and workplaces (Krogh, Reference Krogh2023), or support in the organisation for hiring people with disabilities (Araten-Bergman, Reference Araten-Bergman2016; Borghouts-van de Pas and Freese, Reference Borghouts-van de Pas and Freese2021).
Motivation has been studied in various ways in studies focusing on barriers to inclusion. Hemphill and Kulik (Reference Hemphill and Kulik2016a) considered ‘openness of management to hiring PWD’ as one dimension in their employer taxonomy. Bredgaard (Reference Bredgaard2018) related attitudes of employers towards active labour-market programmes to their actual participation in these programmes. He concluded that positive attitudes do not always result in actual participation, nor do negative attitudes always result in non-participation. Focusing more on the content of employers’ motivations for participation in active labour-market policies, Bredgaard and Halkjær (Reference Bredgaard and Halkjær2016) distinguished six theory-based types of motivation. These included, for example, economic (e.g., business case), altruistic (e.g., corporate social responsibility), and institutional motivations (e.g., social legitimacy). Interestingly, studies of barriers to hiring PWD have mainly focused on economic motivations of employers. These include, for example, added value of PWD (Araten-Bergman, Reference Araten-Bergman2016; Hemphill and Kulik, Reference Hemphill and Kulik2016b), competitive advantage (Borghouts-van de Pas and Freese, Reference Borghouts-van de Pas and Freese2021), or other business case motivations such as labour-market shortages or strengthening the company’s brand (Henry et al., Reference Henry, Petkauskosa, Stanislawzyka and Vogt2014). Whereas these economic motives may act as facilitators of inclusion, costs have been identified as a barrier (Ta et al., Reference Ta, Wah and Leng2011; Houtenville and Kalargyrou, Reference Houtenville and Kalargyrou2012). Summarising, these insights lead us to expect that inclusive organisations’ capabilities, opportunities, and motivation are stronger than those of non-inclusive organisations.
Inclusion-experienced and inclusion-willing organisations
Apart from inclusive and non-inclusive organisations, our study also looked at inclusion-willing and inclusion-experienced organisations. These groups were defined as, respectively, SMEs with the intention to employ a PWD in the next year; and currently non-inclusive SMEs that employed a PWD in the two years before the study took place. Intention to employ has received attention in studies that treated intention to employ as a proxy of actually employing PWD. Psychological studies in general (Conner and Norman, Reference Conner and Norman2022) as well as studies specifically focusing on employing PWD have shown that intention (Araten-Bergman, Reference Araten-Bergman2016) or ‘positive attitudes’ (Bredgaard, Reference Bredgaard2018) do not necessarily lead to behaviour. Nevertheless, one may expect that inclusion-willing organisations are, in terms of the COM factors, closer to inclusive organisations than organisations without such intention. To our knowledge, the disability literature has not compared inclusion-willing employers with inclusive employers on the one hand, and non-inclusive employers on the other. This type of research could be interesting as it may provide insights into how policymakers and practitioners can support employers in closing the intention-behaviour gap. A similar point can be made regarding inclusion-experienced companies. This group as well might be closer to inclusive employers than non-inclusive employers. Employing PWD is likely to trigger learning processes in organisations (Gould et al., Reference Gould, Mullin, Parker Harris and Jones2022), for example, by increasing their knowledge about PWD and about what it requires to employ them, or by changing perceptions of opportunities to employ PWD. It may even enhance their motivation, although negative experiences may also lead to an opposite effect. In addition, inclusion-experienced SMEs are likely to have collaborated in some way with labour-market intermediaries, which may have had a positive impact on the COM factors as well. Summarising, we expect that capabilities, opportunities, and motivations for employing PWD of inclusion-willing and inclusion-experienced organisations are closer to those of inclusive organisations than the COM of non-inclusive organisations.
Context
In terms of contextual factors relevant to the research topic of this article, the Netherlands and Norway share several similarities. Both countries have well-developed welfare states and invested strongly in strengthening the activation function of social policies. Compared to the EU average, employment rates are high: 82 per cent in the Netherlands and 76.8 per cent in Norway in Q4 of 2024 (EU average: 70.9 per cent). In the same quarter, the unemployment rate was low: 3.6 per cent in the Netherlands and 4 per cent in Norway, compared to 5.8 per cent in the EU (European Employment Barometer). At the same time, the disability employment gap is higher in Norway than in the Netherlands. In 2024, the gap was estimated at 21 per cent in the Netherlands and 27 per cent in Norway (EU average: 24 per cent) (Eurostat, 2025).
In both countries, significant proportions of the working population work in SMEs. According to labour-market information provided by European Employment Services, this proportion is 60.1 per cent in the Netherlands and 68.4 per cent in Norway. No official data exist in both countries regarding the proportion of inclusive SMEs. A representative study of Dutch organisations (SCP, 2023) concluded that of all Dutch organisations, 18.3 per cent is employing PWD. The study also concluded that this percentage is higher in large organisations (defined as organisations with more than one hundred employees), but does not provide figures for SMEs. Thus, we can conclude that less than 18.3 per cent of Dutch SMEs is employing PWD.
Although the two countries belong to different industrial relations regimes, they share the important role of social partners in policymaking (Eurofound, 2018). Both countries also have well-developed infrastructures for policy implementation and providing services to both jobseekers (including PWD) and employers (Aksnes, Reference Aksnes2019; Van Gestel et al., Reference Van Gestel, Oomens and Buwalda2019). In Norway, the Norwegian Labour and Welfare Administration (NAV) is the core institution. In the Netherlands, the benefit agency UWV and municipal welfare agencies are the core players, including the regional Employer Services Centres that are networks of UWV and welfare agencies.
Focusing on policies aimed at promoting the labour-market participation of PWD, both countries have developed various policies aimed at employers. They introduced legislation to combat labour-market discrimination. Reflecting collaboration with social partners, they also took initiatives to engage employers in combating the low employment rate of PWD. In the Netherlands (Van Berkel, Reference Van Berkel2021), this took place in the form of a social agreement in which employers agreed to create 125,000 jobs for PWD in the 2016–2026 period. In Norway (Ulstein, Reference Ulstein2025), the Inclusion Dugnad is a motivational campaign to stimulate employers to employ PWD. Interestingly, neither country has a quota regulation for private sector organisations. Nevertheless, the Netherlands has a ‘quota threat’: a quota will be enforced when employers fail to deliver upon their commitment to create 125,000 jobs. Both countries introduced incentives for employers. These include wage subsidies, as well as subsidies for accommodations and for job coaching. Norway also has a mentor programme in which new employees receive workplace support by an experienced colleague; in the Netherlands, programmes exist where supervisors or colleagues of PWD receive training in providing support to PWD. The Dutch wage subsidy is permanent for the duration of the employment contract unless the productivity of PWD improves, which may lead to lowering or abolishing the subsidy. Norway has a temporary wage subsidy that lasts a maximum period of two years, as well as a permanent wage subsidy for people with significant employment barriers. In addition, Dutch employers are exempted from the obligation to continue paying wages during periods of sickness of PWD (the no-risk policy). This is related to the Dutch obligation for employers to pay 70 per cent of wages during sickness for two years. In Norway, this period is only sixteen days. Furthermore, professionals at NAV and the Employer Services Centres provide services to employers during the hiring, placement, and retention process. This may include information, support as well as advice. Professionals inform employers about policy tools or about PWD’s capacities, help them in finding job candidates, provide advice about work restructuring, workplace accommodations, flexible working hours, et cetera. For example, one of the tasks of the Dutch Employer Services Centres is to advise organisations on how to organise work in ways that promote inclusion of people with a labour-market distance (Ministerie van Sociale Zaken en Werkgelegenheid, 2020). All in all, the two countries have similar approaches, although the focus on voluntariness is stronger in Norway. Therefore, we do not expect major differences between the countries when comparing the COM factors of each of the four groups of organisations.
Methods
Hypotheses
Table 1 provides an overview of the research questions and corresponding hypotheses that we formulated based on the theoretical framework elaborated above.
Research questions and hypotheses

Design and sample
This study was designed as a cross-sectional survey study of SMEs with 5 to 250 employees in Norway and the Netherlands. The survey was developed as part of the ENGAGE project that aimed to develop knowledge about how SMEs can contribute successfully to the sustained workplace inclusion of PWD, and can be supported effectively in doing so.
The sample in both countries was drawn from registers of establishments. As these establishments may be single-site companies as well as establishments of larger organisations, we asked respondents in the survey whether their establishment was part of a larger organisation; and if so, whether the larger organisation employed less than 250 employees or more. In the latter case, respondents were removed from the final database. The survey was distributed to a representative sample of 16,000 SMEs in Norway and 5000 in the Netherlands. The response rate was 9 per cent in Norway and 10.5 per cent in the Netherlands. After removing establishments that were part of a larger organisation with 250 or more employees, 1192 respondents remained: 898 from Norway and 294 from the Netherlands. The response in both countries was representative in terms of the proportions of small (less than 50 employees) and medium-sized (50 to 250 employees) companies. The Dutch response was representative in terms of the distinction between services and non-services companies. The Norwegian response was representative in terms of industrial categorisation. Although precise figures cannot be presented (see above), we expect inclusive organisations to be over-represented. Since we look at the four groups of organisations separately in our analyses, this does not create any problems. In addition, we expect that in the non-inclusive group, companies with an interest in the issue of employing PWD are over-represented. This means that our study is likely to present a too optimistic picture of non-inclusive organisations, specifically concerning their motivations to employ PWD.
The invitation letter to participate in the survey was sent to organisations, not to individuals in organisations. Most surveys were filled in by a chief executive (64 per cent). Other groups of respondents include HR staff (10 per cent), middle managers (13 per cent), and ‘other respondents’ (13 per cent).
Measures
Dependent variable
For testing H1, respondents were grouped following the four groups that our study distinguished. To avoid complexity of the analysis, a small group of respondents belonging to both the inclusion-willing and the inclusion-experienced groups was removed. For testing H2, these organisations were included in both group comparisons.
Independent variables
For measuring the COM factors, five points Likert scales were used. To reflect the organisational rather than individual behaviour approach (see theoretical framework), all items were formulated in terms of ‘we’ or ‘our company’. We used an adjusted version of the items developed by Nagtegaal and colleagues (Reference Nagtegaal, De Boer, Van Berkel, Derks and Tummers2023). Examples of items are ‘We have knowledge about how people with disabilities can contribute to the organisation’ (capabilities); ‘We have suitable tasks for people with disabilities’ (opportunities); and ‘Employing people with disabilities adds value to our company’ (motivations). The operationalisation also included various attitudinal items, as the latter item example already showed. Other examples are ‘We believe that people with disabilities will perform work tasks in an adequate manner’ and ‘We are not worried about the costs of employing people with disabilities’ (both motivation items). The full list of items can be found in the supplementary material (Appendix 1). The Cronbach’s alpha of the capabilities scale (five items) was .93, of the opportunities scale (five items) .68, and of the motivation scale (six items) .78.
Data analysis
For testing H1, multinomial logistic regression was used. With multinomial regression, we can assess the likelihood of organisations – given their scores on the COM factors – of belonging to the non-inclusive, inclusion-willing, inclusion-experienced, or inclusive group. The inclusive organisations group was the reference group with which the other three groups were compared. Separate regressions were carried out for the two countries. Co-variates were company size (at establishment level) and the presence/absence of dedicated HR staff. We included the latter variable as we expected it to have an impact on the COM scores, particularly on SMEs’ capabilities. For comparing the Dutch and Norwegian SMEs (H2) we used independent samples t-tests. These tests were done both at COM factor level and at item level.
Results
Descriptives
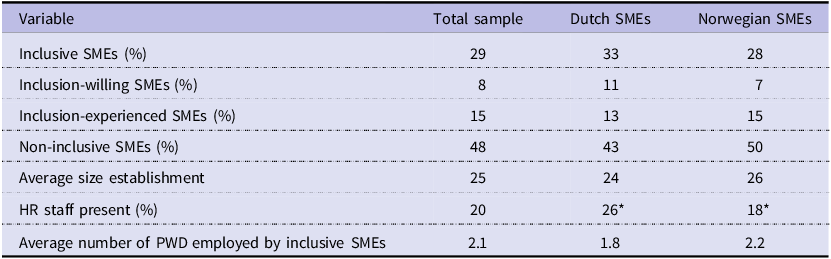
Table 2 provides an overview of descriptive statistics. Of the variables presented in the table, only the presence of HR staff differs significantly between Dutch and Norwegian SMEs.
Descriptive statistics
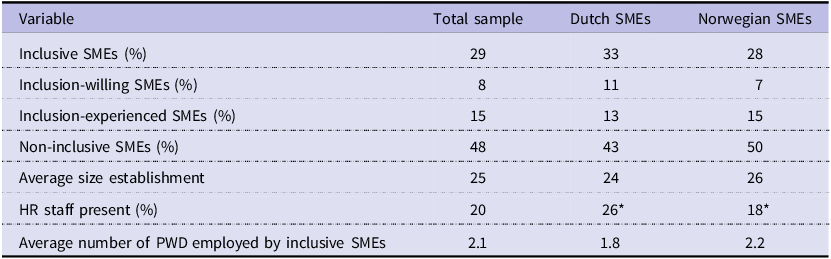
* Differences between countries are statistically significant (p < .01).
Comparing COM factors of four groups of SMEs
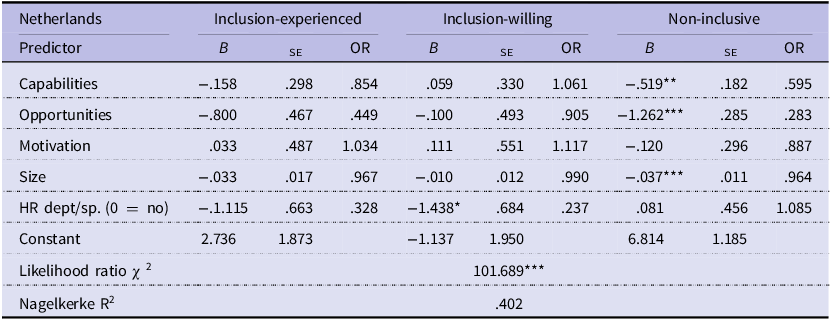
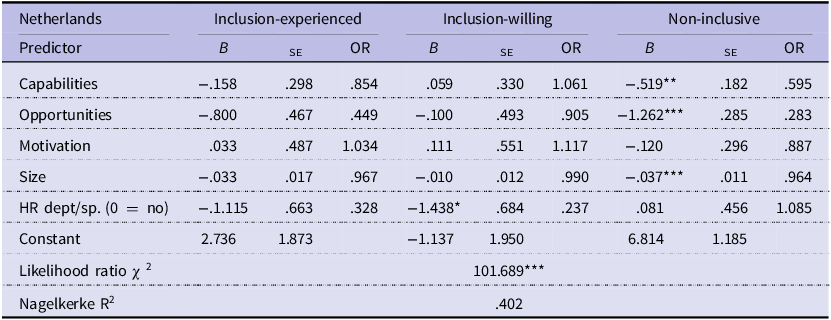
In this section we present the results of the multinomial logistic regression analyses. Table 3 summarises the results of the Dutch case.
Multinomial logistic regression predicting inclusion groups in the Netherlands
Notes: Reference category: Inclusive; ***p < .001; **p < .01; *p < .05. OR = odds ratio.
The multinomial logistic regression model for the Netherlands was statistically significant, χ 2(15) = 101.69, p < .001, indicating that the included predictors reliably distinguished between the four groups. The model explained approximately 40 per cent of the variance in group membership (Nagelkerke R² = .402), suggesting a strong model fit. For none of the COM factors significant effects were found for the inclusion-experienced and inclusion-willing groups. In other words, the COM factors of these two groups did not significantly differ from those of the inclusive organisations. Capabilities (B = −.519, p < .01, OR = .595) as well as opportunities (B = −1.262, p < .001, OR = .283) were significant predictors for the non-inclusive group. SMEs reporting higher capabilities and opportunities were less likely to be non-inclusive (compared to inclusive). Motivation, however, was not significant. Overall, the Dutch results partially support the first hypothesis. Higher levels of capabilities and opportunities are associated with a greater likelihood of belonging to the more inclusive categories. More specifically, higher scores increased the likelihood of belonging to the inclusive group only when compared to the non-inclusive group. No significant differences emerged between the inclusive group and either the inclusion-experienced or inclusion-willing groups. Motivation was not a significant factor in predicting inclusion group membership.
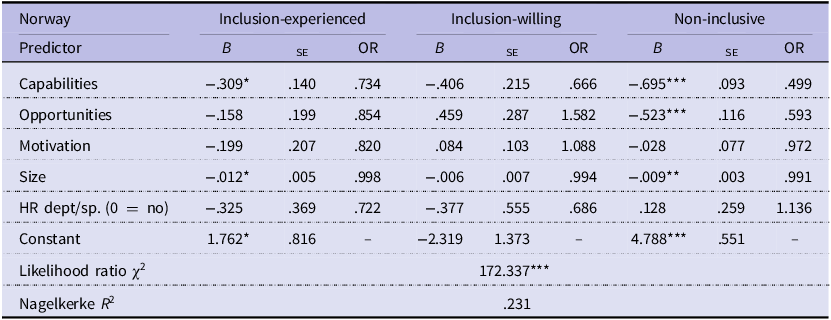
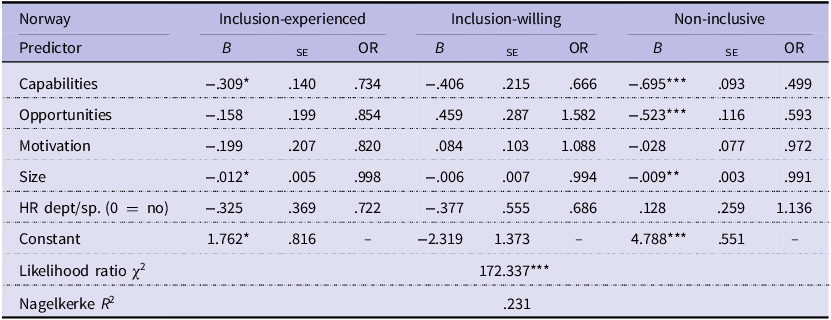
Table 4 summarises the results for the Norwegian organisations.
Multinomial logistic regression predicting inclusion groups in Norway
Notes: Reference category: Inclusive; ***p < .001; **p < .01; *p < .05. OR = odds ratio.
The multinomial logistic regression model for the Norwegian organisations was statistically significant, χ²(15) = 172.34, p < .001, indicating that the included predictors reliably distinguished between the four inclusion groups. The model explained approximately 23 per cent of the variance in group membership (Nagelkerke R² = .231), representing a moderate explanatory power. For none of the COM factors significant effects were found for the inclusion-willing group. In other words, inclusion-willing and inclusive organisations do not significantly differ on any of the COM factors. Higher scores on capabilities were significantly associated with a lower likelihood of belonging to the inclusion-experienced group (B = −.309, p < .05, OR = .734). The opportunities and motivations of this group do not differ significantly from those of the inclusive organisations. Capabilities (B = −.695, p < .001, OR = .499) as well as opportunities (B = −.523, p < .001, OR = .593) were significant predictors for the non-inclusive group. SMEs reporting higher capabilities and opportunities were less likely to be non-inclusive (compared to inclusive). Motivation, however, was not significant. Overall, the Norwegian results partly support the first hypothesis. Higher scores on capabilities and opportunities increase the probability of belonging to the more inclusive groups. More specifically, elevated capability levels increase the likelihood of belonging to the inclusive group when compared to the inclusion-experienced group. This effect is even stronger when the inclusive group is compared to the non-inclusive group. With regard to opportunities, higher scores increased the likelihood of belonging to the inclusive group only when compared to the non-inclusive group. No significant differences emerged between the inclusive group and either the inclusion-experienced or inclusion-willing groups. Motivation was not a significant factor in predicting inclusion group membership.
Comparing COM factors and items of the four groups across the two countries
In this section we compare the capabilities, opportunities, and motivations of the four groups across the two countries. We do this on factor as well as item level. The tables presenting results of the item-level comparisons can be found in the supplementary material (Appendix 2).
Table 5 presents the results of the cross-country comparison of the inclusive organisations.
Comparing COM-factors in the Netherlands and Norway: inclusive organisations

This comparison revealed no significant differences between the two countries concerning the capabilities, opportunities, and motivations of inclusive SMEs. An analysis at item-level, however, did reveal various significant differences. These especially concern the motivations of Dutch and Norwegian inclusive SMEs. Norwegian SMEs score higher on the willingness to contribute to an inclusive labour market than the Dutch. They also have more confidence that PWD will perform tasks adequately and will add value to their firms. On the other hand, Dutch SMEs score higher on perceiving the employment of PWD as a responsibility. The picture here is that Norwegian employers want to employ PWD, whereas in the Netherlands the perception that employers should employ PWD is stronger. Dutch inclusive SMEs are also less concerned about the costs of employing PWD. As far as opportunities are concerned, Norwegian SMEs are more positive about reactions towards employing PWD from colleagues and clients/customers.
Table 6 presents results of the country comparison of inclusion-experienced organisations.
Comparing COM-factors in the Netherlands and Norway: inclusion-experienced organisations

Again, no significant differences were found with respect to the COM factors. Some significant differences were found at item-level. Norwegian inclusion-experienced organisations scored higher than the Dutch when it comes to positive reactions towards employing PWD from colleagues and customers/clients. The Norwegian organisations also scored higher on some motivators: willingness to contribute to an inclusive labour market and their perception that employing PWD will give the organisation a competitive advantage.
Turning to the inclusion-willing organisations, Table 7 shows that Norwegian SMEs with the intention to employ PWD are more strongly motivated than the Dutch. With respect to capabilities and opportunities, no significant differences were found.
Comparing COM-factors in the Netherlands and Norway: inclusion-willing organisations

At item-level, it is again motivation where we find the main differences. The picture is similar as we saw above: on several motivators Norwegian SMEs scored higher than Dutch SMEs.
Finally, Table 8 looks at the non-inclusive organisations. This time, it is opportunities where we found differences: Norwegian SMEs scored higher than Dutch SMEs. No significant differences were found when we looked at capabilities and motivations.
Comparing COM-factors in the Netherlands and Norway: non-inclusive organisations

At item-level, non-inclusive organisations in Norway and the Netherlands differed more than the other groups, especially concerning opportunities and motivations. As far as opportunities are concerned, Norwegian SMEs scored higher on all items apart from one: Dutch SMEs perceived their buildings as more accessible for PWD. Concerning motivators, the picture is similar as we saw when we compared inclusive organisations. Norwegian non-inclusive SMEs are more willing to employ PWD whereas the Dutch feel a stronger responsibility towards employing PWD.
Summarising, the findings at factor-level largely confirm hypothesis 2, with some exceptions. Norwegian inclusion-willing SMEs were more strongly motivated than the Dutch. And Norwegian non-inclusive SMEs perceived more opportunities for employing PWD than the Dutch. At item-level, we found most differences when comparing motivators, followed by opportunities. In terms of capabilities, the four groups showed no differences at factor level and the least ones at item level.
Conclusion and discussion
This article used the COM-B model to explore the employment of PWD by SMEs in the Netherlands and Norway. The model not only provides a theoretical basis for analysing behaviour of employers (and their organisations). It also offers a broad perspective on factors influencing behaviour, focusing on employers’ willingness as well as on their capabilities and opportunities. In the first step of our analysis, we compared the capabilities, opportunities, and motivations of non-inclusive, inclusion-willing, and inclusion-experienced organisations with those of inclusive organisations. We found that in both countries, non-inclusive organisations scored significantly lower on capabilities and opportunities than inclusive organisations. However, they did not score lower on motivation. The latter finding was contrary to what we expected. Possibly this finding is partly due to the fact that unmotivated employers were more likely not to participate in the study. In addition, survey questions about motivation are probably more susceptible to eliciting socially desirable responses than questions about capabilities and opportunities. Nevertheless, our findings do show that employers not only need to be willing to employ PWD. They also need to be able to do so, and to know how to do it. When employers perceive a lack of opportunities to employ PWD, this may reflect a lack of motivation. But it may also reflect a lack of information and knowledge about, among others, how to adapt organisational practices, about policies and employer services that can support them in doing so, or about capacities of PWD. In short, the COM-B model helps to bridge the gap between motivation and actually employing PWD by focusing on other factors that need to be addressed.
Although we expected the COM factors of inclusion-willing and inclusion-experienced organisations to be closer to inclusive organisations than those of non-inclusive organisations, we found that they did not differ significantly at all from inclusive organisations in the Dutch case, and hardly so in the Norwegian case. This is surprising in the light of debates about the intention-behaviour gap discussed earlier. Of course, this finding may be due to methodological issues: the inclusion-willing and inclusion-experienced groups in our study were relatively small. At the same time, these findings may also tell us something about the fluidity of borders between inclusion and non-inclusion. For example, inclusion-experienced organisations may only temporarily not employ PWD because they have not yet replaced a PWD that left the organisation. And inclusion-willing organisations may be about to employ PWD. Longitudinal studies of (non-)inclusion could shed more light on the dynamic nature of inclusion processes, especially in SMEs where employing one PWD more or less can make the difference between inclusion and non-inclusion. Finally, it may be that the COM-B model (or our operationalisation of it) lacks some important factors that could provide more insight into the transition from inclusion-willing or inclusion-experienced to inclusion. After all, our multinomial logistic regression model only explained part of the variance in group membership.
In the second step we focused on comparing COM factors of the four groups across the two countries. Overall, the four groups of SMEs in the Netherlands and Norway scored quite similar on capabilities, opportunities, and motivations to employ PWD. Given the similarity in contexts in both countries, this was in line with what we expected – although more robust comparative research designs are needed to test whether these contexts actually cause these similar COM scores. However, when making the same comparison at item-level, we observed some interesting differences. These differences were clearest when we looked at SMEs’ motivations to employ PWD and, to a lesser extent, their opportunities for doing so. In general, the picture seems to be that Norwegian SMEs have a more positive attitude towards inclusion and employing PWD than the Dutch SMEs. They score higher on intrinsic motivators (e.g., employing PWD adds value to the company or gives them a competitive advantage), are more willing to contribute to an inclusive labour market, and experience or expect more positive reactions from colleagues and clients/customers. On the other hand, Dutch SMEs see employing PWD more as their social responsibility; and they are less concerned about costs related to employing PWD. It is tempting to relate these differences to differences in policies in both countries: the absence of a quota in Norway, and the ‘quota threat’ that might trigger extrinsic motivators in the Netherlands. However, the opposite might be the case as well. More positive attitudes among employers could make Norwegian policymakers more reluctant to introduce quota than Dutch policymakers. At the same time, we saw above that the employment gap of PWD is higher in Norway than in the Netherlands. In other words, Norwegian policymakers and employer engagement professionals are confronted with a considerable challenge to capitalise on employer motivations and to close the gap between these motivations and inclusion (Østerud and Vedeler, Reference Østerud and Vedeler2022). On the other hand, Dutch policymakers and professionals could focus policies and services more strongly on encouraging employers’ intrinsic motivations. In both countries, investing in employers’ capabilities and opportunities might contribute to addressing these challenges.
This brings us to the relevance of our findings for the design of policies. As mentioned before, mainstream policies focusing on promoting the labour-market participation of PWD address only part of the barriers employers perceive in employing PWD. They do not address employers’ capabilities and opportunities that, as our study showed, are considerably lower in non-inclusive organisations compared to inclusive organisations. Addressing these factors – that can, following Michie and colleagues (Reference Michie, Van Stralen and West2011), have a positive impact on motivation – requires, in terms of Schneider and Ingram’s typology of policy tools, capacity tools, symbolic tools, and learning tools. Although national policies can provide conditions (such as resources, expertise, et cetera) for these types of policy tools, professionals in intermediary agencies such as the NAV in Norway and Employer Services Centres in the Netherlands play a vital role in actually implementing them as they require direct interaction and collaboration with employers and tailor-made approaches. These professionals inform and advise employers on issues related to inclusion, and try to enter a discussion with employers about how routine organisational and human resources practices may create barriers for PWD and how these barriers could be removed (Van Gestel et al., Reference Van Gestel, Oomens and Buwalda2019; Bredgaard et al., Reference Bredgaard, Ingold, Van Berkel, Ingold and McGurk2023; Dall et al., Reference Dall, Larsen, Bo Madsen, Ingold and McGurk2023). In other words, these professionals try to connect the discourses of market and welfare (Aksnes, Reference Aksnes2019) and act as human resources consultants (Chan et al., Reference Chan, Strauser, Maher, Lee, Jones and Johnson2010).
Of course, organisations can mobilise other resources to enhance their capabilities and opportunities (Van Os, Reference Van Os2025). Larger organisations have HR staff and sometimes Diversity & Inclusion departments that can support them in collecting information and knowledge and in identifying opportunities. National, regional, and local networks of employers or social partners can play a role too, for example, through the exchange of good practices and sharing experiences. Organisations can also make use of the information and advice services of private service providers with expertise in inclusion and human resources management. However, for SMEs that often do not have dedicated HR staff, that do not have resources to hire private service providers, or do not have time to actively participate in networks (see Bacon and Hoque, Reference Bacon and Hoque2022; Guerrero et al., Reference Guerrero, Cayrat and Cossette2022), public employer services may be the only support option available. Several studies have pointed at the importance of providing disability inclusion guidance to SMEs (Molyneux, Reference Molyneux2021; ILO, 2023).
Within the group of SMEs, the inclusion-willing and inclusion-experienced seem to be especially interesting for policymakers and professionals providing employer-directed services. For as our study showed, these groups of organisations are, in COM-B terms, ‘ready’ to employ PWD. This would imply that relatively limited support and investments are needed to encourage these organisations to make the step towards inclusion.
It is not self-evident that employers are willing to accept the role of labour-market intermediaries as advisors in organisational, personnel, and HR matters (Van Gestel et al., Reference Van Gestel, Oomens and Buwalda2019). Although some studies report positive effects of public support systems (Gilbride et al., Reference Gilbride, Stensrud, Vandergoot and Golden2003; Ingold et al., Reference Ingold, Knox, Macaulay and Senewiratne2023), others noted that employers may not appreciate ‘external’ interference with internal personnel policies, may not be convinced of the expertise of public professionals, or may have doubts that these professionals take employers’ interests seriously (e.g., Gröschl, Reference Gröschl2007; Ingold, Reference Ingold2020). Currently, there is little systematic knowledge about the efforts of labour-market intermediaries and their professionals to actively engage employers in inclusion, and the factors that influence these efforts positively or negatively. We certainly hope that future research of these ‘soft’ policy tools and interventions will provide more insight into their role in making labour markets more inclusive.
Supplementary material
The supplementary material for this article can be found at https://doi.org/10.1017/S1474746426101389
Acknowledgements
The authors thank Eric Breit (BI Norwegian Business School), Magne Bråthen, Talieh Sadeghi (Oslomet University, Norway), and Rosan Haenraets (Utrecht University, Netherlands) for their contributions to developing the survey. They also thank the anonymous reviewers for their useful and insightful comments.
Funding statement
This research was supported by The Research Council of Norway, grant number 301045. .
Competing interests
The author(s) declare none.






 Open access

