

The Yup'ik people of the Yukon–Kuskokwim Delta of Southwest Alaska are undergoing a transition that affects many aspects of their traditional lifestyle, including diet, which may influence health( Reference Kuhnlein, Receveur and Soueida 1 – Reference Egeland, Johnson-Down and Cao 3 ). The traditional Yup'ik diet includes fish, marine mammals, wild birds, land mammals and wild berries. The significant marine-based component in the diet includes high levels of EPA and DHA (n-3 PUFA). These n-3 PUFA potentially have beneficial effects including reducing CVD risk by lowering circulating TAG and inflammatory cytokine levels, and by increasing HDL-cholesterol concentration( Reference Makhoul, Kristal and Gulati 4 , Reference Makhoul, Kristal and Gulati 5 ). The current Yup'ik diet consists of a mix of traditional foods and market-based foods, with approximately one-quarter of the energy intake coming from traditional foods( Reference Bersamin, Zidenberg-Cherr and Stern 6 ). The ongoing transition from cardioprotective marine-based foods to more market-based foods may increase cardiometabolic disease risk in this population. To improve the understanding of the associations between diet and obesity, diabetes, and CVD, research will require reliable methods to measure diet in Yup'ik people.
To better understand the diet of Yup'ik people, the Center for Alaska Native Health Research (CANHR) designed a semi-quantitative FFQ specifically for Yup'ik people, based on the most frequently eaten foods( Reference Ryman, Austin and Hopkins 7 ). A single FFQ captures data on the frequency of foods usually eaten over the previous 12 months, including foods consumed only seasonally. Because many traditional foods are only eaten when they are in season, seasonal consumption is needed to capture the complete diet.
There has been increasing interest in the use of FFQ data to describe dietary patterns for diet–disease association studies( Reference Newby and Tucker 8 , Reference Hu 9 ). Dietary patterns are derived from FFQ data by combining individual food items with measures that describe groupings of foods eaten by people, and thus they may better measure the overall diet of individuals because specific foods are not eaten in isolation( Reference Hu 9 ). However, dietary patterns can be population-specific( Reference Hu 9 ), such that it is important to identify dietary patterns in a specific study population of interest, such as the Yup'ik people.
We previously used exploratory factor analysis (FA) to identify three dietary patterns among a sample of 358 Yup'ik people living in the Yukon–Kuskokwim Delta( Reference Ryman, Austin and Hopkins 7 ). The dietary patterns described a subsistence diet as well as two distinct market-based dietary patterns, which we named ‘processed foods’ and ‘fruits and vegetables’( Reference Ryman, Austin and Hopkins 7 ). These dietary patterns were associated with participant characteristics and also validated objectively measured dietary biomarkers, as well as aligned with the findings from previous research( Reference Bersamin, Zidenberg-Cherr and Stern 6 , Reference Bersamin, Luick and Ruppert 10 – Reference O'Brien, Kristal and Jeannet 12 ). Exploratory FA uses the underlying structure of the observed data from a sample of study participants to determine dietary patterns, and thus they could vary in different samples of study participants. As such, to facilitate the use of FFQ in future studies, we sought to confirm the reproducibility of the identified dietary patterns using confirmatory FA, an approach that builds on the results of exploratory FA( Reference Hu 9 ). Additionally, we sought to test the reliability of the measurement of the dietary patterns over a 2- to 3-year period. Reliability over this time period should not be significantly affected by the ongoing nutritional transition since this transition involves population-level changes over multiple years( Reference Kuhnlein, Receveur and Soueida 1 , Reference Compher 13 ). Biomarkers of traditional and market-based food intakes in the Yup'ik population( Reference Nash, Bersamin and Kristal 11 ) did not change significantly over a 10-year period. Other studies have found dietary patterns to be reliable( Reference Khani, Ye and Terry 14 – Reference Hu, Rimm and Smith-Warner 17 ); however, evaluation of the reproducibility of the identified dietary patterns using confirmatory FA is less common( Reference Newby, Weismayer and Åkesson 16 , Reference Lau, Glümer and Toft 18 – Reference Togo, Osler and Sørensen 21 ). To our knowledge, neither the reproducibility nor the reliability of dietary patterns has been reported for an Alaska Native population.
The purpose of the present study was to test the reproducibility of the previously described dietary patterns in an independent sample of Yup'ik people using confirmatory FA methods, and to evaluate the reliability of the identified dietary patterns and specific foods collected with the FFQ. In addition, we sought to demonstrate the utility of the FFQ to determine the dietary patterns by assessing the associations of the identified dietary patterns with validated dietary biomarkers and study participant characteristics.
Methods
Study sample
The present study was conducted among a Yup'ik population living in Southwest Alaska, as described previously( Reference Ryman, Austin and Hopkins 7 ). All data were collected as part of the University of Alaska Fairbanks CANHR studies, and detailed study recruitment methods have been published elsewhere( Reference Boyer, Mohatt and Lardon 22 , Reference Mohatt, Plaetke and Klejka 23 ). Briefly, the CANHR conducts recurring research visits to eleven communities of the Yukon–Kuskokwim Delta. Within these communities, study participants are recruited using convenience sampling methods, in which all individuals who self-identify as Alaska Native or who are married to an Alaska Native descendent, are >14 years of age and are non-pregnant are eligible to participate.
For this analysis, we restricted our sample to individuals who participated in CANHR studies between September 2009 and May 2013 and who self-reported their ethnicity as either Yup'ik or Cup'ik. Due to the longitudinal nature of the study, participants could have completed more than one FFQ. We started with a sample of 770 individuals who completed 916 FFQ (Fig. 1). We excluded FFQ that were completed when the study participant was < 18 years of age, when the FFQ was determined and recorded by the interviewer to be of poor quality, when the FFQ was missing data for the foods analysed, and when the FFQ values were considered unrealistic by study staff. After applying these exclusion criteria, 750 FFQ from 637 participants were available for the analysis. In a previous analysis, we evaluated FFQ from 358 study participants who completed their first eligible FFQ between September 2009 and August 2011 using exploratory FA( Reference Ryman, Austin and Hopkins 7 ). The study participants who completed their first eligible FFQ between September 2011 and May 2013 comprise our ‘confirmatory FA’ subsample of participants (n 272; Fig. 1). Our ‘test–retest’ subsample of participants completed more than one eligible FFQ between September 2009 and May 2013 (n 113; Fig. 1). Finally, our ‘association study’ subsample includes all CANHR study participants (between September 2009 and May 2013) with complete data on participant characteristics, utilising the most recent FFQ for participants with >1 FFQ (n 637; Fig. 1).
Number of FFQ collected, number of participants, and date of data collection for each of the three analyses: confirmatory factor analysis (FA); test–retest; association study. * The number of FFQ is greater than the number of study participants (n) since some participants completed >1 FFQ. † Published elsewhere( Reference Ryman, Austin and Hopkins 7 ) (note that exclusion criteria differ slightly from the present analysis).

The present study was conducted according to the guidelines laid down in the Declaration of Helsinki, and all procedures involving human subjects were approved by the University of Alaska Fairbanks Institutional Review Board and the Yukon–Kuskokwim Health Corporation Human Studies Committee. Written informed consent was obtained from the participants before data collection.
Data collection
Each study participant completed an in-person interview in English or Yup'ik during which the FFQ was administered, a fasting blood sample was collected and demographic data were obtained. Erythrocytes were isolated and samples prepared to obtain δ15N and δ13C stable isotope ratios at the Alaska Stable Isotope Facility, as described previously( Reference Nash, Bersamin and Kristal 11 , Reference O'Brien, Kristal and Jeannet 12 ). Among the Yup'ik people, δReference Asghari, Rezazadeh and Hosseini-Esfahani 15 N was strongly correlated with traditional marine food intake and δ13C was strongly associated with maize-based market foods( Reference Nash, Bersamin and Kristal 11 ). The collected demographic data included location of residence (i.e. coastal or inland community), age, sex and cultural identification (i.e. self-reported adherence to ‘Kass'aq’ (white) and Yup'ik lifestyles). Cultural identification questions were not mutually exclusive; for example, a participant could report ‘a lot’ for adherence to both the Yup'ik and Kass'aq lifestyles.
Dietary data were collected using the CANHR FFQ designed specifically for the Yup'ik people, which included the 163 most commonly eaten foods based on nearly 2000 24 h food recalls from the Yup'ik people. The current version of the FFQ has been used since September 2009. Participants reported how frequently they typically consumed each food during the previous 12 months, and for traditional subsistence foods, it was further elicited whether they ate the food seasonally or year-round. Frequency of consumption was measured on two 9-point scale groupings of frequency, one for foods and another for beverages. For both scales, the least-frequent group was ‘never or less than once per month’; for foods, the greatest frequency group was ‘2+ times per d’ and for beverages, the greatest frequency group was ‘6+ times per d’. Serving size was not collected in order to minimise the burden of the study participants.
We converted frequency of consumption from the 9-point scale groups to a continuous scale of annual consumption by multiplying the reported frequency of consumption to a 365 d scale. For foods potentially eaten seasonally (i.e. seal and walrus soup, non-oily fish, wild greens, and bird soup), if the participant reported eating the food seasonally, the annual consumption was calculated as the product of the annual frequency and the proportion of the year that food was typically available (as determined by cultural experts from communities). Annual frequency for each food was then transformed to the natural log scale to improve normality. Foods eaten ‘never or less than once per month’ were changed from an annual frequency of 0·0 to 0·01 for the natural log transformation.
Statistical analyses
We used confirmatory FA to test the reproducibility of the dietary patterns (analysis A); confirmatory FA and intra-class correlation coefficients (ICC) to test the reliability of the dietary patterns (analysis B); and Pearson's correlations and linear regression to test the associations of the dietary patterns with dietary biomarkers and participant characteristics (analysis C). All analyses were conducted using SAS 9.3 (SAS Institute). Two-sided P values < 0·05 were considered statistically significant.
Reproducibility of the dietary patterns (analysis A)
FA is a data reduction method, using the correlations between observed variables (foods) to derive a smaller number of unobserved variables called factors or underlying constructs, which we will refer to as the dietary patterns. Broadly, FA can either be categorised as exploratory or confirmatory. We previously used exploratory FA, which requires no a priori hypotheses about how the foods are correlated or the number of dietary patterns. In contrast, confirmatory FA requires an a priori hypothesis and tests a hypothesised model of directional relationships between foods and dietary patterns. We used the results of exploratory FA as a basis for designing the hypothesised model to be tested using confirmatory FA. When conducting the exploratory FA, we selected twenty-two foods from the FFQ, using a two-stage process that has been described in detail elsewhere( Reference Ryman, Austin and Hopkins 7 ). A list of foods used in the exploratory FA is provided in online Supplementary Table S1.
We tested a confirmatory FA model with the same three underlying constructs as used in the exploratory FA: ‘processed foods’; ‘fruits and vegetables’; ‘subsistence foods’( Reference Ryman, Austin and Hopkins 7 ). For this analysis, we evaluated a ‘confirmatory FA’ subsample (Fig. 1). We hypothesised a model in which each dietary pattern was computed from the foods with highest exploratory FA standardised loadings for that construct. However, in our exploratory FA, seven of the twenty-two foods did not have high standardised factor loadings (>0·35) for any of the three constructs. Of these seven foods with a standardised factor loading < 0·35, four loaded most highly on the ‘fruits and vegetables’ dietary pattern, even though they were inconsistent with this dietary pattern (i.e. pudding and jello, dried salmon, wild game soup, and pancakes). As such, we a priori elected to exclude these foods from the confirmatory FA (online Supplementary Table S1). The three other foods with standardised factor loadings < 0·35 each loaded most highly on the food group most consistent with the food item (i.e. canned tuna with ‘processed foods’, market berries in akutaq (a traditional dessert typically made from a combination of berries, sugar and fat (historically seal oil and now primarily Crisco vegetable shortening; Proctor & Gamble)) with ‘fruits and vegetables’, and bird soup with ‘subsistence foods’); thus, we a priori decided to include these foods in our confirmatory FA (online Supplementary Table S1).
Thus, for the confirmatory FA, a total of eighteen food items were included in the hypothesised model. Specifically, we hypothesised that the following foods measured each of the following dietary patterns: (1) processed foods included salty snacks, sweetened cereals, pizza, sweetened drinks, hot dogs and lunch meat, fried chicken, and canned tuna; (2) fruits and vegetables included fresh citrus, potato salad, citrus juice, maize, green beans, green salad, and market berries in akutaq; (3) subsistence foods included seal or walrus soup, non-oily fish, wild greens, and bird soup. In the model specifications, the three dietary patterns were allowed to be correlated. Model fit was assessed based on goodness-of-fit criteria (relative amount of observed variance predicted), the Bentler Comparative Fit Index and the Bentler–Bonett Non-Normed Fit Index (relative improvements in the fit of the model compared with a null model corrected for the number of parameters), and the root mean square error approximation (degree of discrepancy per df)( Reference Marcoulides and Hershberger 24 ).
Reliability of the dietary patterns (analysis B)
We evaluated the reliability of the eighteen individual food items included in the confirmatory FA and of the dietary patterns using two complementary approaches: confirmatory FA( Reference Bollen 25 ) and test–retest( Reference White, Armstrong and Saracci 26 ). The confirmatory FA approach measured internal consistency from a single FFQ administered to each participant, whereas the test–retest approach measured intra-individual variability from two FFQ administered 2–3 years apart to the same participant. Both measures of reliability are reported on a scale of 0 to 1, with greater values indicating better reliability than lower values.
Using the confirmatory FA, we calculated indicator reliability for individual foods and composite reliability for the dietary patterns in the ‘confirmatory FA’ subsample of 272 participants (Fig. 1). Factor composite reliability measures the correlation between the dietary pattern and each food hypothesised to measure the dietary pattern, and it is based on the squared standardised factor loadings and sum of the error variances( Reference Hatcher 27 ). Indicator reliability describes the percentage of the variance in the food that is explained by the dietary pattern it measures, and is calculated by squaring the standardised factor loadings for each food( Reference Bollen 25 ).
We evaluated test–retest reliability among the 113 participants with >1 FFQ (i.e. ‘test–retest’ subsample; Fig. 1) using ICC( Reference White, Armstrong and Saracci 26 , Reference Shrout and Fleiss 28 ), which describes the proportion of the variance for each food between participants when compared to within a participant. As such, the higher the ICC, the less variation observed within the same participant. Using the test–retest subsample, we also measured the reliability of a participant's report of eating each of the seasonal foods year-round when compared with only in season. For this analysis, we measured reliability using the κ statistic because seasonal consumption was characterised as yes or no( Reference White, Armstrong and Saracci 26 ).
Association analyses (analysis C)
To determine whether the identified dietary patterns were associated with previously validated dietary biomarkers (i.e. stable isotope ratios) and participant demographic characteristics (e.g. age and sex) that have been reported to be associated with diet in this study population( Reference Bersamin, Zidenberg-Cherr and Stern 6 , Reference Bersamin, Luick and Ruppert 10 , Reference Nash, Bersamin and Kristal 11 ) and other Arctic indigenous study populations( Reference Kuhnlein, Receveur and Soueida 1 , Reference Kuhnlein 29 , Reference Nobmann, Ponce and Mattil 30 ), we measured the associations of the identified dietary patterns with dietary biomarkers and participant characteristics. For this analysis, we used all the 637 participants in the present study, referred to as the ‘association sample’ (Fig. 1). Estimated dietary pattern scores indicate a participant's frequency of consumption of foods included in that dietary pattern relative to other study participants. The greater the dietary pattern score, the greater the frequency of consumption of the foods used to measure that dietary pattern. Scores were calculated as the average of the natural log-transformed frequency of consumption for each food measuring the dietary pattern (formula provided in online Supplementary Table S2). Each food used to measure the dietary pattern was equally weighted( Reference Schulze, Hoffmann and Kroke 31 ). Although this method differs from that used in our previous exploratory FA (scores were weighted by the factor loading of each food), we opted to use this method because the factor scores can be applied to new study participants without the need to calculate new factor loadings( Reference DiStefano, Zhu and Mindrila 32 ). Dietary pattern scores were standardised with a mean of zero and a standard deviation of one.
We measured Pearson's correlations between each dietary pattern (based on the scores) and the dietary biomarkers δ15N and δ13C. We also tested the associations between the dietary patterns and participant characteristics (i.e. community location, age, sex and self-reported lifestyle) using simple linear regression. Age was modelled in years as a linear term, and community location and sex as binary terms. We consolidated cultural identification measures (i.e. Kass'aq (white) and Yup'ik lifestyles) into participants reporting ‘not at all’ or ‘some’ in one group and those reporting ‘a lot’ in a second group because of a small number of participants in the ‘not at all’ group. Finally, to test for independent associations, we performed the regression of the dietary pattern score against the participant characteristics (i.e. inland community, age, male sex, and ‘a lot’ for the Kass'aq and Yup'ik lifestyles) using a multi-predictor linear regression model for each dietary pattern.
Results
Sample characteristics
Participants were from six coastal and four inland communities. Overall, the three different subsamples used for this analysis were similar, with the test–retest subsample comprising slightly older participants and a greater proportion of women (Table 1).
Characteristics of Yup'ik study participants included in confirmatory factor analysis, test–retest reliability analysis, and full-cohort association analysis, by community location

* Self-reported.
Natural log transformation of food frequencies improved the normality of the distribution (Table 2). However, after transformation, not all foods were normally distributed, with 22 and 56 % of the foods with skewness and kurtosis values >1, respectively.
Untransformed and natural log-transformed annual frequency of consumption for each of the eighteen food items included in the confirmatory factor analysis (n 272) among the Yup'ik study participants (September 2009–May 2013) (Mean values, medians and 25th–75th percentiles)
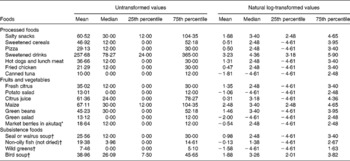
* Traditional dessert commonly made from a combination of berries, Crisco, sugar and sometimes fish.
† Seasonal food items.
Reproducibility (analysis A)
All standardised factor loadings in the confirmatory FA were >0·40, with the exception of sweetened cereals with a factor loading of 0·26 (Table 3). The dietary patterns were not necessarily mutually exclusive. We evaluated a number of model-fit criteria to assess our measurement model. The values of goodness of fit, adjusted goodness of fit, the Bentler Comparative Fit Index and the Bentler–Bonett Non-Normed Index were 0·93, 0·91, 0·92 and 0·91, respectively, all of which were above the recommended threshold of 0·90( Reference Marcoulides and Hershberger 24 , Reference Bollen 25 ). Additionally, the root mean square error approximation of 0·04 was less than the recommended threshold of ≤ 0·05( Reference Marcoulides and Hershberger 24 ). The confirmatory FA t tests for all the foods analysed were >3·29, allowing us to reject the null hypothesis of factor loadings equal to zero (P< 0·01).
Confirmatory factor analysis standardised factor loadings for foods used to estimate dietary patterns (n 272) among the Yup'ik study participants (September 2011–May 2013)
* Traditional dessert typically made from a combination of berries, sugar and fat (historically seal oil and now primarily Crisco).
† Seasonal food items.
Reliability (analysis B)
Composite reliability, a measure of internal consistency, of the dietary patterns was 0·73 for ‘processed foods’, 0·72 for ‘fruits and vegetables’, and 0·56 for ‘subsistence foods’ (Table 4). In comparison, test–retest reliability, a measure of intra-individual variability, of the dietary patterns was 0·66 for ‘processed foods’, 0·54 for ‘fruits and vegetables’, and 0·34 for ‘subsistence foods’ (Table 4). For individual foods, indicator reliability, also a measure of internal consistency, ranged from 0·07 for sweetened cereals to 0·46 for pizza, and test–retest reliability ranged from 0·11 for market berries in akutaq to 0·50 for sweetened drinks, with better reliability for market-based foods (Table 4). For seasonal foods, the reliability of reported consumption in season only, when compared with year-round, was 0·21 for seal or walrus soup, 0·19 for non-oily fish, 0·22 for wild greens, and 0·17 for bird soup.
Reliability of the dietary patterns and foods used to estimate the dietary patterns among the Yup'ik study participants

* Composite reliability of the dietary patterns (i.e. internal consistency of foods measuring the dietary pattern) and indicator reliability of the foods (i.e. the percentage of the variance in the food explained by the dietary pattern) based on the confirmatory factor analysis (September 2011–May 2013).
† Values are intra-class correlation coefficients (September 2009–May 2013).
‡ Traditional dessert typically made from a combination of berries, sugar and fat (historically seal oil and now primarily Crisco).
§ Seasonal food items.
Associations (analysis C)
Calculated dietary pattern factor scores, a relative ranking of the frequency of food consumption across the study participants, were approximately normally distributed (online Supplementary Fig. S1). The market-based factors, ‘processed foods’ and ‘fruits and vegetables’, were correlated (r 0·57, P< 0·01). The factor scores for ‘subsistence foods’ were weakly correlated with those for ‘processed foods’ (r 0·10, P= 0·01) and ‘fruits and vegetables’ (r 0·19, P< 0·01).
Among the 628 participants with biomarker data, δ15N (a biomarker of marine food intake) was significantly negatively correlated with the ‘processed foods’ (r − 0·43, P< 0·01) and ‘fruits and vegetables’ (r − 0·18, P< 0·01) dietary patterns, and positively correlated with the ‘subsistence foods’ dietary pattern (r 0·29, P< 0·01). Conversely, δ13C (a biomarker of maize-based foods) was positively correlated with the ‘processed foods’ (r 0·29, P< 0·01) and ‘fruits and vegetables’ (r 0·13, P< 0·01) dietary patterns, but was not correlated with the ‘subsistence foods’ dietary pattern.
In single-predictor linear regression analyses, a greater relative frequency of processed foods was significantly associated with living in an inland community, being of younger age, male sex, reporting ‘a lot’ for the Kass'aq (white) lifestyle and ‘not at all’/‘some’ for the Yup'ik lifestyle (Table 5). All the associations remained independently significant in the multi-predictor linear regression analysis, except male sex and ‘not at all’/‘some’ for the Yup'ik lifestyle. Similar associations were observed for the other market-based dietary pattern: greater relative frequency of fruit and vegetable consumption was significantly associated with living in an inland community and being of younger age (Table 5). In the multi-predictor linear regression analysis, community location and age remained independently associated with ‘fruits and vegetables’ and sex became significantly associated (significance was borderline based on the single-predictor model). In contrast, greater relative frequency of consumption for the ‘subsistence foods’ dietary pattern was associated with living in a coastal community, being of older age, reporting ‘not at all’/‘some’ for the Kass'aq lifestyle, and ‘a lot’ for the Yup'ik lifestyle (Table 5). In the multi-predictor analysis, community location and lifestyle characteristics remained independently associated.
Single- and multi-predictor models* for the associations between natural log-transformed dietary pattern scores and Yup'ik study participant characteristics (n 637) (September 2009–May 2013) (β-Coefficients and P values)

* Single-predictor models included only the participant characteristic and multi-predictor models were adjusted for the other study participant characteristics.
† n 635 due to missing data.
‡ n 633 due to missing data.
Discussion
We confirmed both the reproducibility and reliability of ‘processed foods’, ‘fruits and vegetables’, and ‘subsistence foods’ dietary patterns identified from a FFQ in the Yup'ik study population. Moreover, the observed associations between dietary patterns and participant characteristics and dietary biomarkers align with the findings from our previous exploratory FA( Reference Ryman, Austin and Hopkins 7 ) and other studies in Arctic indigenous populations using other measures of diet( Reference Kuhnlein, Receveur and Soueida 1 , Reference Bersamin, Zidenberg-Cherr and Stern 6 , Reference Bersamin, Luick and Ruppert 10 , Reference Nash, Bersamin and Kristal 11 , Reference Kuhnlein 29 , Reference Nobmann, Ponce and Mattil 30 ). Taken together, these results demonstrate the utility of the FFQ to measure these dietary patterns in Yup'ik people in future research.
Measures of the model fit for the confirmatory FA were acceptable and the hypothesised relationships based on the exploratory FA were significant, suggesting that our model of the three dietary patterns identified from our previous exploratory FA is consistent with the data in the new sample.
The foods measuring the market-based dietary patterns had higher factor loadings than those measuring the ‘subsistence foods’ dietary pattern, an indication that we are better able to measure the market-based dietary patterns. However, only one of the eighteen foods (sweetened cereals) did not appear to be a good measure of the dietary pattern it was hypothesised to measure based on the exploratory factor analysis. Finally, the dietary patterns that we identified align well with other studies of dietary patterns in Alaska Native people and relatively well with those in an American Indian population and other global populations. The following four dietary patterns were identified among Inupiat Eskimos: the ‘traditional’ dietary pattern, which was similar to our ‘subsistence foods’ pattern; a ‘purchased healthy’ dietary pattern, which was similar to our ‘fruits and vegetables’ dietary pattern; the ‘Western’ and ‘beverages and sweets’ dietary patterns, which together were similar to our ‘processed foods’ dietary pattern( Reference Eilat-Adar, Mete and Nobmann 33 ). Similarly, a study of American Indians identified four dietary patterns: ‘Western’; ‘traditional’; ‘healthy’; ‘unhealthy’( Reference Eilat-Adar, Mete and Fretts 34 ). The ‘Western’ and ‘unhealthy’ dietary patterns had foods similar to those included in our ‘processed foods’ dietary pattern; the ‘healthy’ pattern included foods similar to those in our ‘fruits and vegetables’ dietary pattern but also had fish that was included in our ‘subsistence foods’ dietary pattern; and, finally, the ‘traditional’ dietary pattern, which included dry beans, Mexican foods, stews, etc., probably captured similar lifestyle aspects to those in our ‘subsistence foods’ dietary pattern but did not include any overlap in foods( Reference Eilat-Adar, Mete and Fretts 34 ). More broadly, the ‘prudent’ and ‘Western’ diets have been commonly reported in the literature( Reference Mente, de Koning and Shannon 35 ); of these, our ‘fruits and vegetables’ dietary pattern somewhat aligns with the ‘prudent’ diet and our ‘processed food’ dietary pattern with the ‘Western’ diet. The INTERHEART study of acute myocardial infarction conducted in fifty-two countries has similarly found a dietary pattern comparable to the ‘prudent’ and ‘Western’ dietary patterns, but also identified a distinct ‘oriental’ dietary pattern( Reference Iqbal, Anand and Ounpuu 36 ). In the present Yup'ik study population, the ‘processed foods’ and ‘fruits and vegetables’ dietary patterns are consistent with those found in other populations; however, the ‘subsistence foods’ dietary pattern is more unique to Alaska Native people.
The overall composite and test–retest reliability of the identified dietary patterns from this FFQ was sufficient to be useful for future research in this population. The 2- to 3-year test–retest reliability evaluated in the present study, particularly for the market-based dietary patterns (0·66 for ‘processed foods’ and 0·54 for ‘fruits and vegetables’), was not dissimilar from the reliability range of 0·63–0·73 reported in the studies of 1-year reliability( Reference Khani, Ye and Terry 14 , Reference Hu, Rimm and Smith-Warner 17 ). In the present study, composite reliability was more similar across the three dietary patterns and higher than the test–retest reliability, while test–retest reliability varied across the three dietary patterns. Test–retest reliability was greatest for ‘processed foods’, followed by ‘fruits and vegetables’, and finally ‘subsistence foods’. There are a number of possible reasons for this discrepancy. By evaluating test–retest reliability using FFQ administered 2 to 3 years apart, we measured the reliability of dietary pattern analysis over the longer term; however, in such analysis, it is difficult to differentiate measurement error from true changes in diet. For example, the availability of fruits and vegetables in the market might be a result of seasonality and the difficulty in stocking perishable foods, while subsistence food availability can depend on environmental factors such as fish runs, migration patterns, ice pack, weather and regulatory restrictions( Reference Kuhnlein and Receveur 37 ). In contrast, the availability of processed foods such as snacks and cereals is likely to be more consistent throughout the year. It is also possible that the lower test–retest reliability for the subsistence foods could be a result of greater error in the measurement of seasonally consumed foods. That is, when the participants reported the intake of subsistence foods, they were asked whether the food was eaten year-round or only in season, a distinction that may have been too coarse or too confusing to the participants to capture the intake accurately. For example, a participant might preserve food to be eaten year-round, but the food did not last the full year. The challenge of measuring whether foods were eaten year-round or only in season was further highlighted by the weak test–retest reliability for the seasonal consumption question (ranging from 0·17 to 0·22).
Indicator reliability for foods was similar, irrespective of the dietary pattern that the food measured. This is an indication that the strength of the various foods measuring each of the dietary patterns was similar, and thus that the foods measuring a particular dietary pattern were not substantially better at measuring that dietary pattern. In contrast, test–retest reliability was generally better for foods measuring the market-based dietary patterns, particularly ‘processed foods’, when compared with those foods measuring the ‘subsistence foods’ dietary pattern. Reasons for the lower test–retest reliability, particularly for subsistence foods, are probably similar to those influencing the dietary patterns as described above.
We observed a correlation between usual diet over the previous 12 months based on dietary patterns and diet over the previous 2 to 3 months, as measured by stable isotope biomarkers. The N isotope ratio (δ15N), a validated biomarker of traditional marine food intake( Reference Nash, Bersamin and Kristal 11 , Reference O'Brien, Kristal and Jeannet 12 ), was correlated with the ‘subsistence foods’ dietary pattern, but the correlation was weaker than expected based on previous studies( Reference Nash, Bersamin and Kristal 11 ). This is likely because widely consumed traditional marine foods, such as salmon, have a large effect on δ15N, but are not included in the ‘subsistence foods’ dietary pattern. Salmon was not included in our ‘subsistence foods’ dietary pattern because it did not load highly when we conducted the two-stage exploratory FA( Reference Ryman, Austin and Hopkins 7 ). This is likely because salmon is so frequently eaten by the entire population that it does not differentiate individual dietary consumption. The weaker correlation between the ‘subsistence foods’ dietary pattern and δ15N could also be the result of the error in the measurement of subsistence foods with the FFQ as described above. The C isotope ratio (δ13C) was correlated with the ‘processed foods’ dietary pattern and was elevated in many of the same foods (market meats, sweetened beverages and maize-based cereals).
The use of objective biomarkers and dietary patterns together could be valuable because dietary patterns can capture a more complete picture of the diet, whereas biomarkers are more objective. Moreover, FFQ and stable isotope biomarkers measure diet over different time periods and are subject to different types of measurement error (e.g. recall bias v. laboratory error). The observed correlations between the validated stable isotope biomarkers and our dietary patterns provided us further confidence in the dietary patterns. However, in the present study population, no comparable biomarker of fruit and vegetable intake is available, so the ‘fruits and vegetables’ dietary pattern is currently our best measure of this component of the diet. This highlights one of the advantages of the FFQ; that is, it measures a variety of foods for which biomarkers are not currently available. Depending on the research question of interest, it would be possible in this study population to reduce participant burden by either using a FFQ targeted specifically to fruit and vegetable intake or a FFQ collecting only the eighteen food items used to measure the dietary patterns. However, such an approach would not allow for the measurement of the diversity of the Yup'ik diet. If such a change were made to study protocols, additional studies should be conducted to ensure that the modified FFQ captured the same data as the full FFQ; for example, to capture the accurate intake of market berries in akutaq, determine if it is necessary to also ask about wild berries in akutaq.
The associations that we observed between dietary patterns and demographic characteristics align well with other studies among Arctic indigenous populations, including Yup'ik people. For example, a number of other studies have reported an association between older age and greater consumption of traditional or subsistence foods( Reference Kuhnlein, Receveur and Soueida 1 , Reference Bersamin, Zidenberg-Cherr and Stern 6 , Reference Bersamin, Luick and Ruppert 10 , Reference Nash, Bersamin and Kristal 11 , Reference Kuhnlein 29 , Reference Nobmann, Ponce and Mattil 30 ). We further observed an association between greater frequency of consumption of subsistence foods and living in a coastal community, an association observed in a Yup'ik population using both 24 h food recalls and isotopic biomarkers( Reference Bersamin, Zidenberg-Cherr and Stern 6 , Reference Nash, Bersamin and Kristal 11 ). The association between sex and subsistence food intake is inconsistent across studies in Arctic indigenous populations( Reference Kuhnlein, Receveur and Soueida 1 , Reference Nash, Bersamin and Kristal 11 , Reference Kuhnlein 29 ); however, our finding of no association between sex and frequency of consumption of subsistence foods aligns with another study of Yup'ik people( Reference Bersamin, Zidenberg-Cherr and Stern 6 ). The observed associations between dietary patterns and participant characteristics using the full cohort were similar to those based on our previous exploratory FA study sample( Reference Ryman, Austin and Hopkins 7 ). The majority of differences that we observed were significant associations that were not significant in our smaller exploratory FA study sample, specifically the associations of ‘processed foods’ with community location and sex; ‘fruits and vegetables’ with age and sex; and ‘subsistence foods’ with the Kass'aq lifestyle. The consistency of the associations between diet and demographic characteristics from the present study and other studies in Arctic indigenous populations as well as our previous exploratory FA( Reference Ryman, Austin and Hopkins 7 ) further strengthens our confidence that we are capturing actual dietary patterns among Yup'ik people with this FFQ.
The strengths of the present study include the use of FFQ data that have been consistently collected since 2009 in a longitudinal cohort of Yup'ik study participants from inland and coastal communities. As such, we were able to rigorously test the dietary patterns that we have previously identified with exploratory FA in a new, but similar, study sample using the confirmatory FA. Furthermore, we were able to compare the dietary patterns with validated objectively measured biomarkers of diet. The present study was also subject to limitations. Data collection involved convenience sampling, potentially limiting generalisability. Participants living in the same households were not excluded, and diet may be correlated among these individuals, potentially influencing factor loadings. Although the sample size of the present study was limited, the confirmatory FA included more than five participants for each parameter being estimated as recommended( Reference Hatcher 27 ). Furthermore, the test–retest analysis had an adequate sample to measure the ICC with a two-sided α of 0·05 and a power of 0·80, assuming an ICC of 0·60 and a minimally acceptable ICC of 0·40( Reference White, Armstrong and Saracci 26 ). The FFQ used in the analysis was not validated due to the challenge of obtaining a ‘gold standard’ to compare against. The 24 h food recall, frequently used in validation studies, is expensive and logistically challenging to obtain in this population during all seasons because of the inaccessibility and remoteness of these communities. In addition, the FFQ that we used did not capture serving size, so it is not possible to determine the percentage of energy from food groups or specific nutrients. In our association analysis, we compared thirty associations – these should be cautiously interpreted due to the potential for inflated type 1 errors. Finally, all food frequency data were collected using the same FFQ, and thus there is potential for systematic error violating the confirmatory FA assumption of no correlated errors between foods.
In conclusion, we confirmed the reproducibility and reliability of the three dietary patterns in this Yup'ik study population using FFQ data. Measures of model fit were acceptable and structural relationships were significant, suggesting that our hypothesised confirmatory FA model of dietary patterns fit this new sample of Yup'ik people. Reliability, both composite and test–retest, was acceptable, an indication that the dietary patterns were stable over a multi-year period. Therefore, these dietary patterns will be useful for current pharmacogenetic and cardiometabolic research as well as for future research and development of dietary interventions in this underserved population.
Supplementary material
To view supplementary material for this article, please visit http://dx.doi.org/10.1017/S0007114514003596
Acknowledgements
The authors gratefully acknowledge the CANHR team, including Eliza Orr and Jynene Black, as well as Tim Howe and Matthew Wooller at the Alaska Stable Isotope Facility for assistance with the stable isotope analyses. The authors thank Barbara Kavanaugh and Nick Au for their comments that improved the manuscript. The authors also thank the community field research assistants who helped with the development of the FFQ, study recruitment and data collection. Finally, the CANHR team express their sincere appreciation to all of the study participants and their communities for welcoming and teaching them so much about the Yup'ik way of life. Quyana!
This publication was made possible by the National Center for Advancing Translational Sciences, National Institutes of Health, through grant TL1 TR000422. The content is solely the responsibility of the authors and does not necessarily represent the official views of the NIH. The present study was further supported by U01GM092676 (principal investigator: K. T. and Wylie Burke), R01DK074842, P20RR016430 and P30GM103325 (principal investigator: B. B. B.).
The authors' contributions are as follows: T. K. R., B. B. B., S. H., D. O'. B., K. T. and M. A. A. designed the research; B. B. B., S. H. and D. O'. B. conducted the research; T. K. R., J. P. and M. A. A. analysed the data; T. K. R. and M. A. A. wrote the paper; T. K. R. had primary responsibility for the final content. All authors read and approved the final manuscript.
There are no conflicts of interest to report.


