

In industrialised countries there is strong evidence of a positive association between diet quality and socio-economic status as measured by conventional indices such as occupation, education or income level( Reference Darmon and Drewnowski 1 – Reference Malon, Deschamps and Salanave 3 ). In the 1980s and 1990s, the US authorities recognised that a subset of citizens had difficulties obtaining adequate access to food and specific quantitative indicators were developed to monitor food insecurity (FI) at the household and individual levels( Reference Radimer and Radimer 4 ). According to the definition of the 1989 Life Sciences Research Office expert panel, FI ‘exists whenever the availability of nutritionally adequate and safe foods or the ability to acquire acceptable food in socially acceptable ways is limited or uncertain’( Reference Anderson 5 ). Food security implies that all people, at all times, have access to enough food for an active, healthy life ‘without resorting, e.g. to emergency food supplies, scavenging, stealing and other coping strategies’( Reference Anderson 5 , Reference Hamelin, Beaudry and Habicht 6 ). In 1996, a broad consensus was reached on a closed definition at the World Food Summit: ‘Food security exists when all people, at all times, have physical and economic access to sufficient, safe and nutritious food to meet their dietary needs and food preferences for an active and healthy life’( 7 ). FI appears to be a managed process, resulting first in compromises on food quality and then on food quantity( Reference Hamelin, Beaudry and Habicht 6 , Reference Radimer, Olson and Greene 8 ). Hunger, described as an ‘uneasy or painful sensation caused by a lack of food, is a potential, although not necessary, consequence of food insecurity’( Reference Anderson 5 ).
Data from developed nations show that low income is clearly one of the most important determinants of FI( Reference Rose 9 – Reference Ramsey, Giskes and Turrell 12 ), although many food-insecure households are not in poverty( Reference Rose 9 ). Other demographic and socio-economic factors are associated with an increased risk of FI: single-parent families, the presence of young children and housing conditions (e.g. non-home ownership)( Reference Rose 9 , Reference Foley, Ward and Carter 10 , Reference Martin-Fernandez, Grillo and Parizot 13 – Reference Kirkpatrick and Tarasuk 15 ). FI is a potential risk factor for suboptimal health and health behaviours among both children and adults( Reference Alaimo, Olson and Frongillo 16 – Reference Stuff, Casey and Szeto 19 ), including chronic diseases such as metabolic syndrome, hypertension and diabetes( Reference Gucciardi, Vogt and DeMelo 20 – Reference Seligman, Laraia and Kushel 22 ), low energy intake( Reference Tarasuk and Beaton 23 – Reference Cristofar and Basiotis 25 ) poor dietary intake( Reference Rose 9 , Reference Mello, Gans and Risica 11 , Reference Kendall, Olson and Frongillo 26 , Reference Kirkpatrick and Tarasuk 27 ) and poor nutritional status (assessed by serum biomarkers)( Reference Bhattacharya, Currie and Haider 28 – Reference Eicher-Miller, Mason and Weaver 30 ).
In the USA and Canada in particular, the prevalence of FI is now regularly assessed through national surveys on diet and health based on a questionnaire that subjectively evaluates the individual’s perception regarding the food situation of his or her household( Reference Radimer and Radimer 4 , Reference Kirkpatrick and Tarasuk 31 , Reference Coleman-Jensen, Nord and Andrews 32 ). In European countries, only a few studies have assessed the prevalence of FI( Reference Sarlio-Lahteenkorva and Lahelma 33 , Reference Tingay, Tan and Tan 34 ). In France, available data are limited to specific regions( Reference Martin-Fernandez, Grillo and Parizot 13 ) or high-risk groups such as very-low-income and homeless people( Reference Castetbon, Mejean and Deschamps 35 ). In 2006–2007, indicators referring to household FI were introduced for the first time in the latest French cross-sectional nationally representative dietary survey (Étude Individuelle et Nationale des Consommations Alimentaires, INCA2, 2006–07)( Reference Dubuisson, Lioret and Touvier 36 , Reference Lioret, Dubuisson and Dufour 37 ). The present study aimed to (i) assess the prevalence of household FI in the French adult population and (ii) characterise individuals experiencing FI with regard to their socio-economic characteristics, living conditions, health behaviours, food consumption, diet quality and cost. For this purpose, these individuals were compared with the rest of the population and the latter was divided into four categories according to income level.
Materials and methods
Study design and sample
The French INCA2 survey methodology has been described elsewhere( Reference Dubuisson, Lioret and Touvier 36 , Reference Lioret, Dubuisson and Dufour 37 ). In brief, this survey was carried out between December 2005 and May 2007 by ANSES (French Agency for Food, Environmental and Occupational Health Safety; formerly the French Food Safety Agency, AFSSA) to assess dietary intake and associated behaviours in a nationally representative sample of French people. Two independent random samples of children aged between 3 and 17 years (n 1455) and adults aged between 18 and 79 years (n 2624) were obtained using a multistage cluster sampling technique previously described( Reference Dufour, Lafay and Volatier 38 ). Only data from the adult sample were used in the present study; the participation rate (ratio of the number of individuals ultimately included in the study to the number of households whose composition was known) was 63 %( 39 ).
The survey included two home visits by trained investigators. Dietary intake was assessed using a 7 d food record. Socio-economic, demographic and behavioural variables were collected at the individual level using a self-administered questionnaire and an interview. During the first visit, the investigator spent 45–60 min explaining the survey and food record. After 7d, the investigator returned to review both documents (e.g. to check for often forgotten foods such as bread or water in the food record and whether there were any questions missed in the self-administered questionnaire). The investigator then conducted an interview regarding socio-economic status and lifestyle.
The INCA2 survey was approved by the French National Commission for Computed Data and Individual Freedom (Commission Nationale de l’Informatique et des Libertés, CNIL).
Food insecurity
The INCA2 survey included the US Department of Agriculture’s Food Sufficiency Indicator using a four-part response( Reference Radimer and Radimer 4 ). The question on food insufficiency, defined as an ‘inadequate amount of food intake due to a lack of money or resources’( Reference Briefel and Woteki 40 ), was used in previous American surveys( Reference Rose and Oliveira 24 , Reference Knol, Haughton and Fitzhugh 41 , Reference Townsend, Peerson and Love 42 ). It has been shown to be a valuable proxy of food insecurity( Reference Radimer and Radimer 4 ). Respondents were asked which of the following statements best described the food currently consumed in their household: (i) ‘Enough of the kinds of food we want to eat’; (ii) ‘Enough, but not always the kinds of food we want to eat’; (iii) ‘Sometimes not enough to eat’; or (iv) ‘Often not enough to eat’. Respondents who reported one of the three latter responses were asked additional questions about the reasons for their response (e.g. on a diet to lose weight, or lack of time, not enough money, lack of self-cooking facilities)( Reference Alaimo, Briefel and Frongillo 43 ). Individuals having reported getting enough but not always the kinds of food they want to eat, or sometimes or often not getting enough to eat because of lack of money were classified as living in a household experiencing FI for financial reasons (hereafter FI). The remaining individuals were considered as living in households experiencing food security (FS) and were divided into four categories according to quartile of the household income per consumption unit (see below): FS1 (FS individuals in the lowest quartile of income per consumption unit) to FS4 (FS individuals in the highest quartile).
Demographic and socio-economic variables
The following variables were available for each participant: gender, age and household type, the latter being defined according to both the marital status and the number of children (single without child, single with at least one child, other). The socio-occupational status of the head of the household was divided into ‘high’, ‘intermediate’ and ‘low’. ‘High’ was assigned to executive, top-management and professional classes; ‘intermediate’ to middle professions (office employees, technicians and similar); and ‘low’ to manual workers and unemployed people. A fourth class, labelled as ‘economically inactive’, included retired people, students and housewives/house husbands who had identified themselves as the head of the household( Reference Dubuisson, Lioret and Touvier 36 ). The level of education of the head of the household was divided into ‘high’, ‘intermediate’ and ‘low’. ‘High’ was assigned to university education, ‘intermediate’ to high school and ‘low’ to mid-secondary or below( Reference Lioret, Touvier and Lafay 44 ). Income per consumption unit was calculated as self-reported household total net income divided by the number of consumption units in the household. The number of consumption units was calculated using the modified equivalent scale (1·0 consumption unit for the householder, 0·5 for other household members aged 14 or over, and 0·3 for each child aged less than 14 years old) of the Organisation for Economic Co-operation and Development( 45 ). Finally, the individual perceived financial difficulties of the household (living comfortably, getting by, finding it difficult, impossible without debt) were assessed( Reference Kendrick, King and Albertella 46 ) based on whether at least one of the household members sometimes had to forego health care for financial reasons (yes, no).
Living conditions
Living conditions were assessed using data on housing and other material conditions: housing tenure (owner, home ownership, tenant, other), having a garden (yes, no) and car ownership (yes, no). A variable indicating self-cooking facilities was defined according to the presence of a refrigerator, a freezer, an oven or a microwave in the house. Individuals with fewer than three of these four electrical devices were categorised as having low self-cooking facilities.
Health behaviours
In the self-administered questionnaire, the respondents reported their usual snack eating frequency. ‘Snacks’ were defined as eating episodes in addition to breakfast and main meals (i.e. lunch and dinner). Those answering ‘two or three times a day’ or ‘four times a day’ were combined into one group termed ‘eat at least two times a day between meals’. During the interview, participants reported the time spent watching television during the past week for days of work and days off separately. Then, the mean time spent watching television during the past week in min/d weighted by the number of days of work and days off was calculated. The current smoking status (occasional or daily smoker, non-smoker) was also assessed using the self-administered questionnaire.
Food consumption, diet quality and diet cost
In the 7 d open-ended food record, participants reported each food or drink consumed for each type of eating occasion, i.e. meals and snacks. One line of the record corresponded to one item consumed (food or drink). Participants estimated portion sizes either using the SU.VI.MAX (SUpplémentation en VItamines et en Minéraux AntioXydants) validated photographic booklet( Reference Hercberg, Deheeger and Preziosi 47 ) or by expressing portion sizes by weight or household measures (spoon). Average daily nutritional intakes were evaluated using the French food composition databases from 2006( 48 ).
Diet quality was assessed using three indicators: the mean adequacy ratio (MAR), the mean excess ratio (MER) and the dietary energy density (ED)( Reference Vieux, Soler and Touazi 49 ). The MAR was used as an indicator of good nutritional quality and was calculated for the diet of each individual as the mean percentage of the daily recommended intakes for twenty key nutrients (protein, fibre, retinol equivalents, thiamin, riboflavin, niacin, vitamin B6, folate, vitamin B12, ascorbic acid, vitamin E, vitamin D, Ca, K, Fe, Mg, Zn, Cu, iodine and Se); each percentage was truncated at 100 so that a high intake of one nutrient could not compensate for the low intake of another( Reference Vieux, Soler and Touazi 49 ). The MER was used as an indicator of poor nutritional quality and was calculated for each diet as the mean percentage excess relative to the maximum recommended values for three nutrients (SFA, Na and free sugars); 100 was subtracted from each percentage except for percentages <100, which were set to 0 so that a low intake of one of these nutrients could not compensate for the high intake of another( Reference Vieux, Soler and Touazi 49 ). Dietary ED (in kcal/100 g diet) is inversely related to overall nutritional quality( Reference Ledikwe, Blanck and Khan 50 , Reference Schroder, Vila and Marrugat 51 ) and was calculated by dividing energy intake by diet weight. Only items typically consumed as foods, including soups, were included in the calculation of ED, whereas foods typically consumed as beverages such as milk, juices and other drinks were excluded( Reference Vieux, Soler and Touazi 49 ).
Finally, dietary costs (€/d) were estimated using mean food prices obtained from the 2006 Kantar Worldpanel purchase database, which gives the annual expenditure and the quantity purchased for each food item available on the market in a representative sample of more than 15 000 French households in 2006( 52 ). The mean prices were estimated by dividing the annual expenditures by the quantities purchased. Daily diet cost was then calculated for each individual by multiplying the quantity of each food consumed by its mean price.
Statistical analysis
INCA2 survey data were weighted for unequal sampling probabilities and for differential non-responses by region, agglomeration size, age, sex, occupation of the household head, size of the household and season. Among the 2624 adult participants, 20·4 % did not report their household income (missing data); these individuals were less likely to have a ‘low’ socio-occupational status and were more likely to live comfortably and be the home owner (results not shown). To estimate their income, these individuals with missing information were matched to individuals with complete income data according to their sociodemographic characteristics (age, sex, socio-occupational status, level of education, marital status) and level of living variables (home owner or not, home equipment) using the Kohonen algorithm( Reference Cottrell and Letrémy 53 ).
First, the prevalence of FI in the whole adult sample and the demographic, socio-economic characteristics and health behaviours were described for each of the five categories of individuals (FI, FS1 to FS4).
Then, (non-alcoholic) energy intake (kcal/d) and average food intake (g/d) of eleven food groups and twenty-two subgroups, as well as the means and 95 % confidence intervals of the MAR (%), MER (%), ED (kcal/100 g) and cost (€/d), were calculated for each of the five categories of individuals. For the purpose of these analyses, 706 (26·9 %) under-reporters were excluded, as defined by comparing the reported energy intake to the BMR as estimated from the Schofield equations( Reference Schofield 54 ) and a cut-off value for physical activity level as defined by Black( Reference Black 55 ). When specified, adjustments were made for age, gender and energy intake (except energy intake, which was adjusted for age and gender only).
Differences among the categories of individuals were analysed using the χ 2 test for categorical variables and ANOVA for continuous variables. Linear trends were tested with Cochran–Armitage tests for χ 2 tests and analysis of contrasts for ANOVA. Post hoc tests were performed to compare the FI category with the FS1 category. All analyses were based on two-tailed P values at an α risk level of 5 % for statistical significance (i.e. P<0·05). They were computed using the SAS statistical software package version 9·2 and the SURVEYREG, SURVEYMEANS, URVEYFREQ and GLM procedures.
Results
Prevalence of food insecurity
Answers from the 2624 INCA2 adult participants to the FI question are summarised in Table 1. Together, 12·2 % were considered as living in a household experiencing FI for financial reasons.
Prevalence of household food insecurity among the adult participants (n 2624), Étude Individuelle et Nationale des Consommations Alimentaires (INCA2), France, 2006–2007
* Enough but not always the kinds of food we want to eat, or sometimes or often not enough to eat for financial reasons.
Socio-economic and behavioural characteristics and living conditions
Participants were aged 45·4 (sd 16·5) years on average and 51·4 % were women. The mean income per consumption unit was 1272 € (sd 818) per month (Table 2).
Demographic, socio-economic characteristics and health behaviours of the adult participants (n 2624) living in either food-insecure (FI) households or food-secure households (FS1 to FS4), Étude Individuelle et Nationale des Consommations Alimentaires (INCA2), France, 2006–2007
HH, head of the household
Data presented are percentages unless otherwise indicated.
* Statistical significance of the differences among the five categories of individuals (FI, FS1 to FS4): χ 2 tests for categorical variables and ANOVA for continuous variables; and test for linear trend (Cochran–Armitage tests for χ 2 tests and analysis of contrasts for ANOVA) when significant differences were found among the five categories.
† Self-reported usual snack (i.e. other eating episodes apart from breakfast and main meals) eating frequency: ‘two or three times a day’ or ‘four times a day’.
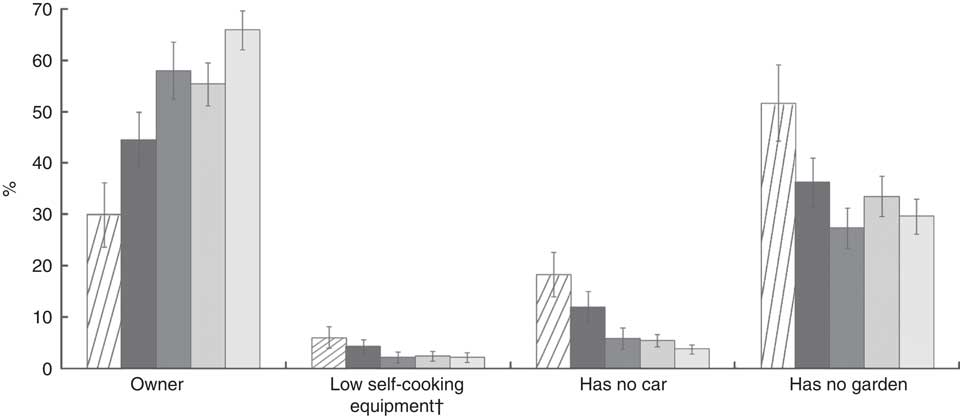
All socio-economic and behavioural characteristics and living conditions differed significantly among the five categories of individuals (Table 2 and Fig. 1). In particular, individuals experiencing FI were, compared with others (i.e. individuals in the FS category; mean and frequency and P values not shown), significantly younger, more frequently women, single with at least one child and more frequently had a ‘low’ socio-occupational status. When individuals experiencing FI were compared with those in the FS1 category (P values for post hoc tests not shown), their mean income per consumption unit was significantly higher but they more frequently reported the following statements or situations: a financial situation that was ‘difficult or impossible without debt’, foregoing health care for financial reasons and having no garden; they were also less frequently owners of their accommodation.
Living conditions of adult participants living in either food-insecure (FI) households (![]() ) or food-secure households (FS1,
) or food-secure households (FS1, ![]() ; FS2,
; FS2, ![]() ; FS3,
; FS3, ![]() ; FS4,
; FS4, ![]() )*, Étude Individuelle et Nationale des Consommations Alimentaires (INCA2), France, 2006–2007. Values are percentages with their 95 % confidence intervals represented by vertical bars. *Ownership: n 2619; self-cooking equipment: n 2623; car: n 2620; garden: n 2623. Statistical significance of the differences among the five categories of individuals (χ
2 tests): P<0·001. †Low self-cooking equipment: fewer than three of the four following electrical devices in the house: refrigerator, freezer, oven or microwave
)*, Étude Individuelle et Nationale des Consommations Alimentaires (INCA2), France, 2006–2007. Values are percentages with their 95 % confidence intervals represented by vertical bars. *Ownership: n 2619; self-cooking equipment: n 2623; car: n 2620; garden: n 2623. Statistical significance of the differences among the five categories of individuals (χ
2 tests): P<0·001. †Low self-cooking equipment: fewer than three of the four following electrical devices in the house: refrigerator, freezer, oven or microwave
A significant association was observed between the household food insecurity/income level variable and the percentage of occasional or daily smokers and of individuals eating at least two times per day between meals, as well as the average time spent watching television daily. For all these associations, a significant decreasing trend was found from FI to FS4, with the highest value observed for FI.
Food group and subgroup consumption, diet quality and diet cost
Energy intake differed significantly among the five categories in a U-shaped manner (P 0·038), but absolute differences were slight (Table 3). The total consumption of fruit and vegetables increased linearly from FI to FS4 (338·7 to 455·3 g/d, P<0·001, P trend <0·001), due to the increase in vegetables, fresh fruit, and processed fruit and juices. Overall, the mean consumption of ‘sweet foods and drinks’ decreased from 208·2 g/d in FI to 159·3 g/d in FS4 (P=0·002, P trend <0·001), mainly due to a higher consumption of soft drinks in the FI and FS1 categories than in the other groups (P values for post hoc tests not shown). Consumption of starchy foods was the highest in the FS1 category and an intermediate consumption level was observed for the FI category. No significant differences were found among the five categories for ‘dairy products’, ‘mixed dishes and salted snacks’ and the ‘added fats’ food groups. No significant differences were found either for the ‘meat, poultry, fish, eggs’ food group, but within that group, the mean consumption of fish increased from 23·4 g/d in FI to 33·6 g/d in FS4 (P<0·001, P trend <0·001). Finally, the mean consumption of alcoholic beverages increased from the FI and FS1 categories (137·9 and 127·5 g/d, respectively) to the FS4 category (183·0 g/d; P trend=0·003; Table 3).
Mean energy intake (kJ/d; kcal/d) and consumption of food groups and food subgroups (g/d)Footnote * by adult participants (n 1918Footnote †) living in either food-insecure (FI) households or food-secure households (FS1 to FS4), Étude Individuelle et Nationale des Consommations Alimentaires (INCA2), France, 2006–2007
* Means are adjusted for age, gender and energy intake (except means of energy intake, adjusted for age and gender only).
† Under-reporters for energy intakes were excluded from these analyses.
‡ Statistical significance of the differences among the five categories of individuals (FI, FS1 to FS4) using ANOVA; and test for linear trend (analysis of contrasts) when significant differences were found among the five categories.
§ Includes unrefined grains, legumes and potatoes.
|| Mixed dishes include home-made dishes, out-of-home consumption and ready-made dishes purchased in stores.
¶ Include light soft drinks and hot drinks but not sugary drinks.
** For example meal replacements, aspartame sweetener, brewer’s yeast, tofu, shortcrust baked pastry, flaky cooked pastry.
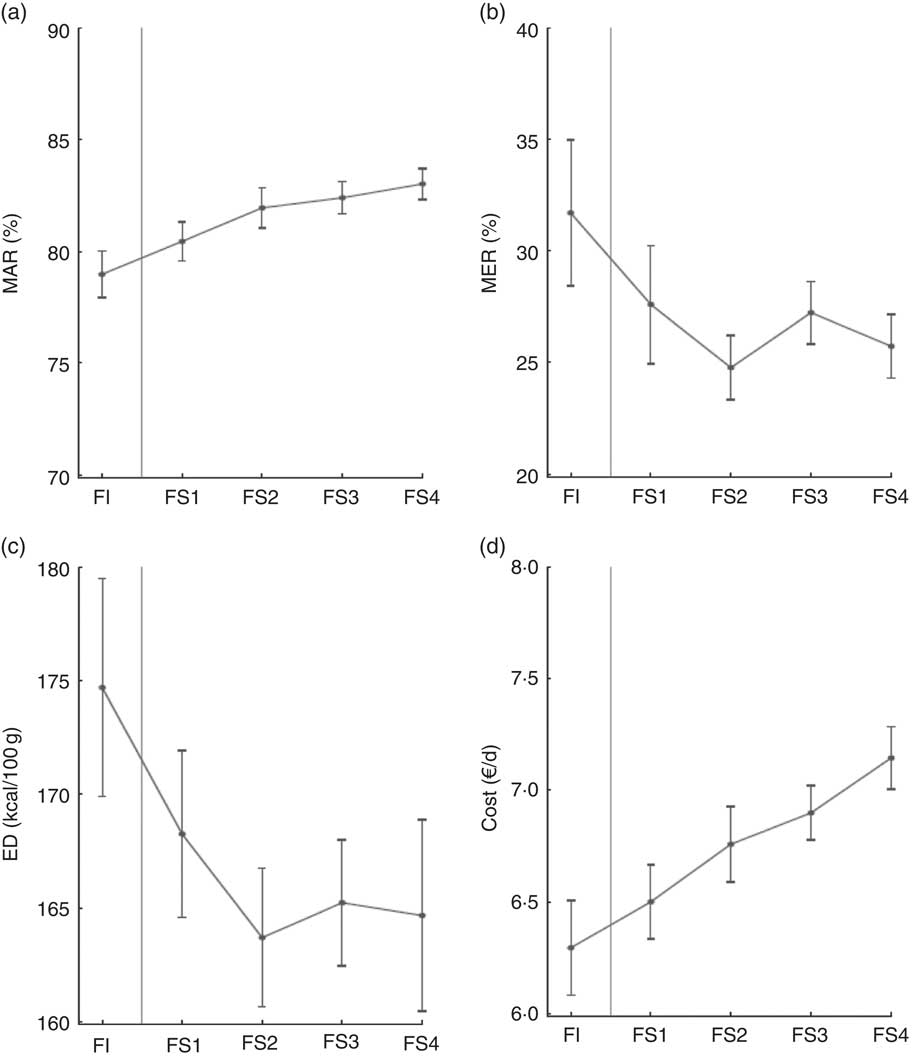
Results showed a poorer diet quality among individuals experiencing FI (Fig. 2): the mean MAR increased (P trend <0·001) and the MER and ED decreased (P trend 0·001 and 0·002, respectively) from FI to FS4. Dietary costs increased from 6·3 €/d in FI to 7·1 €/d in FS4 (P trend <0·001; Fig. 2).
(a) Mean adequacy ratio (MAR), (b) mean excess ratio (MER), (c) energy density (ED)* and (d) cost of the diet of adult participants (n 1918†) living in either food-insecure (FI) households or food-secure households (FS1 to FS4), Étude Individuelle et Nationale des Consommations Alimentaires (INCA2), France, 2006–2007. Values are means, adjusted for age, gender and energy intake, with their 95 % confidence intervals represented by vertical bars. *Only items typically consumed as foods, including soups, were included in calculation of ED; 1 kcal=4·184 kJ. †Under-reporters of energy intake were excluded from these analyses
Discussion
Based on a representative national sample of adults, the prevalence of household FI in France was estimated to be 12·2 % in 2006–2007. This finding is in between the values observed in the USA between 2005 and 2007 (11 %) and in 2008 (14·5 %)( Reference Coleman-Jensen, Nord and Singh 56 ), and is higher than that observed in both Canada in 2007–2008 (7·7 %)( 57 ) and the Paris metropolitan area, which is the wealthiest region in France, in 2010 (6·3 %)( Reference Martin-Fernandez, Grillo and Parizot 13 , Reference Auzet, Février and Lapinte 58 ). Beyond methodological differences between studies (in particular regarding FI assessment), variation in FI prevalence between countries may be due to differences in the state of national economies, socio-economic characteristics of the population (e.g. income distribution), tax/tax-credit arrangements and the provision of in-kind benefits (e.g. food assistance, health care, housing assistance)( Reference Nord, Hooper and Hopwood 59 ).
Consistent with previous studies carried out in the USA, Canada, England, Finland and one French region( Reference Rose 9 , Reference Martin-Fernandez, Grillo and Parizot 13 , Reference Kirkpatrick and Tarasuk 31 , Reference Sarlio-Lahteenkorva and Lahelma 33 , Reference Tingay, Tan and Tan 34 , Reference Alaimo, Briefel and Frongillo 43 ), the present study showed that individuals reporting household FI were younger, more frequently women, single parents with children, non-home owners and had lower income than those living in food-secure households. The greater vulnerability of women could result from the dynamic nature of experiencing FI within the household: parents, particularly women, tend to deprive themselves to protect their children against hunger( Reference Hamelin, Beaudry and Habicht 6 ). The gender effect could however be confounded by family composition because women are heavily overrepresented among single-parent families( Reference Chardon, Daguet and Vivas 60 ), as previously observed( Reference Martin-Fernandez, Grillo and Parizot 13 ). It is noteworthy that there is a higher risk of FI among single-parent families despite the existence of a supplemental familial allowance for single-parent families with low income in France. This is of particular concern given that FI has been associated with several social, emotional and health consequences among children( Reference Hamelin, Beaudry and Habicht 6 , Reference Ramsey, Giskes and Turrell 12 , Reference Cook, Black and Chilton 61 ).
The relationship between income and FI has been well established( Reference Rose 9 , Reference Martin-Fernandez, Grillo and Parizot 13 , Reference Sarlio-Lahteenkorva and Lahelma 33 , Reference Tingay, Tan and Tan 34 ). However, the present study, based on comparisons between individuals experiencing household FI and those living in food-secure households divided into four categories according to income level (FS1 to FS4), suggests a somewhat more nuanced situation. Mean income level in the FI category (840 €/month) was just above the French poverty level (defined as 50 % of the median French income: 804 €/month in 2008) and nearly twice as high as in the FS1 category (food-secure households with a very low income: 471 €/month). Yet, using both subjective and objective indicators, worse living conditions were found in the FI category than in the FS1 (e.g. perceived financial difficulties, foregone medical care and fewer domestic electrical devices). This suggests that individuals experiencing household FI have to address significant expenditures (e.g. housing rent, heating costs and child-care expenses) that affect living conditions and cut back the available budget for food. The estimated diet cost was the lowest in the FI category (6·3 €/person per d) in the present study. Interestingly, and consistent with the literature( Reference Armour, Pitts and Lee 62 ), the present study also suggests that these individuals may have greater expenditures due to cigarette smoking. Tobacco may help them to cope with hunger( Reference Grunberg 63 ) and the hardships in their lives( Reference Krueger and Chang 64 ). Time preferences may also intervene in the relationship between FI and smoking behaviour, as present time orientation (giving little thought to the future/living for the time being and not considering the future consequences of current behaviours) is correlated to both cigarette smoking and low socio-economic status( Reference Peretti-Watel, L’Haridon and Seror 65 ) and, most likely more drastically, to FI.
The results of previous studies regarding the association between FI and energy intake are somewhat contradictory( Reference Kendall, Olson and Frongillo 26 , Reference Dixon, Winkleby and Radimer 29 , Reference Zizza, Duffy and Gerrior 66 ). The present study did not find lower energy intakes among individuals experiencing household FI and suggested a higher frequency of snack eating, as was found in the study by Zizza et al.( Reference Zizza, Duffy and Gerrior 66 ). The energy obtained by snacking may compensate for a reduced meal frequency among FI individuals( Reference Zizza, Duffy and Gerrior 66 ). The present study supports an association between FI and a lower diet quality( Reference Rose and Oliveira 24 , Reference Kirkpatrick and Tarasuk 27 , Reference Dixon, Winkleby and Radimer 29 ). In particular, important differences were found regarding the consumption of fruits and vegetables and the consumption of fish. In fact, the FI category was the only category to display a mean consumption of fruits and vegetables (338 g/d) clearly lower than the minimum recommended amount of 400 g/d and a mean consumption of fish (164 g/week) that was also lower than the 200 g/week recommended by most food-based dietary guidelines( 67 ). On the contrary, the consumption of foods whose intake should be limited such as sweet foods and soft drinks was high (higher than 200 g/d) in both the FI and the FS1 categories. All three diet quality indicators (MAR, MER, ED) also showed that food quality increased from FI to FS4, although absolute differences were rather small. This situation may in part result from financial constraints faced by FI households, as diets composed of low-energy-density nutrient-rich foods (especially fruit, vegetables and fish) are more expensive than diets composed of refined grains, added sugars and added fats( Reference Darmon and Drewnowski 1 ).
Limitations and strengths
The findings of the present study should be interpreted with the following methodological limitations in mind. First, FI was assessed using the single-item, four-part-response Food Sufficiency Indicator of the US Department of Agriculture( Reference Radimer and Radimer 4 ) together with additional questions about the reasons for not having enough food and/or not having the kind of food wanted( Reference Alaimo, Briefel and Frongillo 43 ). These questions did not capture the full range of conditions and behaviours associated with FI and hunger, as they are addressed in the more recent and comprehensive instrument, the US Household Food Security Module( Reference Radimer and Radimer 4 ). However, Radimer and Radimer showed that the four-part response to the Food Sufficiency Indicator fairly accurately estimates food insecurity( Reference Radimer and Radimer 4 ). Second, although the participation rate in the survey (63 %) is similar to that obtained in another similar French survey requiring home visits( Reference Castetbon, Vernay and Malon 68 ), possible occurrence of a selection bias it cannot be excluded. Moreover, the study design excluded some population groups (e.g. non-French speakers, individuals without a residential address) that are most likely poorer than the rest of the population. Weighing data according to French national census data (especially age, sex, occupation of the household head and size of the household) should have limited such bias. Nevertheless, the prevalence of FI in the present study remains most likely slightly underestimated and its results should be extrapolated with caution to the entire adult French population experiencing FI. Third, the cross-sectional nature of the study prevents any causal inference.
Among the strengths of the current study, it is noteworthy that the INCA2 survey included comprehensive factors related to FI, allowing for the first time in France not only an estimation of FI at the national level but also a broad investigation of FI covariates. Finally, under-reporting is a common problem in dietary surveys, including the INCA2 survey. As under-reporting has been inversely related to socio-economic status( Reference Carter and Whiting 69 , Reference Stallone, Brunner and Bingham 70 ), associations between FI and dietary intake were assessed after excluding under-reporters. To the best of our knowledge, only one previous study on dietary intakes associated with FI took this phenomenon into account( Reference Dixon, Winkleby and Radimer 29 ).
Conclusions
Based on a representative sample of the adult population, the present study showed for the first time that France is not immune to FI; approximately one adult out of ten experienced household FI in 2006–2007. Low-income people, single parents (in particular women) and non-home owners are particularly at risk of FI. Experiencing FI is likely to impinge on the consumption of healthy foods such as fruits and vegetables, thus altering the overall quality of the diet. In addition, people experiencing FI display a less favourable profile with regard to eating between meals, television watching and smoking.
FI is currently not routinely monitored in France. It would be necessary to include the comprehensive instrument, the US Household Food Security Module, in future national surveys to assess trends of FI prevalence in the context of economic crisis, to allow international comparisons and improve our understanding of factors that mitigate vulnerability to FI. Moreover, French authorities should promote research and expert consultations to identify the most effective strategies for reducing problems of FI in the French context. Ensuring financial and geographical accessibility to healthy foods and their attractiveness, especially for people experiencing FI, should be priorities in future national nutrition policies.
Acknowledgements
Acknowledgements: The authors thank G. Calamassi-Tran, A. Dufour, L. Lafay, M. Touvier and J.-L. Volatier, who contributed to the design and data collection of the INCA2 survey. They also thank the Institut de Sondage Lavialle (ISL) team for the collection of data, and all the families for their cooperation. Financial support: The INCA2 dietary survey was funded by the ANSES (formerly AFSSA). This study was financially supported by the National Observatory on Poverty and Social Exclusion (ONPES). The ONPES had no role in the design, analysis or writing of this article. Conflict of interest: None. Authorship: N.D, S.L., C.D. and F.C. contributed to the design of the study. F.V. analysed the data. A.B., F.V. and N.D. conceived the paper and wrote the manuscript. All authors revised and approved the final version of the paper for publication. Ethics of human subject participation: This survey was approved by the CNIL. Verbal informed consent was obtained from all participants and formally recorded.


