


Non-technical Summary
Reconstructing evolutionary relationships among organisms provides important insight into the history of life on Earth. Evolutionary (phylogenetic) trees can be used to show the relationships between extinct and extant organisms. By incorporating fossils, we can then estimate the timing of significant events such as a speciation event. The models used to generate trees in paleobiology combine different data sources, including molecular sequences from living organisms, the ages of fossils, and morphological information from both. Using this framework, we can learn about the rate of evolutionary dynamics of organisms, for example, the rate of speciation or diversification, or geographic movements through time. In this review article, we describe details of the statistical modeling framework used to integrate observations from living and fossil taxa. In particular, we focus on the use of the fossilized birth–death process, which is the only available model that allows us to include knowledge about the structure of the paleontological record into phylogenetic analyses. Because not all organisms and environments are equally well preserved, a flexible framework for working with fossils is essential for obtaining reliably dated phylogenies. In the decade since the model first became available in phylogenetic software, it has been used in more than 170 studies. We celebrate different applications of the model and highlight practical challenges. An important point that emerges from our discussion is that both the complexity of fossil data and details of the assumptions made by different models are crucial to consider. We hope to stimulate the exchange of ideas between researchers collecting and curating paleontological data and those developing models and software, with a view to further improving approaches to studying evolution in deep time.
Introduction
Phylogenetic analysis has been widely utilized in paleontological research, as it provides an intuitive method for understanding the relationships among species (López-Antõnanzas et al. Reference López-Antõnanzas, Mitchell, Simões, Condamine, Aguilée, Campomanes, Renaud, Rolland and Donoghue2022). Not only can a phylogenetic framework guide taxonomic classification, but it can also be used to estimate divergence times (Wolfe et al. Reference Wolfe, Ballou, Luque, Watson-Zink, Ahyong, Barido-Sottani and Chan2023); rates of diversification (Herrera Reference Herrera2017; Tougard Reference Tougard2017); and various other evolutionary dynamics, such as biogeographic patterns (Tavares et al. Reference Tavares, Warsi, Balseiro, Mancina and Dávalos2018; Landis et al. Reference Landis, Eaton, Clement, Park, Spriggs, Sweeney, Edwards and Donoghue2021; de Faria Santos et al. Reference de Faria Santos, Cancello and Morales2022; Coiro et al. Reference Coiro, Allio, Mazet, Seyfullah and Condamine2023) or trait evolution (Slater et al. Reference Slater, Goldbogen and Pyenson2017; Sterli et al. Reference Sterli, De La Fuente and Rougier2018; Farina et al. Reference Farina, Godoy, Benson, Langer and Ferreira2023). Despite their ubiquity, phylogenetic analyses can be conceptually challenging and difficult to apply in practice. This comes down to properties inherent in both the data and the methods themselves. The typical data used in a phylogenetic analysis are a combination of molecular and/or morphological characters, taxonomic identity, and fossil age information (see Table 1). These data are labor-intensive to collect and curate, non-uniformly incomplete, and associated with complex uncertainties. Integrating these different data types into a single analysis is not straightforward and requires a statistically advanced approach, often applied within a Bayesian framework.
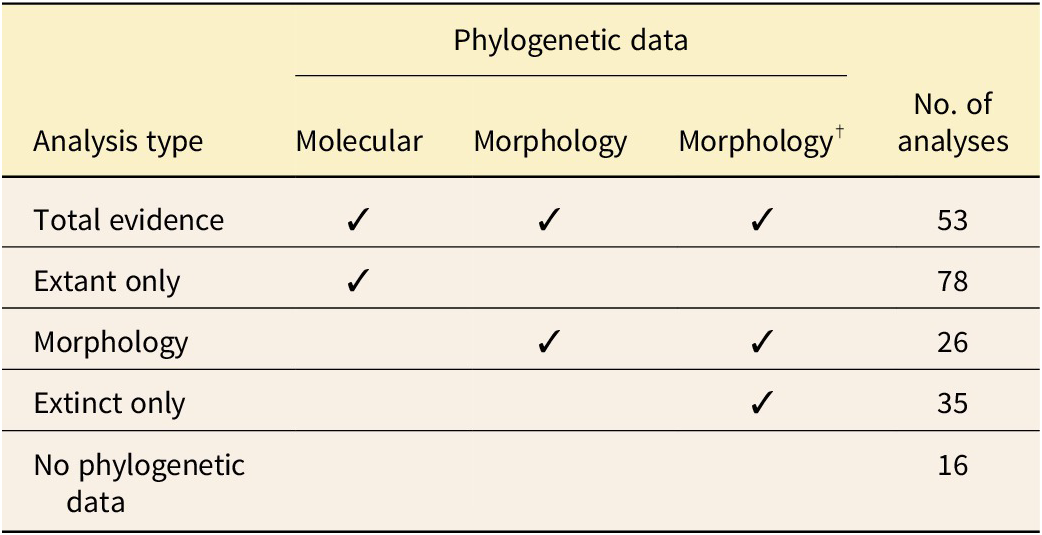
Application of fossilized birth–death (FBD) models to different types of phylogenetic character data. To date, studies have included molecular data for extant samples or morphological data for extant and extinct (†) samples. (Molecular data could theoretically also be included for extinct samples, if ancient DNA is available.) In “total-evidence” analyses, character data are included for both extant (molecular and morphology) and extinct (morphology only) samples. “Extant only” refers to analyses in which molecular data are included for extant samples only and fossils are placed using constraints. “Morphology” refers to analyses in which morphology is included for both extant and extinct samples. “Extinct only” refers to analyses of fully extinct trees in which morphological data are available for extinct samples. “No phylogenetic data” refers to analyses in which no phylogenetic character data are included (see Boxes 2 and 5). All analyses using the FBD model must also include temporal data. See Section The Data for more information
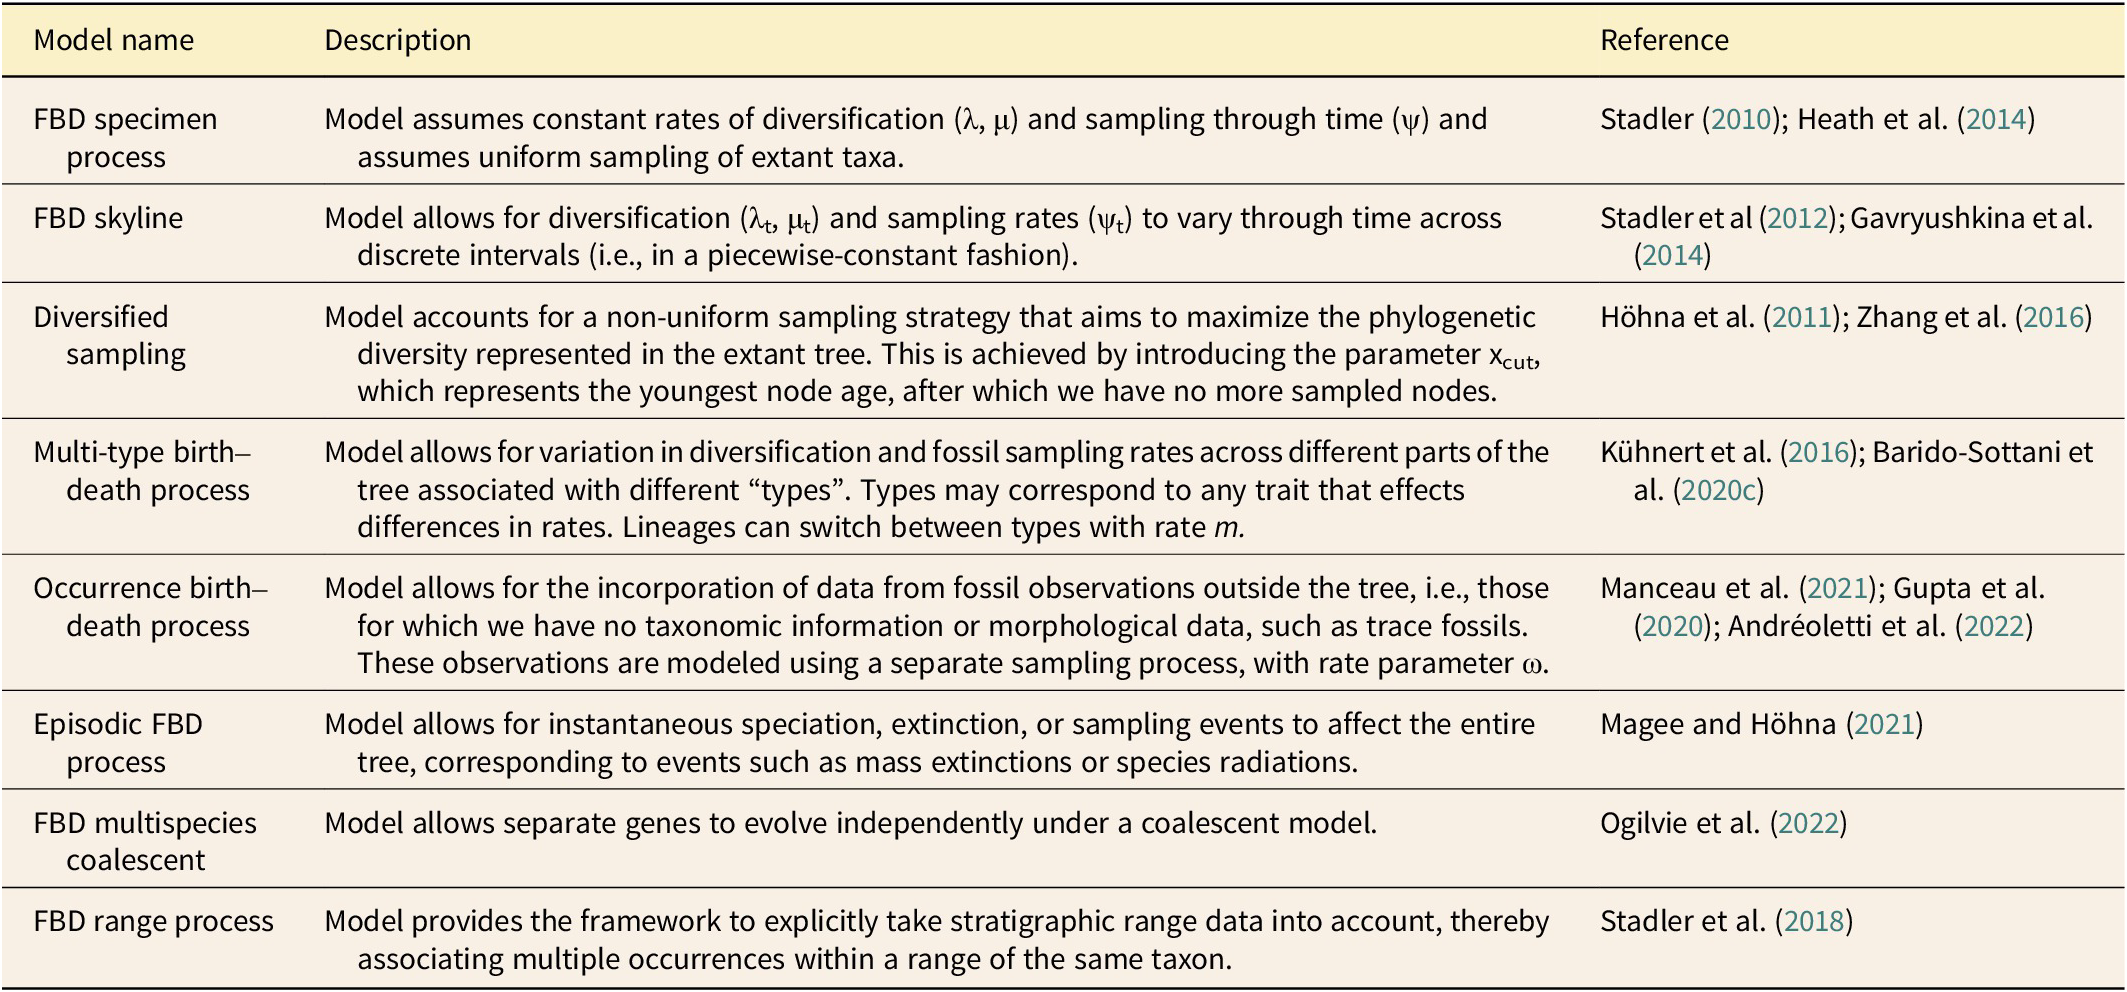
A major breakthrough in our ability to integrate these data sources came with the introduction of the fossilized birth–death (FBD) family of models, which allow for the joint estimation of a phylogeny and divergence times using extinct and extant taxa (Stadler Reference Stadler2010; Didier et al. Reference Didier, Royer-Carenzi and Laurin2012; Gavryushkina et al. Reference Gavryushkina, Welch, Stadler and Drummond2014, Reference Gavryushkina, Heath, Ksepka, Stadler, Welch and Drummond2017; Heath et al. Reference Heath, Huelsenbeck and Stadler2014; Zhang et al. Reference Zhang, Stadler, Klopfstein, Heath and Ronquist2016; Stadler et al. Reference Stadler, Gavryushkina, Warnock, Drummond and Heath2018). FBD models offer a number of advantages over other approaches. They are typically implemented in a Bayesian framework, which provides a robust approach to incorporating uncertainty in our data and estimates. The most important property of these models is that they explicitly account for both fossil and extant sampling probabilities. In this way, it is possible to model both extinct and extant observations under the same generating process (Stadler Reference Stadler2010). There have been a number of extensions to the original model, and we note that we consider any model that includes the fossil sampling process explicitly (i.e., has a parameter for the rate of fossil sampling) to be a member of the FBD model family (see Table 2). Phylogenetic analysis using FBD models offers great potential for furthering our understanding of evolution in deep time. However, as these methods become more complex, it can be challenging to apply them to empirical data in practice.
Available fossilized birth–death (FBD) models and extensions
In this review, we aim to provide a guide on how FBD models work, what they assume, and how all of this fits with the nature of empirical data from the fossil record. To this end, we first quantified the use of the FBD model to date through a literature survey. This allowed us to understand the types of questions asked by (paleo)biologists using the models, as well as determine areas of confusion regarding the application of the models. Next, we provide an introduction to Bayesian inference, along with some relevant terminology and concepts. We then discuss aspects of paleontological data that allow for their inclusion in analyses using FBD models, including more complicated properties that cannot yet be accounted for by existing models. Following this, we discuss the models used in Bayesian phylogenetic inference, with a focus on the FBD model, which is grounded in discussions about the realities of paleontological data. We discuss different software and resources available for Bayesian phylogenetic analysis of fossil data (Box 1) and how to include information on tree topology (Box 2). Further, we present three exemplar case studies that showcase different applications of the FBD model in paleobiology, emphasizing the connection between the data and the models in each case, (see Box 3–5). Finally, we end with a perspective on outstanding challenges and future directions for integrating paleontological data into FBD models and modeling fossil sampling.
Software and resources for Bayesian phylogenetic analysis of fossil data.
The fossilized birth–death (FBD) model has been implemented in a number of phylogenetic software programs. Choosing which might be most appropriate for running a specific analysis should include considering the component models available in the different software programs and the accessibility of relevant documentation and example configuration files. Here we describe a selection of software programs that implement the FBD model.
BEAST2 (Bouckaert et al. Reference Bouckaert, Vaughan, Barido-Sottani, Duchêne, Fourment, Gavryushkina and Heled2019) is a common choice for divergence time estimation using a ready-built phylogeny and for joint estimation of tree topology and divergence times. The program is modularized, with a core supported by packages containing specific models and model components. BEAST2 configuration files, which are .xml, can be created using BEAUti, its accompanying GUI. This makes building models more user-friendly, particularly features such as the live visualization of prior distributions. Skyline and stratigraphic range implementations are available in BEAST2, but at present, the software offers limited options for morphological substitution models. While some tutorials are available on the core BEAST2 website (https://www.beast2.org/tutorials), additional tutorials and training courses are available through Taming the BEAST (Barido-Sottani et al. Reference Barido-Sottani, Bošková, du Plessis, Kühnert, Magnus, Mitov and Müller2018; https://taming-the-beast.org).
MrBayes (Ronquist et al. Reference Ronquist, Teslenko, Van Der Mark, Ayres, Darling, Höhna, Larget, Liu, Suchard and Huelsenbeck2012b) is the most popular choice for FBD analyses using extinct clades, based on our literature review. MrBayes is operated through the command line, meaning that it can be run easily on all operating systems but requires some coding expertise to use. MrBayes configuration files are NEXUS, or .nex, files. MrBayes includes a wide range of evolutionary models. The R package PASTIS (Thomas et al. Reference Thomas, Hartmann, Jetz, Joy, Mimoto and Mooers2013) can be used to add taxonomic constraints to tips without genetic data in a MrBayes analysis. A user manual (http://nbisweden.github.io/MrBayes/manual.html) and example configuration files are supplied with the program. A comprehensive tutorial is also available for the FBD model (Zhang Reference Zhang2016).
RevBayes (Höhna et al. Reference Höhna, Landis, Heath, Boussau, Lartillot, Moore, Huelsenbeck and Ronquist2016) allows users to build phylogenetic models using an internal R-like language, Rev. This enables the easy translation of models into graphical objects, allowing visualization to improve the interpretability of models. It also aims to balance the convenience of using ready-built modules with the customizability afforded by a programming language. Configuration files are provided in the unique .Rev format. There are also RevBayes-specific companion R packages, RevGadgets (Tribble et al. Reference Tribble, Freyman, Landis, Lim, Barido-Sottani, Kopperud, Höhna and May2022) and Revticulate (Charpentier and Wright Reference Charpentier and Wright2022). Extensive documentation, tutorials, and videos are available on the RevBayes website (https://revbayes.github.io).
DateFBD (Didier and Laurin Reference Didier and Laurin2020), available as both a stand-alone program and an R package, can also be used to conduct divergence time estimation on preconstructed phylogenies using the FBD.
Previously inferred trees.
Previously inferred trees can be used to constrain the entire tree topology or just parts of the tree, for example, constraining specific key clades or even using a backbone constraint for extant taxa. When taking this approach, the user needs to decide whether or not to use the entire posterior distribution of trees (most plausible set of trees estimated) or a summary tree, and if so, which type of summary tree (see Section Assessing and Interpreting the Output for information on summary trees). Constraining the topology using a previously inferred tree is reasonable when working with whole-genome data or large alignments (e.g., Fleming et al. Reference Fleming, Kristensen, Sørensen, Park, Arakawa, Blaxter and Rebecchi2018; Coiro et al. Reference Coiro, Allio, Mazet, Seyfullah and Condamine2023; see Box 4) or, more commonly in paleobiology, using supertrees (e.g., Allen et al. Reference Allen, Oliveira, Stadler, Vaughan and Warnock2024; see Box 5). Supertrees can be either informal or formal, depending on how they are constructed. Informal supertrees are often manually constructed, using software such as Mesquite (Maddison and Maddison Reference Maddison and Maddison2023), although new methods are available to automate this step (Castiglione et al. Reference Castiglione, Serio, Mondanaro, Melchionna and Raia2022). This involves combining trees from different studies without explicitly addressing conflict between topologies. In cases where there are conflicting hypotheses about the phylogenetic history of a group, it is common to construct more than one supertree to reflect these controversies. Any downstream analysis would thus be carried out using all supertrees (e.g., Godoy et al. Reference Godoy, Benson, Bronzati and Butler2019; Dunne et al. Reference Dunne, Farnsworth, Benson, Godoy, Greene, Valdes, Lunt and Butler2023). Formal supertrees are also constructed using trees from different studies but rely on algorithms that explicitly account for conflicting topologies to construct them (e.g., Lloyd and Slater Reference Lloyd and Slater2021; Stockdale and Benton Reference Stockdale and Benton2021).
Case study 1: Inference of a fully extinct phylogeny.
Study Objectives. One of the first applications of the fossilized birth–death (FBD) model to a completely extinct group was carried out by Wright (Reference Wright2017). Here, the main objective was to explore phylogenetic relationships among Ordovician through Devonian non-camerate crinoids and to revisit the systematics of this group based on trees inferred using the FBD model. While the phylogeny and taxonomy of this group had been studied previously using a phylogenetic approach, the FBD model allowed both character and temporal evidence to inform the topology. This study also included a comprehensive description of the FBD model from a paleontological perspective and a detailed explanation of how it could be applied to fully extinct groups.
Data. The data used in this study consisted of a discrete morphological character matrix and taxon age information. The morphological data consisted of 87 characters coded for 42 species of non-camerate crinoids. Wright (Reference Wright2017) gathered age information from the literature for each of the 42 species in the matrix comprising 14 singletons and 28 taxa whose stratigraphic range spanned more than one geological interval (see Section Temporal Data, Fig. 4).
Bayesian Inference. The analysis was carried out using MrBayes 3.2 (Ronquist et al. Reference Ronquist, Teslenko, Van Der Mark, Ayres, Darling, Höhna, Larget, Liu, Suchard and Huelsenbeck2012b). The FBD specimen model was used as the tree model (Stadler Reference Stadler2010; see Section The FBD Process ). The FBD process was parameterized in terms of diversification, turnover, and sampling proportion; see Box 6 for details. Phylogenetic software usually scales the tree (irrespective of the input ages) such that the youngest sample is always at age zero. The probability of sampling at the “present,” that is, at the end of the sampling interval, ρ, was set to 1. An alternative would be to set ρ = 0 and co-estimate the age of the youngest (ψ sampled) fossil, which later became possible in BEAST2, with the introduction of an offset parameter (Barido-Sottani et al. Reference Barido-Sottani, Van Tiel, Hopkins, Wright, Stadler and Warnock2020b). A single age range was specified for each taxon, representing the upper limit of the oldest possible fossil age and the lower limit of the youngest possible fossil age.
The author carried out model selection to identify the most suitable clock model. A relaxed clock model was found to provide the best fit to the data, which matched the author’s expectation that morphological rates of evolution vary across the tree (see Section Clock Models). An MkV model (Lewis Reference Lewis2001) with a lognormal distribution describing rate variation was used to describe the evolution of the character data (see Section Substitution models). As all taxa included in the analysis had character data, the position of each fossil was inferred during the inference. Several well-established clades (Disparida, Flexibilia) were constrained to improve efficiency. Support for the monophyly of taxonomic groups was evaluated using the resulting summary tree and the posterior probability of internal nodes. Sensitivity analyses were performed to assess the impact of the priors on the FBD and clock model parameters.
Study Outcomes. Wright (Reference Wright2017) found support for several of the clades identified in previous studies. For example, strong support was found for the split between disparids (and disparid-like taxa) and all other non-camerate crinoids and for the monophyly of several other previously classified groups. However, there were several cases in which the monophyly of previously described taxonomic groups was not supported, and the position of some groups relative to others shifted compared with previous phylogenetic analyses. We note that because the majority of taxa included in this study span more than one geological stage, it would be interesting to reanalyze this dataset using the FBD range model and observe whether this results in any further changes to the topology.
Case study 2: Total-evidence analysis.
Study Objectives. Cycads (Cycadales) are seed plants that once exhibited high diversity and had a global distribution, but are now restricted to low latitudes. Coiro et al. (Reference Coiro, Allio, Mazet, Seyfullah and Condamine2023) aimed to infer the origins of the group and the evolution of their geographic range over the clade’s history. They used a total-evidence approach, which allowed them to combine molecular data, morphological data, and temporal information from the fossil record into a single phylogenetic inference (Ronquist et al. Reference Ronquist, Klopfstein, Vilhelmsen, Schulmeister, Murray and Rasnitsyn2012a). The resulting time-calibrated tree, including extant and fossil taxa, was used in downstream biogeographic analyses.
Data. The morphological matrix used in this analysis consisted of 60 fossil and 321 extant cycad species, with 31 morphological characters covering leaf morphology and cuticular anatomy. The molecular matrix contained 18 loci for each of the 321 extant species. Temporal occurrence data associated with fossils in the morphological alignment were collected from the literature (see Section The Data).
Bayesian Inference. The analysis was carried out in MrBayes 3.2 (Ronquist et al. Reference Ronquist, Teslenko, Van Der Mark, Ayres, Darling, Höhna, Larget, Liu, Suchard and Huelsenbeck2012b) using the fossilized birth–death (FBD) model with diversified sampling (Zhang et al. Reference Zhang2016), which accounts for non-uniform sampling of extant species (see Section The FBD Process, Table 2). The model was parameterized using speciation (λ), extinction (μ), and fossil sampling rates (ψ). The prior on λ was an exponential distribution with a mean of 0.1. The priors on μ and ψ rates were beta distributions with a mean of 0.5. The probability of extant species sampling, ρ, was set to 0.87, as the analysis contained 321 of the 370 recognized extant species. The prior on the origin time (t origin) was set to a uniform distribution between 359 Ma (the early Famennian, corresponding to the earliest evidence of stem seeds) and 259 Ma (during the late Lopingian). A single age range was specified for each fossil, based on the upper and lower limits of the fossil sample localities. For the character data, the authors used six separate partitions for the molecular data and one for morphological data. A relaxed clock model was used for the molecular data, with the average rate and variance linked across partitions, while a strict clock model was used for the morphological partition (see Section Clock Models). Model selection was used to identify the best-suited substitution models for the molecular partitions, and an MkV+Γ model (Yang Reference Yang1994; Lewis Reference Lewis2001) was used for the morphological partition (see Section Substitution Models). As all fossils were associated with character data, their positions in the tree could be inferred during the inference. To improve computational efficiency, the relationships among extant taxa were fixed, based on a tree inferred using a maximum-likelihood approach (see Section Application of FBD Models). The resulting dated phylogeny was used for further analysis. Patterns of historical biogeography were inferred using the dispersal–extinction–cladogenesis (DEC) model (Ree and Smith Reference Ree and Smith2008), using the software DECX (Beeravolu and Condamine Reference Beeravolu and Condamine2016) and the R package BioGeoBEARS (Matzke Reference Matzke2013). Ancestral latitudes were also estimated using a Brownian motion model in the software fossilBM (Zhang et al. Reference Zhang, Ree, Salamin, Xing and Silvestro2022).
Study Outcomes. The inferred phylogeny obtained using the FBD model, combined with the biogeographic analyses, provide a rich picture of the temporal and spatial history of the group. Cycads were estimated to have originated in the Carboniferous on the Laurasian continent, with two major lineages (Cycadaceae, Zamiaceae) later originating in the Triassic and Jurassic, as the group expanded its range across Gondwana. The authors were able to identify key vicariance events, as well as intervals during which latitude ranges expanded and contracted. This study also served to demonstrate the importance of incorporating fossils into phylogenies for testing biogeographic hypotheses. Our literature survey revealed that the FBD model is often used to reconstruct trees for this purpose (Supplementary Table S2).
Case study 3: Inferring diversification dynamics.
Study objectives. The diversity of non-avian dinosaurs through time, between their origin during the Triassic and their ultimate extinction at the end-Cretaceous mass extinction, has been extensively studied. However, these studies have reached a wide range of conclusions about dinosaur diversity in the latest Cretaceous, with some suggesting that the clade was still diversifying right up until the mass extinction event, while others indicate that dinosaurs may have been declining in diversity for tens of millions of years prior. Allen et al. (Reference Allen, Oliveira, Stadler, Vaughan and Warnock2024) applied two skyline models, a fossilized birth–death (FBD) skyline and a coalescent skyline, to dinosaur supertrees to investigate the role of model sampling assumptions in determining the outcomes of analyses of dinosaur diversification.
Data. The data used consisted of four supertrees (three informal and one formal; see Section Application of FBD Models) and fossil age information in the form of stratigraphic ranges obtained for each species from the PBDB. Following taxon alignment between these two datasets, the supertrees contained 391 (Lloyd et al. Reference Lloyd, Davis, Pisani, Tarver, Ruta, Sakamoto, Hone, Jennings and Benton2008), 542 (two topologies; Benson et al. Reference Benson, Campione, Carrano, Mannion, Sullivan, Upchurch and Evans2014), and 750 (Lloyd et al. Reference Lloyd, Bapst, Friedman and Davis2016) dinosaur species.
Bayesian Inference. The FBD analysis was carried out using a skyline model (Gavryushkina et al. Reference Gavryushkina, Welch, Stadler and Drummond2014; see Section The FBD Process, Table 2) in BEAST2 (Bouckaert et al. Reference Bouckaert, Vaughan, Barido-Sottani, Duchêne, Fourment, Gavryushkina and Heled2019). The model was parameterized using speciation (λ) and extinction (μ) rates, along with a fossil sampling rate (ψ), with diversification rates (speciation − extinction) calculated post hoc. The probability of sampling extant species, ρ, was set to 0. Seven change times, placed at geological stage boundaries, allowed piecewise constant rates to be calculated for eight approximately equal intervals, ranging from the Triassic to the Cretaceous. The priors on λ and μ were exponential distributions with a mean of 1.0. The prior on ψ was an exponential distribution with a mean of 0.2 to reflect the prior expectation that sampling is low relative to diversification. The prior on the origin time (t origin) of the clade was set to a uniform distribution with an upper bound of 266 Ma (during the mid-Permian) and a lower bound of 66 Ma (the end of the Cretaceous). The topologies of the supertrees remained fixed during the analyses, but fossil age constraints were used to provide temporal information. In each iteration, the age of each species was sampled from a uniform distribution ranging from the upper limit of the oldest possible fossil age to the lower limit of the youngest possible fossil age. Node ages (and hence branch lengths) and the phylodynamic (λ, μ, ψ) parameters were also sampled. This allowed dinosaur diversification rates to be inferred while taking into account uncertainty in fossil ages.
Study Outcomes. Allen et al. (Reference Allen, Oliveira, Stadler, Vaughan and Warnock2024) found that the FBD skyline models suggested that dinosaurs were still experiencing positive diversification rates during the latest Cretaceous, but the accompanying coalescent skyline models inferred negative diversification rates during this same interval. The dinosaur fossil record is highly uneven, and the different results produced are likely linked to the different sampling assumptions underlying these two models. This is supported by the fact that the FBD skyline model’s highest posterior density (HPD) intervals reached unrealistically high sampling rates in the latest Cretaceous. However, this was not the case for the largest phylogeny, indicating that tree size likely also has a large impact on our ability to infer diversification rates using skyline models. Overall, these results demonstrate the importance of understanding model assumptions when applying phylogenetic models.
Through this review, we hope to celebrate the FBD model family, inform readers of its nuances and potential uses, and stimulate discussion around best practices for answering empirical questions. Within this, we encourage researchers to critically assess the models they use and how those models might apply to their data. We also hope to improve collective understanding of the properties of paleontological data, in order to facilitate the development of models that make more realistic assumptions.
Application of FBD Models
A decade on from the first implementations of the FBD model (Heath et al. Reference Heath, Huelsenbeck and Stadler2014; Gavryushkina et al. Reference Gavryushkina, Welch, Stadler and Drummond2014), it continues to receive significant citation and has been applied to a wide range of clades across the tree of life. To quantify its use to date, we carried out a literature survey (see Supplementary Material for details) and collated information from 176 studies, with 208 empirical analyses (Supplementary Table S2). The results are summarized in Figures 1 and 2. The term “samples” is used here to encompass both extant and extinct data. This distinction is important, because some taxa may be represented by multiple individuals, and some fossils may represent sampled ancestors rather than just terminal taxa. In this way, increasing the number of samples may be different from increasing the number of tips/taxa in an analysis.
A, The number of extant vs. extinct samples. Each point represents an individual analysis. Points above the dashed line have more extant samples relative to extinct, whereas those under the line have more extinct samples. B, The number of samples (extant plus extinct samples) vs. the number of morphological characters used in an analysis. C, The number of analyses using plants, invertebrates, and vertebrates.

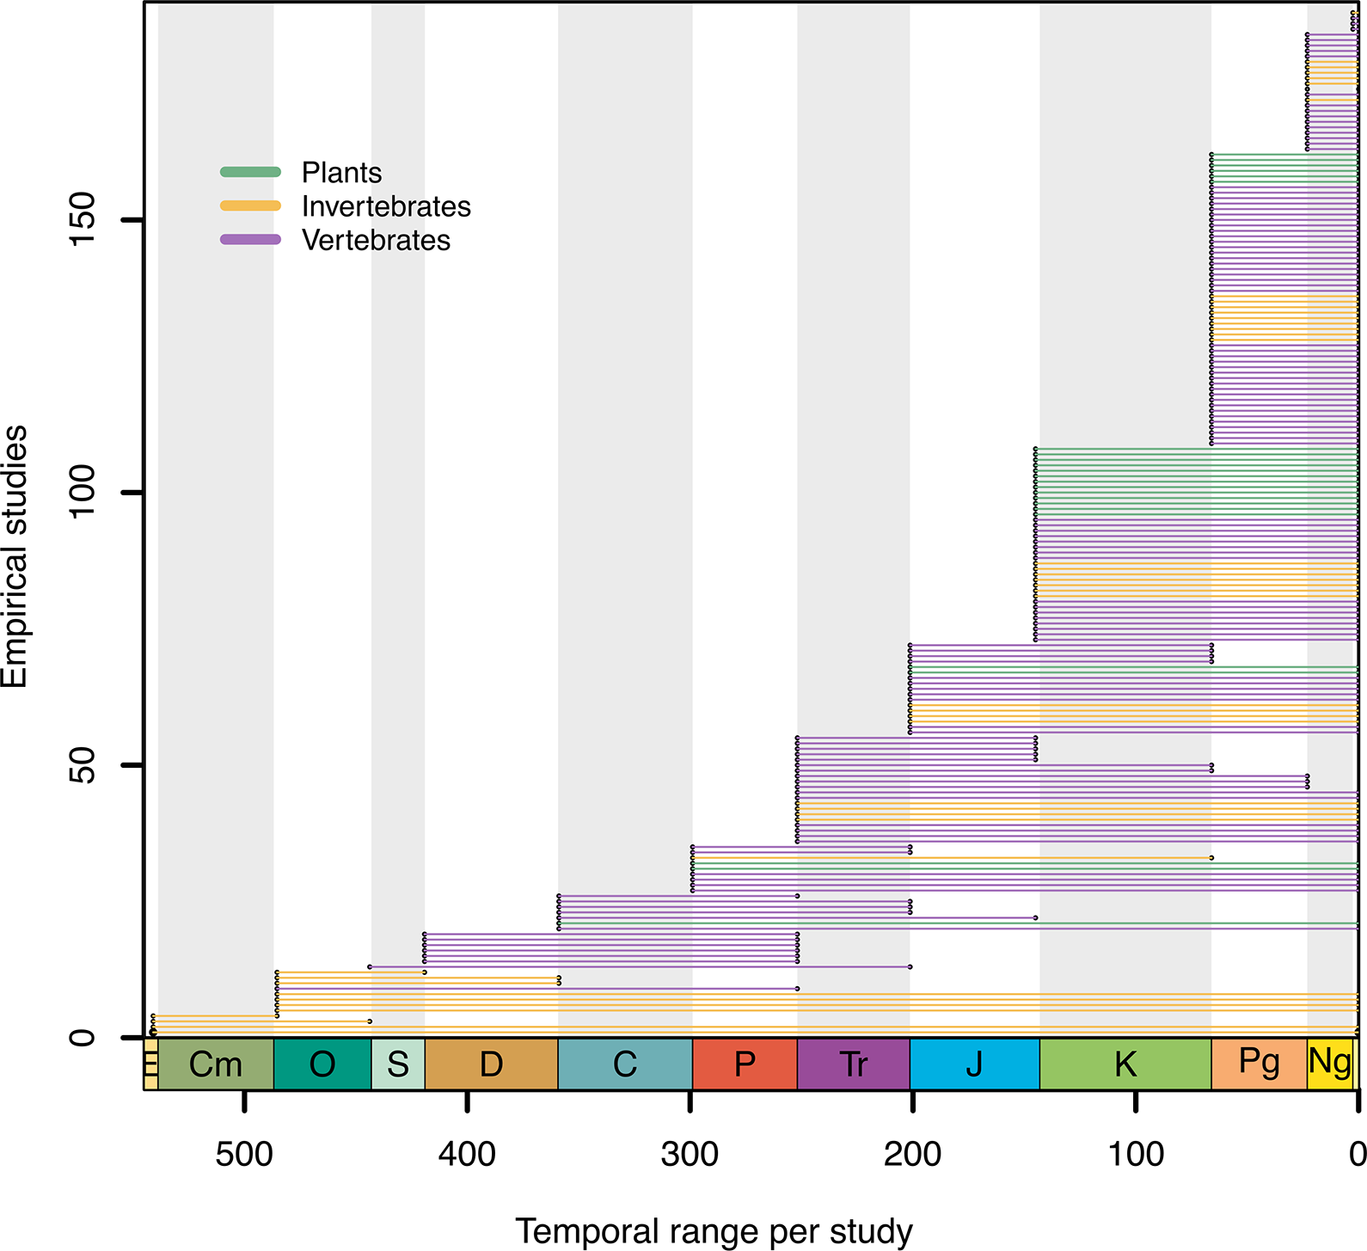
The temporal range, based on the oldest fossil age to the tips of the tree from each of the empirical studies in the literature survey. Timeline plotted using R package divDyn Kocsis Reference Kocsis, Reddin, Alroy and Kiessling2019. CM, Cambrian; O, Ordovician; S, Silurian; D, Devonian; C, Carboniferous; P, Permian; Tr, Triassic; J, Jurassic; K, Cretaceous; Pg, Paleogene; Ng, Neogene.
We found that FBD models have been most frequently used on datasets of vertebrates, with 135 empirical analyses carried out, while invertebrates and plants were the focus of 45 and 27 studies, respectively. Datasets range in size, with a mean of 74 extant and 60 extinct samples. FBD models can be applied to fossils with or without morphological characters; across all studies, 117 used morphological data, with an average of 246 characters. Our survey shows that a wide range of dataset sizes have successfully been analyzed using FBD models and that these models are extremely flexible in terms of the number of taxa and/or characters used. We split the analysis type into five categories, based on the type of phylogenetic character data used (for more details, see Section The Data, Table 1).
Figure 2 shows the temporal range of the empirical analyses applying the FBD model. Only 20% of the studies used data from the Paleozoic, suggesting that the challenges involved in applying the FBD may increase with clade age and/or may be due to the limited availability of phylogenetic datasets further back in time. The time-calibrated trees inferred in FBD analyses are often used in secondary analyses such as biogeographic inference (Areces-Berazain and Ackerman Reference Areces-Berazain and Ackerman2016; Xiang et al. Reference Xiang, Xiang, Ortiz, Jabbour and Wang2019; Thomas et al. Reference Thomas, Tennyson, Scofield, Heath, Pett and Ksepka2020), ancestral-state estimation (Fleming et al. Reference Fleming, Kristensen, Sørensen, Park, Arakawa, Blaxter and Rebecchi2018; Farina et al. Reference Farina, Godoy, Benson, Langer and Ferreira2023; Jiang et al. Reference Jiang, He, Elsler, Wang, Keating, Song, Kearns and Benton2023; Wolfe et al. Reference Wolfe, Ballou, Luque, Watson-Zink, Ahyong, Barido-Sottani and Chan2023), or other phylogenetic comparative methods (Slater et al. Reference Slater, Goldbogen and Pyenson2017; Song et al. Reference Song, Fragnière, Meng, Li, Bétrisey, Corrales and Manchester2020; Dunne et al. Reference Dunne, Farnsworth, Benson, Godoy, Greene, Valdes, Lunt and Butler2023). BEAST2 (Drummond et al. Reference Drummond, Ho, Phillips and Rambaut2006) is the most popular software for these analyses (109 studies), followed by MrBayes (Ronquist et al. Reference Ronquist, Teslenko, Van Der Mark, Ayres, Darling, Höhna, Larget, Liu, Suchard and Huelsenbeck2012b) (93), and RevBayes (Höhna et al. Reference Höhna, Landis, Heath, Boussau, Lartillot, Moore, Huelsenbeck and Ronquist2016) (10).
Collating past applications of the FBD model allowed us not only to explore its use but also to pinpoint potential sources of difficulty regarding how the models are applied in practice. A major challenge in its application appears to stem from how temporal information, that is, fossil ages, relate to the assumptions of the FBD model. This was determined by the way in which these data are described in papers, often providing a lack of information or justification regarding the use of specific fossils, or whether temporal intervals referred to stratigraphic ranges or fossil age uncertainty. Presenting well-justified fossil age information is important for any fossil-based approach to divergence time estimation (Parham et al. Reference Parham, Donoghue, Bell, Calway, Head, Holroyd and Inoue2012).
Reporting of the temporal data used and other information has important consequences for the interpretation of results and reproducibility of phylogenetic analyses (DeBiasse and Ryan Reference DeBiasse and Ryan2019; Drummond et al. Reference Drummond, Chen, Mendes and Xie2023; Jenkins et al. Reference Jenkins, Beckerman, Bellard, Benítez-López, Ellison, Foote and Hufton2023). There are many decisions to be made in any phylogenetic analysis, and each is important; these decisions, therefore, should be reported in a paper to ensure reproducibility. In our literature survey, it was often not possible to fully interpret which data were included and how they were used in an analysis. We appreciate that in many cases the estimation of a time-calibrated tree was a step in a larger analytical workflow that includes further analyses such as those mentioned earlier. Yet ensuring the analysis is fully and correctly described is essential for the reader to interpret and assess the reliability of the results. Many phylogenetic software are run using configuration files, and providing these files in data supplements is a simple and significant way of improving transparency and reproducibility.
Bayesian Framework
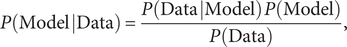
Bayesian statistical inference seeks to estimate the posterior probability of a model conditioned on observed data (for more background on Bayesian phylogenetics, see Huelsenbeck et al. Reference Huelsenbeck, Ronquist, Nielsen and Bollback2001; Alfaro and Holder Reference Alfaro and Holder2006; Yang Reference Yang2014; Nascimento et al. Reference Nascimento, Reis and Yang2017; Warnock and Wright Reference Warnock and Wright2020). The posterior probability is an expression of the researcher’s degree of belief in the model, and incorporates both prior knowledge and the information contributed by the data. The foundation of Bayesian statistics is Bayes theorem, which defines the posterior probability of a model conditioned on observed data as
 $$ P\left(\mathrm{Model}\;\right|\mathrm{Data}\Big)=\frac{P\left(\mathrm{Data}\;\right|\mathrm{Model}\Big)\;P\left(\mathrm{Model}\right)}{P\left(\mathrm{Data}\right)}, $$
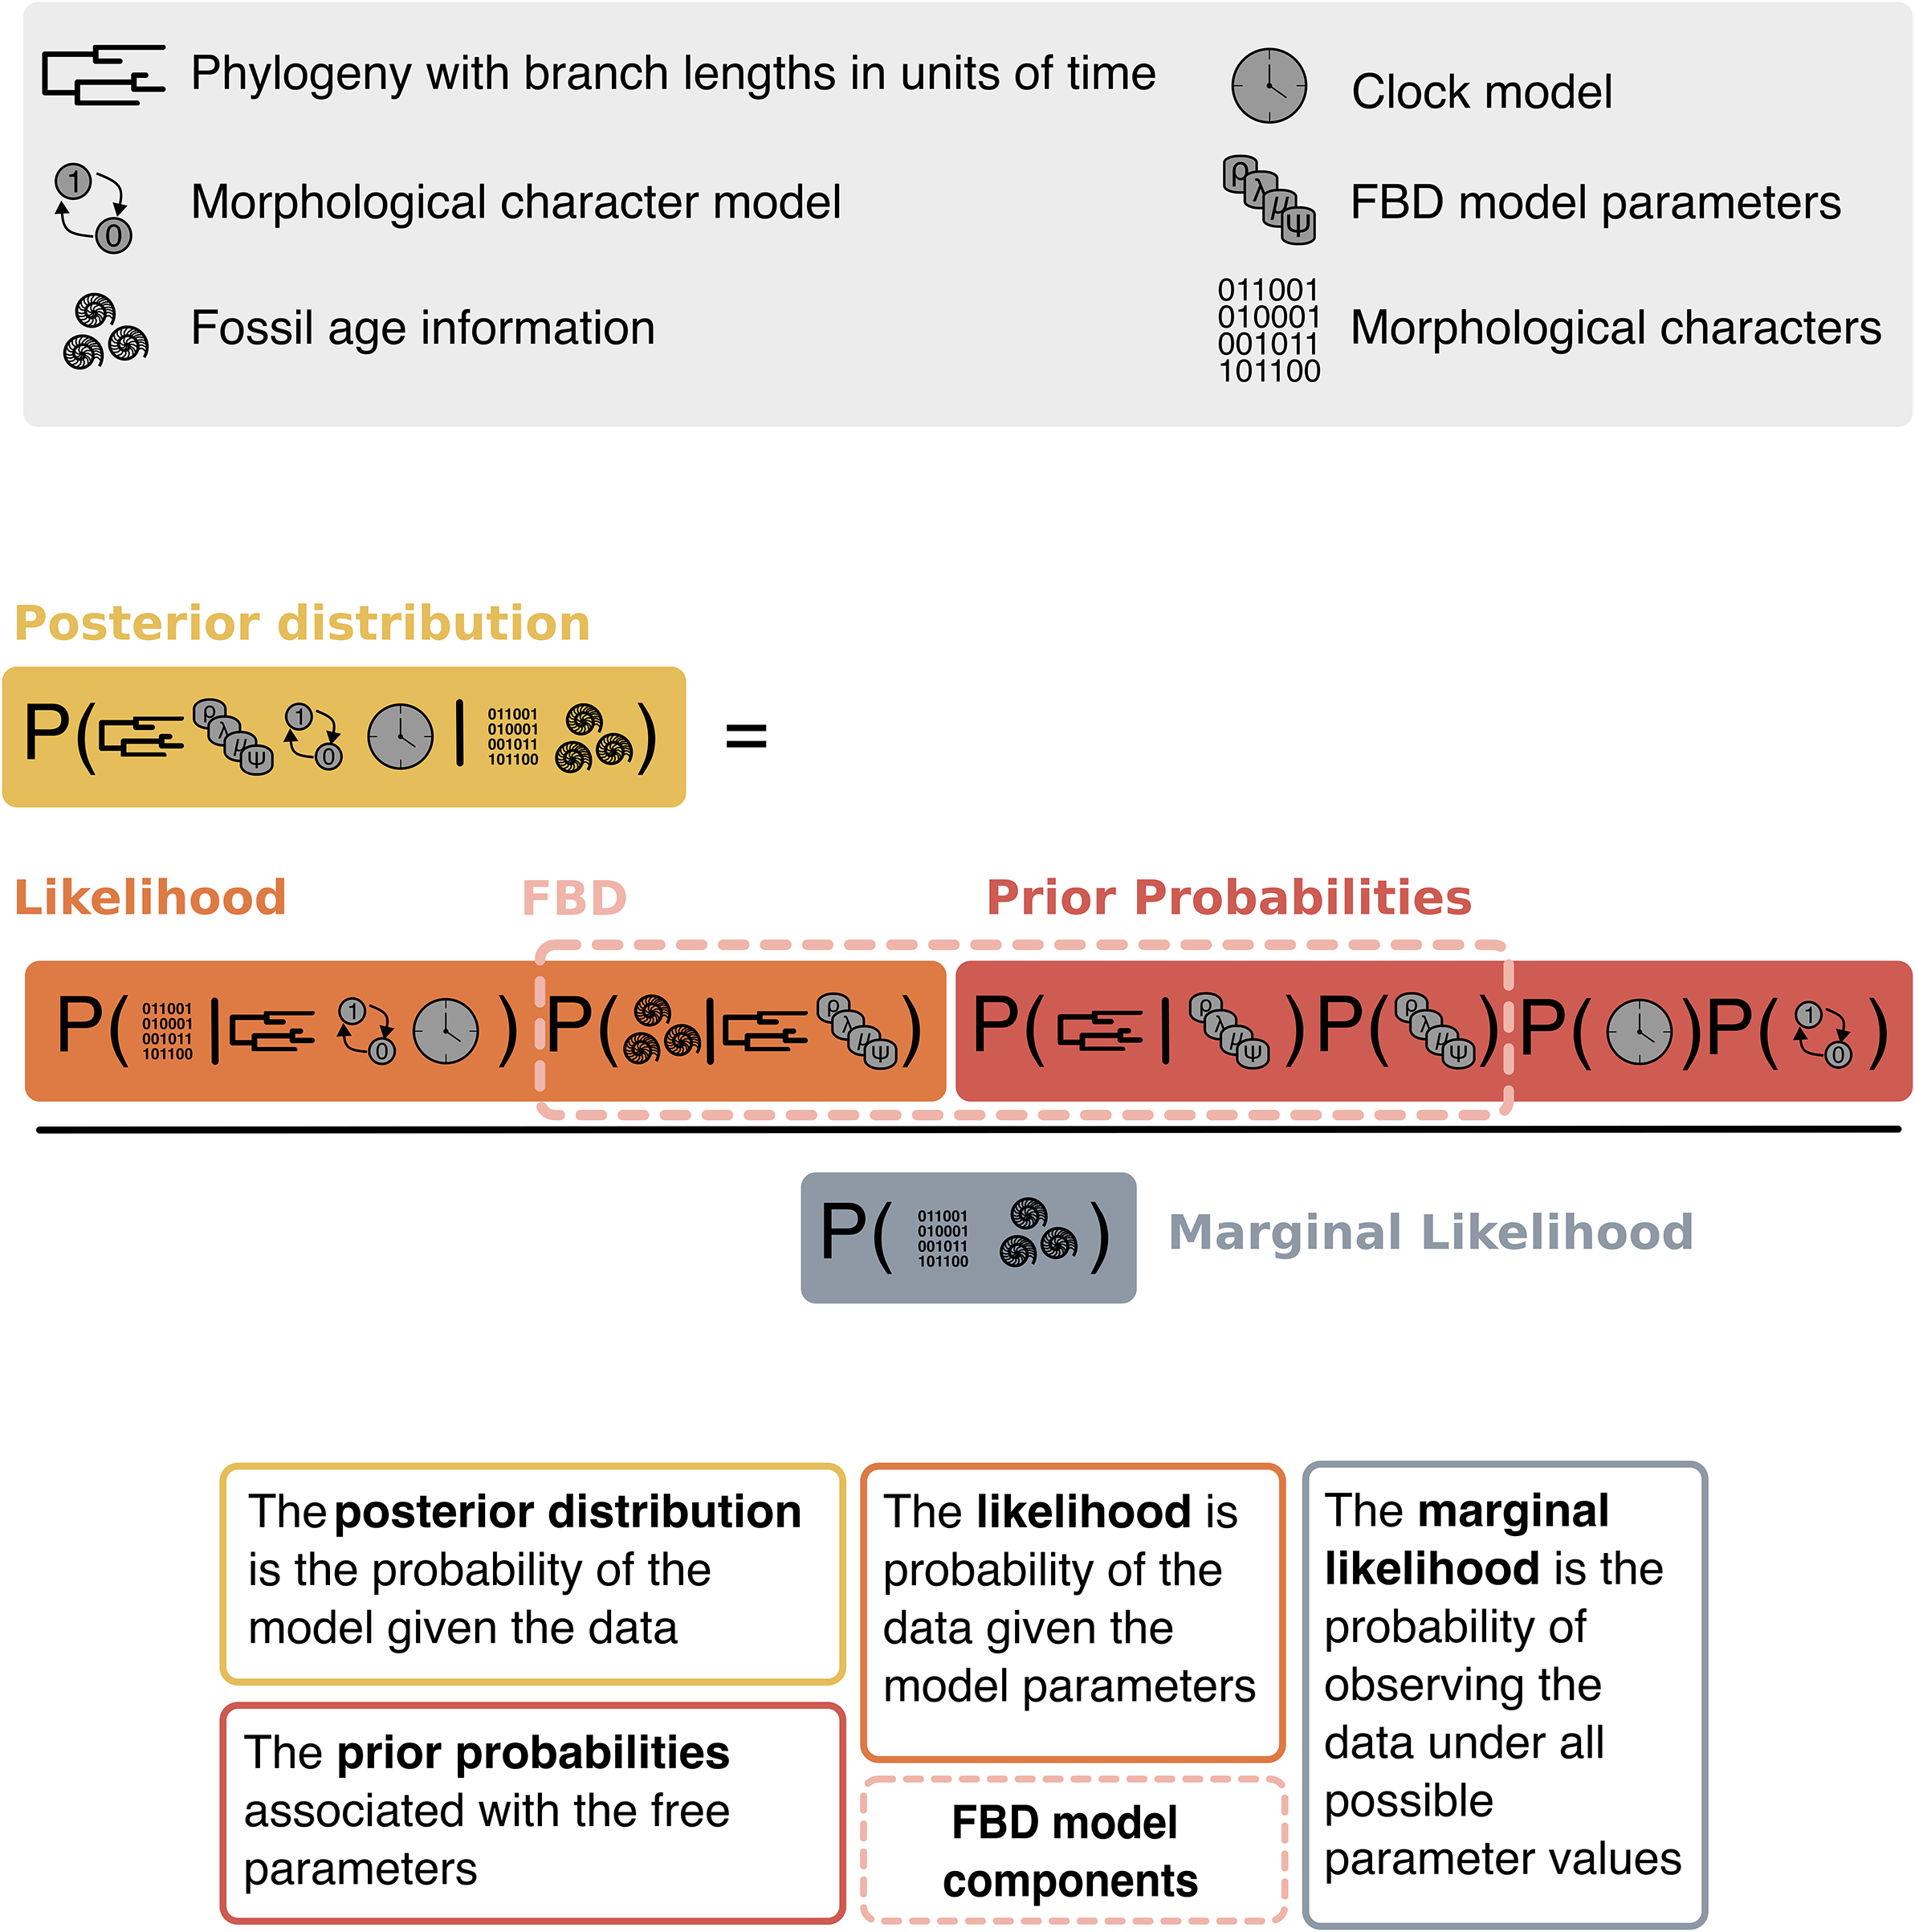
where P(Model | Data) is the posterior probability of the model given the data, the information in the data appears in the likelihood P(Data | Model), a priori information is defined in the prior probability of the model P(Model), and the normalizing constant P(Data) is the marginal probability of the data. Figure 3 illustrates a phylogenetic application of Bayes theorem using character data and fossil occurrence times. Here, we are interested in estimating the joint posterior probability of the phylogeny and divergence times for a set of samples (fossil and extant), the diversification and sampling rates of the FBD process, the parameters of the character substitution model, and the lineage-specific substitution rates (the clock model parameters). Each component of our hierarchical Bayesian model includes parameters for which the values are not known (also called free or stochastic parameters) and will be estimated (e.g., extinction rate). The outcome of an analysis will yield posterior distributions for each of the free parameters and thus will quantify the statistical uncertainty conditional on all other model components and the data. We will use Bayes theorem (eq. 1, Fig. 3) to organize our exploration of the components of a Bayesian statistical analysis, and then we will elaborate on the models specific to phylogenetic inference using data from the fossil record in Section The Models.
Symbolic representation of Bayes theorem (eq. 1) for a phylogenetic analysis of fossil ages and morphological characters. The data components include a morphological character matrix and fossil ages. The model parameters are a phylogeny with branch times, the diversification and sampling parameters of the fossilized birth–death (FBD) model, the lineage-specific branch rates of the clock model, and the parameters of the morphological substitution model (Mk model; Lewis Reference Lewis2001). The probabilities are delineated to highlight the joint posterior distribution, likelihood, and prior probability distributions. The FBD probability density includes some components for which we calculate prior probabilities (the tree topology, branch times, and diversification and sampling parameters) and some that are observations in the likelihood (fossil ages). Thus, these are separated to clarify the contributions to the posterior density coming from the prior and those coming from the data.
The Likelihood
The likelihood represents the probability of the observed data given the model parameters. That is, it is the probability that a particular evolutionary hypotheses (in Fig. 3, a given tree topology and divergence times, rates of the FBD process, substitution model parameters, and clock rates) could have given rise to the observed data (i.e., morphological character states and fossil ages in Fig. 3). This type of hierarchical Bayesian modeling allows us to consider multiple sources of information in a unified framework, accounting for the dependencies and interactions of different data sources under a holistic model. The likelihood is then a product of the individual likelihoods associated with the different data types. For every set of observations in our model, the information coming from these data will be combined with the information from our prior knowledge in the calculation of the posterior.
The Prior
A prior probability is a mathematical expression that represents our knowledge about the parameters of interest before considering the information in the data. For any unknown variable in our model (e.g., speciation or extinction rate), we define a prior probability distribution to quantify our statistical uncertainty in the value of that parameter, thus allowing us to integrate our existing knowledge (or lack of knowledge) about the model into the inference. While the ability to add prior information to an analysis is a major strength of Bayesian phylogenetics, transforming biological knowledge into a mathematical expression can be daunting in practice. Priors can be chosen by taking into account information from previous studies or relying on theoretical knowledge regarding the evolution of the system and properties of model parameters. There are a number of standard or default probability distributions used as priors in Bayesian phylogenetics. For example, exponential distributions are frequently applied as priors to speciation or extinction rates. By assuming that a parameter is drawn from an exponential distribution, we assign higher probability density to smaller values and lower density to larger values, such that we expect a priori that speciation and extinction rates will generally be small. Note that for the sake of clarity in Figure 3, we show the prior probabilities for the FBD rate parameters as a single joint prior, P(λ, μ, ψ, ρ), but typically, we assume independent generating models for each parameter. For example, we may have different exponential priors on each of the three rates and fix the extant sampling probability to an approximate value based on our knowledge of the current extant diversity (e.g., Barido-Sottani et al. Reference Barido-Sottani, Justison, Wright, Warnock, Pett, Heath, Scornavacca, Delsuc and Galtier2020a).
There are numerous papers offering discussions on the importance of judiciousness in prior specification (e.g., Holder and Lewis Reference Holder and Lewis2003; Lemmon and Moriarty Reference Lemmon and Moriarty2004; Alfaro and Holder Reference Alfaro and Holder2006), strategies for constructing hierarchical Bayesian models for phylogenetics and selecting priors (e.g., Wang and Yang Reference Wang, Yang, Chen, Kuo and Lewis2014; Nascimento et al. Reference Nascimento, Reis and Yang2017; Bromham et al. Reference Bromham, Duchêne, Hua, Ritchie, Duchêne and Ho2018), and assessments of the impact of model violations and misspecified priors on posterior estimates (e.g., Zwickl and Holder Reference Zwickl and Holder2004; Ritchie et al. Reference Ritchie, Lo and Ho2017; Möller et al. Reference Möller, du Plessis and Stadler2018; Yang and Zhu Reference Yang and Zhu2018; Sarver et al. Reference Sarver, Pennell, Brown, Keeble, Hardwick, Sullivan and Harmon2019). While a detailed exploration of these topics is beyond the scope of this paper, we hope to emphasize the important role that priors play in Bayesian phylogenetic inference. Thus, it is critical that researchers applying these methods understand the models they select as priors and their assumptions and behaviors. Many of the software tools for Bayesian phylogenetic inference provide detailed documentation and tutorials on the available priors (e.g., Barido-Sottani et al. Reference Barido-Sottani, Bošková, du Plessis, Kühnert, Magnus, Mitov and Müller2018, Reference Barido-Sottani, Justison, Wright, Warnock, Pett, Heath, Scornavacca, Delsuc and Galtier2020a), and while there is no “one-size-fits-all” set of priors for a Bayesian phylogenetic analysis, these resources provide intuition for the various choices that must be made and can guide users in translating their own prior knowledge into probabilistic models. With this knowledge, researchers can then provide sufficient justification for their priors and assumptions when reporting their methods and results (Gelman Reference Gelman2012).
The Marginal Likelihood
The marginal likelihood is the probability of observing the data given the model, averaged over all possible values of the model parameters (Oaks et al. Reference Oaks, Cobb, Minin and Leaché2019). This quantity acts as a normalizing constant and is very difficult (and often intractable) to calculate, as it involves integrating over every possible value in a complex and hyperdimensional parameter space. Sampling algorithms offer a way to circumvent directly calculating marginal likelihoods. In Bayesian phylogenetics, Markov chain Monte Carlo (MCMC) algorithms, especially the Metropolis-Hastings algorithm (Metropolis et al. Reference Metropolis, Rosenbluth, Rosenbluth, Teller and Teller1953; Hastings Reference Hastings1970), are the most common methods for approximating the posterior distribution of a hierarchical model. MCMC uses simulation to sample parameter values in proportion to their posterior probability, and in the evaluation of simulated parameter draws, the marginal likelihoods cancel out (for an explanation, see Nascimento et al. [Reference Nascimento, Reis and Yang2017] or Section Inference using MCMC). While the marginal likelihoods are not computed during inference, there are other cases when we would want to use these quantities.
Because the marginal likelihood is a measure of the fit of a model to a given set of observations (averaged over all model parameter values), they are important in Bayesian methods for model comparison (Oaks et al. Reference Oaks, Cobb, Minin and Leaché2019). Bayes factors are a way to evaluate the relative fit between two models for a given dataset. We can compute the Bayes factor for two models, M 0 and M 1, as the ratio of the marginal likelihoods of the data for each model:
 $$ BF\left({M}_0,{M}_1\right)=\frac{P\left( data\;\right|{M}_o\Big)}{P\left( data\;\right|{M}_1\Big)}, $$
where BF(M 0, M 1) < 1 corresponds to support for M 1 and BF(M 0, M 1) > 1 indicates support for M 0 (Jeffreys Reference Jeffreys1961; Kass and Raftery Reference Kass and Raftery1995). There are several approaches for estimating marginal likelihoods that range in their degree of computational intensity and accuracy (Oaks et al. Reference Oaks, Cobb, Minin and Leaché2019; Fourment et al. Reference Fourment, Magee, Whidden, Bilge, Matsen and Minin2020). In particular, path sampling (Lartillot and Philippe Reference Lartillot and Philippe2006) and stepping stone sampling (Xie et al. Reference Xie, Lewis, Fan, Kuo and Chen2011) have been shown to be accurate when comparing clock models (Baele et al. Reference Baele, Li, Drummond, Suchard and Lemey2012) or substitution models for molecular data (Fourment et al. Reference Fourment, Magee, Whidden, Bilge, Matsen and Minin2020). However, using Bayes factors to choose between morphological models has been shown to be unreliable when comparing different partitioning schemes (Mulvey et al. Reference Mulvey, May, Brown, Höhna, Wright and Warnock2024).
It is also very difficult to estimate marginal likelihoods to compare tree models (e.g., two different FBD models). Because the FBD model probability contains both likelihood elements and prior probability elements (Fig. 3), the marginal likelihoods are not easily estimated (May and Rothfels Reference May and Rothfels2023). Methods of estimating marginal likelihoods also take abundant time and computational resources to run. Therefore, quantitative model comparison is not always viable; however, in this case, it is critically important that models are chosen carefully with justifiable rationale.
The Posterior
For any given set of values for the parameters in the model, the posterior is the joint probability density of those values conditioned on the observed data. A typical Bayesian analysis will use algorithmic approaches for approximating the posterior (such as MCMC, as explored in Section Inference using MCMC). These methods return a series of samples for every free parameter. With an MCMC sample, one can then examine the marginal posterior for each free parameter. For instance, a summarization of the marginal posterior density for the speciation rate shows the posterior probability density for speciation rate values while averaging over all other parameter values (e.g., the extinction rate, tree topology, node ages). This provides an intuitive way to quantify the uncertainty associated with each of our parameters. If the variance of the posterior density for the speciation rate is extremely large or matches the prior, there may not have been a strong signal in the data supporting any particular range of values. See Section Assessing and Interpreting the Output for more information.
Inference Using MCMC
When we use Bayesian inference and MCMC to estimate the posterior probability of our phylogenetic model given observed data, our analysis generates a series of sampled values for every free parameter defined in our model. The algorithm essentially performs a random walk over parameter space by proposing new values for each stochastic parameter (i.e., every parameter that is assigned a prior distribution) and accepting or rejecting those values in proportion to their posterior probability (Metropolis et al. Reference Metropolis, Rosenbluth, Rosenbluth, Teller and Teller1953; Hastings Reference Hastings1970). We will not go into all the details about the workings of MCMC in a Bayesian phylogenetic analysis, as this information is readily available in the literature (for overviews, see Huelsenbeck et al. Reference Huelsenbeck, Larget, Miller and Ronquist2002; Holder and Lewis Reference Holder and Lewis2003; Ronquist et al. Reference Ronquist, van der Mark and Huelsenbeck2009; Yang Reference Yang2014; Nascimento et al. Reference Nascimento, Reis and Yang2017; Barido-Sottani et al. Reference Barido-Sottani, Schwery, Warnock, Zhang and Wright2024). Instead, we will touch on some aspects of MCMC that may be helpful to researchers setting up Bayesian phylogenetic analyses.
Every stochastic variable in the model that is assigned a prior distribution is also associated with one or more MCMC proposal mechanisms that will sample the value of that parameter over the course of the Markov chain. Note that these mechanisms are called “proposals” in MrBayes (Ronquist et al. Reference Ronquist, Teslenko, Van Der Mark, Ayres, Darling, Höhna, Larget, Liu, Suchard and Huelsenbeck2012b), “moves” in RevBayes (Höhna et al. Reference Höhna, Landis, Heath, Boussau, Lartillot, Moore, Huelsenbeck and Ronquist2016), and “operators” in BEAST1 (Suchard et al. Reference Suchard, Lemey, Baele, Ayres, Drummond and Rambaut2018) and BEAST2 (Bouckaert et al. Reference Bouckaert, Vaughan, Barido-Sottani, Duchêne, Fourment, Gavryushkina and Heled2019). Every MCMC move is assigned a “weight” that determines the frequency with which that particular move will be made over the course of the run. For example, if the model has four stochastic parameters that are each operated on by a single move with a weight of 1.0, and the total number of moves is set to 1000, then the MCMC will perform each move 250 times, on average. However, if three of the moves are assigned a weight of 1.0 and one has a weight of 2.0, then after 1000 moves, the higher-weight parameter will be sampled approximately 400 times and each of the others will be sampled 200 times, on average. The move weights are important for ensuring that your analysis will sample your parameters of interest frequently enough to obtain a sufficient sample. Moreover, there may be parameters in our model that we simply wish to integrate over to account for uncertainty, but we do not intend to study or report. These are often referred to as “nuisance” parameters. For example, in most phylogenetic analyses, researchers may not report the estimates for the state frequencies or substitution rates of their character-evolution model. Additionally, character data are often very informative for these parameters. Thus, when assigning weights to the MCMC, we may not need to sample these parameters as frequently as others.
Some parts of a phylogenetic model are very complex and require multiple types of moves to effectively sample the posterior distribution. This is particularly true for the tree topology and branch times. To explore this complex parameter space, one may assign multiple different moves that may have higher or lower variance in the values they propose. For example, to sample the tree topology (Lakner et al. Reference Lakner, Van Der Mark, Huelsenbeck, Larget and Ronquist2008), we may choose a move that proposes a new state by moving one branch to a neighboring branch (i.e., a nearest-neighbor interchange move) and combine this with a move that makes larger changes like moving a subtree to a more distant branch (i.e., the subtree pruning and regrafting move). By combining local and global tree topology moves, we can allow the Markov chain to reach different parts of parameter space while also sampling the high-probability regions more exhaustively.
Any Bayesian software will require the user to specify a stopping criterion for the Markov chain. Typically, this is done by setting the number of iterations the MCMC will perform. It is important to note, however, that different Bayesian phylogenetics programs have different default definitions of an MCMC “iteration” (these may also be called “generations,” “replicates,” or “steps”). In BEAST2 (Bouckaert et al. Reference Bouckaert, Vaughan, Barido-Sottani, Duchêne, Fourment, Gavryushkina and Heled2019) and MrBayes (Ronquist et al. Reference Ronquist, Teslenko, Van Der Mark, Ayres, Darling, Höhna, Larget, Liu, Suchard and Huelsenbeck2012b), a single MCMC iteration performs one move, thus requiring the user to set the chain length accordingly. For very complex models with a large number of parameters and moves, the chain length should be longer than for a simpler model. For instance, analyzing a tree with 20 taxa corresponds to 19 internal node ages (including the root) that must be sampled. Often each internal node age is associated with a proposal that slides the node age up or down. If considering a single move per iteration, the total number of moves must be increased if you consider a larger tree (a tree with 50 taxa has 49 internal node ages) and wish for the same average number of proposals per node. RevBayes (Höhna et al. Reference Höhna, Landis, Heath, Boussau, Lartillot, Moore, Huelsenbeck and Ronquist2016), on the other hand, takes all of the moves and adds up their weights to determine the number of moves performed within a single MCMC iteration. If you specify 10 moves with weight 1.0 and 10 moves with weight 2.0, a single iteration will perform 30 moves, and each new proposal that is executed is drawn from the list of moves in proportion to its weight. With this approach, to achieve a desired number of moves per parameter, the user will specify a chain length with fewer “iterations” than if they perform a single move at each step. Ultimately, no matter how this is handled, one should carefully consider the total number of moves and recognize that thousands of proposals may be required to obtain a sufficient sample from the posterior distribution for a given parameter.
Understanding the behavior of MCMC for different parameters and how proposals are implemented in phylogenetic software is helpful for diagnosing issues and ensuring that your results are sensible. The nuances of MCMC that we have touched on also go hand in hand with protocols for processing and summarizing the output of your Bayesian phylogenetic analysis (see Section Assessing and Interpreting the Output). If you are new to these methods, we highly recommend reviewing the introductory tutorials and documentation for available software to learn the specifics of the MCMC algorithms used (see Box 1).
The Data
In a Bayesian framework, phylogenetic inference with an FBD model allows us to incorporate different types of data. These can include temporal information (fossil ages), morphological data, and/or molecular data. In Figure 3, we include fossil ages and morphology in our representation of Bayes theorem. The data are the only component that we can directly observe. In this section, we describe the paleobiological data available for phylogenetic analyses, along with important aspects of their implications for analyses.
Character Data
Molecular Data
Recent advances in DNA-sequencing technologies have reduced many barriers to generating high-quality molecular data for taxa spanning the tree of life. Typically, molecular phylogenetic datasets are aligned nucleotide sequences of homologous regions of the genome. Nucleotides across the genome share biochemical and physiochemical properties, which have subsequently informed an array of generalizable substitution models (Liò and Goldman Reference Liò and Goldman1998; Arenas Reference Arenas2015). Proteins are also sources of molecular data for phylogenetic analysis, particularly for studies examining distantly related species or groups (e.g., Williams et al. Reference Williams, Cox, Foster, Szöllosi and Embley2020). These molecular datasets constitute alignments comprising linear sequences of amino acids that form homologous proteins. Similar to nucleotide models, several amino acid substitution models have been introduced based on detailed study of protein structure and function (Blanquart and Lartillot Reference Blanquart and Lartillot2008; Huelsenbeck et al. Reference Huelsenbeck, Joyce, Lakner and Ronquist2008; Trivedi and Nagarajaram Reference Trivedi and Nagarajaram2020). It is important to note that there are a number of different approaches for aligning molecular sequences; see Stadler et al. (Reference Stadler, Magnus, Vaughan, Barido-Sottani, Bošková, Huisman and Pečerska2024) for an in-depth review of available methods.
Molecular data can be extracted from the tissues and cells of living organisms or preserved specimens housed within natural history museums, and an enormous trove of archived data is available in widely used public databases (e.g., NCBI; Sayers et al. Reference Sayers, Bolton, Brister, Canese, Chan, Comeau and Connor2022). While the vast majority of molecular data are observations of extant and recently extinct species, scientific and technological advances have enabled integration of fossil taxa in molecular sequence alignments (Dalén et al. Reference Dalén, Heintzman, Kapp and Shapiro2023). However, the degradation of DNA molecules limits paleogenomic sequencing to short fragments from well-preserved specimens that lived within the last 1 Myr (though the oldest sequenced specimen is ∼2 Myr old; Kjær et al. Reference Kjær, Pedersen, De Sanctis, De Cahsan, Korneliussen, Michelsen and Sand2022). For molecular data from much older fossils, researchers can turn to paleoproteomics techniques, which allow paleontologists to elucidate amino acid sequences from ancient fossilized proteins as old as 80 Myr (Schweitzer et al. Reference Schweitzer, Zheng, Organ, Avci, Suo, Freimark and Lebleu2009). While proteins have the potential to illuminate the evolutionary history of many of the dark branches on the tree of life, protein analysis of fossil material is labor-intensive, expensive, and destructive (Schroeter et al. Reference Schroeter, Cleland and Schweitzer2021). Moreover, the DNA fragments and proteins accessible to paleogenomic and paleoproteomics studies will always be specific to certain tissue types and preservation conditions and influenced by all of the factors that structure the fossil record. Thus, the lion’s share of molecular data used in phylogenetic analyses will be sampled from modern taxa, and the evolutionary history of most ancient fossil specimens will be analyzed using matrices of morphological characters.
Morphological Data
Morphological data are highly valuable for phylogenetic inference, as, unlike DNA sequences, morphological characters are available for a wider range of long-extinct and extant taxa (Lee and Palci Reference Lee and Palci2015). However, compiling morphological data from fossils and/or extant taxa is an extremely labor-intensive task, which requires a thorough understanding of the morphology and taxonomy of the clade. First, phenotypic traits must be selected that describe an appropriate amount of variation in taxa across the clade (Sereno Reference Sereno2007). These traits must then be manually coded or measured for each taxon, using software such as Mesquite (Maddison and Maddison Reference Maddison and Maddison2023) or MorphoBank (O’Leary and Kaufman Reference O’Leary and Kaufman2011) to construct the matrix. This process requires access to adequately preserved specimens, which could involve visiting museum collections or sourcing morphological images, computed tomographic data, or descriptions from the literature. The coding scheme may require revision as additional taxa are included. Fragmentary fossil preservation as a result of taphonomic processes can present a major barrier to coding morphological characters and can result in characters being coded using multiple individual specimens believed to belong to the same operational taxonomic unit. Higher levels of matrix incompleteness are expected for morphological characters compared with genetic data (O’Reilly and Donoghue Reference O’Reilly and Donoghue2021).
Morphological data for phylogenetics can be either discrete or continuous. Discrete data may represent, for instance, whether a trait is present or absent, while continuous data are typically used for traits such as body size or the length of specific anatomical features. Different data types require different evolutionary models, so often only one data type is used, and typically these are discrete morphological data. Continuous traits are sometimes discretized in order to be included in such analyses. Here we focus on models of discrete character evolution, although continuous models are growing in popularity and have recently become available for use in FBD analyses (Zhang et al. Reference Zhang, Drummond and Mendes2024; see also Parins-Fukuchi Reference Parins-Fukuchi2017; Alvarez-Carretero et al. Reference Alvarez-Carretero, Goswami, Yang and dos Reis2019).
In a discrete morphological matrix, characters can be binary or multistate, depending on the trait described. Binary characters exhibit only two states, such as presence or absence of a trait, while multistate characters can assume multiple states, allowing for greater variation and complexity in trait expression. Multistate characters are advantageous for capturing a wider range of morphological variation, but they also require more detailed trait description and coding and can be more complex to model accurately in phylogenetic analyses (Wright Reference Wright2019). There are also a number of special characters coded in morphological matrices by taxonomists, which have distinct and specific meanings (Brazeau et al. Reference Brazeau, Guillerme and Smith2019; Hopkins and St. John Reference Hopkins and St. John2021; Simões et al. Reference Simões, Vernygora, de Medeiros and Wright2023b). For example, throughout morphological datasets, it is common to see “?” and “-”, to represent missing and non-applicable characters, respectively. These two types of characters are typically treated in the same way by available software; however, they represent fundamentally different pieces of information. A missing character, “?”, is used when all available specimens of a taxon are too decayed or fragmentary to determine whether it has a certain character trait or not. Non-applicable characters, “-”, are used when the trait is not associated with a taxon. An example of a non-applicable trait may be traits associated with ornamentation. One character trait may be used to represent the presence or absence of ornamentation. Some taxa will have ornamentation, and therefore be coded as 1, while others may have none and be coded with a 0. A second character could then be coded to determine the type of ornamentation. In this case, all taxa that have a 0 for the previously described trait would be coded as non-applicable. There are several strategies for coding such morphological characters (see Hopkins and St. John Reference Hopkins and St. John2021), but it is good practice to be consistent and explicit about the coding strategy (e.g., missing vs. non-applicable characters). Generally, however, contingent coding (where hierarchies of characters are included through the presence and absence of controlling/primary characters) offers the best solution to handling non-applicable characters (Simões et al. Reference Simões, Vernygora, de Medeiros and Wright2023b).
Given the intensive nature of collating morphological matrices and the incompleteness of preservation, these datasets tend to be quite small relative to molecular datasets. Additionally, the variation in matrix size will be dependent on the number of characters one can reasonably come up with for a given group. For instance, a group of marine invertebrates, like bivalves, may possess fewer obvious anatomical features compared with a group of vertebrates, such as large mammals, that have multiple distinct anatomical regions that can potentially be well preserved. From our survey, we found the number of morphological characters used in FBD analyses was typically greater for vertebrates than invertebrates (Fig. 1B).
Morphological matrices can be published and made available for download in a standardized format on databases such as MorphoBank (O’Leary and Kaufman Reference O’Leary and Kaufman2011) or are often included in the supplementary material associated with a study.
Temporal Data
The temporal information associated with a fossil taxon can fall into one of two categories: (1) occurrence data, where each occurrence is associated with a specific time or interval from which it was sampled; or (2) stratigraphic ranges, which describe the interval between the first and last occurrences of a taxon (see Fig. 4). Understanding the differences between these two data types and how they reflect fossil sampling is extremely important for carrying out an analysis using an FBD model.
The temporal information available from fossils and how it can be incorporated into fossilized birth–death (FBD) models. A, Section with four fossil beds, b1–b4. Within each bed, there are fossils that can be used to provide temporal information for an FBD analysis. In this section, there are two different fossil taxa depicted as purple and black ammonites. Fossil age information can be taken as either occurrence data or stratigraphic range data. Occurrence data describe the age uncertainty associated with an individual sample or a discrete interval (shown to the left of the section). Stratigraphic range data describe the age around multiple fossils of the same taxon. The lower and upper bounds of the range (i.e., the first and last appearances) will also have a degree of age uncertainty around each of them (shown to the right of the section). Different FBD models are available to incorporate these are fundamentally different way of using fossil age information. B, How these different models incorporate the temporal information. The FBD specimen model uses occurrence information. Note that multiple fossil specimens from the same bed that are associated with the same age uncertainty should only be incorporated into the analysis once. FBD models do not currently have a way to account for abundance information. The FBD range model uses stratigraphic range information. In this case, it uses the first and last appearance fossil ages. Note, for the taxon in purple, there is only one fossil (i.e., a singleton); therefore, the occurrence and range information are the same. The gray branches on the tree represent unsampled lineages or taxa.

Fossil occurrences each represent a single point in time corresponding to a known fossil sampling event and, in an FBD model, constitute evidence that the given lineage was extant at that time. Because fossil ages are often imprecise, occurrences are usually sampled from a discrete interval or range of ages. This interval should be informed by prior knowledge of uncertainty of the age of the fossil and often (but does not have to) represents a named geological interval. In this context, an occurrence may represent multiple specimens of the same taxon sampled from a single geological locality and/or time interval, or just a single fossil: FBD models do not currently include a way of incorporating information on abundance data. Having multiple specimens might be common for groups with high preservation potential, such as skeletonizing marine invertebrates or microfossils, while groups such as terrestrial tetrapods that have a much sparser fossil record may be more commonly associated with a single specimen per occurrence. If the same taxon is found in multiple time intervals, multiple occurrence times can be included in an analysis, each associated with its own upper and lower age bounds.
Stratigraphic ranges instead constitute an overview of all available occurrence data for each taxon, describing the age of the first occurrence (often termed “first appearance datum,” or FAD) and the last occurrence (often termed “last appearance datum,” or LAD). In some cases, only first and last occurrences are known, while for others, many occurrences may lie within this range. If a taxon only has one occurrence (known as a singleton), the stratigraphic range is analogous to the age information attached to that single occurrence. Stratigraphic ranges better reflect the age information we have available for many groups in paleobiology. This includes classic datasets, such as Sepkoski’s Reference Sepkoski2002 compendium for marine genera (available via the sepkoski R package; https://sepkoski.palaeoverse.org), as well as datasets for which we have a huge number of occurrences spanning multiple intervals, for example, some groups of Cenozoic mammals.
The original implementation of the FBD model (here referred to as the FBD specimen model) assumes the fossil information constitutes occurrences (Stadler Reference Stadler2010). The FBD specimen model can use all available occurrences (computational limits permitting), but does not incorporate any information about how these occurrences may be associated with each other. The FBD range model instead uses stratigraphic ranges (Stadler et al. Reference Stadler, Gavryushkina, Warnock, Drummond and Heath2018) and explicitly takes into account the sampling of taxa through time, better reflecting the data available for some groups. Figure 4 illustrates the age information used by these different models. Note that the choice to use either occurrence data or stratigraphic ranges will have a strong impact on the sampling rate inferred by the model. If all taxa are represented by singletons, the input will be the same for both models.
Collating the necessary age information from the fossil record, regardless of whether occurrences or stratigraphic ranges are used, can be very involved. Determining the age of a fossil often requires synthesis of information from a combination of different sources (Benton et al. Reference Benton, Donoghue, Asher, Hedges and Kumar2009; Parham et al. Reference Parham, Donoghue, Bell, Calway, Head, Holroyd and Inoue2012; Hopkins et al. Reference Hopkins, Bapst, Simpson and Warnock2018). Under rare circumstances, it may be possible to directly date the bed in which a fossil was found, for example, using isotopic analysis of an ash layer, but this is uncommon. Often a single date will be measured for a stratigraphic section, and the ages of the rest of the stratigraphic column in that section will be inferred based on this age. Alternatively, biostratigraphic correlation can be used. This method relies on identifying index fossils in the same or nearby beds as the fossil of interest. Index fossils are defined as globally abundant, easy to recognize, and associated with a short interval in time, and can therefore be used to determine the relative age of a stratigraphic section. To establish the absolute age of the fossil, we then rely on chronostratigraphy. The global geological timescale allows us to use the index fossils to correlate their occurrences in a section to absolute time (Gradstein et al. Reference Gradstein, Ogg, Schmitz and Ogg2020). The absolute ages have been determined in previous studies, using methods such as radiometric dating or Bayesian stratigraphic age models (Deino et al. Reference Deino, Heil, King, McHenry, Stanistreet, Stollhofen, Njau, Mwankunda, Schick and Toth2021; Halverson et al. Reference Halverson, Shen, Davies and Wu2022; Lee et al. Reference Lee, Rand, Lisiecki, Gebbie and Lawrence2023). Given that a fossil age is inherently reliant on a number of external calibrations that combine information from different sources, the uncertainty around this age is extremely important to consider (Barido Sottani et al. 2019a, 2020b). As such, it is essential to account for the associated uncertainty when defining the minimum and maximum bounds for each of the individual occurrences in the analysis. Similarly, you also need to incorporate the uncertainty around the first and last occurrences when using stratigraphic ranges.
There are different approaches to collecting age information. It may be necessary to compile age information directly from the literature. Descriptions of fossils, particularly type specimens, usually include the stratigraphic context in which the fossil was found. For example, the biozone in which it was found can provide relatively accurate and high-resolution bounds on the fossil’s age. However, if one is working with fossils from different biogeographic regions, biozones may need to be correlated and/or translated directly into numerical ages, which requires expertise and careful consideration to be done appropriately. Alternatively, age information can be obtained from large databases of fossil occurrences, such as the Paleobiology Database (Reference Uhen, Allen, Behboudi, Clapham, Dunne, Hendy, Holroyd, Hopkins, Mannion, Novack-Gottshall, Pimiento and WagnerPBDB; Uhen et al. Reference Uhen, Allen, Behboudi, Clapham, Dunne, Hendy, Holroyd, Hopkins, Mannion, Novack-Gottshall, Pimiento and Wagner2023).
Getting Data from the PBDB
Taking age data from the PBDB requires some understanding of the structure of the database. Comprehensive guidance can be found in the database’s User Guide (Uhen et al. Reference Uhen, Allen, Behboudi, Clapham, Dunne, Hendy, Holroyd, Hopkins, Mannion, Novack-Gottshall, Pimiento and Wagner2023). Age information can be accessed using the PBDB web portal or API (application programming interface), either as individual occurrences or summarized as stratigraphic ranges (first and last occurrences) for each taxon. We recommend downloading full occurrence data, as this is more amenable to vetting than age ranges. Other important factors to consider are whether to include or exclude trace fossils e.g., Simões and Pierce Reference Simões and Pierce2021. The identity of the tracemaker can rarely be established with high taxonomic resolution, but such fossils could still be incorporated as age constraints in an analysis.
Age information is provided in two different sets of columns: “early interval” and “late interval”, and “min ma” and “max ma”. The “early interval” and “late interval” are the named geological intervals provided by the data enterer corresponding to the age range of the occurrence; these might be internationally recognized interval names or regional biozone/formation names. When the age uncertainty of an occurrence spans a single interval, it is named in the “early interval” column, while the “late interval” column is left blank. The “min ma” and “max ma” columns give the numerical ages, in millions of years, corresponding to the full temporal range of the time intervals according to the PBDB’s internal chronostratigraphic scheme. Tools also exist for cleaning and processing these data, such as the R package palaeoverse (Jones et al. Reference Jones, Gearty, Allen, Eichenseer, Dean, Galván and Kouvari2023), which can be used to update interval ages according to more recent chronostratigraphies and to summarize occurrence data into first and last occurrence dates.
All of the fossil occurrences then need to be assigned to a taxonomic lineage. Key information about the identification of each fossil occurrence can be found in the “identified name” and “accepted name” columns. The “identified name” is the identity given to the occurrence in the original reference describing it. This might include some indicator of uncertainty in the identification, such as “cf.” or “?”. Such occurrences should be evaluated carefully before a judgment is made as to whether they should be included in the age information used in a phylogenetic analysis. The “accepted name” is the identity given to the occurrence following processing by the database’s internal taxonomic structure. This reallocates occurrences of e.g., synonyms, and invalid taxa, to provide an updated identification with respect to taxonomic opinions in the recent literature. Usually this column is the one used when placing occurrences onto the phylogeny.
When data from the PBDB are used, it is crucial that the data downloaded are validated by an expert. As with any big database, errors can be introduced to the data in a number of ways. Given that taxonomy and stratigraphy are dynamic fields, the classification of taxa and time intervals can also change over the years, resulting in some taxa being identified or dated incorrectly. Having a taxonomic expert verify the data should be a standard step in any phylogenetic analysis using these data.
Placing Fossils in a Tree
When we analyze paleontological data in a phylogenetic analysis using the FBD model, the placement of fossil observations is either specified a priori or estimated as part of the inference. If we have character data for the fossil, we can directly infer its position in the phylogeny during the analysis. Alternatively, we can rely on taxonomic placement, which does not necessarily require any character data to be available for the fossil, but still allows its age information to be incorporated into the analysis. Because we specify taxonomic affiliation or phylogenetic placement based on prior information, we consider this part of the prior probabilities rather than data in the construction of our Bayesian model (Fig. 3).
Taxonomic placement, or bracketing, can be used to constrain parts of the tree topology (Soul and Friedman Reference Soul and Friedman2015). This can be applied to both extant and extinct samples in the tree, although we will focus on extinct (i.e., fossil) placement here. Fossils (occurrences or ranges) can be fixed within a given clade in the tree, denoted using a node that we are confident represents the common ancestor of the clade to which our fossil belongs. The taxonomic resolution of the fossil will influence its placement in the tree: fossils that can be easily identified might be restricted to a specific genus, however, for other fossils, it may only be possible to assign them to a specific family or order. As this approach does not require fossils to have any associated character data, the placement of a fossil taxon cannot be precisely inferred, and instead we account for the possibility that it could attach anywhere within the clade defined using the taxonomic constraints (Gavryushkina et al. Reference Gavryushkina, Welch, Stadler and Drummond2014; Heath et al. Reference Heath, Huelsenbeck and Stadler2014). Fossils without character data should be pruned from the inferred trees before any downstream interpretation of taxonomic relationships.
Determining phylogenetic relationships among extant species can be difficult, even with molecular data in hand (Bergsten Reference Bergsten2005; Huson and Bryant Reference Huson and Bryant2006; Degnan and Rosenberg Reference Degnan and Rosenberg2009). Establishing the position of extinct taxa is even more challenging, both with other extinct and extant taxa. No fossil is a perfect representation of the living organism: from the time the organism dies, anatomical information is lost through the decay process, in a manner that can bias its placement in phylogenies (Sansom et al. Reference Sansom, Gabbott and Purnell2010; Pattinson et al. Reference Pattinson, Thompson, Piotrowski and Asher2014). Similarly, geological processes such as metamorphosis and erosion can negatively impact the preservation of a fossil. Highly trained taxonomists who know their study group and understand these processes are therefore crucial for establishing taxonomic affiliation and to ensure the correct incorporation of fossils into an analysis. Simulations have demonstrated the importance of well-described anatomical data, showing that without fundamental taxonomic research, even the current “best” available models will produce erroneous results (Barido-Sottani et al. Reference Barido-Sottani, Pohle, De Baets, Murdock and Warnock2023).
Both character and temporal data are informative about the phylogenetic position of fossils (Barido-Sottani et al. Reference Barido-Sottani, Van Tiel, Hopkins, Wright, Stadler and Warnock2020b; Mongiardino Koch et al. Reference Mongiardino Koch, Garwood and Parry2021). However, when character information is available, the position of a fossil in the tree may be more precisely inferred. In this case, samples may be associated with both morphological data and occurrence times, which can be true for fully extinct trees or trees combining extant and fossil observations. Analyses including molecular data for extant tips, alongside morphological data for at least a subset of those taxa, and fossils with morphological and temporal data, are often referred to as total-evidence analyses (Ronquist et al. Reference Ronquist, Klopfstein, Vilhelmsen, Schulmeister, Murray and Rasnitsyn2012a; Zhang et al. Reference Zhang, Stadler, Klopfstein, Heath and Ronquist2016; Gavryushkina et al. Reference Gavryushkina, Heath, Ksepka, Stadler, Welch and Drummond2017; see Box 4). When fossils or extant samples are associated with character data, it is still possible to constrain parts of the tree topology in the case of strong prior knowledge. This may be more computationally efficient, as the analysis searches a smaller region of tree space and can therefore help a Bayesian analysis to converge faster and improve overall accuracy (Barido-Sottani et al. Reference Barido-Sottani, Pohle, De Baets, Murdock and Warnock2023). Table 1 summarizes the different types of data used in applications of the FBD model to date. See Box 2 for a discussion on the use of previously inferred or fixed trees and Box 5 for an example.
The Models
The FBD Process
Stadler (Reference Stadler2010) was the first to present a stochastic model of cladogenesis that also accounted for sampling lineages through time. This serially sampled constant-rate birth–death model was called the “fossilized birth–death process” by Heath et al. (Reference Heath, Huelsenbeck and Stadler2014) to denote applications of the model in macroevolutionary analyses including fossil taxa. The FBD model is an extension of the birth–death processes that are important models for describing the diversification of a set of contemporaneous (extant) taxa (Yule Reference Yule1924; Kendall Reference Kendall1948; Thompson Reference Thompson1975; Raup Reference Raup1985; Nee et al. Reference Nee, May and Harvey1994; Patzkowsky Reference Patzkowsky1995; Yang and Rannala Reference Yang and Rannala1997; Gernhard Reference Gernhard2008; Stadler Reference Stadler2009). Birth–death models also play an important role in quantitative paleobiology. For example, these models underpin the theory behind the boundary-crosser rate estimators (Foote Reference Foote2000) and the software PyRate (Silvestro et al. Reference Silvestro, Schnitzler, Liow, Antonelli and Salamin2014, Reference Silvestro, Salamin, Antonelli and Meyer2019), both used to estimate origination and extinction rates.
The FBD process is a mechanistic model that combines diversification and sampling processes, such that the parameters have both a biological and geological interpretation (Stadler Reference Stadler2010; Heath et al. Reference Heath, Huelsenbeck and Stadler2014). The model generates rooted phylogenies with branch lengths proportional to time and a set of sampled fossil and extant lineages. It is modulated by five parameters: origination (or speciation) rate λ, extinction rate μ, fossil sampling rate ψ, extant sampling probability ρ, and the origin time of the process t origin. In this section, we describe the process of simulation under the FBD model to provide a more intuitive explanation for the model’s assumptions and behavior.
When we simulate a tree forward in time, the process starts with a single lineage. This lineage can then speciate or go extinct according to rates λ and μ, respectively. Lineages can also be sampled at any instance according to rate ψ. An origination event assumes budding speciation and results in a single new lineage, which will then be associated with its own FBD process, that is, it can speciate, go extinct, or be sampled, independent of other lineages. The simulation can continue until a given duration of time or a given number of coexisting (extant) lineages is reached (Hartmann et al. Reference Hartmann, Wong and Stadler2010). The lineages extant at the end of the process (t = 0) can be assumed to represent living species and be sampled with probability ρ. The time between the start and end of the simulation is equivalent to the origin time, t = t origin. The origin represents the beginning of the process, before any other events (speciation, extinction, or sampling) have occurred and is therefore older than the root age of the tree. At the end of this simulation process, the generated complete (true) tree contains all of the samples associated with the simulated lineages. Some internal branches will have fossil sampling events along them, and some extant tips will have associated sampling events (if 0 < ρ < 1). Not all extinct branches will necessarily have fossil sampling events associated with them. To obtain the reconstructed tree—that is, the tree that can be inferred using the observable set of samples—we prune all unobserved lineages from the complete tree (see Stadler Reference Stadler2010; Fig. 1). The reconstructed tree only includes tips that are associated with fossil or extant sampling events. For any dataset generated by the FBD model where ψ > 0, there is a nonzero probability that some fossil samples will also have sampled descendants (Foote Reference Foote1996). The proportion of these “sampled ancestors” increases with higher values of ψ and ρ (Pett and Heath Reference Pett and Heath2020). Additionally, as extinction rates decrease relative to speciation rates, sampled ancestors become more prevalent. When we apply the FBD model to empirical data, we will estimate the reconstructed tree, including the placement of fossils as sampled ancestors. Because we cannot observe unsampled lineages, we also cannot estimate the complete tree. Forward simulation has played an important role in the development of FBD models, providing the necessary tools for examining the accuracy of Bayesian phylogenetic methods and helping to characterize model behavior and assumptions (FossilSim [Barido-Sottani et al. Reference Barido-Sottani, Pett, O’Reilly and Warnock2019b] and paleobuddy [do Rosario Petrucci et al. Reference do Rosario Petrucci, Januario and Quental2022] are R packages that simulate under a wide range of FBD models).
When simulating under the FBD process, we specify known values for the diversification and sampling parameters to generate a tree. When we use the model for inference, however, our aim is to infer these rates, along with the reconstructed tree topology and divergence times. The FBD model allows us to calculate the probability of a reconstructed tree, given the FBD process parameters, t origin, λ, μ, ψ, ρ, and the probability of the fossil sampling times, given the tree and the model parameters. As the fossil ages are considered to be data, we include them as part of the likelihood calculation in our representation of the FBD model in Bayes theorem (Fig. 3). In any birth–death process, the parameters for speciation, extinction, and sampling are highly correlated, and fixing one of them to a single value can ensure that the model is fully identifiable (Gavryushkina et al. Reference Gavryushkina, Welch, Stadler and Drummond2014; Truman et al. Reference Truman, Vaughan, Gavryushkin and Gavryushkina2024). Typically, it is recommended to specify a fixed value for ρ, as researchers often have prior knowledge of the known extant diversity of the clade of interest. Thus, ρ is often set to the proportion of sampled taxa as an approximation of the probability an extant taxon is sampled. In the original model, extant taxon sampling is assumed to be uniform among branches surviving to t = 0, but this assumption, along with many others, can be relaxed. Table 2 presents the FBD family of models and their assumptions, and Box 6 presents information on different parameterizations and prior choices.
Choosing priors.
Under the standard fossilized birth–death (FBD) parameterization, we place prior distributions directly on the FBD model rate parameters, namely origination (λ), extinction (μ), and fossil sampling (ψ). Often, we use exponential priors for these rates—this distribution places a high probability on values close to zero, which is typical of estimates obtained from fossil data, but does not preclude larger values.
The rates λ, μ, and ψ are always used to calculate the probability under the FBD model, but we also have the option to parameterize the model using different combinations of transformed parameters, enabling us to instead set priors on these values. For instance, we can place priors on diversification ( $ d $
), turnover (
$ d $
), turnover ( $ r $
), and the probability of sampling before extinction (
$ r $
), and the probability of sampling before extinction ( $ s $
), which can be transformed during inference using the formulas shown below to recover λ, μ, and ψ. One advantage of parameterizing the model using
$ d $
,
$ r $
, and
$ s $
is that
$ r $
and
$ s $
can be bounded within the range [0, 1], if we assume λ > μ, that is, that net diversification is positive, in contrast to λ, μ, and ψ, which are all in the range (0, ∞) (Heath et al. Reference Heath, Huelsenbeck and Stadler2014). It will not always be appropriate to assume λ > μ (see Marshall Reference Marshall2017), but users can and should make the choice based on their specific datasets.
$ s $
), which can be transformed during inference using the formulas shown below to recover λ, μ, and ψ. One advantage of parameterizing the model using
$ d $
,
$ r $
, and
$ s $
is that
$ r $
and
$ s $
can be bounded within the range [0, 1], if we assume λ > μ, that is, that net diversification is positive, in contrast to λ, μ, and ψ, which are all in the range (0, ∞) (Heath et al. Reference Heath, Huelsenbeck and Stadler2014). It will not always be appropriate to assume λ > μ (see Marshall Reference Marshall2017), but users can and should make the choice based on their specific datasets.
Many possibilities for constraining and transforming model parameters exist within a flexible Bayesian framework. This is particularly true of more parameter-rich models, such as skylines (see Table 2, Box 5), which can allow for a more complex set of priors. In an analysis of Cambrian echinoderms, Wright et al. (Reference Wright, Wagner and Wright2021) used the FBD skyline model, which permits variation in evolutionary rates between time intervals. They used an exponential prior for speciation, and constrained extinction such that turnover was within the range (0.90, 1.05), reflecting the observation that λ and μ tend to be correlated. Rates can also be linked across adjacent intervals (for details, see Zhang et al. Reference Zhang, Ronquist and Stadler2023). Finally, it is possible to constrain or even fix the FBD model parameters based on independent estimates, which is often done for extant sampling probability, ρ (see Section The FBD Process), but can easily be done for other parameters, such as fossil sampling (e.g., O’Reilly and Donoghue Reference O’Reilly and Donoghue2021). Within paleobiology, we often work with per-interval sampling probabilities (Foote and Sepkoski Reference Foote and Sepkoski1999; Alroy Reference Alroy2008), which can also be transformed to recover ψ (e.g., Warnock et al. Reference Warnock, Heath and Stadler2020), allowing us to take advantage of previous work in paleobiology.
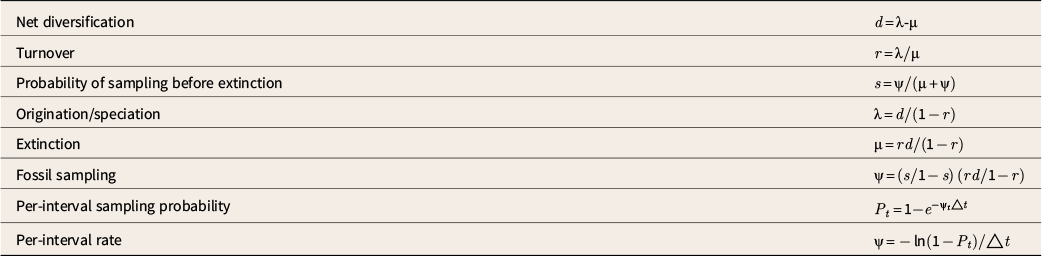
Clock Models
The clock model describes the rate of character change along a tree with branch lengths in units of time. These models generate a set of branch-specific substitution rates. With these values, it is possible to transform the branch times of the FBD tree into units of evolutionary distance (i.e., the number of substitutions/site). The likelihood of the character data is then calculated using these branch lengths and the parameters of the character substitution model (Fig. 3). A number of different models have been introduced to describe the distribution of substitution rates among branches (see Heath and Moore Reference Heath, Moore, Chen, Kuo and Lewis2014), all of which can be applied to molecular or morphological data. In an analysis using both data types, that is, a total-evidence analysis, the clock model governing variation in molecular substitution rates is typically assumed to be independent from the process generating variation in morphological branch rates (see Box 4 for an example specifying separate molecular and morphological clock models). This is because we do not expect the rate of morphological and molecular evolution to be exactly the same for any given branch. It is also possible to apply different clock models to different subsets of molecular or morphological data (Simões et al. Reference Simões, Greifer, Barido-Sottani and Pierce2023a).
Branch-rate models can be categorized into two types: strict or relaxed clock models (for comprehensive reviews of clock models, see Heath and Moore Reference Heath, Moore, Chen, Kuo and Lewis2014; Bromham et al. Reference Bromham, Duchêne, Hua, Ritchie, Duchêne and Ho2018). Under a strict clock model, the rate of evolution is constant across every branch in the tree (Zuckerkandl and Pauling Reference Zuckerkandl, Pauling, Kasha and Pullman1962, Reference Zuckerkandl and Pauling1965). Thus, this model has a single free parameter—the global substitution rate—that is applied to every branch on the tree. While this model’s simplicity is attractive, the assumption of constant rates is unlikely to hold for most molecular or morphological datasets, especially over deep macroevolutionary timescales.
Several relaxed clock models have been introduced that allow rates of character evolution to change over the tree. These models have different assumptions about the pattern of rate variation and the underlying processes driving rate change, including local molecular clocks (Hasegawa et al. Reference Hasegawa, Kishino and Yano1989; Yang and Yoder Reference Yang and Yoder2003; Drummond and Suchard Reference Drummond and Suchard2010), autocorrelated rate change (Thorne et al. Reference Thorne, Kishino and Painter1998; Thorne and Kishino Reference Thorne and Kishino2002; Huelsenbeck et al. Reference Huelsenbeck, Larget and Swofford2000; Lepage et al. Reference Lepage, Bryant, Philippe and Lartillot2007), time-dependent rates (Membrebe et al. Reference Membrebe, Suchard, Rambaut, Baele and Lemey2019), mixture models on branch rates (Heath et al. Reference Heath, Holder and Huelsenbeck2012), and uncorrelated-rate models (Drummond et al. Reference Drummond, Ho, Phillips and Rambaut2006; Lepage et al. Reference Lepage, Bryant, Philippe and Lartillot2007; Rannala and Yang Reference Rannala and Yang2007). In particular, uncorrelated-rate relaxed clock models assume that the substitution rates associated with each branch in the tree are independently drawn from an underlying probability distribution. Because the branch rates are independent, these models can be sampled efficiently with MCMC and are the most common relaxed clock models used in Bayesian divergence time estimation. Specifically, in paleobiology, one of the more frequently used uncorrelated-rate models is the uncorrelated lognormal (UCLN) model (Drummond et al. Reference Drummond, Ho, Phillips and Rambaut2006). In the UCLN clock model, independent branch rates are drawn from a lognormal distribution (Drummond et al. Reference Drummond, Ho, Phillips and Rambaut2006). The mean of the lognormal distribution corresponds to the average substitution rate, while the variance of the distribution reflects the degree of rate variation across the tree. The mean and variance are specified using separate prior distributions and are informed by the character data in the likelihood (Fig. 3).
Uncorrelated-rate models characterize rate patterns and are not based on any particular biological process. These models are also widely available across different Bayesian phylogenetics software, making them a popular choice for divergence time analyses. However, the wide range of relaxed clock models mentioned earlier may have other properties that are worth considering for analysis of fossil (and extant) taxa. Autocorrelated-rate models, in particular, seek to account for an underlying biological process driving variation in rates of character evolution over the tree. Under these models, closely related lineages are more likely to have similar rates, as these values change gradually along the tree. Moreover, some studies have shown that the use of autocorrelated versus uncorrelated molecular clock models can have a large impact on divergence times (e.g., Lepage et al. Reference Lepage, Bryant, Philippe and Lartillot2007; Dohrmann and Wörheide Reference Dohrmann and Wörheide2017). It is important to note, however, that much of the work investigating the fit and adequacy of clock models has focused on applications to molecular data. Thus, the performance of different morphological clock models for datasets including fossil taxa remains underexamined (however, see, Lee Reference Lee2016; Simões et al. Reference Simões, Caldwell and Pierce2020; Congreve et al. Reference Congreve, Patzkowsky and Wagner2021).
Substitution Models
Substitution models describe the evolution of character states along a tree with branch lengths that correspond to evolutionary distance. They are used to calculate the likelihood of observing our phylogenetic character data in Bayes theorem (Fig. 3). As described in The Data section, the character data used in phylogenetic analyses are typically either morphological or molecular. There are a number of substitution models for molecular data; however, as these data are not the core focus of this review we do not go into detail here (but see Sullivan and Joyce Reference Sullivan and Joyce2005; Yang and Rannala Reference Yang and Rannala2012; Arenas Reference Arenas2015). There are comparatively fewer models available for morphological data, as developing models that generalize the underlying processes of morphological evolution is difficult (Wright Reference Wright2019). In part this is because the individual characters defined in morphological matrices are much more variable in definition and scope than those in molecular data. The name “substitution” model stems from the description of substitutions between nucleotides. Despite its poor translation, this same name is often also applied to analogous models for morphological data where we are not modeling substitutions, but rather transitions between morphological phenotypes. To address this mismatch, these models are sometimes referred to as morphological substitution models, discrete models, or discrete models of character evolution, as well as simply substitution models, often interchangeably. It is important to be aware that they all refer to the same type of model.
The most common model applied to morphological data is the Mk model (Lewis Reference Lewis2001), where M refers to Markov, and k to the number of states. That is, if this model is used with a dataset with four character states, it may be referred to as an M4 model. This model is equivalent to the Jukes Cantor model used for molecular data (Jukes et al. Reference Jukes and Cantor1969). It assumes equal transition rates between character states, that is, transitioning from state 1 to 0 is equally probable as transitioning from 0 to 1, or from 0 to 2, and so on. This simplistic model has subsequently been extended to better reflect the properties inherent to morphological data. The first extension, described in the same paper as the standard Mk model (Lewis Reference Lewis2001) is the MkV model. This extension accounts for the fact that in a morphological matrix, most (if not all) of the sites will vary. That is, when taxonomists are creating morphological matrices, it is common to code preferentially for phenotypic traits that vary among species. This results in an matrix in which all sites have varying characters. This failure to include characters that are shared by all species in the dataset introduces what is known as an “ascertainment bias”, which can result in overestimation of the substitution rate and therefore branch lengths (evolutionary distance) in the inferred tree (Lewis Reference Lewis2001). The MkV model instead conditions on the fact that there are only variable sites in the alignment, ensuring that branch lengths are not overestimated. This is achieved by calculating the conditional likelihood of a site, given that it is variable. In practice, a dummy character is added to the alignment to calculate the probability of a constant character (given a tree and set of branch lengths), which can then be used to calculate the conditional likelihood.
In a morphological matrix, different character traits can describe many aspects of a phenotype, and so might be expected to transition more or less frequently. To account for variation in transition rates between traits, researchers can allow for rates among characters to vary according to a gamma distribution (Yang Reference Yang1994), the MkV+Γ model. Wagner (Reference Wagner2012) explored the use of a lognormal rate distribution to describe this variation in rates, although a gamma distribution remains the most commonly applied. Aside from character rate variation, it is also important to consider whether or not it makes sense to partition the data. Partitioning a dataset involves allocating traits to groups that are thought to have evolved under similar conditions or pressures. Each group of traits is then modeled with a separate Mk model, such that the likelihood is then a product of a number of Mk models. Partitioning morphological data by the maximum observed state is the most common approach and is the default in several phylogenetic software programs, for example, MrBayes (Ronquist et al. Reference Ronquist, Teslenko, Van Der Mark, Ayres, Darling, Höhna, Larget, Liu, Suchard and Huelsenbeck2012b) and BEAST2 (Bouckaert et al. Reference Bouckaert, Vaughan, Barido-Sottani, Duchêne, Fourment, Gavryushkina and Heled2019). Characters can also be partitioned based on some prior knowledge or hypotheses based on anatomical region or function, for example, cranial and postcranial or feeding and non-feeding structures (Klopfstein et al. Reference Klopfstein, Vilhelmsen and Ronquist2015; Simões and Pierce Reference Simões and Pierce2021; Casali et al. Reference Casali, Freitas and Perini2023). Choice of morphological model has been shown to impact both the branch lengths and topology of inferred phylogenies (Khakurel et al. Reference Khakurel, Grigsby, Tran, Zariwala, Höhna and Wright2024). It is important to provide justification for substitution model choice through approaches such as model adequacy (Mulvey et al. Reference Mulvey, May, Brown, Höhna, Wright and Warnock2024).
As described in the Section on Character Data, there are often some special characters in morphological matrices, such as missing and non-applicable characters, denoted as “?” and “-”, respectively. These characters are often treated the same way by standard Mk models, despite the fact they have distinct meanings. Further, non-applicable characters violate the Mk model, which assumes that each character trait is independent of all others (Hopkins and St. John Reference Hopkins and St. John2021). In spite of this model violation, Bayesian inference still outperforms parsimony methods specifically designed to handle non-applicable characters (Simões et al. Reference Simões, Vernygora, de Medeiros and Wright2023b). New models are also being developed to account for nested characters, such as the embedded dependency model, which takes into account the dependency one trait can have on another (Tarasov Reference Tarasov2023), although this model is yet to be applied in an analysis using the FBD model. Further development is required in these areas to enable us to more accurately model morphological evolution.
Assessing and Interpreting the Output
Examining MCMC Efficiency and Performance
When Bayesian statistical inference is performed using sampling algorithms like MCMC, it is very important to evaluate the performance and efficiency of the sampler (Cowles and Carlin Reference Cowles and Carlin1996; Gelman Reference Gelman, Gilks, Richardson and Spiegelhalter1996). This involves a range of different techniques for assessing convergence (often called “convergence diagnostics”). Ideally, we would like for our Markov chain to converge on the true posterior distribution and sample parameter values in proportion to their posterior probability. However, we can only be certain that this type of convergence is reached after an infinite number of MCMC iterations. Because we are restricted to finite timelines to complete our research, we instead use different qualitative and quantitative approaches for identifying signs that our chains are yielding sensible samples and are not stuck in narrow regions of parameter space. Convergence diagnostic methods ultimately tell us if our Markov chain has converged on a stationary distribution and is sampling values from that distribution in proportion to their probability.
Perhaps one of the most useful approaches for evaluating the performance of MCMC is to run multiple, independent chains and compare their samples and probabilities (Gelman Reference Gelman, Gilks, Richardson and Spiegelhalter1996). For this to work effectively, each analysis must start with different values for the free parameters. Once each run has collected a desired number of samples, we can then compare the marginal posterior distributions of our numerical parameters (e.g., speciation rate, clock rate). For example, if the distributions of samples for speciation rate match between multiple independent Markov chains, then that is evidence that the runs have sampled from the same stationary distribution. For more complex parts of our model like the tree topology, we can compare bipartitions or posterior probabilities or use other topology diagnostics (Nylander et al. Reference Nylander, Wilgenbusch, Warren and Swofford2008; Lanfear et al. Reference Lanfear, Hua and Warren2016; Warren et al. Reference Warren, Geneva and Lanfear2017; Fabreti and Höhna Reference Fabreti and Höhna2022).
Another important attribute to examine is correlation among samples for a given parameter within a single run. Because MCMC simulates dependent samples and we do not want our samples to be highly correlated, we typically specify the frequency at which we save values to a file. Thus, if this frequency is set to 100, then our MCMC output will only save our parameters at every 100 iterations. However, even after our MCMC sample is thinned, the values for some parameters may still be autocorrelated. An MCMC algorithm’s ability to efficiently sample a target distribution (the posterior) is often referred to as “mixing”. We can visually look for good or bad mixing in a numerical parameter by plotting the sampled value as a function of the timeline of the Markov chain. If the chain appears to sample clusters separated by large valleys or show a very gradual trend, then this is often called “bad mixing”. Conversely, if we plot the values sampled by a run that is mixing well, we will see regular oscillation over the range of probable values (it is often said that this pattern resembles a “fuzzy caterpillar” like the larvae of the garden tiger moth) without any clusters or gradual trends (Ali et al. Reference Ali, Bark, Miró, Muhammad, Sjöstrand, Zubair, Abbas and Arvestad2017; Roy Reference Roy2020). In addition to employing visual inspection, we can also quantify the degree of autocorrelation among samples of a given parameter (for a single run) using a summary statistic called the effective sample size (ESS). This value is a measure of the effective number of independent draws from the stationary distribution for a parameter. In phylogenetics, an ESS of 200 is generally considered to be the minimum threshold indicating good mixing. However, this may not be reasonable as a universal rule of thumb across all parameters and phylogenetic models (Fabreti and Höhna Reference Fabreti and Höhna2022).
One important tool for assessing MCMC convergence is the program Tracer (Rambaut et al. Reference Rambaut, Drummond, Xie, Baele and Suchard2018), which allows for visual inspection of MCMC samples, in addition to assessment via metrics like the ESS. Tracer takes the MCMC output files of numerical parameters and renders plots of the sampled parameter traces and marginal densities, as well as many other visualizations. A wide range of convergence diagnostics (for numerical and tree parameters) are also available in the R packages RWTY (Warren et al. Reference Warren, Geneva and Lanfear2017), Convenience (Fabreti and Höhna Reference Fabreti and Höhna2022), and RevGadgets (Tribble et al. Reference Tribble, Freyman, Landis, Lim, Barido-Sottani, Kopperud, Höhna and May2022).
After a range of different MCMC performance assessments are carried out, the resulting diagnosis may be that your runs are mixing well and have converged on the same stationary distribution. Then, the next step is to summarize the MCMC samples and proceed to interpreting your results. When your evaluation of MCMC output indicates poor mixing and non-convergence, however, it is not appropriate to assume that you have sufficient samples of your posterior distribution. There are many strategies for improving MCMC efficiency, including running the analysis much longer, increasing the number of moves for the parameters with poor mixing (by increasing proposal weights), adding different types of moves to parameters that are not converging, removing the initial samples (often called the “burn in”), increasing or decreasing the variance in proposed values for some moves, or introducing more prior information to reduce the complexity of parameter space (for more on diagnosing non-convergence, see Barido-Sottani et al. Reference Barido-Sottani, Schwery, Warnock, Zhang and Wright2024). Phylogenetic data, models, and analyses are extraordinarily complex, with many parameters and computationally intensive calculations. Accordingly, MCMC analyses of phylogenetic problems require a lot of time and computing power (and patience!) to sufficiently sample a complex posterior distribution.
Summarizing MCMC Samples and Interpreting Results
Depending on your research question, you may be interested in different aspects of the inference output. Estimates of numeric parameter values, such as branch lengths, divergence times, and substitution rates, can be summarized using Bayesian credible intervals. The highest posterior density (HPD) interval is widely used in Bayesian phylogenetic inference, which is the shortest range within the posterior that captures 95% of the posterior distribution. This eliminates the tails of the posterior distribution, while still reflecting uncertainty in the parameter estimates. In addition, it can be useful to visually explore the posterior output, which can also be done using Tracer or R, to examine the overall shape of the distribution. This will indicate whether your posterior is uni- or multimodal. You can also compare the posterior to your prior distributions to determine the level of signal in your data. It is conventional to run your inference “under the prior” (many Bayesian phylogenetic software packages have an option for doing so) and to compare the prior and posterior distributions. Note that this typically only excludes the substitution model likelihood and not the likelihood associated with the FBD model (Fig. 3). It therefore allows you to assess the signal for the model parameters (including divergence times) coming from the fossil ages versus the character data.
Summarizing across the posterior distribution of tree topologies is more difficult, especially when there is a high degree of uncertainty around the topology (O’Reilly and Donoghue Reference O’Reilly and Donoghue2018). Two of the more common summary tree approaches used in paleobiology are the maximum clade credibility (MCC) tree and the maximum a posteriori (MAP) tree. The MCC tree consists of clades that have the highest probability across all trees to best represent the evolutionary history of the group, while taking into account the uncertainty. The MAP tree is an actual sampled tree in the posterior distribution that has the highest posterior probability. Summary trees can be generated using inference tools and visualized using R or more specialist tree visualization software, such as FigTree (http://tree.bio.ed.ac.uk/software/figtree) or IcyTree (Vaughan Reference Vaughan2017). There are also methods for visually exploring the entire posterior tree space (Wright and Lloyd Reference Wright and Lloyd2020; Smith Reference Smith2022). This can be a good way to visualize the impact of different models or priors on the posterior tree space (e.g., May et al. Reference May, Contreras, Sundue, Nagalingum, Looy and Rothfels2021; Mulvey et al. Reference Mulvey, May, Brown, Höhna, Wright and Warnock2024).
It is always important to consider the uncertainty associated with phylogenetic parameter estimates, including the topology, regardless of whether the tree topology is the main focus of the study. Although trees inferred using molecular data can be highly uncertain, datasets used for tree inference in paleobiology are often relatively small (e.g., <100 characters), and therefore more likely to result in a high degree of uncertainty around the topology (Barido-Sottani et al. Reference Barido-Sottani, Pohle, De Baets, Murdock and Warnock2023). When time-calibrated trees are used for downstream analyses, such as phylogenetic comparative analysis or ancestral-state estimation, it is important to represent this uncertainty by using the entire posterior, or a subset, in secondary analyses, depending on computational limitations (Soul and Wright Reference Soul and Wright2021).
Challenges and Perspectives
FBD models provide a robust way of incorporating paleontological data into phylogenetic analyses, thereby allowing us to better study evolution through time. While these models have a number of advantages over alternative approaches, it is important to appreciate their limitations, along with the challenges associated with modeling fossil data. There are a number of important questions still to be fully addressed or resolved. For example: Are our models sufficiently complex to adequately represent biological phenomena? How do identifiability issues impact parameter estimates? Do available models fit our empirical datasets?
Developing models that encompass biological, as well as geological and sampling processes, is challenging. While FBD models offer an advanced framework for inferring phylogenetic parameters in paleobiology, at their core, the assumptions regarding the generating processes are relatively simplistic (see Section The FBD Process). When considering whether or not our models make reasonable assumptions, it is worth reflecting on the complexity of the system we are modeling. The most widely applied FBD model assumes a constant rate of fossil sampling through time (Supplementary Table S2), which does not reflect the true nature of fossil data. The geological and stratigraphic records are non-uniformly incomplete (Benton et al. Reference Benton, Dunhill, Lloyd and Marx2011; Holland Reference Holland2016; Benson et al. Reference Benson, Butler, Close, Saupe and Rabosky2021). Physiological properties, such as the differential mineralization of hard parts, as well as the environment in which an organism degrades, also influence the probability of becoming a fossil (Nanglu and Cullen Reference Nanglu and Cullen2023). In addition, a range of factors impact the probability of a fossil being sampled, for example, rock exposure (Dunhill et al. Reference Dunhill, Benton, Twitchett and Newell2012) or the socioeconomic status of the country in which the fossil is now deposited (Raja et al. Reference Raja, Dunne, Matiwane, Khan, Natscher, Ghilardi and Chattopadhyay2022). As a result of these biases, the fossil record is highly unevenly sampled across time, space, and lineages in the tree of life. Identifying generalizable processes that determine the structure of the fossil record will be crucial to the development of more realistic sampling regimes in FBD models.
There have already been numerous extensions to the FBD model that relax the assumption of uniform extant or fossil sampling (see Table 2). In particular, the FBD skyline model can accommodate variation in rates through time (Gavryushkina et al. Reference Gavryushkina, Welch, Stadler and Drummond2014), among discrete time intervals, analogous to many approaches for inferring evolutionary rates from fossil occurrence data (e.g., Foote Reference Foote2000; Alroy Reference Alroy2008, Reference Alroy2010; Liow and Nichols Reference Liow and Nichols2010). However, thus far, FBD skyline models have rarely been applied in empirical studies (only nine times according to our literature survey; Supplementary Table S2). Model extensions can also account for diversified sampling of extant taxa (Höhna et al. Reference Höhna, Stadler, Ronquist and Britton2011; Zhang et al. Reference Zhang, Stadler, Klopfstein, Heath and Ronquist2016), which has been applied more often in empirical studies (34 times according to our literature survey; Supplementary Table S2). Beyond this, further extensions are currently in development. For example, multi-type FBD processes allow for variation in diversification or sampling rates across lineages (Kühnert et al. Reference Kühnert, Stadler, Vaughan and Drummond2016; Barido-Sottani et al. Reference Barido-Sottani, Vaughan and Stadler2020c). This framework could, in theory, be used to account for variation in spatial sampling (Antell et al. Reference Antell, Benson and Saupe2024) or other causes of variation in preservation potential (Nanglu and Cullen Reference Nanglu and Cullen2023) or diversification across lineages. However, as model complexity increases to better account for complex generating processes and the sizes of our datasets increase, the computational expense of running an inference also increases. Analyses can quickly become expensive to the point where using them may be impractical. Approaches for alleviating some of the computational expenses involved in running these analyses could include constraining or fixing a large portion of the tree (Lloyd and Slater Reference Lloyd and Slater2021; Farina et al. Reference Farina, Godoy, Benson, Langer and Ferreira2023), using parsimony or maximum-likelihood approaches to generate a starting tree, or uniformly subsampling fossil occurrences (O’Reilly and Donoghue Reference O’Reilly and Donoghue2020).
Increased model complexity can also lead to identifiability issues. A model is identifiable if unique sets of parameter values produce unique observations. Non-identifiability can therefore be a major concern, arising when our data are compatible with multiple sets of parameter values. We can see how this may occur fairly intuitively using the FBD model parameters: an increase in the number of fossils over time could be caused by an increase in the speciation rate or an increase in the sampling rate. Our reliance on small, incomplete datasets exacerbates this issue, as often there is insufficient signal in the data to help recover precise parameter estimates, especially for complex models with many parameters. In addition, the broad structure of birth–death models results in inherent identifiability issues that cannot necessarily be resolved with the addition of more data (Louca and Pennell Reference Louca and Pennell2020; Louca et al. Reference Louca, McLaughlin, MacPherson, Joy and Pennell2021; Andréoletti and Morlon Reference Andréoletti and Morlon2023; Kopperud et al. Reference Kopperud, Magee and Höhna2023). Prior choice also plays an important role in the identifiability of Bayesian models. For example, in analyses that employ the FBD model, it is common to fix the sampling probability ρ in order to ensure that the model is identifiable. In addition, we could consider the potential role of prior information on other parameters. For example, fossil-based estimates of sampling probability can be used to inform the sampling rate (Wagner and Marcot Reference Wagner and Marcot2010; O’Reilly and Donoghue Reference O’Reilly and Donoghue2020; Wright et al. Reference Wright, Wagner and Wright2021; Thuy et al. Reference Thuy, Eriksson, Kutscher, Lindgren, Numberger-Thuy and Wright2022). Any implications of prior choice for the reliability of the results are rarely discussed in the literature. The relationship between prior choice and identifiability in FBD models is therefore one of the more challenging aspects of their application and needs to be investigated more thoroughly in future.
Because we can simulate data under FBD models, as well as perform inference, simulations are a valuable tool for exploring the behavior and limitations of these models (Barido-Sottani et al. Reference Barido-Sottani, Pett, O’Reilly and Warnock2019b; do Rosario Petrucci et al. Reference do Rosario Petrucci, Januario and Quental2022). Several simulation studies have explored scenarios violating FBD model assumptions to determine whether they lead to inaccurate results (Matschiner Reference Matschiner2019; O’Reilly and Donoghue Reference O’Reilly and Donoghue2020; Barido-Sottani et al. Reference Barido-Sottani, Pohle, De Baets, Murdock and Warnock2023). Simulation studies have also been used to explore how resilient the model is to nuances of fossil sampling (Barido-Sottani et al. Reference Barido-Sottani, Van Tiel, Hopkins, Wright, Stadler and Warnock2020b; O’Reilly and Donoghue Reference O’Reilly and Donoghue2020; Luo et al. Reference Luo, Duchêne, Zhang, Zhu and Ho2020, Reference Luo, Zhang, Zhou, Ho and Zhu2023; Warnock et al. Reference Warnock, Heath and Stadler2020; Mongiardino Koch et al. Reference Mongiardino Koch, Garwood and Parry2021). Together, these studies show that increasing overall fossil or taxon sampling and/or the number of morphological characters available for fossil samples improves the accuracy of parameter estimates under the FBD model. Further, simulations have shown that stratigraphic age or taxonomic information used to inform the inference must be accurate (Barido-Sottani et al. Reference Barido-Sottani, Aguirre-Fernández, Hopkins, Stadler and Warnock2019a, Reference Barido-Sottani, Van Tiel, Hopkins, Wright, Stadler and Warnock2020b, Reference Barido-Sottani, Pohle, De Baets, Murdock and Warnock2023). Collectively, these simulation studies demonstrate that empirical expertise is key to obtaining reliable results when using FBD models. It is therefore crucial that fundamental stratigraphic and taxonomic research remain well supported and that we, as a scientific community, find ways of incentivizing data collection and supporting the infrastructure around paleontological databases (Smith et al. Reference Smith, Raja, Clements, Dimitrijević, Dowding, Dunne and Gee2023; Uhen et al. Reference Uhen, Allen, Behboudi, Clapham, Dunne, Hendy, Holroyd, Hopkins, Mannion, Novack-Gottshall, Pimiento and Wagner2023).
Ultimately, the question remains as to whether available FBD models provide a reasonable fit to empirical fossil datasets. Standard model selection approaches cannot be used to compare the relative fit of alternative FBD models (for details, see May and Rothfels Reference May and Rothfels2023). This means we need alternative approaches for assessing the fit of FBD models to empirical fossil data. An alternative to model selection is to use a model adequacy approach, such as posterior predictive simulations, which allow us to compare the absolute (rather than relative) fit of different models to our data (Brown Reference Brown2014a,Reference Brownb; Duchêne et al. Reference Duchêne, Duchêne and Ho2018; Höhna et al. Reference Höhna, Coghill, Mount, Thomson and Brown2018). Although model adequacy has mainly been used to assess the fit of substitution models in phylogenetics (for an example in paleobiology, see Mulvey et al. Reference Mulvey, May, Brown, Höhna, Wright and Warnock2024), it has also been applied to tree models in the context of epidemiology (Duchêne et al. Reference Duchêne, Bouckaert, Duchêne, Stadler and Drummond2019) and to explore the fit of trait-dependent models of diversification (Schwery et al. Reference Schwery, Freyman and Goldberg2023) and, in principle, could be extended to birth–death process models that include the fossil sampling process.
The development of new models and tools for morphological data is also an active area of research (Simões et al. Reference Simões, Greifer, Barido-Sottani and Pierce2023a; Tarasov Reference Tarasov2023; Khakurel et al. Reference Khakurel, Grigsby, Tran, Zariwala, Höhna and Wright2024; Mulvey et al. Reference Mulvey, May, Brown, Höhna, Wright and Warnock2024). Although there is evidence to suggest that discrete morphology can evolve in a clocklike manner and can therefore be modeled using standard clock models (Drummond and Stadler Reference Drummond and Stadler2016), some interesting issues emerge with the development of new FBD models. For example, how do we model morphological evolution along a tree with stratigraphic ranges? The FBD range model allows us to incorporate information about taxa through time (Stadler et al. Reference Stadler, Gavryushkina, Warnock, Drummond and Heath2018). If stratigraphic ranges are associated with a suite of characters that do not change between the FAD and LAD, this could imply an interval of evolutionary stasis, or it could be that morphological change occurs in bursts, coincident with speciation events, that is, according to a model of punctuated equilibrium (Gingerich Reference Gingerich1984). We cannot account for these scenarios using standard clock models. Further, we tend not to link parameters across models of trait evolution and diversification (or sampling), although we could, in theory, within the Bayesian framework described here (Fig. 3). More research is needed to develop models that better reflect the nature of sampled morphological data and to assess the impact of different aspects of model violation.
Moving forward, both modeling and empirical perspectives are needed to resolve outstanding questions regarding the integration of fossil data in phylogenetic models. This will involve further theoretical work, simulation studies grounded in empirical observations, better support for empirical data collection and taxonomic research, and more exchange between paleobiologists and model developers about the assumptions the models make about the data. In writing this review, we hope to provide a common ground for discussing Bayesian phylogenetic inference using the FBD process with paleontological data.
Acknowledgments
We would like to thank the editor M. Patzkowsky as well as R. Dearden and two other anonymous reviewers for their helpful comments that greatly improved this article. The contributions of B.J.A. were supported by ETH Zürich.
Competing Interests
The authors declare no conflicts of interest.
Data Availability Statement
The data gathered from the literature survey, as well as the criteria used for its collection, are available on Dryad: https://doi.org/10.5061/dryad.gf1vhhmxv and on github: https://github.com/rachelwarnock/FBD_survey.


 Open access