Flavonoids and phenolic compounds in berries and other selected fruits
Berries contain vitamin C and are a rich source of phytochemicals, in particular anthocyanins. They also contain ellagitannins, flavan-3-ols, procyanidins, flavonols and hydroxybenzoate derivatives. The anthocyanins are conjugated anthocyanidins, which provide the distinctive and vibrant palette of colours found in berries. There are six main anthocyanidins distributed throughout the plant kingdom: cyanidin, malvidin, delphinidin, peonidin, petunidin and pelargonidin (Fig. 1). They form O-linked conjugates with a number of sugars, in particular glucose, sophorose, rutinose, rhamnose, galactose, arabinose and xylose.
Anthocyanidin structures.

Concentrations of phytochemicals in berries will be influenced by many factors including environmental conditions, degree of ripeness, cultivar, cultivation site, processing and storage of the fruit(Reference Boyles and Wrolstad1–Reference Hakkinen and Torronen3). The structures of the predominant anthocyanins are summarised in Fig. 2 and are listed in more detail along with other flavonoids and phenolic compounds in Table 1(Reference Mäattä, Kamal-Eldin and Torronen4–Reference Rouanet, Décorde and Del Rio16). There is much variety, and while some fruits, such as redcurrants (Rubus idaeus) and elderberry (Sambucus nigra), contain derivatives of only one type of anthocyanin (i.e. cyanidin), a wide array of anthocyanins is found in blueberry (Vaccinium corymbosum), bilberry (Vaccinium myrtillus) and blackcurrant (Ribes nigrum). In general, the anthocyanin profile of a tissue is characteristic, and it has been used in taxonomy, as well as for the detection of adulteration of juices and wines. Blackcurrants are characterised by the presence of the rutinosides and glucosides of delphinidin and cyanidin, with the rutinosides being the most abundant. Other anthocyanins occur but at much lower concentrations. While redcurrants are very closely related to blackcurrants, they contain mainly cyanidin diglycosides with cyanidin monoglucosides present only as minor components. Strawberries (Fragaria × ananassa), blackberries (Rubus spp.) and red raspberries (R. idaeus) are all from the Rosaceae family but they have a diverse anthocyanin content. The major anthocyanins in raspberries and blackberries are derivatives of cyanidin, while in strawberries, pelargonidin-3-O-glucoside predominates. The major components in blueberries are malvidin-3-O-arabinoside and the 3-O-galactosides of cyanidin, delphinidin, petunidin and malvidin, with many minor anthocyanins also being present. Cranberries belong to the Ericaceae, the same family as blueberries, but have cyanidin- and peonidin-based compounds as their major anthocyanins (Table 1, Fig. 2).
Major anthocyanins in berries.

Endogenous phenolics in selected berries

Cy, cyanidin; Glc, glucoside; Rut, rutinoside; DEL, delphinidin; Mal, malvidin; Myr, myricetin; GlcAc, acetylglucoside; Q, quercetin; Sop, sophoroside; Xyl, xyloside; Ara, arabinoside; Pel, pelargonidin; Rham, rhamnoside; Gal, galactoside; XylGlcA, xylosylglucuronide; Samb, sambubioside; DiGlc, diglucoside; GlcAC, glucuronide; Peo, peonidin; Pet, petunidin; K, kaempferol; XylAc, acetylxyloside; AraAc, acetylarabinoside.
* Major components.
Flavonols and other flavonoids are commonly quantified as the aglycone after acid or enzyme hydrolysis to remove sugar residue(Reference Hertog, Hollman and Katan17, Reference Hertog, Hollman and Venema18). Using this approach, the myricetin, quercetin and kaempferol content of edible berries had been estimated(Reference Hakkinen, Karenlampi and Heinonen19). Quercetin was found to be highest in bog whortleberry (Vaccinium uliginosum) (158 mg/kg) and bilberry (17–30 mg/kg). In blackcurrant cultivars, myricetin was the most abundant flavonol (89–203 mg/kg), followed by quercetin (70–122 mg/kg) and kaempferol (9–23 mg/kg). In comparison, the total anthocyanin content of red raspberries is approximately 600 mg/kg(Reference Mullen, McGinn and Lean11, Reference Mullen, Stewart and Lean12). Specific flavonol glycosides that have been identified in berries include quercetin-3-O-glucoside, quercetin-3-O-rutinoside, quercetin-3-O-galactoside and quercetin-3-O-xylosylglucuronide, myricetin-3-O-glucoside, myricetin-3-O-galactoside and myricetin-3-O-rutinoside (Fig. 3, Table 1).
Flavonols identified in berries.

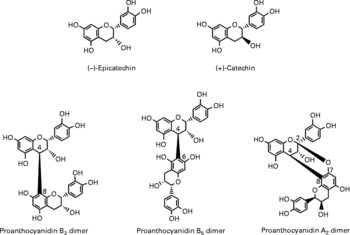
Berries can contain the flavan-3-ol monomers (+)-catechin and ( − )-epicatechin as well as dimers, trimers and polymeric proanthocyanidins (Fig. 4). The concentration of the polymers is usually greater than the monomers, dimers and trimers, and overall cranberries are a particularly rich source of these compounds (Table 2)(Reference Wu, Gu and Prior5, Reference Gu, Kelm and Hammerstone20).
Flavan-3-ol monomers and procyanidins identified in berries.

(Mean values (mg/kg fresh wt) and standard deviations)
PA, proanthocyanidins.
The hydroxybenzoate, ellagic acid (Fig. 5), has been reported in berries, particularly raspberries (5·8 mg/kg), strawberries (18 mg/kg) and blackberries (88 mg/kg)(Reference Amakura, Okada and Tsuji21). Indeed, ellagic acid has been described as being responsible for>50 % of total phenolics quantified in strawberries and raspberries(Reference Hakkinen, Karenlampi and Mykkanen22). In reality, however, free ellagic acid levels are generally low, although substantial quantities are detected along with gallic acid after acid hydrolysis of extracts as a product of ellagitannin breakdown (Fig. 5). For instance, red raspberries, the health benefits of which are often promoted on the basis of a high ellagic acid content, contain approximately 1 mg/kg of ellagic acid compared to approximately 300 mg/kg of ellagitannins, mainly in the form of sanguiin H-6 and lambertianin C (Fig. 5)(Reference Mullen, McGinn and Lean11, Reference Mullen, Yokota and Lean13). Pomegranates (Punica granatum L.) also contain a high concentration of ellagitannins. The fruit contains gallagic acid, an analogue of ellagic acid, based on four gallic acid residues, and punicalin, the principal monomeric ellagitannin in which gallagic acid is bound to glucose. Punicalagin is a further ellagitannin in which ellagic acid, as well as gallagic acid, is linked to glucose moiety (Fig. 6)(Reference Crozier, Jaganath and Clifford23). Several ellagitannin monomers, dimers, trimers and tetramers had been identified in blackberries but most occur only in seed tissues(Reference Hager, Howard and Liyanage10).
Gallic acid, ellagic acid and the raspberry ellagitannins sanguiin H-6 and lambertianin C.

Pomegranates contain gallagic acid and the ellagitannins punicalin and punicalagin.

A variety of hydroxycinnamates, including chlorogenic acids, are also found in berries but usually they are present in low concentrations(Reference Schuster and Herrmann24), although in other fruits, including apples, 5-O-caffeoylquinic acid can accumulate in more substantial concentrations. Concord purple grapes (Vitis labrusca) contain the hydroxycinnamate–tartaric acid conjugates coutaric acid and caftaric acid (Fig. 7)(Reference Crozier, Jaganath and Clifford23).
The chlorogenic acid 5-O-caffeoylquinic acid and the hydroxycinnamate–tartaric acid conjugates, coutaric acid and caftaric acid.

Bioavailability of flavonoids and phenolic compounds
Following the ingestion of dietary flavonoids which, with the notable exception of flavan-3-ols, exist in planta predominantly as glycoside conjugates, absorption of some but not all components into the circulatory system occurs in the small intestine(Reference Donovan, Manach, Faulks, Crozier, Clifford and Ashihara25). Typically, this is associated with hydrolysis, releasing the aglycone, as a result of the action of lactase phloridizin hydrolase in the brush border of the small intestine epithelial cells. Lactase phloridizin hydrolase exhibits broad substrate specificity for flavonoid-O-β-d-glucosides, and the released aglycone may then enter the epithelial cells by passive diffusion as a result of its increased lipophilicity and its proximity to the cellular membrane(Reference Day, Canada and Diaz26). An alternative site of hydrolysis is a cytosolic β-glucosidase within the epithelial cells. In order for cytosolic β-glucosidase-mediated hydrolysis to occur, the polar glucosides must be transported into the epithelial cells, possibly with the involvement of the active Na-dependent GLUT-1(Reference Gee, DuPont and Day27). Thus, it has been accepted that there are two possible routes by which the glucoside conjugates are hydrolysed, and the resultant aglycones appear in the epithelial cells, namely ‘lactase phloridizin hydrolase/diffusion’ and ‘transport/cytosolic β-glucosidase’. However, a recent investigation, in which Na-dependent GLUT-1 was expressed in Xenopus laevis oocytes, indicated that SLGT1 does not transport flavonoids and that glycosylated flavonoids, and some aglycones, have the capability to inhibit the GLUT(Reference Kottra and Daniel28).
Before passage into the bloodstream, the aglycones undergo metabolism forming sulphate, glucuronide and/or methylated metabolites through the respective action of sulphotransferases, UDP-glucuronosyltransferases and catechol-O-methyltransferases. There is also efflux of at least some of the metabolites back into the lumen of the small intestine, and this is thought to involve members of the ATP-binding cassette family of transporters including multidrug resistance protein and P-glycoprotein. Once in the bloodstream, metabolites can be subjected to phase II metabolism with further conversions occurring in the liver, where enterohepatic transport in the bile may result in some recycling back to the small intestine(Reference Donovan, Manach, Faulks, Crozier, Clifford and Ashihara25). Flavonoids and their metabolites not absorbed in the small intestine can be absorbed in the large intestine where the colonic microflora that will cleave conjugating moieties and the resultant aglycones will undergo ring fission leading to the production of phenolic acids and hydroxycinnamates. These can be absorbed and may be subjected to phase II metabolism in the liver before being excreted in urine in substantial quantities that, in most instances, are well in excess of the flavonoid metabolites that enter the circulatory system via the small intestine(Reference Jaganath, Mullen and Edwards29–Reference Williamson and Clifford31).
A detailed review on the bioavailability of polyphenols in human subjects by Manach et al. (Reference Manach, Williamson and Morand32) was published in 2005. Much of the research covered involved feeding volunteers a single supplement and monitoring the levels of flavonoids in plasma and urine over a 24 h period. As flavonoid metabolites were and, indeed, still are rarely available, analysis almost invariably involved treatment of samples with mollusc glucuronidase/sulphatase preparations and subsequent quantification of the released aglycones by HPLC using either absorbance, fluorescence or electrochemical detection. Some more bioavailability studies have analysed samples directly by HPLC with tandem MS detection without recourse to enzyme hydrolysis. The availability of reference compounds enables specific metabolites to be identified by HPLC–MS2 and MS3(Reference Mullen, Edwards and Crozier33). In the absence of standards, it is not possible to distinguish between isomers and ascertain the position of conjugating groups on the flavonoid skeleton. Nonetheless, a metabolite, which in reality is, say, pelargonidin-3-O-glucuronide, can be partially identified as a pelargonidin-O-glucuronide on the basis of its MS fragmentation pattern(Reference Mullen, Edwards and Serafini7). The use of MS in this way represents a powerful HPLC detection system as with low ng quantities of sample it provides structural information on analytes of interest, which is not obtained with other detectors.
Quantification of partially identified metabolites by MS using consecutive reaction monitoring or selected ion monitoring is, of necessity, based on a calibration curve of a related compound, which in the instance cited above could be pelargonidin-3-O-glucoside as it is available from commercial sources. In such circumstances, as the slopes of the glucoside and glucuronide selected ion monitoring dose:response curves will not necessarily be identical, there is a potential source of error in the quantitative estimates and there is a view that quantitative estimates based on enzyme hydrolysis are, therefore, much more accurate. We do not share this opinion. The glucuronidase/sulphatase preparations contain a mixture of enzyme activities, and there can be a substantial batch-to-batch variation in their specificity(Reference Donovan, Manach, Faulks, Crozier, Clifford and Ashihara25). There are no reports of flavonoid bioavailability studies using glucuronidase/sulphatase preparations where information on the identity, number and quantity of the individual sulphate and glucuronide conjugates in the samples of interest has been obtained. As a consequence, there are no direct data on the efficiency with which the enzymes hydrolyse the individual metabolites and release the aglycone. This introduces a varying, unmeasured error factor. The accuracy of quantitative estimates based on the use of glucuronidase/sulphatase preparations is, therefore, probably no better, and possibly much worse, than those based on HPLC–consecutive reaction monitoring/selected ion monitoring. The fact that enzyme hydrolysis results in very reproducible data is an irrelevance as reproducibility is a measure of precision, although it is frequently mistaken for accuracy(Reference Reeve, Crozier and MacMillan34). These shortcomings of analyses based on enzyme hydrolysis apply to bioavailability studies with all dietary flavonoids, and it is interesting to note that the one publication on the subject to date reports that the use of enzyme hydrolysis results in an underestimation of isoflavone metabolites(Reference Gu, Laly and Chang35).
Anthocyanins
Anthocyanins, for people who eat berries and drink red wine on a routine basis, are major dietary components. Although there are exceptions, unlike other flavonoids that are absorbed and excreted, most anthocyanins do not appear to undergo extensive metabolism of the parent anthocyanidin to glucuronide, sulphate or methyl derivatives(Reference McGhie, Aingie and Barnet15, Reference Miyazawa, Nakagawa and Kudo36–Reference Ichiyanagi, Shida and Rahman39). In feeding studies with human subjects and most animal test systems, typically approximately < 0·1 % of the quantities ingested, and sometimes much less, have been detected in urine within 24 h of consumption, although higher recoveries have been reported after acute intake of raspberries by rats (1·22 %)(Reference Borges, Roowi and Rouanet40) and a bilberry extract by mice (0·62–2·45 %)(Reference Sakakibara, Ogawa and Koyanagi41). The available data imply that the determinants of absorption and excretion are influenced not only by the nature of the sugar moiety but also by the structure of the anthocyanidin aglycone(Reference McGhie, Aingie and Barnet15, Reference Wu, Pittman and McKay42).
The complex array of information on anthocyanin bioavailability obtained with human and animal test systems has been reviewed by Prior & Wu(Reference Prior and Wu43). One of the reasons for the complicated picture that has emerged is that many feeds have involved berries or berry extracts containing several structurally diverse anthocyanins (Table 1). For instance, raspberries contain ten or more anthocyanins in the form of cyanidin- and pelargonidin-3-O-sugar conjugates ranging from mono- to trisaccharides, while blueberries contain more than fourteen anthocyanins, principally 3-O-glucosides, galactosides and arabinosides of cyanidin, delphinidin, petunidin and malvidin (Table 1). This makes the trace levels of complex anthocyanin profiles in plasma and urine exceedingly difficult, if not impossible to assess, in terms of absorption, excretion and potential phase I and phase II metabolism, especially when 3′-O-methylation can convert cyanidin to peonidin, and delphinidin to petunidin, and 5′-O-methylation converts petunidin to malvidin. Much simpler anthocyanin profiles are found in strawberries and blackberries, both of which contain one predominant anthocyanin, pelargonidin-3-O-glucoside in the former and cyanidin-3-O-glucoside in the latter (Table 1)(Reference Wu, Beecher and Holden44). As a consequence, data on anthocyanins bioavailability after ingestion of these berries by human subjects are potentially more straightforward to interpret.
Strawberries and blackberries
In a recent human study, 200 g of strawberries containing 222 μmol of pelargonidin-3-O-glucoside and trace quantities of pelargonidin-3-O-rutinoside (13 μmol) and cyanidin-3-O-glucoside (6 μmol) were consumed after which plasma and urine were collected over a 24 h period(Reference Mullen, Edwards and Serafini7). The plasma contained a pelargonidin-O-glucuronide along with non-quantifiable amounts of three other pelargonidin-O-glucuronides and pelargonidin-3-O-glucoside, the latter perhaps derived from removal of the 6″-rhamnose moiety from pelargonidin-3-O-rutinoside. The main pelargonidin-O-glucuronide had a peak plasma concentration (C max) of 274 (sd 24) nm, 1·1 (sd 0·4) h after ingestion (T max) (Fig. 8), in keeping with small intestine absorption, and an elimination half-life of 2·1 (sd 0·7) h. All the plasma anthocyanins also appeared in urine along with small quantities of pelargonidin aglycone and a pelargonidin-O-sulphate. The pelargonidin-O-glucuronide that was the main metabolite in plasma was by far the predominant component in urine accounting over 0–24 h for 1498 nmol of a total of 1672 nmol of anthocyanins excreted. This corresponds to 0·75 % of pelargonidin-3-O-glucoside intake. There is, therefore, no evidence of substantive post-absorption metabolism before excretion.
Concentration of a pelargonidin-O-glucuronide in the plasma of human subjects 0–24 h after the ingestion of 200 g of strawberries containing 222 μmol of pelargonidin-3-O-glucoside. Data expressed as mean values in nm with their standard error are depicted by vertical bars (n 8)(Reference Mullen, Edwards and Serafini7).

In an earlier feeding study with strawberries, Felgines et al. (Reference Felgines, Talavéra and Gonthier45) reported a urinary excretion equivalent to 1·8 % of the 179 μmol of ingested pelargonidin-3-O-glucoside, and this is similar to values obtained in a 15–60 μmol dose study with strawberries by Carkeet et al. (Reference Carkeet, Clevidence and Novotny46). These urinary recoveries are high for anthocyanins and suggest that pelargonidin-3-O-glucoside is absorbed more readily than other anthocyanins. In a separate human feeding study with 200 g of blackberries containing 960 μmol of cyanidin-3-O-glucoside, twelve anthocyanins were excreted including unmetabolised cyanidin-3-O-glucoside, a cyanidin-O-glucuronide and a peonidin-O-glucuronide in quantities equivalent to 0·16 % of intake(Reference Felgines, Talavéra and Texier47). This suggests that the 3′-hydroxy anthocyanin, pelargonidin-3-O-glucoside, while it is metabolised to fewer products, may be absorbed more readily than its 3′,4′-dihydroxy analogue, cyanidin-3-O-glucoside. However, the high cyanidin-3-O-glucoside content of the blackberry supplement may have had an impact on absorption and/or excretion. In the circumstances, it would be of interest to carry out a feeding study and to determine not only the urine but also the plasma anthocyanin profile after ingestion of blackberries and strawberries containing similar quantities of anthocyanins.
Blueberries and blackcurrants
Ingestion of a blueberry extract, containing 1·2 g of a complex array of anthocyanins, with a high-fat meal resulted in an increase in serum oxygen radical absorbance capacity, but not trolox equivalent antioxidant capacity, antioxidant activity 1 and 4 h after intake by human volunteers. This was associated with the appearance of trace levels of blueberry anthocyanins in serum, but as they accounted for only 0·002–0·003 % of intake, it appears unlikely that the anthocyanins themselves were directly responsible for the increase in antioxidant status(Reference Kay and Holub48, Reference Mazza, Kay and Cottrell49). In a separate human study, following consumption of a blueberry extract containing 439 mg of anthocyanins, trace quantities of unmetabolised anthocyanins corresponding to 0·02 % of intake were detected in urine collected over a 7 h post-ingestion period(Reference McGhie, Aingie and Barnet15). In another study, Wu et al. (Reference Wu, Cao and Prior50) fed 690 mg of blueberry anthocyanins to 60- to 70-year-old women, and total urinary excretion during the first 6 h after consumption was 23·2 μg, which is equivalent to 0·004 % of intake.
Human urinary excretion of blackcurrant anthocyanins, such as those from blueberry, is low with approximately 0·06 % of intake being recovered as unmetabolised native anthocyanins(Reference McGhie, Aingie and Barnet15). A similar recovery level in urine was reported with weanling pigs, but in this case, approximately 25 % of the anthocyanins were methyl and/or glucuronide metabolites(Reference Wu, Pittman and McKay42).
Stability of anthocyanins
A point of note is that anthocyanins are readily distinguished from other flavonoids as they undergo rearrangements in response to pH. The red flavylium cation predominates at pH 1–3, but as the pH increases to 4 and above, the colourless carbinol pseudobase is the major component along with smaller amounts of the colourless chalcone pseudobase and the blue quinoidal base (Fig. 9)(Reference Clifford51). Anthocyanins are traditionally extracted and analysed in acidic medium, as the red flavylium cation is the most stable form. However, it is not known what forms predominate in vivo. The limited available experimental evidence indicates that in the acidic conditions that prevail in the stomach, anthocyanins are in the red flavylium form, but once they enter the higher pH of the small intestine, the carbinol pseudobase is likely to predominate. It could be that the colourless carbinol pseudobase is the main form in the small intestine where it undergoes limited absorption, possibly being metabolised to conjugates that are overlooked because they cannot be converted to red flavylium forms before the eventual analysis. It is also possible that significant amounts of the carbinol pseudobase as well as the parent anthocyanin pass into the large intestine where degradation to phenolic acid occurs due to the action of colonic bacteria. As a further complication, anthocyanins also breakdown to phenolic acid and aldehyde constituents when subjected to simulated physiological conditions and during sample processing before analysis. In this regard, experiments with pelargonidin, cyanidin and delphinidin showed that increased B-ring hydroxylation is associated with decreased stability(Reference Woodward, Kroon and Cassidy52).
Effect of pH on the structure of anthocyanins.

Flavan-3-ols
Flavan-3-ol monomers
Although berries have been shown to contain ( − )-epicatechin and (+)-catechin(Reference Määttä-Riihinen, Kähkkönen and Törrönen53, Reference Crozier, Yokota, Jaganath, Crozier, Clifford and Ashihara54), they are relatively minor constituents and occur in much more substantial quantities in green tea, which, unlike berries, also contains (epi)gallocatechin and (epi)gallocatechn-3-O-gallates. Cocoa products also contain ( − )-epicatechin and (+)-catechin along with procyanidins, which can be sizable constituents in berries (Table 2). As a consequence, although there is information on the bioavailability of these compounds, it has been obtained in feeding studies with green tea and cocoa rather than berries.
In a recent bioavailability study, a drink made with 10 g of cocoa powder and 250 ml of hot water was consumed by human volunteers with plasma and urine being collected over the ensuing 24 h period(Reference Mullen, Borges and Donovan55). The drink contained 22·3 μmol of catechin, almost all of it as the less bioavailable ( − )-isomer(Reference Donovan, Crespy and Oliveira56), and 23·0 μmol of ( − )-epicatechin along with 70 mg of procyanidins, and after consumption, plasma and urine were collected over a 24 h period for analysis by HPLC–MS2. Two flavan-3-ol metabolites were detected in plasma, an O-methyl-(epi)catechin-O-sulphate and a (epi)catechin-O-sulphate. Both had a C max below 100 nm and a T max of < 1·5 h (Fig. 10), indicative of absorption in the small rather than the large intestine. In feeds with green tea containing higher levels of the flavan-3-ol monomers, the same (epi)catechin metabolites were detected along with a lower concentration of an (epi)catechin-O-glucuronide, possibly ( − )-epicatechin-3′-O-glucuronide(Reference Stalmach, Troufflard and Serafini57). In the cocoa study, the two sulphated flavan-3-ols were also the main metabolites in urine, which, in addition, contained smaller quantities of an (epi)catechin-O-glucuronide and an additional (epi)catechin-O-sulphate. The amount of flavan-3-ol metabolites excreted in urine over the 0–24 h collection period was 7·7 (sd 0·8) μmol. When calculated as a percentage of cocoa flavan-3-ols ingested, this is equivalent to 18·3 (sd 1·9) % of intake. This figure is probably nearer 30 % because almost half of the flavan-3-ol intake was ( − )-catechin which has reduced bioavailability(Reference Donovan, Crespy and Oliveira56), and as such is comparable with urinary (epi)catechin excretion levels obtained after the ingestion of cocoa(Reference Baba, Osakabe and Yasuda58) and green tea(Reference Stalmach, Troufflard and Serafini57, Reference Stalmach, Mullen and Steiling59). Despite this high level of excretion, indicative of substantial absorption into the circulatory system, the accompanying combined plasma C max value for the two sulphated cocoa flavan-3-ol metabolites was only 143 (sd 8) nm. This suggests that following absorption, the (epi)catechin metabolites are a state of flux and are rapidly turned over in the circulatory system and, rather than accumulating, are excreted via the kidneys. In the circumstances, urinary excretion provides a more realistic assessment of absorption than figures from plasma C max, but as this does not include the possibility of metabolites being sequestered in body tissues, this too is theoretically an under estimate of absorption, but to what degree remains to be determined. However, the fact that tissue sequestration has yet to be convincingly demonstrated suggests that it can only be at low levels, if at all.
Concentrations of (a) (epi)catechin-O-sulphate and (b) O-methyl-(epi)catechin-O-sulphate in the plasma of human subjects 0–8 h after the ingestion of 250 ml of a cocoa beverage containing 45 μmol of (epi)catechins. Data expressed as mean values in nm with their standard error depicted are by vertical bars (n 9). Note that no flavan-3-ols or their metabolites were detected in plasma collected 24 h after ingestion of the cocoa(Reference Mullen, Borges and Donovan55).

Studies with rats have led to suggestions that flavan-3-ol monomers may be removed from the bloodstream in the liver and returned to the small intestine in the bile(Reference Kida, Suzuki and Matsumoto60, Reference Kohri, Nanjo and Suzuki61). To what extent enterohepatic transport of flavan-3-ol metabolites occurs in human subjects remains to be established.
There are claims in the literature that flavan-3-ols are poorly bioavailable because of instability under digestive conditions with>80 % losses being observed with in vitro digestion models simulating gastric and small intestine conditions(Reference Zhu, Zhang and Tsang62–Reference Green, Murphy and Schulz65). It is clear that the data obtained in these investigations do not accurately reflect the in vivo fate of flavan-3-ols following ingestion, as they are at variance with the high urinary excretion observed in cocoa and green tea feeding studies(Reference Manach, Williamson and Morand32, Reference Stalmach, Troufflard and Serafini57), and also with the substantial recoveries of flavan-3-ols in ileal fluid after the consumption of a green tea infusion and Polyphenon E, a green tea extract, by human subjects with an ileostomy(Reference Stalmach, Mullen and Steiling59, Reference Auger, Hara and Crozier66).
Procyanidins
Procyanidins are major components in the human diet because of their widespread occurrence in fruits, berries nuts, beans, cocoa-based products, wine and beer(Reference Gu, Kelm and Hammerstone20). In vivo their consumption has been implicated in improved antioxidant status(Reference Packer, Rimbach and Virgili67), decreased DNA damage in human subjects(Reference Simonetti, Ciappellano and Gardana68), reduced development of aortic atherosclerosis(Reference Yamakoshi, Kataoka and Koga69) and delayed tumour production(Reference Bomser, Sinletary and Wallig70) in animal test systems. Because of these and other biological effects of procyanidins(Reference Williamson and Manach71), derived principally from the ingestion of grape seed extracts or consumption of cocoa-derived food stuffs rather than berries, information on the bioavailability of procyanidins and the compounds responsible for these effects in vivo is of importance.
There are numerous feeding studies with animals and human subjects indicating that polymeric procyanidins are not absorbed(Reference Espín, García-Conesa and Tomás-Barberán72). Most pass unaltered to the large intestine where they are catabolised by the colonic microflora yielding a diversity of phenolic acids(Reference Manach, Williamson and Morand32, Reference Déprez, Brezillon and Rabot73–Reference Appeldoorn, Vincken and Aura75) including 3-(3-hydroxyphenyl)propionic acid and 4-O-methyl-gallic acid(Reference Ward, Croft and Pudley76), which are absorbed into the circulatory system and excreted in urine. There is one report based on data obtained in an in vitro model of gastrointestinal conditions that procyanidins degrade yielding more readily absorbable flavan-3-ol monomers(Reference Spencer, Chaudry and Pannala77). Subsequent studies have not supported this conclusion(Reference Donovan, Manach and Rios78–Reference Tsang, Auger and Bornet80). There are two reports of minor quantities of procyanidin dimers B1 and B2 being detected in human plasma after the respective consumption of a grape seed extract(Reference Sano, Yamakoshi and Tokutake81) and a flavan-3-ol-rich cocoa(Reference Holt, Lazarus and Sullards82). In the latter study, the levels of the B2 dimer in plasma were approximately 100-fold lower than those of flavan-3-ols monomers.
The biological effects of procyanidins are generally attributed to their more readily absorbed colonic breakdown products, the phenolic acids, although there is a lack of detailed study in this area(Reference Donovan, Manach and Rios78). There is, however, a dissenting view as trace levels of procyanidins, in contrast to ( − )-catechin and (+)-epicatechin, inhibit platelet aggregation in vitro and suppress the synthesis of the vasoconstriction peptide, endothelin-1, by cultured endothelial cells(Reference Corder83). Supporting this view is a study in which individual procyandins were fed to rats after which dimers through to pentamers were detected in plasma, which had been extracted with 8 m-urea, rather than the more traditional methanol/acetonitrile. This, as it was proposed, prevented the irreversible binding of procyanidins to plasma proteins(Reference Shoji, Masumoto and Moriichi84). The procyanidins were, however, administered by gavage at an extremely high dose, 1 g/kg body weight, and it remains to be determined whether procyanidins can be similarly detected in urea-extracted plasma after the ingestion of more nutritionally relevant doses.
Ellagitannins
Studies into the bioavailability of ellagitannins following ingestion by human subjects have been carried out mainly with pomegranate, which contains punicalin and punicalagins (Fig. 6)(Reference Cerdá, Espín and Parra85–Reference Mertens-Talcott, Jilma-Stohlawetz and Rios87). However, the fate of ellagitannins in strawberries, raspberries, walnuts and oak-aged wines has also been investigated(Reference Cerdá, Tomás-Barberán and Espín88).
After drinking a pomegranate juice containing 318 mg of punicalagins, ellagic acid was detected in plasma with a C max of 60 nm at a T max of 0·98 h suggesting acid hydrolysis of at least some of the ellagitannins releasing free ellagic acid, which is absorbed directly from the stomach or the proximal small intestine(Reference Seeram, Henning and Zhang86). Also detected in the plasma of some but not all volunteers, mainly 6 h after supplementation, were urolithin A, urolithin A-3-O-glucuronide, urolithin B and a methylated urolithin B. Urinary metabolites that began to appear after 12 h included urolithin A-3-O-glucuronide, urolithin B-3-O-glucuronide and 3,8-O-dimethylellagic acid-2-O-glucuronide (Fig. 11), and excretion continued for up to a further 36 h. None of these compounds were quantified, and there was much subject-to-subject variation in the spectrum of metabolites produced. This implies that when the ellagitannins and/or ellagic acid reach the distal part of the small intestine and the colon, they are metabolised by the gut microflora producing urolithins A and B, which are then absorbed along with ellagic acid and subjected to the action of phase II UDP-glucuronosyltransferase and/or catechol-O-methyltransferases before being excreted in urine(Reference Seeram, Henning and Zhang86).
Structures of urolithins and related compounds.

In a separate study in which volunteers ingested 1 litre of pomegranate juice containing 4·37 g of punicalagins on a daily basis for 5 d, circulating urolithin levels reached a concentration of 18·6 μm(Reference Cerdá, Espín and Parra85). Feeding human subjects a single dose of strawberries, raspberries, walnuts and oak-aged red wine, all of which contain ellagitannins, resulted in excretion of urolithin A-3-O-glucuronide in quantities equivalent to 2·8 % (strawberries), 3·4 % (raspberries), 6·5 % (oak-aged red wine) and 16·6 % (walnuts) of intake(Reference Cerdá, Tomás-Barberán and Espín88).
The most detailed study on ellagitannins to date has been carried out with Iberian pigs, which in their natural habit feed on oak acorns which are a further source of ellagitannins(Reference Espin, González-Barrio and Cerdá89). The pigs were given an average of 4·04 kg of acorns on a daily basis for 117 d, after which tissues and body fluids were processed and analysed by HPLC–MS3. A total of thirty-one ellagitannin-derived metabolites were detected, including twenty-five urolithin and six ellagic acid derivatives. A summary of the complex picture that emerges is that in the jejunum, the acorn ellagitannins release ellagic acid which the intestinal microflora metabolise sequentially producing urolithin D, urolithin C, urolithin A and urolithin B. These urolithins are absorbed preferentially as their lipophilicity increases, with plasma containing mainly urolithin A-3-O-glucuronide and urolithin B-3-O-glucuronide with traces of an urolithin C-O-glucuronide and 3,8-O-dimethylellagic acid-2-O-glucuronide (Fig. 11). The urolithin A and C glucuronides were the major components in urine. Among the twenty-six conjugated metabolites detected in bile were substantial quantities of urolithin A, C and D derivatives as well as glucuronides and methyl glucuronides of ellagic acid. This indicates extensive hepatic metabolism and active enterohepatic circulation, and also explains the persistence of urinary urolithin metabolites observed in the human studies. No ellagitannins or their metabolites were detected in body tissues outside the gastrointestinal tract, which is interesting as the meat and fat of Iberian pigs fed on acorns are resistant to rancidity(Reference Espin, González-Barrio and Cerdá89). Perhaps this may be attributable to other potential ellagitannin colonic breakdown products such as phenolic acids, which have yet to be investigated.
Other flavonoids
Berries also contain a variety of mono-, di- and trisaccharide flavonol conjugates (Table 1), none in especially high concentrations, and there are few, if any, human studies on the bioavailability of berry flavonols. Investigations with other products, such as onions that contain substantial amounts of flavonols, indicate that quercetin-O-glucosides are hydrolysed by lactase phloridizin hydrolase and/or cytosolic β-glucosidase in the small intestine, and that the released aglycone is subjected to the action of sulphotransferases, UDP-glucuronosyltransferases and catechol-O-methyltransferases before entry into the circulatory system with sub μm C max concentrations of a number of metabolites including quercetin-3′-O-sulphate, quercetin-3-O-glucuronide and isorhmanetin-3-O-glucuronide appearing in plasma with a T max of < 1·0 h (Fig. 12). The profile of urinary metabolites is markedly different to that in plasma, indicating that phase II metabolism is operative. Overall excretion of metabolites is equivalent to approximately 4 % of the 275 μmol intake of flavonol-O-glucosides(Reference Mullen, Edwards and Crozier33).
Concentration of (a) quercetin-3′-O-sulphate, quercetin-3-O-glucuronide, (b) isorhamnetin-3-O-glucuronide and other quercetin-derived metabolites in plasma from human volunteers collected 0–6 h after the ingestion of 270 g of lightly fried onions containing 143 μmol of quercetin-4′-O-glucoside and 107 μmol of quercetin-3,4′-O-diglucoside along with trace levels of other flavonol-O-glucosides. Data expressed as mean values in nm with their standard error are depicted are by vertical bars (n 6). Note that these metabolites were not detected in plasma collected 24 h after supplementation(Reference Mullen, Edwards and Crozier33).

Feeding studies with tomato juice containing 176 μmol quercetin-3-O-rutinoside have shown that quercetin-3-O-glucuronide and isorhamnetin-3-O-glucuronide appear in plasma with a T max of approximately 5 h and low nm C max values approximately 25-fold lower than in the onion study (Fig. 13) (Reference Jaganath, Mullen and Edwards29). The extended C max is in keeping with absorption in the large intestine rather than the small intestine. The absence of quercetin-3′-O-sulphate in plasma, which was the main metabolite to accumulate in the onion feed, suggests that sulphation of quercetin is restricted to the small intestine. The excretion of metabolites, where there was also an absence of sulphates, after ingestion of the tomato juice ranged from 0·02 to 2·8 % of quercetin-3-O-rutinoside intake, which probably reflects marked variations in the colonic microflora of the individual volunteers. Urine collected 0–24 h after tomato juice intake also contained 3,4-dihydroxyphenylacetic acid, 3-hydroxyphenylacetic acid and 3-methoxy-4-hydroxyphenylacetic acid in amounts equivalent to 22 % of quercetin-3-O-rutinoside intake. These phenolic acids probably originate from colonic bacteria-mediated deglycosylation of the rutinoside and ring fission of the released quercetin followed by the conversions illustrated in Fig. 14, some of which appear to be a consequence of phase II metabolism in the liver before excretion. Confirmation of large intestine absorption was obtained by feeding the tomato juice to volunteers with an ileostomy. Unlike the healthy subjects with a functioning colon, neither plasma nor urinary metabolites/catabolites were detected, and ileal fluid contained 86 % of the ingested quercetin-3-O-rutinoside(Reference Jaganath, Mullen and Edwards29).
Concentration of quercetin-3-O-glucuronide (–♦–) and isorhamnetin-3-O-glucuronide (–■–) in the plasma of human subjects 0–8 h after the consumption of tomato juice containing 176 μmol of quercetin-3-O-rutinoside. Data expressed as mean values in nm with their standard error are depicted by vertical bars (n 6). Note that neither metabolite was detected in plasma collected 24 h after supplementation(Reference Jaganath, Mullen and Edwards29).

Proposed pathway for the bacterial-mediated catabolism of quercetin-3-O-rutinoside in the large intestine resulting in the production of 3,4-dihydroxyphenylacetic acid and smaller quantities of 3-hydroxyphenylacetic acid with the subsequent hepatic conversion of 3,4-dihydroxyphenylacetic acid to 3-methoxy-4-hydroxyphenylacetic acid before urinary excretion. ![]() , minor pathway(Reference Jaganath, Mullen and Edwards29).
, minor pathway(Reference Jaganath, Mullen and Edwards29).

Although not found in berries, hesperetin-7-O-rutinoside, a flavanone conjugate, is consumed widely by the general public because of its occurrence in citrus products. Following ingestion of orange juice containing 168 μmol of hesperetin-7-O-rutinoside, hesperetin-7-O-glucuonide and an unassigned hesperetin-O-glucuronide appeared in plasma with a combined C max of 922 nm and a T max of 4·4 h (Fig. 15)(Reference Mullen, Archeveque and Edwards90). Like the quercetin-3-O-rutinoside feed, the T max implies absorption in the large intestine, but the C max is 50-fold higher than that of the quercetin metabolites. Hesperetin metabolite excretion in urine corresponded to 6·5 % of the ingested hesperetin-7-O-rutinoside. Overall, the data suggest that hesperetin-7-O-rutinoside is absorbed in the large intestine more effectively than quercetin-3-O-rutinoside. This may be a consequence of the hesperetin-7-O-rutinoside being converted to glucuronides more efficiently than quercetin-3-O-rutinoside, arguably because the aglycone is less prone to degradation by the colonic microflora.
Combined concentration of hesperetin-7-O-glucuronide and an unassigned hesperetin-O-glucuronide in the plasma of human subjects 0–24 h after ingesting 250 ml of orange juice containing 168 μmol of hesperetin-7-O-rutinoside. Data expressed as mean values in nm with their standard error are depicted by vertical bars (n 8)(Reference Mullen, Archeveque and Edwards90).

Manach et al. (Reference Manach, Williamson and Morand32) provide additional information on the bioavailability of other flavonoids and related compounds, while more recent data on apple dihydrochalcones, soya isoflavones, and green tea (epi)gallocatechins and their 3-O-gallate derivatives, none of which occur in berries, are reviewed by Crozier et al. (Reference Crozier, Jaganath and Clifford23).
Matrix effects
Although flavonoids and related compounds are typically consumed as part of a meal, there is surprisingly little information on how their bioavailability is affected by the other components in the diet. The limited data that are available, some of them obtained with berries, indicate that in many instances, simultaneous intakes with foods can affect the absorption and excretion of flavonoids.
It has been shown in a study with both rats and human subjects that phytic acid (myo-inositol hexaphosphate), a component of hulls of nuts, seeds and grain(Reference Dendougui and Schwedt91), increases the bioavailability of blackcurrant anthocyanins(Reference Matsumoto, Ito and Yonekura92). Urinary recovery of the anthocyanins from rats was enhanced 5·8-fold by co-ingestion with a 1 % solution of phytic acid, which reduced gastrointestinal mobility and slowed the passage of the anthocyanins through the stomach, duodenum and jejunum, presumably thereby providing a longer time frame for the absorption of anthocyanins. Human plasma and urinary anthocyanin levels were also enhanced by phytic acid. The peak excretion was delayed until 4–8 h post-ingestion, and the recovery of anthocyanins increased 4·5-fold.
Walton et al. (Reference Walton, Lentle and Reynolds93) fed male pigs blackcurrant anthocyanins at a dose of 100 mg/kg body weight with (1) sugar and water, (2) a cereal (Weet-Bix), milk and sugar and (3) Weet-Bix, milk, sugar and quercetin-3-O-rutinoside (93 mg/kg), after which plasma was collected at intervals over an 8 h period. The main anthocyanins in the extract fed to the pigs were delphinidin-3-O-rutinoside and cyanidin-3-O-rutinoside with smaller amounts of delphinidin-3-O-glucoside and cyanidin-3-O-glucoside. The rutinosides were detected in plasma along with large amounts of two putative metabolites seemingly derived from delphinidin-3-O-glucoside and cyanidin-3-O-glucoside. As shown in Table 3, the addition of the cereal and milk to the matrix did not affect the anthocyanin plasma C max or 0–8 h area under the curve values, but it did extend T max from 2 to 4 h. The presence of quercetin-3-O-rutinoside along with the cereal and milk did not impact on the anthocyanin pharmacokinetic profile, indicating that there was no apparent competition for absorption between the anthocyanin rutinosides and glucosides and the flavonol rutinoside. The ferric reducing ability/power antioxidant capacity of the plasma increased significantly 8 h after the blackcurrant anthocyanin intake, at which point plasma anthocyanin levels had declined substantially from their C max values. This suggests that other components rather than the anthocyanins themselves were responsible for the rise in antioxidant capacity.
(Mean values and standard deviations)
C max, peak plasma concentration; T max, maximum time; AUC, area under the curve; Q-O-R, quercetin-3-O-rutinoside.
There is also a report on a study in which blackcurrant anthocyanins were fed to rats by gavage at a dose of 250 mg/kg in acidified water with and without oatmeal(Reference Walton, Hendriks and Broomfield94). The native blackcurrant 3-O-glucosides and rutinosides of delphinidin and cyanidin appeared in plasma and were also present in urine along with several additional, partially identified methylated and diglucuronide metabolites. The oatmeal significantly reduced the anthocyanin plasma C max from 0·37 to 0·20 μm, increased the T max from 0·25 to 1·0 h and delayed maximum urinary excretion from 2 to 3 h. In contrast, a study with human subjects found that rice cake did not affect the absorption and excretion of blackcurrant anthocyanins(Reference Neilsen, Dargste and Rav-Haren95).
Ingestion of 200 g of strawberries with 100 ml of double cream by human subjects did not have a significant impact on the plasma C max of a pelargonidin-O-glucuronide compared to when only strawberries were consumed, but it did extend the T max from 1·1 to 2·4 h. The overall 0–24 h urinary excretion of the glucuronide and other minor pelargonidin metabolites over a 24 h period was not affected by cream. However, anthocyanin excretion was delayed with 0–2 h excretion being lower and 5–8 h excretion being higher when the strawberries were eaten with cream. Measurement of plasma paracetamol and breath hydrogen revealed that these effects were due to cream delaying gastric emptying and extending mouth to caecum transport time(Reference Mullen, Edwards and Serafini7).
When orange juice containing 168 μmol of hesperetin-7-O-rutinoside, which is absorbed in the large intestine, was consumed by human subjects with and without 150 ml of a full-fat yogurt, the yogurt did not have a significant impact on the hesperetin-O-glucuronide plasma pharmacokinetics. Flavanone metabolite excretion 0–5 h after drinking the orange juice was reduced by yogurt, but not over the full 24 h collection period(Reference Mullen, Archeveque and Edwards90). Analysis of phenolic acids excreted in urine in the present study did, however, reveal an effect of yogurt(Reference Roowi, Mullen and Edwards30). When only orange juice was ingested, deglycosylation of hesperetin-7-O-rutinoside and colonic bacteria-mediated ring fission of the released aglycone resulted in 0–24 h urinary excretion of 62 μmol of 3-hydroxyphenylhydracrylic acid and 3-methoxy-4-hydroxyphenylhydracrylic acid of undetermined chirality, 3-hydroxyphenylacetic acid, dihydroferulic acid and 3-hydroxyhippuric acid. This corresponds to 37 % of hesperetin-7-O-rutinoside intake. When the orange juice was consumed with the yogurt, excretion of phenolic acid fell back markedly to a baseline level of 9·3 μmol. This effect was not due to a slowing of the mouth to caecum transit time, as measured with breath hydrogen production, so would appear to be a consequence of an as yet undetermined effect of the yogurt on the colonic microflora-mediated catabolism of hesperetin-7-O-rutinoside to phenolic acids.
Milk is reported to impair increases in plasma antioxidant activity occurring after the ingestion of blueberries by human subjects(Reference Serafini, Testa and Villaño96). Other work on milk and matrix effects has centred on cocoa-based products and the impact of milk on flavan-3-ol bioavailability. In 2003, Serafini et al. (Reference Serafini, Bugianesi and Maiaini97) reported that although consumption of 100 g of dark chocolate brought about an increase in human plasma antioxidant capacity, this effect was substantially reduced when the chocolate was ingested with 200 ml of milk, and no increase in antioxidant capacity was observed after eating milk chocolate. They also showed that the absorption of ( − )-epicatechin from chocolate was reduced when consumed with milk or as milk chocolate. It was hypothesised that proteins in the milk bind to the flavan-3-ols and limit their absorption from the gastrointestinal tract(Reference Serafini, Bugianesi and Maiaini97). This report generated much controversy(Reference Halliwell98) with another group, which carried out experiments with a flavan-3-ol-rich cocoa drink, publishing a reply disputing any impact of milk on plasma antioxidant capacity and ( − )-epicatechin absorption(Reference Schroeter, Holt and Orozco99, Reference Serafini and Crozier100). Two more recent studies have shown that drinking a cocoa beverage with milk does not affect plasma flavan-3-ol monomer levels(Reference Keogh, McInerney and Clifton101) or the quantity of flavan-3-ol metabolites excreted in urine(Reference Roura, Andrès-Lacueva and Estruch102, Reference Roura, Andrès-Lacueva and Estruch103).
In a recent study by Mullen et al. (Reference Mullen, Borges and Donovan55), human volunteers drank 250 ml of a commercial cocoa made with either hot milk or hot water. Both drinks contained 45 μmol of flavan-3-ol monomers. Milk did not have a significant effect on either the plasma C max or T max of sulphated and methylated (epi)catechin metabolites, but did bring about a reduction in (epi)catechin metabolites in 0–24 h urine from a level equivalent to 18·3 % of intake to 10·5 %. This was not due to the effects of milk on either gastric emptying or on the time for the head of the meal to reach the colon ruling out the possibility that milk slowed the rate of transport of the meal through the gastrointestinal tract. The reduced excretion of the flavan-3-ol metabolites is probably a consequence of components in the milk, which either bind directly to flavan-3-ols or interfere with the mechanism involved in their transport across the wall of the small intestine into the portal vein.
The findings of the present study contrast with reports that milk does not affect the absorption of flavan-3-ols. These include a study by Roura et al. (Reference Roura, Andrès-Lacueva and Estruch102), which monitored flavan-3-ol metabolites in urine after drinking of cocoa containing 128 μmol of flavan-3-ol monomers, a threefold higher quantity than the 45 μmol ingested in the Mullen et al. study(Reference Mullen, Borges and Donovan55). It is, however, interesting to note that although NS, urinary excretion in the study of Roura et al. was 20 % lower with cocoa milk compared with cocoa water. Keogh et al. (Reference Keogh, McInerney and Clifton101) who analysed plasma 0–8 h after the consumption of a flavan-3-ol-rich cocoa drink also reported that milk had no effect on the absorption of catechin and epicatechin. In this instance, the ingested dose of flavan-3-ol monomers was 2374 μmol – 53-fold higher than in the Mullen et al. study. This high dose is reflected in a C max of approximately 12 μm compared with the approximately 150 nm in the Mullen et al. study. Schroeter et al. (Reference Schroeter, Holt and Orozco99) reported that milk did not influence plasma epicatechin after consumption of a cocoa beverage, which in this instance was consumed at a dose of 1314 μmol of flavan-3-ol monomers for a 70 kg human.
There is an explanation for these seemingly contradictory reports. It would appear that with high flavan-3-ol cocoas, which are principally research products, the factors in milk that reduce absorption have minimal overall impact. With drinks with a lower flavan-3-ol content, such as the one used in the Mullen et al. study(Reference Mullen, Borges and Donovan55), which is typical of many commercial cocoas that are on supermarket shelves(104) and available to the general public, milk would appear to have the capacity to interfere with absorption. Interestingly, there has been a parallel debate and seemingly conflicting reports about the impact of milk on plasma flavan-3-ol and antioxidant levels after the consumption of black tea(Reference Miller, Hurst and Payne104–Reference Leenen, Roodenburg and Tijburg108).
Evidence for the accumulation of polyphenol metabolites in body tissues
As will be discussed later, there is evidence from a number of sources that consumption of berry extracts can delay the decline of various aspects of cognitive function in elderly rats(Reference Willis, Shukitt-Hale and Joseph109). There is, however, contradictory evidence as to whether flavonoids themselves cross the blood–brain barrier. In one of the early studies, Andres-Lacueva et al. (Reference Andres-Lacueva, Shukitt-Hale and Galli110) detected trace levels of several anthocyanins in the brains of rats that had received a diet supplemented with a blueberry extract, containing unspecified amounts of anthocyanins, for a period of 10 weeks.
In a further study, 18 h after feeding pelargonidin to rats by gavage at a dose of 50 mg/kg, the unmetabolised anthocyanidin was detected in the brains at a concentration of approximately 0·2 nmol/g (fresh weight)(Reference El Mohsen, Marks and Kuhnle111). In contrast, anthocyanins did not accumulate in detectable amounts in the brains of rats obtained up to 24 h after acute supplementation by gavage with 2·8 ml of raspberry juice, which is a nutritional relevant dose as it is equivalent to a 70 kg human drinking 700 ml of juice(Reference Borges, Roowi and Rouanet112). In contrast, following a 4-week supplementation of pigs with a blueberry extract, containing undefined amounts of anthocyanins, 300 pg of anthocyanins/g was detected in cerebellum tissue and 700 pg of anthocyanins/g was detected in eye tissue. Anthocyanins, however, were also found in the tissues of pigs that did not receive the blueberry supplement(Reference Kalt, Blumber and McDonald113). In another study, oral ingestion of 100 mg/kg of blackcurrant anthocyanins by rats resulted in a plasma anthocyanin C max of 1·9 μg/ml 30 min after ingestion and a maximum concentration of anthocyanins in the whole eye of 115 ng/g, also after 30 min(Reference Matsumoto, Nakamura and Iida114). However, in a study with male mice, feeding a bilberry extract for 2 weeks resulted in the accumulation of anthocyanins in detectable amounts in plasma, liver, kidney, testes and lungs, but not in other tissues including the brain and eyes(Reference Sakakibara, Ogawa and Koyanagi41).
One of the possible reasons for the seemingly contradictory data obtained in these studies could be the use of extracts containing very high amounts of anthocyanins that could not possibly be ingested as part of a normal berry-based diet. In a recent study, where this was not the case, greenfinches consumed one blackberry per day for a period 14 d, and approximately 18 h after the last feed, the birds were killed, and the brain was removed and extracted. Analysis of the extracts by HPLC with high-resolution MS revealed the presence of unmetabolised cyandin-3-O-glucoside in amounts ranging from 12 to 148 pmol/brain with an average of 40 (sd 16) pmol(Reference Mullen, Larcombe and Arnold115).
As far as localisation of other flavonoids within the body is concerned, acute supplementation of rats with (2-14C)quercetin-4′-O-glucoside did not result in the accumulation of any radioactivity in the brain(Reference Mullen, Rouanet and Auger116). In a human study in which volunteers drank 250 ml of green tea containing 505 μmol of flavan-3-ol monomers, typical (epi)catechin and (epi)gallocatechin metabolites were detected in plasma 2 h after ingestion, but they were not present in cerebrospinal fluid collected 2 h later(Reference Zini, Del Rio and Stewart117).
Recent elegant immunohistochemical studies have established that quercetin-3-O-glucuronide, one of the main quercetin metabolites in the circulatory system(Reference Mullen, Edwards and Crozier33), accumulates in macrophage-derived foam cells of human atherosclerotic lesions, but not in the normal aorta(Reference Kawa, Nishikawa and Shiba118). In vitro experiments with murine macrophage cell lines showed that quercetin-3-O-glucuronide was taken up and deconjugated to its more bioactive aglycone quercetin, which was in turn partially converted to a methylated metabolite. In addition, mRNA expression of the class A scavenger receptor and CD36, which play key roles in the formation of foam cells, was suppressed by treatment with quercetin-3-O-glucuronide(Reference Kawa, Nishikawa and Shiba118). Likewise, immunohistochemical studies have also shown that ( − )-epicatechin-3-O-gallate, a constituent of green tea that appears in plasma in trace amounts after ingestion(Reference Stalmach, Mullen and Steiling59), is also specifically localised in macrophage-derived foam cells and similarly suppresses gene expression of CD36(Reference Kawa, Tanaka and Murota119). These findings provide novel insights into the bioavailability of dietary flavonoids and their potential mechanism in the prevention of CVD.
Biological effects of phenolics: in vitro studies with the right molecules
Investigations of bioactivity with human or animal cell lines have made extensive use of both flavonoid aglycones and their sugar conjugates, the latter being the typical form in which they exist in planta (Reference Del Rio, Costa and Lean120). The concentrations at which these compounds are assayed is usually in the low μm to mm range(Reference Hsu, Tsang and Lin121). However, as outlined in the earlier section on bioavailability, following ingestion, dietary flavonoids and related polyphenols appear in the circulatory system not as the parent compounds but as glucuronide, methyl and sulphate metabolites, and that their concentrations in plasma after a normal dietary intake rarely exceed nm levels(Reference Crozier, Jaganath and Clifford23). Therefore, when reviewing data on in vitro bioactivity experiments, the focus will be on studies describing the effects of metabolites that appear in the human circulatory system after the intake of dietary-relevant doses of berry-derived products.
As discussed earlier, substantial quantities of flavonoids are not absorbed in the small intestine but pass to the colon where they are degraded by the action of the microbiota. Quercetin-3-O-rutinoside, for instance, undergoes C-ring fission with quercetin producing a range of urinary catabolites such as 3,4-dihydroxyphenylacetic acid, 3-hydroxyphenylacetic acid and 4-hydroxy-3-methoxyphenylacetic acid (Fig. 14)(Reference Jaganath, Mullen and Edwards29), some of which have lower antioxidant activity than quercetin. The same holds true for colonic degradation products of phloretin-2′-O-glucoside and 5-O-caffeoylquinic acid(Reference Bellion, Hofmann and Pool-Zobel122). In a study with faecal incubations, the rutinose moiety was cleaved from quercetin-3-O-rutinoside, and the released quercetin degraded by the pathways proposed in Fig. 16(Reference Jaganath, Mullen and Lean123). In the ferric reducing ability/power assay, the main catabolite 3,4-dihydroxyphenylacetic acid exhibited similar reducing activity to quercetin, while the other catabolites either exhibited lower reducing activity or were inactive (Table 4). The ferric reducing ability/power assay is one of the numerous methods for measuring the antioxidant activity of a molecule. To further investigate the free radical scavenging properties of the catabolites, faecal samples were analysed using the trolox equivalent antioxidant capacity test system(Reference Pellegrini, Del Rio and Colombi124). 3,4-Dihydroxyphenylacetic acid was similarly active in this assay, but alphitonin, taxifolin and 3,4-dihydroxybenzoic acid also showed a sizable radical scavenging activity(Reference Jaganath, Mullen and Lean123). The difference in responses of the two assays lies in their different chemical mechanisms. The trolox equivalent antioxidant capacity assay is based on the ability of antioxidant molecules to quench the long-lived 2,2′-azinobis(3-ethylbenzothiazoline 6-sulfonate) radical, a blue-green chromophore with characteristic absorption at 734 nm, compared with that of Trolox, a water-soluble vitamin E analogue. This method is able to consider the antioxidant activity of both lipophilic and hydrophilic antioxidant molecules. The ferric reducing ability/power method is based on the reduction of the Fe3+–2,4,6-tripyridyl-S-triazine complex to the ferrous form at low pH. This method measures the reducing ability of molecules in the sample, a feature which is directly associated to antioxidants.
Proposed routes for the catabolism of quercetin-3-O-rutinoside during in vitro incubation with human faecal slurries under anaerobic conditions(Reference Jaganath, Mullen and Lean123).

(Mean values with their standard errors, n 3)
a,b Mean values with unlike superscript letters are significantly different (P < 0·01).
The bioactivity of ellagitannins and ellagic acid and their colonic-derived catabolites, urolithins, has been assessed in a number of test systems. In a human colon cancer cell line, urolithin A and urolithin B, at concentrations achievable from a dietary intake in the lumen, influenced the expression levels of both signalling genes, such as growth factor receptors, oncogenes and tumour suppressors, and genes involved in cell cycle. This effect can be linked to cancer prevention in epithelial cells lining the colon(Reference González-Sarrías, Azorín-Ortuño and Yáñez-Gascón125). In a similar cell model, urolithins A and B induced the expression and activity of phase I and II enzymes including cytochrome P450 monooxygenase 1A1 and UDP-glucuronosyltransferase 1A10, and inhibited several sulphotransferases(Reference González-Sarrías, Espín and Tomás-Barberán126).
In a well-known rat model of inflammatory bowel disease, urolithins A and B reduced a number of inflammation markers (i.e. inducible nitric oxide synthase, cyclo-oxygenase-2, PGE synthase and PGE2 in colonic mucosa), favourably modulated the gut microbiota, preserved colonic architecture, but failed to decrease oxidative stress in plasma and colon mucosa(Reference Larrosa, González-Sarrías and Yáñez-Gascón127). Interestingly, in the same study, the formation of urolithins from punicalagin in rats fed a pomegranate extract was prevented by inflammation, suggesting that urolithin A, in particular, could be an active anti-inflammatory compound in healthy subjects, but that other molecules, arguably punicalagin, could be responsible for anti-inflammatory activity when a pathological condition appears.
To extend these observations, several polyphenol colonic catabolites were tested in human neuronal cell cultures (human neuroblastoma SK-N-MC) exposed to low or high levels of oxidative stress induced, respectively, by 2 and 20 μm concentrations of 2,3-dimethoxy-1,4-naphthoquinone(Reference Pellacani, Calani and Caglieri128). In general, the tested catabolites were more protective when cells were exposed to the lower physiological level of oxidative stress. When the stronger oxidative stress was applied, mimicking pathological conditions, the catabolites provided only minimal protection of neurons. The most effective tested compounds were urolithin B, closely followed by urolithin A and 1,2,3-trihydroxybenzene (pyrogallol). These results suggest that polyphenol catabolites can be protective against mild oxidative stress of neuronal cells, whereas their benefits are strongly reduced when the stress increases above physiological levels. This observation leads to the consideration of dietary polyphenols as putative preventive rather than therapeutic components. However, as discussed previously, studies have only recently begun to consider if flavonoids and their metabolites present in the bloodstream are able to reach the central nervous system by crossing the blood–brain barrier and the experimental conditions are not always adequate(Reference Youdim, Shukitt-Hale and Joseph129). Evaluating the ability of phenolic catabolites to permeate the blood–brain barrier in a proper model would be a significant step forward in the study of the effects of polyphenols on the central nervous system.
Larrosa et al. (Reference Larrosa, Luceri and Vivoli130) investigated the anti-inflammatory properties of eighteen polyphenol metabolites, derived from colon microbiota. Among them, dihydrocaffeic acid, dihydroferulic acid and 3,4-dihydroxyphenylacetic acid significantly inhibited PGE2 production by CCD-18 colon fibroblast cells stimulated with IL-1β. Inflammatory bowel diseases are very diffused pathologies in the Western world and are significantly influenced by the diet. In the aetiology and pathogenesis of Inflammatory bowel disease, an imbalance of proinflammatory cytokines seems to be involved, playing an important role in modulating inflammation. If the observations of Larrosa et al. are confirmed in clinical trials, polyphenol-rich foods or phenolic acid supplements may have potential therapeutic and/or preventive applications in Inflammatory bowel disease.
Regarding anthocyanins that occur universally in berries, the knowledge of their in vivo colonic catabolism is, as yet, limited. They appear to be poorly absorbed in the small intestine, so significant amounts probably pass into the large intestine where bacterial degradation occurs. There are reports that cyanidin-based anthocyanins undergo cleavage of the sugar moiety followed by ring fission of the released cyanidin, which produces 3,4-dihydroxybenzoic acid (protocatechuic acid)(Reference Aura, Martin-Lopez and O'Leary131–Reference Galvano, Vitaglione and Li Volti133). In one study, 3,4-dihydroxybenzoic acid effectively decreased apoptosis of cultured neural stem cells reducing the reactive oxygen species and significantly suppressing the caspase cascade(Reference Guan, Ge and Liu134). 3,4-Dihydroxybenzoic acid was also able to suppresses (1-methyl-4-phenylpyridinium)+-induced mitochondrial dysfunction and apoptotic cell death in PC12 cells, showing a potential clinical application to counteract neurodegeneration such as in Parkinson's disease(Reference Guan, Jiang and Bao135). Finally, 3,4-dihydroxybenzoic acid was reported to be a strong apoptosis inducer in gastric adenocarcinoma cells(Reference Lin, Chen and Huang136). However, the concentration of 3,4-dihydroxybenzoic acid used in cell cultures in these studies vastly exceeded the levels likely to be attained in vivo (Reference Vitaglione, Donnarumma and Napolitano132), making at least the real effect of this anthocyanin catabolite questionable.
Biological effects of phenolics: in vivo studies in animal models
Evaluating the bioactivity of flavonoids and related compounds in feeding studies with animal models is a further step in attempting to unravel their putative beneficial effects. Such ‘black box’ experiments are designed to ascertain physiological effects exerted by the ingested compound(s) and do not provide information of the in vivo bioactive metabolites that reach target tissues or their mode of action in the induction of protective effects. Although there are few comparative studies, metabolism of ingested flavonoids is not necessarily the same in animal models as it is in human subjects, and frequently the dosages used in such studies are untranslatable to a regular human dietary regimen. Berries and berry-derived polyphenolic compounds have been widely investigated in animal models, and reported bioactivities include delayed cognitive decline, chemoprevention, improved cardiovascular health and reduced risk of metabolic disease.
Anthocyanin-rich extracts from bilberry, chokeberry and grape were fed for 14 weeks to male rats treated with a colon carcinogen, azoxymethane(Reference Lala, Malik and Zhao137). The number and multiplicity of colonic aberrant crypt foci, colonic cell proliferation, urinary levels of oxidative DNA damage and expression of cyclo-oxygenase genes were measured as biomarkers of colon cancer. The lower levels of these specific biomarkers in treated rats with respect to controls suggest a protective role of berry extracts in colon carcinogenesis and indicate multiple mechanisms of action.
Oesophageal cancer was also studied in detail in relation to berry phenolics. After 25 weeks of treatment, black raspberries, blackberries and strawberries were found to inhibit the number of oesophageal tumours (papillomas) in N-nitrosomethylbenzylamine-treated rats by 24–56 % relative to control animals(Reference Stoner, Chen and Kresty138). A possible mechanism of action was related to berries influencing the metabolism of N-nitrosomethylbenzylamine leading to reduced DNA damage. In the same study, berries were found to be able to inhibit not only initiation but also tumour promotion and progression. This was probably achieved by a reduction in the premalignancy growth rate through a mechanism involving down-regulation of cyclo-oxygenase-2. In a similar study from the same group, black raspberries were able to reduce mRNA and protein expression levels of cyclo-oxygenase-2, inducible nitric oxide synthase, and c-Jun, as well as the level of PGE2 in preneoplastic lesions of the oesophagus(Reference Chen, Hwang and Rose139). Black raspberries were also able to suppress the development of N-nitrosomethylbenzylamine-induced tumours in the rat oesophagus when administered as either a 5 % freeze-dried powder, an anthocyanin-rich fraction or an ethanol-based organic solvent-soluble extract(Reference Wang, Hecht and Carmella140). An organic-insoluble fraction was also effective, suggesting that non-anthocyanin components also contribute to chemoprevention.
Other type of tumours have also been studied in relation to berry supplementation in animal models. A dose-dependent decrease in haemangioendothelioma tumour size was observed in mice receiving daily oral gavage of a blueberry extract(Reference Gordillo, Fang and Khanna141). Prasain et al. (Reference Prasain, Jones and Moore142) reported that cranberries induced a dose-dependent reduction in the number of urinary bladder cancers in female Fischer-344 rats. The efficacy of dietary berries and ellagic acid to reduce oestrogen-mediated mammary tumourigenesis has also been investigated(Reference Aiyer, Srinivasan and Gupta143). No differences were found in tumour incidence. However, compared with the control group, ellagic acid and black raspberries significantly reduced tumour size by 75 and 69 %, and tumour multiplicity by 44 and 37 %, respectively. In contrast, consumption of blueberries resulted in a 40 % reduction in tumour size but did not impact on the number of tumours.
Berries have been reported to play a major role in the prevention and attenuation of CVD. The putative mechanisms of action may be related to their ability to reduce oxidation of lipoproteins, improve serum lipid profiles and mitigate against the effects of oxidative stress and inflammation in the vascular system. Ahmet et al. (Reference Ahmet, Spangler and Shukitt-Hale144) recently reported that a blueberry-enriched diet protected the myocardium of young male Fischer-344 rats against induced ischaemic damage and demonstrated the potential to attenuate the development of post-myocardial infarction chronic heart failure. Very similar results had previously been obtained by Toufektsian et al. (Reference Toufektsian, de Lorgeril and Nagy145), who fed male Wistar rats an anthocyanin-rich diet for a period of 8 weeks. The hearts of these rats were more resistant to regional ischaemia and reperfusion insult ex vivo. With an in vivo model of coronary occlusion and reperfusion, infarct size was reduced compared to the anthocyanin-free diet. A parallel increase in myocardial glutathione levels indicates that anthocyanins or anthocyanin-derived products may modulate cardiac antioxidant defences. In male Sprague–Dawley rats, an anthocyanin-rich supplement significantly reduced brain infarct volume after focal cerebral ischaemic injury, and a putative mechanism was related to interaction of phenolic compounds with phospho-c-Jun N-terminal kinase and the p53 signalling pathway(Reference Shin, Park and Kim146). In a previously cited study, 3,4-dihydroxyphenylacetic acid, dihydrocaffeic acid and dihydroferulic acid were tested for anti-inflammatory effects in a rodent model(Reference Larrosa, Luceri and Vivoli130). These colon-derived catabolites were able to reduce the expression of the cytokines IL-1β, IL-8 and TNF-α. However, once again, in most of these experiments, the dose that the animals received vastly exceeded a physiologically relevant dietary amount making it impossible to translate the observed beneficial effects to human subjects.
The effects of raspberry, strawberry and bilberry juices on early atherosclerosis in hamsters have been investigated with the animals receiving a daily dose corresponding to the consumption of 275 ml of juice by a 70 kg human(Reference Rouanet, Décorde and Del Rio16). After 12 weeks on atherogenic diet, the berry juices inhibited aortic lipid deposition by approximately 90 % (Fig. 17) and triggered reduced activity of hepatic antioxidant enzymes, which was not accompanied by lowered plasma cholesterol. The features and progression of the lesions observed in the hamster model of atherosclerosis are morphologically similar to atheromatous lesions observed in human subjects(Reference Yamanouchi, Nishida and Itagaki147). This feature, when considered along with the fact that the daily dose of juice received by the hamsters was nutritionally relevant, enables the findings to be related to a human context. Atherosclerosis, in general, and the intima-media thickness of the common carotid artery have been shown to constitute a good predictor of future incidence of ischaemic stroke(Reference Chambless, Folsom and Clegg148), and this highlights the potential importance of polyphenol-rich berry juice intake for a reduced incidence of cardiovascular and cerebrovascular disease.
Photomicrographs of hamster aortic arches after 12 weeks on an atherogenic diet (control (a)) and 12 weeks on an atherogenic diet supplemented with either bilberry juice (b), raspberry juice (c) or strawberry juice (d). The micrographs are examples of the aortic arch surface covered by lipid inclusion in the intima with lipids coloured red using Oil Red O stain(Reference Rouanet, Décorde and Del Rio16). (A colour version of this figure can be found online at journals.cambridge.org/bjn).

Berries and their phenolic components have been shown to compensate physiological variables in metabolic diseases such as type 2 diabetes and its most common precursors, obesity and insulin resistance. DeFuria et al. (Reference DeFuria, Bennett and Strissel149) tested the hypothesis that supplementation of rats on a high-fat diet with a blueberry powder could protect against adipose tissue-related inflammation and subsequent insulin resistance. The adipose tissue of rats on the high-fat diet exhibited a proinflammatory pattern of gene expression as reflected in up-regulation of TNF-α, IL-6, monocyte chemoattractant protein 1 and inducible nitric oxide synthase. This shift towards inflammation was reduced or completely absent in blueberry-fed rats, which also showed reduced hyperglycaemia and insulin resistance compared to unsupplemented control animals. Although further research is required, these observations demonstrate that berries and their phenolic components might provide metabolic benefits to counteract obesity-associated pathology in human subjects.
Single anthocyanins have been tested for their potential antidiabetic activity. In a study with male Wistar rats, intraperitoneal injection of pelargonidin normalised elevated glycaemia and improved serum insulin levels in diabetic rats. The typical biochemical symptoms of induced diabetes, such as lower serum levels of superoxide dismutase and catalase, increased concentrations of malondialdehyde and fructosamine, were effectively reverted to normal values after pelargonidin administration(Reference Roy, Sen and Chakraborti150). One possible mechanism is linked to the anthocyanin counteracting Hb glycation, consequent Fe release from the prosthetic group and Fe-mediated oxidative damage. A 5-week intake of cyanidin-3-O-glucoside by type 2 diabetic mice has been shown to significantly reduce blood glucose concentration and enhance insulin sensitivity(Reference Sasaki, Nishimura and Hoshino151). Apparently, one of the mechanisms involved is linked to up-regulation of GLUT4, which is present in muscle and adipose tissue cells, and down-regulation of retinol binding protein 4 at the adipose tissue level, with a consequent down-regulation of inflammatory-related adipocytokines. In a recent review, Tsuda(Reference Tsuda152) stated that anthocyanins can exert antiobesity actions through improvement of adipocyte function, and that they may also be important dietary components for preventing metabolic syndrome.
There is a wealth of the literature from Joseph and colleagues, at the USDA–ARS Human Nutrition Research Center at the Tufts University in Boston, on the protective effects of berry anthocyanins against brain ageing and the consequent decline in cognitive performance in animal models. After feeding elderly F344 rats a 2 % blueberry extract for 10 weeks, trace levels of parent anthocyanins were found in the cerebellum, cortex, hippocampus or striatum(Reference Andres-Lacueva, Shukitt-Hale and Galli110). The elderly rats also performed better in a test of spatial learning and memory, and the performance was directly and significantly correlated to brain anthocyanin concentration, suggesting, for the first time, that these compounds may deliver their function directly to the central nervous system. In the Morris water maze test, rats that drank a 10 % Concord purple grape juice for 3 months exhibited improvements in cognitive performance, principally spatial learning and memory, while those given a 50 % grape juice supplement had improvements in motor function(Reference Shukitt-Hale, Carey and Simon153). A blackberry diet also lead to similar results, improving motor performance based on balance and co-ordination. After blackberry consumption, rats had significantly greater working or short-term memory performance than the unfed controls(Reference Shukitt-Hale, Cheng and Joseph154). One of the mechanisms involved in these effects could be related to inflammation, as consumption of blueberry polyphenols was able to attenuate learning impairments following neurotoxic insult with parallel anti-inflammatory actions, probably by acting on gene expression(Reference Duffy, Spangler and Devan155, Reference Shukitt-Hale, Lau and Carey156). Anthocyanins are also able to improve learning and memory of ovariectomised rats(Reference Varadinova, Docheva-Drenska and Boyadjieva157). Ovariectomy caused oestrogen deficit in the animals, which in turn is associated with mental health disorders, emotional difficulties, memory impairment and other cognitive failures; the supplementation with red grape anthocyanins resulted in memory-enhancing effects. Therefore, another possible mechanism involved in cognitive-related effects of anthocyanins could be their phyto-oestrogenic effects, with clear implications for human subjects. Another mechanism could be related to systemic or central antioxidant protection, as observed by Shih et al. (Reference Shih, Chan and Liao158) who fed senescence-accelerated mice with a basal diet supplemented with a 0·18 and 0·9 % mulberry extract for 12 weeks. Treated animals showed a higher antioxidant enzyme activity and reduced lipid oxidation in both the brain and liver.
Finally, it is interesting to note that berry-derived polyphenols may be active in different and specific brain regions. Morris water maze tests showed that strawberry supplementation to high-energy and charge particles irradiated – rats partially overcame spatial deficits as animals were better able to retain place information – behaviour associated with the a hippocampus. A blueberry supplementation, however, seemed to improve reversal learning, a behaviour more dependent on intact striatal function(Reference Shukitt-Hale, Carey and Jenkins159).
Once again, it must be kept in mind that no easy translation can be made from animal models to human subjects. This is basically due to intrinsic differences between animal and human behaviour and basic physiology and due to the strictly controlled conditions that can be applied to animals, but not to human subjects, in intervention studies. However, it must be pointed out that these observations in very selected animal models are suggestive of a strong and specific bioactivity of polyphenolic compounds, which are explained by plausible mechanisms and accompanied by observable changing at the biochemical level. Interest in possible biological effects of berry consumption in human subjects is, therefore, based on solid foundations and of compelling interest.
Biological effects of berry phenolics: studies in human subjects
Several cross-sectional studies reported a putative protective role of phenolic compounds towards a long list of different and multifactorial diseases in human subjects(Reference Hooper, Kroon and Rimm160–Reference Hernández-Ramírez, Galván-Portillo and Ward165). Nevertheless, these studies did not specifically investigate all the individual polyphenol subclasses, and the available data provide no evidence of protective effects exerted by anthocyanins, which are among the main flavonoids in berries. However, in one study, higher intake of anthocyanins was associated with reduced risk of non-Hodgkin lymphoma in a population recruited in Surveillance, Epidemiology and End Results registries in four US states(Reference Frankenfeld, Cerhan and Cozen166).
Usually, randomised intervention studies are designed and performed to corroborate epidemiological evidence, and this is one of the reasons why reports describing such interventions in the medical literature are sparse and inconclusive. The first target of intervention studies designed to supplement antioxidant molecules in human subjects is always the most elusive physiopathological variable: oxidative stress. Møller et al. (Reference Møller, Loft and Alfthan167) recruited fifty-seven volunteers for 3-week controlled and randomised parallel feeding study with either blackcurrant juice, an anthocyanin-rich drink or a placebo control beverage. It was found that even large amounts of dietary antioxidants did not reduce the levels of oxidative DNA damage, which are measured as strand breaks and as endonuclease III and formamidopyrimidine DNA glycosylase-sensitive sites by the comet assay. DNA was, however, significantly protected against oxidative insult in twenty-one haemodialysis patients in a pilot intervention study by 200 ml/d intake for a 4-week period of an anthocyanin-rich red fruit juice(Reference Spormann, Albert and Rath168). Reduced DNA oxidation damage was accompanied by decreased protein and lipid peroxidation and an increase in glutathione.
Three further studies report positive effects in older human subjects. Thirty-six grams of a lyophilised red grape powder was able to significantly reduce systemic oxidative stress as measured by urinary F2-isoprostanes in twenty postmenopausal women(Reference Zern, Wood and Greene169). The supplement was also able to positively alter lipoprotein metabolism and inflammatory markers (TNF-α), therefore supposedly reducing recognised cardiovascular risk factors. Consumption of tart cherry juice for 2 weeks, containing high levels of anthocyanins, was able to reduce the ischaemia/reperfusion-induced F2-isoprostane response in plasma and urinary excretion of oxidised nucleic acids, a measure of DNA oxidative damage, in twelve volunteers aged 69 (sd 4) years(Reference Traustadóttir, Davies and Stock170). Finally, in twenty-six patients receiving haemodialysis and fifteen healthy subjects, daily consumption of 100 ml of red grape juice for a period of 14 d increased the antioxidant capacity of plasma, without affecting concentrations of uric acid or vitamin C, reduced oxidised LDL and increased the level of cholesterol-standardised α-tocopherol(Reference Castilla, Echarri and Dávalos171).
Anthocyanins from different sources have been associated with vascular health-related improvements in vivo. Acute consumption of capsules of blackcurrant anthocyanins by healthy volunteers was able to increase forearm blood flow with no significant difference in muscle oxygen consumption(Reference Matsumoto, Takenami and Iwasaki-Kurashige172). In the same study, healthy subjects took the capsules daily for 2 weeks, and the treatment significantly reduced oxy-Hb decline and alleviated muscle stiffness after a workload. Most importantly, daily consumption of a pomegranate juice for 3 months positively affected myocardial perfusion in forty-five patients with CHD and myocardial ischaemia in a randomised, placebo-controlled, double-blind study(Reference Sumner, Elliott-Eller and Weidner173).
Inflammatory biomarkers are another common target of human interventional studies, being relatively easy to measure in vivo and strictly related with cardiovascular, metabolic and cancer risk. In a previously cited study, red grape juice supplementation of haemodialysis patients for 3 weeks significantly reduced plasma monocyte chemoattractant protein 1, an inflammatory biomarker associated with CVD risk(Reference Castilla, Echarri and Dávalos171). The same biomarker was reduced in another acute study in which healthy volunteers received 13 g of a red wine anthocyanin extract(Reference Garcia-Alonso, Minihane and Rimbach174). C-reactive protein, another biomarker of systemic inflammation, was also significantly reduced along with fructosamine, glutathione and total cholesterol in thirty-two type 2 diabetes mellitus patients receiving a grape seed extract, presumably rich in procyanidins, for 4 weeks in a double-blinded randomised crossover trial(Reference Kar, Laight and Rooprai175).
Finally, a recent Cochrane review reports some evidence that cranberry juice may decrease the number of symptomatic urinary tract infections over a 12-month period, particularly for women with recurrent episodes(Reference Jepson and Craig176).
Conclusion and future perspectives
In conclusion, there is a strong evidence that polyphenols from berry fruits are absorbed to varying degrees and deliver positive effects at various levels in the human body. However, more research is needed to fully understand which molecules are effective and what mechanisms are involved in their action. Some focused investigation to reach this target could be summarised as follows: (1) performing feeding studies of 14C-labelled anthocyanins to rats to unravel their main catabolites and clarify their fate within the body; (2) organising and carrying out up-to-date bioavailability of human studies of blackcurrant phenolics with healthy subjects, applying different models (ileostomy volunteers, kidney- and liver-impaired volunteers) to understand the main sites of absorption and catabolism of these components; (3) setting up synthesis and in vitro studies to fully characterise the bioactivity of polyphenol catabolites generated in vivo. This should be done with different in vitro models (inflammation, endothelial function, insulin sensitivity, glycation and ageing); (4) performing medium to long-term feeding studies with berries to evaluate modification of various biomarkers of disease (inflammation, blood pressure, blood lipids and endothelial function); (5) setting up detailed studies to understand the interaction between berry phenolics and colon microflora. This approach should be bidirectional, with studies demonstrating how berry consumption could modify the colon environment and how a specific microbiota could modify the reaction towards berry phenolic absorption, catabolism and bioactivity; (6) identifying berry phenolic catabolites able to cross the blood–brain barrier by means of high-resolution analytical techniques.
Acknowledgements
None of the authors have conflicts of interest (financial, professional or personal) that are relevant to the manuscript. The author's responsibilities were as follows: D. D. R., G. B. and A. C. conducted the initial literature review and wrote the manuscript and abstract. A. C. designed and prepared figures and tables.