

Body weight loss is generally recommended to decrease the risk and the severity of obesity-related comorbidities(1). However, benefits that accompany weight reduction are often of short to medium term. This can particularly be explained by the occurrence of undesired side effects that result from fat mass loss and promote weight regain(Reference Bauman, Allman-Farinelli and Huxley2–Reference Fogelholm4). For instance, weight-reducing programmes have been shown to increase the motivation to eat(Reference Doucet, St-Pierre and Alméras5–Reference Pasman, Saris and Westerterp-Plantenga7) and, in the long run, this change can predict weight relapse(Reference Pasman, Saris and Westerterp-Plantenga7). A novel area of investigation consists of finding some satiating agents that may attenuate the increase in hunger induced by body weight loss.
Some data suggest that Ca consumption could play a considerable role in the maintenance of a healthy body weight. Under free-living conditions, a negative association between daily Ca intake and adiposity markers has been observed(Reference McCarron, Morris and Henry8). Moreover, dietary Ca deficiency was recently reported to induce a greater increase in the risk of obesity than high fat intake or sedentariness(Reference Chaput, Leblanc and Perusse9). Growing evidence also suggests that increasing Ca intake decreases the risk of obesity(Reference Zemel, Shi and Greer10–Reference Heaney, Davies and Barger-Lux12).
Some mechanisms have been proposed to explain the potential influence of Ca consumption on body weight and fat mass. As reviewed by Major et al. (Reference Major, Chaput and Ledoux13), Ca intake might affect daily energy and fat balance by modulating adipocytes' lipid metabolism and faecal fat excretion. Furthermore, the existence of a Ca-specific appetite control has been proposed(Reference Tordoff14). According to this theory, fluctuations in Ca intake and/or stores might influence appetite sensations and food intake. For instance, some authors showed that Ca-deprived animals developed the ability to preferentially select a high-Ca-containing beverage over time(Reference Paradis and Cabanac15, Reference McCaughey, Forestell and Tordoff16). In addition, our group has recently published supportive results for the facilitating effect of Ca supplementation on appetite control in the context of a weight-reducing programme(Reference Major, Alarie and Dore17). Specifically, the very low Ca consumer obese women who received the Ca+vitamin D supplementation showed a significant reduction in their spontaneous energy/fat intake during the buffet-type meal in comparison with those who were treated with placebo. Moreover, the change in spontaneous food intake explained the greater weight/fat loss observed in the supplemented group than that observed in the placebo group. However, only few studies examined the role of Ca supplementation on appetite control and this topic remains a matter of controversy(Reference Blumsohn and Barker18, Reference Tremblay and Major19). Considering the important clinical implications of such appetite control-facilitating agent for the maintenance of the weight-reduced state, this line of research has great scientific relevance.
This article presents the results of a recently completed intervention trial that evaluated the impact of milk supplementation on appetite sensations, body weight and some appetite-related hormones in overweight/obese women. We hypothesised that the milk supplementation can attenuate the increase in motivation to eat for a given body weight loss.
Subjects and methods
Recruitment advertisements targeting healthy overweight women were made through diverse media sources in the great Quebec City area. The trial profile is illustrated in Fig. 1. During telephone interviews, the following inclusion and exclusion criteria were assessed: age between 25 and 50 years, absence of pregnancy, breastfeeding or menopause (determined by the cessation of menstruation), stable body weight (body weight change < 5 kg for 6 months before screening), BMI between 27 and 42 kg/m2, no use of vitamin and mineral supplementation within 6 months of screening, < 3 periods of 20 min of physical exercise/week, no use of medication, no smoking, normal blood pressure values ( < 140/90 mmHg) and consumption of ≤ 5 cups of coffee/d (1250 ml/d). Daily Ca intake had to be ≤ 800 mg/d and was assessed by a FFQ targeting Ca-rich food. Women who met these criteria were invited to a pre-selection individual meeting, during which body weight and height were measured. They also received more details about the protocol and explanations about the dietary record that they had to complete at home. Women whose dietary record showed a daily Ca intake ≤ 800 mg were included in the project. Our objective was to recruit fifty participants, but after great efforts to find women who met the criteria, we included forty-one subjects. The major reason for rejection was the use of medication that interfered with the objectives of the project.
Flow chart diagram of the project.

In this randomised, single-blind, placebo-controlled trial, the subjects participated in a 6-month energy-restriction programme. They were blinded to the study objectives, except for weight loss, and were assigned to one of the two groups (milk or placebo supplementation) according to the pre-established randomisation scheme. As presented in Table 1, the milk supplement (Lactancia Addition Nature 35 % plus de Ca (1 % fat); Parmalat Canada, Toronto, ON, Canada) provided 1000 mg/d of Ca and the energy-equivalent placebo (Rice Dream; Hain Celestial Canada, Toronto, ON, Canada) consisted of a non-enriched Ca-free rice beverage. Daily portions of the supplements were served individually in unlabelled opaque containers. The participants were free to add the supplement in their diet as they wished, but they had to drink one portion per d. The subjects were tested at baseline, and at 1 and 6 months following the initiation of the weight loss and supplementation programme. Each individual testing day took place in the first 10 d of the participants' menstrual cycle. They arrived at the laboratory at about 8.00 hours, after a 12-h overnight fast, and they had to abstain from physical exercise for 48 h and from alcohol beverages for 24 h before testing. The present study was conducted according to the guidelines laid down in the Declaration of Helsinki, and all procedures involving human subjects were approved by the Laval Hospital Ethics Committee (CER: 20 098). Written informed consent was obtained from all the subjects.
Characteristics of a daily portion of the supplements*

* The diet prescription, which included the supplement, had to respect the same proportions of lipid, carbohydrate and protein in both groups.
Calcium intake and daily energy intake
A two-step process was used to carefully assess the habitual Ca intake of participants. First, usual consumption of food high in Ca was assessed at pre-screening during a telephone interview. Secondly, a standardised 3-d dietary record was obtained. This previously validated diary(Reference Tremblay, Sevigny and Leblanc20) was completed at home after the participants received detailed explanations by a dietitian. A computerised version of the Canadian Nutrition File (version 2005) was used to determine macro- and micronutrient content of food as well as total daily energy intake(21). This measurement was repeated at the end of the programme. In addition, the participants completed a 24 h dietary recall with the help of the dietitian every 2 weeks over the course of the study.
Energy-restricted diet programme
Each participant received a personalised diet plan targeting a 2508 kJ/d (600 kcal/d) energy restriction. The energy content of the diet was determined by a dietitian who subtracted 2508 kJ (600 kcal/d) from the daily energy requirement of each participant. The daily energy requirement was estimated by measuring RMR and multiplying it by an activity factor of 1·4, as recommended for sedentary participants(Reference White, Bouchard and Buemann22). RMR was determined at baseline, and re-assessed at 1 month, by indirect calorimetry where the expired gas collection was performed through a mouthpiece, while the nose was clipped. O2 (electrochemical oxygen sensor) and CO2 (non-dispersive IR analysis) concentrations were determined using an Uras 10 E device (Hartmann & Braun, Frankfurt am Main, Germany), whereas pulmonary ventilation was assessed using a Flow transducer K-520 and a Spirometric module S-430A measurement system (KL Engineering, Santa Clara, CA, USA). The Weir formula(Reference Weir23) was used to determine the energy equivalent of O2 volume. The diet prescription, which included the supplementation, had to respect specific proportions of carbohydrate, lipid and protein relative to total energy intake (50–55, 30 and 15–20 E%, respectively). The plan was based on the recommendations of the Canada's Food Guide(24), except that the placebo group remained on a low-Ca diet. Apart from the supplement, both groups were limited to a maximum of one to two servings of dairy products per d. Each participant met her assigned dietitian every 2 weeks until the completion of the study. The participants' compliance was measured by comparing the diet prescribed (total daily energy intake and macronutrient composition) to the actual diet composition of the participants, the latter assessed every 2 weeks by the 24 h dietary recalls.
Anthropometric and body composition measurements
Body weight, height (light clothes, without shoes) and waist circumference (directly on the skin) were assessed at baseline and every 2 weeks, except for height(Reference Lohman, Roche, Martorell, Lohman, Roche and Martorell25). BMI was calculated as body weight divided by height squared (kg/m2). Body fat and fat-free mass were measured by dual-energy X-ray absorptiometry (GE Medical Systems Lunar, Diegem, Belgium) at the beginning and at the end of the programme.
Fasting appetite sensations
Fasting appetite sensations were assessed at three different time points, i.e. at baseline and after 1 and 6 months of intervention. After a 12-h overnight fast, the participants were asked to fill out visual analogue scales (VAS) used to assess appetite sensations, i.e. desire to eat, hunger, fullness and prospective food consumption(Reference Hill and Blundell26). Those scales were 150 mm in length with words anchored at each end expressing the most negative and the most positive rating. VAS were filled out in a quiet room exempt of food stimulus after the RMR measurement and the blood draws.
Biochemical analyses
Blood samples were collected at about 08.00 hours in EDTA-containing tubes (Miles Pharmaceuticals, Rexdale, ON, Canada), and plasma fasting leptin, total ghrelin, glucose and insulin concentrations were measured at three time points (baseline, month 1 and month 6). Plasma leptin and total plasma ghrelin concentrations were determined using commercially available RIA kits (LINCO Research, Inc., St Charles, MO, USA) with the following limit of sensitivity and intra-assay CV, respectively: leptin, limit of sensitivity 0·5 ng/ml and CV 8·3 %; ghrelin, limit of sensitivity 93 pg/ml and CV 7·9 %. Plasma glucose was quantified enzymatically (Block Scientific, Inc., Bohemia, NY, USA), whereas insulin and cortisol concentrations were measured using RIA kits (Roche Elecsys; Roche Diagnostics, Basel, Switzerland).
Statistics
The power calculation revealed that data from a total of ten subjects would give us a power of 0·8, which would be sufficient to show a between-group difference in body weight loss down to 2 (sd 1) kg with an α of 0·05 (ANOVA). However, considering the same power and α, a total of thirty-three participants would be required to see a difference of 10 (sd 5) mm in VAS changes. Consequently, we considered that twenty-five subjects in each group would be adequate in the present context and would take into account potential drop-outs (10–15 % of subjects based on previous data). Statistical analyses were performed on completers. A two-way ANOVA with repeated measures on one factor (time) was used to assess the effects of treatment (placebo and milk) and time, and their interaction on all dependent variables. Residual scores for appetite sensations and blood variables were used to adjust the two-way ANOVA for change in the body weight. The pre- and post-treatment (6 months) difference within the groups was assessed by an one-way ANOVA. The same method was used to compare the observed changes in fullness sensation with the predicted values. To establish the predicted values, we used recently published data by Gilbert et al. (Reference Gilbert, Drapeau and Astrup27) who reported a significant relationship between the changes in fullness and those in body fat mass in a large group of women subjected to an energy restriction with a placebo. We then used the related regression line to predict appetite changes in our two groups of subjects, and we compared these predicted scores to the measured changes in fullness within each group. In addition, regression lines were calculated to investigate the possible relationship between VAS ratings and adiposity, blood markers and energy intake. All statistical analyses were performed using the JMP version 7.0 statistical software (SAS Institute, Cary, NC, USA). Statistical significance was set at a P value of < 0·05. Data are expressed as means and standard deviations.
Results
The trial profile is presented in Fig. 1. Before the beginning of the intervention, one participant resigned for personal reasons, and another one was rejected because she drastically changed her nutritional habits and became a high Ca consumer between the screening period and the beginning of the intervention. The others resigned before the completion of the study for personal reasons. The most common reason to explain the withdrawal was the lack of time and unrealistic weight loss expectations. One participant also became pregnant. The baseline characteristics of the non-completers were not significantly different from those of the completers. No significant differences were observed between the two groups of completers for baseline age (40·1 (sd 7·4) and 41·9 (sd 7·2) years, placebo and milk group, respectively), Ca intake (661 (sd 129) and 687 (sd 151) mg/d, placebo and milk group, respectively) and anthropometric measurements. As shown in Table 2, a significant decrease in body weight, waist circumference, fat mass, percentage of fat mass and fat-free mass was observed in response to the 6-month programme in both the groups.
(Mean values and standard deviations)

t, Time; Tx, treatment; ND, not determined.
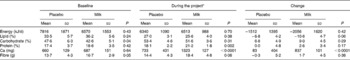
As presented in Table 3, daily energy intake was significantly lower during the programme compared with baseline values in both the groups (P < 0·001). Women in the milk-supplemented group tended to spontaneously decrease more their relative lipid intake than those in the placebo group (P = 0·06), which was not explained by a difference in the prescription between the groups (P = 0·81). During the project, the milk-supplemented group had a greater protein intake (including milk proteins) than the placebo group. This difference was attributable to a difference in the protein prescription (18·5 (sd 0·3) and 20·5 (sd 0·3) E%, in the placebo and the milk-supplemented groups, respectively; P < 0·0001). However, the diet prescriptions respected the pre-established proportions of carbohydrate, lipid and protein. As expected, Ca consumption was higher in the milk-supplemented group from week 2 to the end of the intervention. The median Ca consumption in the placebo group was 604 mg/d. The 24 h recalls also showed that participants in both the groups complied at 99 % with their energy-restricted diet, as assessed by the difference between total energy intakes actually consumed throughout the project and the prescription (difference of − 40 (sd 750) kJ, P = 0·89 and − 23 (sd 569) kJ, P = 0·88, in the placebo and milk-supplemented groups, respectively). The actual diet composition of the participants corresponded to 100 % of the prescribed relative carbohydrate intake in both the groups; 93 and 88 % of the prescribed lipid intake in the placebo and the milk-supplemented groups, respectively, and 99 and 103 % of the prescribed protein intake in the placebo and the milk-supplemented groups, respectively.
(Mean values and standard deviations)
* Results are the means of the 24 h recalls filled out every 2 weeks.
Table 4 shows that, at baseline, there was no significant between-group difference for the fasting ratings of appetite sensations. In response to the intervention, the fasting appetite scorings changed differently between the groups, as observed by the time × treatment interaction effect observed for both desire to eat and hunger. Specifically, a smaller increase in these sensations was observed in the milk-supplemented subjects than that in the placebo group. In order to isolate the effect of the supplements, the VAS results were statistically adjusted for body weight loss, the latter being known to increase per se appetite sensation(Reference Doucet, Imbeault and St-Pierre28). After the adjustment, the between-group difference was more pronounced for desire to eat and hunger. This facilitating effect of the milk supplementation on appetite control was also observed in the fasting fullness level. In fact, this parameter has been further analysed and compared to the previously established relationship between the changes in fullness and those in body fat mass reported by Gilbert et al. (Reference Gilbert, Drapeau and Astrup27). In this way, the influence of body weight loss on appetite is eliminated, and we can see the only effect of the supplement. Fig. 2(a) shows that, in the control participants, the predicted and measured changes in fullness were comparable. This contrasts with the results of the milk-supplemented subjects in whom the slight increase in measured fullness was significantly different from the decrease predicted by their weight loss (Fig. 2(b)).
(Mean values and standard deviations)

t, Time; Tx, treatment; PFC, prospective food consumption.
* After adjustment for weight loss.
Change in fasting fullness sensation compared to the predicted change in (a) placebo and (b) milk-supplemented groups. The prediction was calculated as follows: fasting fullness sensation = 3·6 × Δ fat mass (kg)+9·1(Reference Gilbert, Drapeau and Astrup27). * Different from the predicted changes in fullness (P < 0·05). ![]() , Predicted;
, Predicted; ![]() , measured; ■, predicted;
, measured; ■, predicted; ![]() , measured.
, measured.

Table 5 presents variations in fasting blood variables that were measured in the two groups. There was no significant treatment and time × treatment interaction effects for these variables. Changes in ghrelin and leptin concentrations were significantly correlated with those in fat mass (r − 0·40 and 0·60, respectively; P < 0·05 for both groups combined). Moreover, changes in plasma ghrelin were positively correlated with those in desire to eat and hunger (Fig. 3). A negative association was observed as well between the changes in ghrelin and those in fasting fullness. The latter correlations remained significant after adjustment for fat mass loss (r 0·56, P < 0·01; r 0·45, P < 0·05; r − 0·40, P < 0·05, for the associations between the changes in ghrelin and those in desire to eat, hunger and fullness, respectively).
(Mean values and standard deviations)

t, Time; Tx, treatment.
* After adjustment for weight loss.
Changes in fasting appetite sensations in relation to changes in fasting ghrelin concentrations after 6 months of treatment in placebo (♦) and milk-supplemented (![]() ) groups. (a) y = 0·10x+12·79; r 0·58; P < 0·01. (b) y = 0·08x+5·90; r 0·43; P < 0·05. (c) y = − 0·06x − 0·79; r − 0·48; P < 0·05. (d) y = 0·06x+4·95; r 0·35; P = 0·09. PFC, prospective food consumption.
) groups. (a) y = 0·10x+12·79; r 0·58; P < 0·01. (b) y = 0·08x+5·90; r 0·43; P < 0·05. (c) y = − 0·06x − 0·79; r − 0·48; P < 0·05. (d) y = 0·06x+4·95; r 0·35; P = 0·09. PFC, prospective food consumption.

Discussion
The main purpose of the present study was to examine the possibility that the milk supplementation facilitates appetite control under energy-restricted diet conditions. In agreement with our hypothesis, weight loss was found to induce orexigenic effects that were attenuated when the subjects received a milk supplementation.
The long-term effect of dairy consumption on fasting appetite sensations, as assessed in the present study, has been little investigated. In contrast, the acute effects of milk consumption on the reduction of appetite and/or energy intake have been found by some investigators(Reference Harper, James and Flint29, Reference Dove, Hodgson and Puddey30), but not by all(Reference Lorenzen, Nielsen and Holst31). For instance, the chocolate milk preload used by Harper et al. (Reference Harper, James and Flint29) induced a greater satiety sensation than the cola preload, but did not affect the ad libitum energy consumption at lunch served 30 min later. Another group also proposed that the satiating potential of milk may last up to 4 h. In fact, the addition of 600 ml of skimmed milk to a fixed-energy breakfast induced a greater satiety until lunch time than the fruit drink consumption(Reference Dove, Hodgson and Puddey30). The authors also observed a smaller spontaneous energy intake at the buffet test meal after milk consumption. Hence, drinking milk during the day seems to promote satiety and may diminish energy intake at the subsequent meal. This is concordant with the results of the present study which showed that milk consumption induced a satiating effect. It influenced fasting appetite sensations in a way that attenuated the enhancing effect of weight loss on motivation to eat. In this regard, a recent 6-month dairy intervention on low dairy consumer women induced an increase in fasting leptin concentrations(Reference Wennersberg, Smedman and Turpeinen32), the latter being recognised to enhance satiety feelings(Reference Doucet and Cameron33). However, the subjective appetite sensations were not measured to verify the effect of the dairy intervention. Conversely, another study, in which the only guideline given to participants was to increase their consumption of dairy products, showed no effect on appetite or energy intake(Reference Hollis and Mattes34). On the other hand, our group showed that Ca+vitamin D supplementation influenced appetite control during weight loss(Reference Major, Alarie and Dore17). Specifically, the very low Ca consumer women who received the supplementation spontaneously reduced fat and total energy intake at lunch time when compared with the control subjects. This finding seems concordant with the tendency towards a greater spontaneous reduction in lipid intake in the milk-supplemented group than in the placebo group. Taken together, these observations suggest that milk supplementation may help maintain appetite sensations at an optimal level during weight loss.
Our milk supplement provided a particularly high dose of dietary Ca (1000 mg/d). Having overcome the dietary Ca deficiency initially exhibited by our participants may partly explain the observed impact of milk supplementation on the attenuation of the diet-induced motivation to eat. The ‘Ca-specific appetite’ is a concept that was introduced by Tordoff(Reference Tordoff14) and is concordant with the fact that Ca-deficient animals were found to be more prone to spontaneously increase their consumption of Ca when given free access to different beverages including a Ca-supplemented drink(Reference Paradis and Cabanac15). Ca deficiency has also been shown to influence macronutrient choices(Reference Tordoff and Rabusa35). In human subjects, since food is the main source of Ca, it is thought that a Ca-specific driven appetite can lead to an increase in energy intake. The results recently published by Major et al. (Reference Major, Alarie and Dore17) represent a relevant application of this concept. In fact, Ca+vitamin D supplementation provided to very low Ca consumers influenced their macronutrient choices and consequently their total energy intake(Reference Major, Alarie and Dore17). It was then suggested that resolving Ca deficiency had reversed the specific appetite-driven behaviour. This hypothesis may also explain the results obtained in the present study regarding the attenuation of the ‘seeking food’ behaviour, as reflected by a less pronounced increase in desire to eat and hunger sensations.
Milk is also a good source of protein, whey and casein, and protein-induced satiety is a concept that is now well accepted(Reference Veldhorst, Smeets and Soenen36). Although the actual diet prescription, which took into account the supplement provided, respected the range of protein intake, it seems that the dairy supplementation facilitated overall protein intake since it led to a higher relative protein consumption. Thus, one may consider that the discrepancy in the relative amount of protein ingested could partly explain the lower increase in hunger and desire to eat observed in the milk-supplemented group in response to weight loss. Indeed, several studies have shown that the participants subjected to a high-protein energy-balanced diet report a higher satiety throughout the day(Reference Veldhorst, Smeets and Soenen36). Interestingly, some authors have also observed that the consumption of a high-protein diet sustains the previous level of hunger perceived between meals after a reduced energy intake period(Reference Weigle, Breen and Matthys37). In that case, fasting appetite sensations were not measured, making difficult the comparison with the present results. However, both the studies compared the consumption of 30 % of energy intake as protein to a normal protein diet (10 E%), whereas our groups consumed 18 and 21 E% as protein (placebo and milk group, respectively). Conversely, others have used repeatedly a diet providing 25 E% in protein and reported more than once its failure to block the increase in hunger motivation observed in response to weight loss(Reference Duckworth, Gately and Radley38). Hence, since the protein intake in the present study was lower than the proportion that led to appetite control facilitation and because the difference in protein intake between our groups was small, the contribution of the high-protein diet effects in the explanation of the present results is doubtful. Nonetheless, an obvious difference exists regarding the type of protein that our groups consumed. It is worth restating that the subjects in the control group maintained their low Ca and dairy consumption throughout the project. Thus, the whey and casein intake in the placebo group was considerably lower than in the milk-supplemented one. In this regard, evidence shows that the satiating effect of protein differs depending on the type of protein consumed, especially regarding whey and casein(Reference Veldhorst, Smeets and Soenen36). For example, an acute increase in perceived satiety and a reduced food intake have been reported following the ingestion of whey(Reference Veldhorst, Smeets and Soenen36). However, some authors have recently questioned the possibility that the consumption of usual dairy portions can lead to the satiating effects observed with the whey intake(Reference Luhovyy, Akhavan and Anderson39). With respect to these observations, we cannot conclude on the involvement of the greater overall protein ingestion and/or the type of protein ingested in the attenuation of the increase in appetite.
Dairy products are also a source of lactose and conjugated linoleic acid (CLA) and these two constituents have been shown to affect subjective appetite. Regarding the satiating effect of lactose, some authors showed that it was equivalent to the effect of whey and casein(Reference Bowen, Noakes and Trenerry40). In fact, a lactose preload ingested before an ad libitum meal induced the same significant reduction in appetite and food intake as that observed after the ingestion of a preload containing milk proteins. However, only the acute postprandial effects were measured and thus no conclusion can be drawn regarding the impact of regular lactose ingestion on appetite perceived during fasting. On the other hand, CLA supplementation has been shown to induce beneficial changes in fasting appetite sensations(Reference Kamphuis, Lejeune and Saris41). The supplementation (1800 and 3600 mg) had no impact on weight relapse after a very low-energy diet, but countered the adverse effects of weight loss by increasing the sensations of fullness and satiety and reducing hunger. Considering that milk contains about 9 mg of CLA per 100 g of fatty acid(Reference AbuGhazaleh, Felton and Ibrahim42), our milk-supplemented group ingested the equivalent of 0·5 mg of CLA per d. Thus, the fact that our participants consumed such a small amount of CLA suggests that this milk component probably had little impact on the present results. In addition, the lack of evidence on the effect of lactose ingestion on fasting appetite sensations does not lead to a clear conclusion about its contribution to appetite control.
The favourable impact of milk supplementation on appetite sensations during weight loss was not related to the major changes in blood appetite hormones, as reflected by the absence of between-group differences in circulating concentrations of glucose, insulin, leptin, ghrelin and cortisol. It is, however, worth noting that even after adjustments for fat mass loss, the changes in ghrelin concentration predicted those in desire to eat, hunger and fullness, the latter being differently influenced by the supplements. It is then interesting to observe that the milk-supplemented group showed a smaller increase in both appetite and ghrelin concentration, although NS, than the placebo group. Of course, this observation deserves to be confirmed in further investigation.
The significant relationships observed between the changes in ghrelin concentration and those in appetite sensations add support for the relevance of using VAS in the study of appetite control during a weight-reduction programme. Appetite sensations assessed by VAS have been shown to be useful predictors of overall energy intake(Reference Drapeau, King and Hetherington6, Reference Drapeau, Blundell and Therrien43) and weight loss(Reference Drapeau, King and Hetherington6). The present study emphasises their usefulness by showing that the subjective appetite measurements correlate with concordant objective physiological changes in ghrelin.
The present study had some limitations. First, the results cannot be generalised and concern only a specific population of women who are overweight/obese and consume little Ca in their diet. Although we have been able to appreciate the influence of the milk supplementation on appetite sensations, our protocol did not allow us to verify precisely the subsequent effects on spontaneous daily energy intake because participants had to respect their personalised energy-restricted diet prescription. Nonetheless, when compared with the placebo group, the women in the milk-supplemented group tended to eat less lipid in their diet (P < 0·06) and showed a slightly greater decrease in total energy intake, which was consistent with the more pronounced weight and fat mass loss, though these observations were NS. It could then be speculated that dairy consumption has effective weight loss influences in a free-living context in the long run, as previously suggested by Teegarden & Gunther(Reference Teegarden and Gunther44). Their research group conducted a 1-year dairy intervention and observed the predictive effect of Ca intake on fat mass loss only after a 6-month follow-up (18 months after the beginning of the intervention)(Reference Teegarden and Gunther44). Then, the short duration of the present project might have prevented us from observing an effect on weight loss. Concerning the changes in appetite sensations in response to the treatment, we expected to observe between-group differences of at least 10 (sd 5) mm. We actually observed greater differences but also more important inter-individual variations. Despite the fact that we faced a higher drop-out rate than expected, we have been able to appreciate the significant effect of milk supplementation in appetite sensations.
In conclusion, milk supplementation provided to low Ca consumer women during an energy-restricted diet programme attenuated the weight loss-related increase in appetite. We suggest that this effect can be due to the suppression of appetite caused by Ca supplementation and the increase in dairy protein intake.
Acknowledgements
The authors acknowledge the contribution of Marina Sanchez and Lucie Brunelle in the project coordination and data collection. None of the authors had a personal interest or potential conflict of interest with the organisations sponsoring the study. This work was supported by Dairy Farmers of Canada and the US National Dairy Council. J.-A. G. receives a scholarship from the Danone Institute of Canada. K. C. and A. T. are supported by a Canada Research Chair. J.-A. G. wrote the manuscript and A. T., D. R. J. and J.-P. C. designed the study. J.-A. G. and A. T. conducted the analyses. D. R. J., J.-P. C., P. M., K. C., N. A. and A. T. participated in the preparation of the manuscript. P. M., K. C. and N. A. conducted the blood marker analyses. Trial registration code: ClinicalTrials.gov NTC00729170.


