


Non-technical Summary
The discipline of Precambrian paleontology—the study of early life— is not much older than the journal Paleobiology. We focus on the early fossil record of eukaryotes, a group that early in its history was represented by single-celled organisms (i.e., protists), and review how our understanding of early eukaryote diversification has changed in the last half century. In addition, we present our own analysis of diversity patterns over the >1 billion year time interval preceding the snowball Earth glaciations circa 720 million years ago. Analyses from the 1980s found evidence for a dramatic peak in diversity in the mid- to late Tonian Period, inspiring the hypothesis that eukaryotes rose to dominance during this time. With additional discoveries, the contrast between Tonian diversity and that of earlier time intervals has diminished, calling into question the “Tonian radiation” hypothesis. Our new analysis shows that the number of eukaryotic species through time is strongly correlated with the number of eukaryote-bearing formations through time, suggesting that sampling may be the dominant driver of early eukaryote diversity patterns. We also find no evidence that the proportion of eukaryote-bearing versus all fossiliferous formations (including only prokaryote-bearing formations) changed through this time, as might be expected if the radiation of eukaryotes drove an increase in the number of eukaryote-bearing formations. (The one exception is the late Tonian chert window, when vase-shaped microfossils appeared in these otherwise eukaryote-poor, restricted, organic-rich, and often hypersaline environments.) Biomarkers show a similar pattern to body fossils, wherein the rise of eukaryotic biosignatures correlates with increased sampling. These results raise the prospect that the Tonian radiation is an artifact of sampling and suggest that 50 years on, we still do not know the broad pattern of early eukaryote diversity.
Introduction
The prevailing model of early eukaryote evolution posits that, after hundreds of millions of years subsisting as minor components in bacterial-dominated ecosystems, eukaryotes underwent a dramatic radiation during the Tonian (Knoll et al. Reference Knoll, Javaux, Hewitt and Cohen2006; Javaux Reference Javaux, Gargaud, López-Garcìa and Martin2011; Knoll Reference Knoll2014; Butterfield Reference Butterfield2015; Xiao and Tang Reference Xiao and Tang2018; Porter Reference Porter2020; Agić Reference Agić, Neubeck and McMahon2021; Lyons et al. Reference Lyons, Diamond, Planavsky, Reinhard and Li2021; Cohen and Kodner Reference Cohen and Kodner2022). This presents an interesting conundrum: why, despite their obvious success today, did eukaryotes take so long to diversify? And what eventually triggered their diversification in the mid-Tonian? These questions have spurred Proterozoic geochemical and geobiological research for decades. Popular explanations involve environmental factors that placed a lid on eukaryote expansion that was later lifted, for example, low oxygen levels (e.g., Cole et al. Reference Cole, Reinhard, Wang, Gueguen, Halverson, Gibson, Hodgskiss, McKenzie, Lyons and Planavsky2016; Lyons et al. Reference Lyons, Diamond, Planavsky, Reinhard and Li2021; Wang et al. Reference Wang, Lechte, Reinhard, Asael, Cole, Halverson and Porter2022; Mills et al. Reference Mills, Simister, Sehein, Hallam, Sperling and Crowe2024), limited essential nutrients (e.g., Anbar and Knoll Reference Anbar and Knoll2002; Stüeken Reference Stüeken2013; Reinhard et al. Reference Reinhard, Planavsky, Ward, Love, Le Hir and Ridgwell2020; Kang et al. Reference Kang, Gill, Reid, Zhang and Xiao2023), or widespread sulfidic water bodies (e.g., Guilbaud et al. Reference Guilbaud, Poulton, Butterfield, Zhu and Shields-Zhou2015). Other explanations focus on biotic drivers, for example, the appearance of crown-group animals (Butterfield Reference Butterfield2015) or predatory protists (Porter Reference Porter2011, Reference Porter2016; Knoll Reference Knoll2014; Cohen and Riedman Reference Cohen and Riedman2018; see also Loron et al. Reference Loron, Rainbird, Turner, Greenman and Javaux2018). In addition, a number of studies have explored the ways in which eukaryote diversification itself might have driven environmental change, for example, shifting biogeochemical cycles (Planavsky et al. Reference Planavsky, Asael, Rooney, Robbins, Gill, Dehler and Cole2023), increasing ocean oxygenation (Lenton et al. Reference Lenton, Boyle, Poulton, Shields-Zhou and Butterfield2014), or driving global cooling (Tziperman et al. Reference Tziperman, Halevy, Johnston, Knoll and Schrag2011; Feulner et al. Reference Feulner, Hallmann and Kienert2015).
These studies all rest on the assumption that the diversity history of early eukaryotes is known, at least on broad (100 Myr) timescales (Knoll Reference Knoll1994). This is not unreasonable; although the study of Precambrian paleontology is very young, studies of the Phanerozoic fossil record suggest that large-scale diversity patterns—radiations and extinctions—were evident even in very early compilations (Maxwell and Benton Reference Maxwell and Benton1990; Sepkoski Reference Sepkoski1993). However, recent discoveries of diverse eukaryotic assemblages in early Mesoproterozoic and late Paleoproterozoic rocks (e.g., Miao et al. Reference Miao, Moczydłowska, Zhi and Zhu2019; Loron et al. Reference Loron, Halverson, Rainbird, Skulski, Turner and Javaux2021; Riedman et al. Reference Riedman, Porter, Lechte, Santos and Halverson2023) and evidence from modeling that suggests the presence of an active eukaryotic ecosystem contributing >50% of global biomass by 1.7 Ga (Eckford-Soper et al. Reference Eckford-Soper, Andersen, Hansen and Canfield2022) call into question our current model of early eukaryote diversity and the hypothesis of a delayed diversification. Here, we review the way in which our knowledge of early eukaryote diversity has changed over the last 50 years as more data have become available and present our own analysis of early eukaryote diversity. Our results suggest that even at a broad scale, Proterozoic diversity patterns are only beginning to emerge.
History of Diversity Studies
The idea that eukaryotes underwent a dramatic diversification in the Tonian originated with Vidal and Knoll (Reference Vidal and Knoll1982, Reference Vidal and Knoll1983), who estimated global diversity of what they inferred were planktonic algal fossils during the late Proterozoic and early Cambrian based on assemblages from the peri–North Atlantic region (Fig. 1A). They found a peak in diversity ca. 720 Ma, just before a drop associated with the mid-Neoproterozoic glacial interval.Footnote * Although their plot of diversity extends back to 1400 Ma—the age of the oldest accepted eukaryotic fossils known at the time (Horodyski Reference Horodyski1980)—no data are plotted between 1400 and 800 Ma. There is only a dashed line suggesting an exponential increase in diversity. Vidal and Knoll concluded that the history of early eukaryotesFootnote † is similar to that of early angiosperms, wherein scattered reports of older, poorly preserved specimens are succeeded by an evolutionary and ecological radiation in the early Cretaceous (Doyle Reference Doyle1969; for an update, see Coiro et al. Reference Coiro, Doyle and Hilton2019). In other words, although eukaryotes likely evolved much earlier, the Tonian marked their initial diversification and rise to dominance in the planktonic realm.
Estimates of early eukaryote global diversity from the last four decades. A, Reproduction of fig. 4 from Vidal and Knoll (Reference Vidal and Knoll1983), illustrating the total diversity of “the late Precambrian and Early Cambrian plankton record.” Modified for clarity from Vidal and Knoll, Reference Vidal and Knoll1983; used with permission of the Geological Society of America. B, Redrafted figure 11.3.6 from Schopf (Reference Schopf, Schopf and Klein1992), illustrating the “species-level global diversity of planktonic eukaryotes.” C, Reproduction of fig. 3 from Knoll (Reference Knoll1994), modified for clarity, illustrating “total species richness of protistan microfossils.” V, Varanger Ice Age. Copyright (1994) National Academy of Sciences, U.S.A. D, Diversity estimated from eukaryotic taxa in our database (including all taxa), plotted to match the style of Knoll (Reference Knoll1994). Dashed lines show comparison with the levels of diversity calculated by Knoll (Reference Knoll1994). Note we did not include taxa from Cryogenian or younger rocks in our database. All plots include counts of range-through taxa (see text for more details).
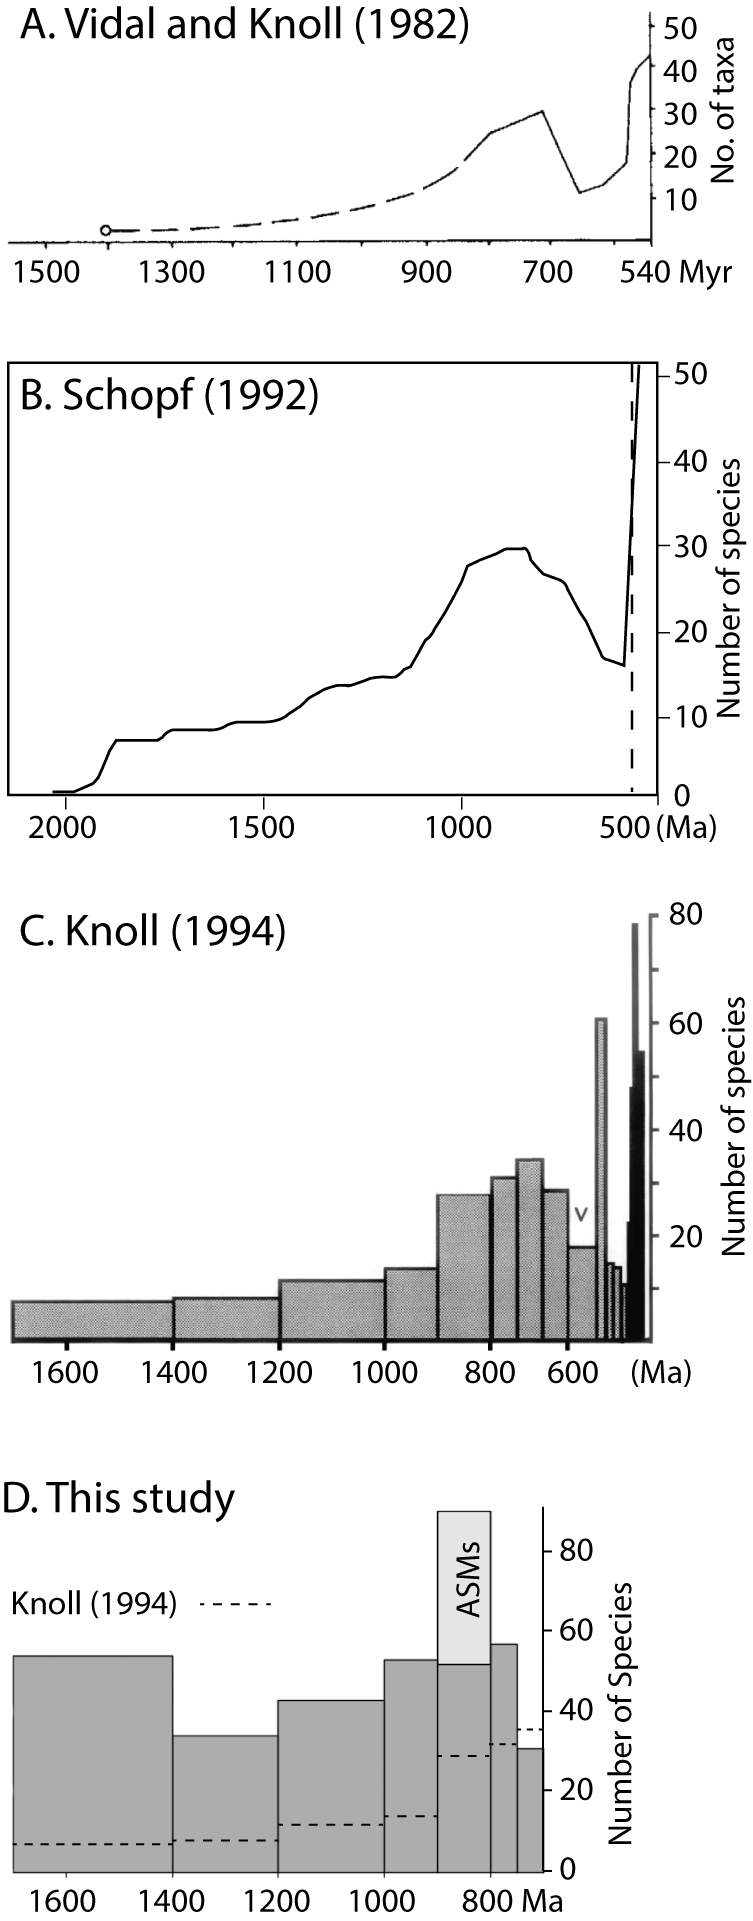
Several diversity studies were published about a decade later. Schopf (Reference Schopf, Schopf and Klein1992) undertook an extensive analysis based on 2800 fossil occurrences of 76 eukaryotic and 297 prokaryotic species from hundreds of formations spanning 2500 Ma to 550 Ma (Mendelson et al. Reference Mendelson, Schopf, Klein, Schopf and Klein1992). He estimated diversity trends for both eukaryotes and prokaryotes as well as planktonic and benthic taxa (the latter comprising filaments and colonial forms, all likely prokaryotic; the former leiosphaerids and ornamented sphaeromorphs). Various measures of diversity were calculated, including maximum and mean within-assemblage diversity, as well as global diversity (Fig. 1B shows his plot of species-level global diversity for planktonic eukaryotes, redrafted so that time is on the x-axis). All of his estimates show a parallel pattern of increasing diversity through the Proterozoic, with a peak in the early Neoproterozoic, ca. 950 Ma, followed by a significant decline that continues through the Cryogenian and Ediacaran. This trajectory is similar to that of Vidal and Knoll (Reference Vidal and Knoll1982, Reference Vidal and Knoll1983), although the peak is earlier and the decline more gradual, a difference attributed by Schopf (Reference Schopf, Schopf and Klein1992) to his more extensive dataset, which included assemblages from the Soviet Union and those described after the publication of Vidal and Knoll (Reference Vidal and Knoll1982). Also different is the level of pre-Tonian (>1000 Ma) diversity, which is higher in Schopf’s analysis than that inferred by Vidal and Knoll (Reference Vidal and Knoll1982, Reference Vidal and Knoll1983). Thus, while there was still a pronounced peak in eukaryote diversity in the Tonian, it was clear that eukaryotic assemblages in the Mesoproterozoic were more diverse than initially thought.
Knoll (Reference Knoll1994) took a different approach, eschewing the numerous reports of fossils that are poorly preserved, poorly described, or poorly constrained in time. Instead, Knoll (Reference Knoll1994) argued that Mesoproterozoic eukaryotes were cosmopolitan and long-ranging, and therefore a limited number of well-preserved assemblages representing relatively long time bins should, in principle, capture global diversity. Using just 15 assemblages for the 1 Gyr pre-Cryogenian interval and focusing only on acritarchs (ornamented and unornamented organic-walled vesicles of uncertain but likely eukaryotic affinities, equivalent to Schopf’s [Reference Schopf, Schopf and Klein1992] “planktonic eukaryotes”), Knoll (Reference Knoll1994) calculated global diversity for late Paleoproterozoic through early Cambrian time (Fig. 1C), arriving at a result similar to that of Schopf (Reference Schopf, Schopf and Klein1992; Fig. 1B): low diversity in the Paleoproterozoic, rising modestly through the Mesoproterozoic, with a notable jump ca. 900–700 Ma. Consistent with the big-picture takeaway from a decade earlier (Vidal and Knoll Reference Vidal and Knoll1982, Reference Vidal and Knoll1983), Knoll concluded that “a robust pattern of increasing diversity and accelerating evolutionary tempo is evident” (Knoll Reference Knoll1994: p. 6743). Similar results were reached by Vidal and Moczydłowska-Vidal (Reference Vidal and Moczydłowska-Vidal1997) who added more units, broadened the time bins (totaling four bins for the pre-Cryogenian interval, which, like those of Knoll [Reference Knoll1994], are unequal in time span), and extended the analyses of acritarch diversity through the end of the Cambrian.
In 2006, Knoll and colleagues again examined early eukaryote diversity, but within the context of a broader review of early eukaryotes. In addition to acritarchs—the “phytoplankton” of earlier reports that in fact probably include non-photosynthetic and/or non-planktonic organisms (Butterfield Reference Butterfield2005a,Reference Butterfieldb)—they compiled diversity data for multicellular forms, macrofossils, and vase-shaped microfossils (VSMs). However, in contrast to earlier diversity studies, which calculated global diversity through time (including range-through taxa), Knoll et al. (Reference Knoll, Javaux, Hewitt and Cohen2006) focused on the number of taxa per assemblage, presenting these data for a select few (and the most diverse) Proterozoic and early Cambrian assemblages (17 pre-Cryogenian units; Fig. 2A). From this they inferred modest levels of eukaryotic fossil diversity in late Paleoproterozoic through early Neoproterozoic rocks, with a more pronounced increase ca. 800–720 Ma that, they argued, marks the diversification of crown eukaryotes. Although the contrast between the Tonian diversity peak and diversity of earlier intervals appears further diminished relative to studies from the 1980s and 1990s, the general inference remained the same: there was a shift in eukaryote evolution in the Tonian. Other studies from this decade include those of Huntley et al. (Reference Huntley, Xiao and Kowalewski2006) and Xiao and Dong (Reference Xiao, Dong, Xiao and Kaufman2006), who used a taxon-free, morphometric approach to the question of early eukaryote diversity, focusing on acritarchs and macroalgae, respectively. In both cases, they found that morphological disparity peaked in the Mesoproterozoic Era, hundreds of millions of years before the Tonian diversity peak (Huntley et al. Reference Huntley, Xiao and Kowalewski2006; Xiao and Dong Reference Xiao, Dong, Xiao and Kaufman2006).
Plots of within-assemblage eukaryote diversity from the last two decades. A, Reproduction of fig. 4b from Knoll et al. (Reference Knoll, Javaux, Hewitt and Cohen2006), modified for clarity, illustrating within-assemblage diversity (= number of taxa per assemblage) of acritarchs. Used with permission of The Royal Society (UK), from “Eukaryotic organisms in Proterozoic oceans,” A. H. Knoll et al. v. 361, 2006, permission conveyed through Copyright Clearance Center, Inc. B, Reproduction of fig. 4 from Cohen and Macdonald (Reference Cohen and Macdonald2015), illustrating within-assemblage diversity of fossiliferous Proterozoic units included in their dataset. Modified for clarity from Cohen and Macdonald (Reference Cohen, Macdonald, Pruss, Matys and Bosak2015) under CC BY 4.0. C, Within-assemblage diversity, referred to in this paper as within-formation diversity (WFD), from the dataset developed in the present study illustrating the top four most diverse formations in each 200 Myr time bin shown in Fig. 4. (See Supplemental File 2.) Apatitic scale microfossil (ASM) species are indicated by the cross-hatched pattern; vase-shaped microfossil (VSMs) species are indicated by the VSM pattern (representing Bonniea dacruchares).
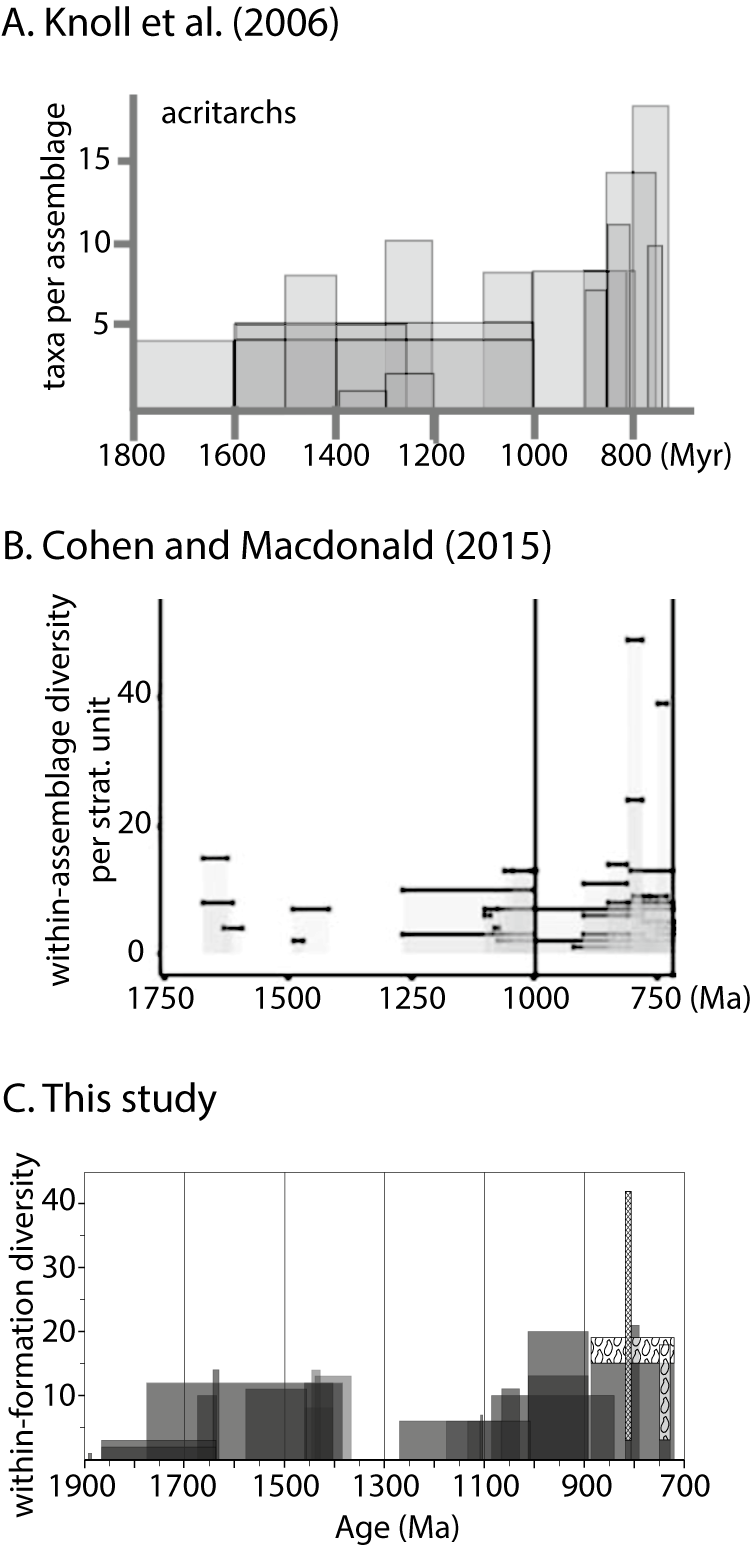
In 2015, inspired by a near-doubling in the number of papers on Proterozoic eukaryotes published since Knoll et al.’s (Reference Knoll, Javaux, Hewitt and Cohen2006) analysis, Cohen and Macdonald (Reference Cohen and Macdonald2015) approached the question of early eukaryote diversity using statistical analyses and paying close attention to potential biases. They compiled data from 76 assemblages spanning late Paleoproterozoic to late Ediacaran time and explored in detail the nature of the data: the geographic distribution and lithology of fossiliferous units, the diversity per unit and per publication, and the diversity of each morphological category within each assemblage. They found that, regardless of how the data were evaluated and how the age assignments were handled, mean within-assemblage diversity increased through the Proterozoic (with a dip in the Cryogenian), driven by the addition of high-diversity assemblages. Figure 2B shows their plot of raw (i.e., not averaged) within-assemblage diversity for each of the 43 pre-Cryogenian units in their dataset. A particularly striking finding of their analysis is the difference in the distribution of fossiliferous lithologies through time. Cherts and carbonates account for a substantial portion (ca. 40%) of eukaryotic fossil occurrences in the Tonian, whereas almost all older eukaryotic fossils are from shales. Cohen and Macdonald (Reference Cohen and Macdonald2015) highlighted this disparity as a potential source of bias in the record that could affect our understanding of early eukaryote diversification.
In 2018, Riedman and Sadler created a global eukaryote diversity estimate using the constrained optimization method, CONOP, which relies on first- and last-occurrence data for individual taxa, but does not require age constraints for all fossiliferous units. This permitted inclusion of poorly dated, fossil-rich assemblages, but required gathering a large dataset of occurrences to most accurately estimate stratigraphic ranges. This approach also incorporated chemostratigraphic and sedimentological data as additional tie-lines to constrain the ages of units. Because of the required depth of detail, including the integration of multiple publications that addressed the same units but with variable stratigraphic information, this study was limited to the Tonian and Cryogenian (1000 to 635 Ma). The authors found evidence for a rise in diversity associated with the Bitter Springs anomaly (ca. 800 Ma), peaking ca. 770 Ma, and a significant drop that began well before the Cryogenian, driven by last occurrences of widespread long-lived taxa such as Valeria lophostriata and Trachyhystrichosphaera aimika. In 2020, Bykova and colleagues presented an update to the database and analyses of Xiao and Dong (Reference Xiao, Dong, Xiao and Kaufman2006), finding an increase in morphological disparity in the Tonian associated with the appearance of dichotomously branching marine macroalgae. They also reported an increase in taxonomic diversity in the Tonian but noted that this may reflect limited sampling and unstable taxonomy of early Proterozoic macroalgae (Bykova et al. Reference Bykova, LoDuca, Ye, Marusin, Grazhdankin and Xiao2020).
Finally, Riedman and colleagues (Reference Riedman, Porter, Lechte, Santos and Halverson2023) presented a new look at within-formation diversity (WFD) from 1.7 Ga to the end of the Tonian, taking a very narrow view of what constitutes a “likely eukaryote.” This approach closely followed that of Knoll et al. (Reference Knoll, Javaux, Hewitt and Cohen2006), incorporating additional data, including those from the units of the Paleoproterozoic Limbunya Group (the main focus of Riedman et al. [Reference Riedman, Porter, Lechte, Santos and Halverson2023]), and constraining fossiliferous “assemblages” to the formation level, rather than a combination of formations, groups, and horizons as in previous compilations. Their reconstruction shows a high level of diversity in the Tonian relative to much of the Mesoproterozoic, but suggests that species richness of the late Paleoproterozoic and early Mesoproterozoic may be comparable to that of the Tonian if it were better sampled.
Compilations of Proterozoic eukaryote diversity seem to come out every decade or so, and with each one, the pattern changes as new discoveries are incorporated into the datasets. Our paper is right on schedule, publishing 10 years after Cohen and Macdonald (Reference Cohen and Macdonald2015) and incorporating data from an additional 42 formations for a total of 145 eukaryote-bearing formations. In addition to diversity, we looked at patterns in the proportion of eukaryote-bearing assemblages versus all fossiliferous assemblages (from a total of 210 formations) for both shales and cherts, and analyzed patterns in geochemical biomarker data as well. In undertaking this work, we were motivated by several questions. First, we wanted to know the extent to which recent discoveries of diverse fossil assemblages in Paleoproterozoic, Mesoproterozoic, and Tonian rocks would change the prevailing view of a Tonian radiation. Second, we wanted to know whether the proportion of eukaryote-bearing formations relative to all fossiliferous formations increased through time, as might be expected if eukaryotes became more abundant and widespread as they diversified (inspired by Slater and Bohlin Reference Slater and Bohlin2022). Finally, we wanted to see how patterns in eukaryotic body fossil diversity through time compared with those of eukaryotic biomarker diversity through time.
Datasets
We created three datasets. The first consists of lists of eukaryotic species for 154 chert- or shale-hosted assemblages representing 145 formations ranging in age from late Paleoproterozoic (1890 Ma, in the Statherian Period) to the latest Tonian (720 Ma; Supplemental File 1; see Fig. 3 for examples of early eukaryote species). (Because of the limited number of morphological characters and the potential for convergent evolution, we often cannot have great confidence that species assigned to the same genus are closely related to each other, and therefore species, not genera, are the units of comparison both in earlier compilations of Precambrian diversity and the one presented here.) We made every attempt to be as thorough as possible with the paleontological literature but acknowledge that there will have been records we missed. In collecting these data we have been careful to accept, reject, or synonymize taxa based on close comparison of illustrated specimens with genus and species descriptions and holotype images, taking into consideration taphonomic variability. Because of this, we did not accept species occurrences that were not accompanied by a good-quality illustration (q.v. Riedman and Sadler Reference Riedman and Sadler2018). As a result, our identifications and species lists often, but not always, follow those of the authors of the primary literature cited (taxon lists with comments on identifications are included in Supplemental File 1). Furthermore, because this approach considers the taxonomic richness of eukaryotes throughout the Proterozoic, we included only named taxa in our counts. This resulted in our rejection from this database reports of eukaryotes left as unnamed species, including a number of reports from much older rocks of large and/or complex structures proposed to be possible eukaryotes (e.g., El Albani et al. Reference El Albani, Bengtson, Canfield, Bekker, Macchiarelli, Mazurier and Hammarlund2010; Javaux et al. Reference Javaux, Marshall and Bekker2010; Bengtson et al. Reference Bengtson, Rasmussen, Ivarsson, Muhling, Broman, Marone, Stampanoni and Bekker2017; Barlow et al. Reference Barlow, House, Liu, Wetherington and Van Kranendonk2024). When authors placed specimens into a genus but left them in unnamed species (e.g., Germinosphaera sp. A), and those specimens had not been subsequently placed into named species, we included these species in our counts, making the assumption that the author(s) thought that these were distinct from other species in their assemblages, but did not have enough well-preserved specimens to erect a new species. There are 18 of these unnamed species in our dataset, most of which (N = 14) occur in only one formation. (Note that for the four that occur in more than one formation [Germinosphaera sp., Lophosphaeridium sp., Octoedryxium sp., Pterospermopsimorpha sp.], we took care not to include them in counts of range-through taxa [Figs. 1D], because we cannot assume that they are the same biological species across different formations.) In the three cases of open nomenclature that employed “cf.” with reference to a species, we agreed with that provisional identification and counted the occurrence as that species (e.g., Vidalopalla cf. verrucata of Porter and Riedman [Reference Porter and Riedman2016] was counted as Vidalopalla verrucata). Additionally, when specimens were reported only as “VSMs” and indeed conform to that group but could not be further identified, they were treated as a single species and recorded as “VSM” in the database.
Examples of early eukaryote fossil species. A, Valeria lophostriata, Mesoproterozoic Battle Creek Fm, Bullita Group, Northern Territory, Australia. B, Satka favosa, Mesoproterozoic Wondoan Hill Formation, Tijunna Group, Northern Territory, Australia. C, The vase-shaped microfossil Melanocyrillium hexodiadema, late Tonian Kwagunt Formation, Chuar Group, USA. D, Bangiomorpha pubescens, a red alga and the oldest widely accepted crown-group eukaryote, late Mesoproterozoic Hunting Formation, Canada. E, Tappania plana, early Mesoproterozoic Greyson Formation, Belt Supergroup, USA. F, Proterocladus antiquus, Nanfen Formation, late Mesoproterozoic/early Tonian Xihe Group, North China. G, Grypania spiralis, early Mesoproterozoic Greyson Formation, Belt Supergroup, USA. H, Horodyskia moniliformis, early Mesoproterozoic Appekuny Formation, Belt Supergroup, USA. Specimens in (A) and (B) from L.A.R.’s unpublished data, (C) from S.M.P.’s unpublished data. Specimen in (D) courtesy of N. Butterfield, from Butterfield (Reference Butterfield2000) Paleobiology 26:386–404, reproduced with permission from Cambridge University Press. E, Courtesy of N. Butterfield and Z. Adam, used with permission, Adam et al. (Reference Adam, Skidmore, Mogk and Butterfield2017), Geology 45:387–390; permission conveyed through Copyright Clearance Center, Inc. F, Courtesy of Q. Tang, Tang et al. (Reference Tang, Pang, Yuan and Xiao2020), Nature Ecology and Evolution 4:543–549. G, Courtesy of M. Henderson, Henderson (Reference Henderson2010) Master’s thesis, University of Tennessee, Knoxville. H, From M. A. Fedonkin and E. L. Yochelson (Reference Fedonkin and Yochelson2002), Smithsonian Contributions to Paleobiology 94; permission for use provided by Smithsonian Scholarly Press. Scale bars: (A–E), 50 μm; (F) 100 μm; (G, H) as indicated.

Lithofacies type (e.g., shale or chert) was also recorded for each fossiliferous formation. Note that the word “chert” can be ambiguous, sometimes referring to silicified shales or mudstones and sometimes to silicified carbonates. Our use of the term “chert” in this paper should be assumed to be synonymous with “silicified carbonate”; silicified shales were assigned to the “shales” category, as this approach most closely aligned with the original depositional environments, regardless of later diagenetic events. Two eukaryote-bearing units in this dataset include fossils preserved in non-silicified carbonates, the Fifteenmile Group of Canada, which preserves apatitic scale microfossils (ASMs; Cohen and Knoll Reference Cohen and Knoll2012), and the Draken Formation of Svalbard, which preserves VSMs (Knoll et al. Reference Knoll, Swett and Mark1991). These two units also preserve many of the same fossil species in silicified carbonate; species occurrences were therefore combined into a single assemblage under the “chert” designation. If a formation consisted of both fossiliferous cherts and fossiliferous shales, we recorded these as two assemblages (shale hosted and chert hosted), and as a result, there are more assemblages listed in our Supplementary Material (N = 154) than there are eukaryote-bearing formations in our dataset (N = 145). Occasionally, fossils occur in nodules within shales (e.g., VSMs in phosphate nodules in the Upper Formation of the Visingsö Group and VSMs in carbonate nodules in the Kwagunt Formation of the Chuar Group); these were assigned to the “shales” category with the same reasoning that the depositional environments of these fossils are consistent with other shale units. Three Mesoproterozoic sandstone units host Horodyskia species (Cassiterite Creek, Appekunny, and Backdoor Formations); these were assigned to the shale category.
Our second dataset is a non-exhaustive list of all fossiliferous units (at the formation level, unless otherwise noted) from the Archean through late Tonian (N = 221 assemblages, 160 in shales and 61 in cherts, from 210 formations). As in the first dataset, the fossiliferous lithofacies (shales or chert) of each formation is noted, as are the types of taxa they contain. A formation may host (1) only prokaryotes, (2) likely eukaryotes, or (3) likely and possible eukaryotes (note these last two often also host prokaryotes). As in the first dataset, formations that host assemblages in both chert and shale facies are represented in both lithological divisions (e.g., the Sirbu Formation, India). A formation is categorized as containing only prokaryotes if it does not include taxa in our list of possible or likely eukaryotes. Because we excluded most Leiosphaeridia species (with the exception of L. kulgunica and L. wimanii; see below in “What Counts as a Species of Eukaryote?”), fossil assemblages comprising only leiosphaerids were counted as prokaryotic.
For both of these datasets, we assigned ages to the units based on latest evidence from the literature (references are cited in Supplemental File 1). For each eukaryote-bearing formation, we assigned an age based on the midpoint between the maximum and minimum age constraints; for some units, this midpoint calculation was overridden if there was additional information that helped constrain the age further. For example, the age constraints on the Gouhou Formation, Huaibei Group, are between 820 Ma and the base of the Cambrian (538 Ma), but instead of using the midpoint (679 Ma), we assigned an age that accorded with the biostratigraphic inferences of Xiao et al. (Reference Xiao, Shen, Tang, Kaufman, Yuan, Li and Qian2014) and Tang et al. (Reference Tang, Pang, Yuan, Wan and Xiao2015). In many cases, these assigned ages are rough estimates; age uncertainties (maximum minus minimum age constraints) ranged on average ca. 150 Myr. As a result, we used large bins (200 Myr) to estimate global diversity and used moving windows to limit the boundary effects of static bins.
The third dataset consists of biomarkers, also known as molecular fossils. These are organic compounds preserved in sedimentary rocks that can provide a complementary view of eukaryote diversity, potentially capturing those eukaryotes that leave no preservable morphology (Briggs and Summons Reference Briggs and Summons2014; Summons et al. Reference Summons, Welander and Gold2022). There are many types of organic compounds that can serve as molecular fossils, but steranes have been particularly important for studying the origin of eukaryotes. Steranes are the diagenetic products of sterol lipids, which are a critical component of the lipid membranes of nearly all eukaryotes. Steranes are often treated as eukaryote biomarkers in the literature, although growing evidence for sterol biosynthesis in some bacteria complicates this narrative (Wei et al. Reference Wei, Yin and Welander2016; Hoshino and Gaucher Reference Hoshino and Gaucher2021; Brown et al. Reference Brown, Olagunju, Giner and Welander2023). In this paper, we have surveyed the literature for sterane biomarkers from their first known appearance to the late Tonian. This dataset is taken largely from Brocks et al. (Reference Brocks, Nettersheim, Adam, Schaeffer, Jarrett, Güneli, Liyanage, van Maldegem, Hallmann and Hope2023)—one of the most recent and comprehensive analyses on Proterozoic steranes—with additional data from Zumberge et al. (Reference Zumberge, Rocher and Love2020), using our own age estimates of the relevant formations (discussed earlier). The results are included in Supplemental File 4.
What Counts as a Species of Eukaryote?
Because the fossils and their eukaryotic affinities are the data in estimates of eukaryote diversity, the determination of eukaryotic affinity is of critical significance. Indeed, across each of the studies of eukaryote diversity discussed earlier, the criteria used for a eukaryotic diagnosis varied strongly, and often was absent or not straightforwardly presented. Some studies for example, accepted large size (defined >50 or >60 μm; Knoll et al. [Reference Knoll, Javaux, Hewitt and Cohen2006] and Schopf [Reference Schopf, Schopf and Klein1992], respectively) as indicative of eukaryotic affinity. However more recent studies in modern bacteriology, have revealed prokaryotes capable of attaining sizes of hundreds to thousands of micrometers (Schulz and Jørgensen Reference Schulz and Jørgensen2001; Volland et al. Reference Volland, Gonzalez-Rizzo, Gros, Tyml, Ivanova, Schulz, Goudeau and Elisabeth2022). Thus, large size is no longer considered a reasonable, stand-alone metric for eukaryotic interpretation.
Recognizing that there are grades of confidence in assigning fossils to eukaryotes, we chose to make a distinction between “likely eukaryotes” and “possible eukaryotes.” Likely eukaryotes were identified on the basis of characters that are widely taken as indicative of at least total-group affinity (e.g., Javaux et al. Reference Javaux, Knoll and Walter2003), including processes or other vesicle ornamentation thought to indicate a cytoskeleton and/or internal vesicles, operculae, and cellular differentiation such as holdfasts. Possible eukaryotes had features that were consistent with a eukaryote affinity—and indeed were at least sometimes regarded in the literature as eukaryotes—but not unambiguously so, for example, large size (hundreds of micrometers to several millimeters; e.g., Chuaria circularis, Grypania spiralis, Beltina dalensis, and Leiosphaeridia wimanii), possession of internal bodies (e.g., Pterospermopsimorpha spp. and Vandalosphaeridium koksuicum), aggregates of smaller bodies (e.g., Microlepidopalla mira and Squamosphaera colonialica). For each species in our dataset, we have provided a brief description of its morphology and the basis for its assignment to likely eukaryotes (N = 151) or possible eukaryotes (N = 30) (Supplementary File 1). In the end, however, these distinctions did not affect the pattern or our conclusions (see “The Effect of Different Interpretations and Different Taxa on Diversity Patterns” below).
One way in which our approach differs from previous studies is that we have opted not to include most species of Leiosphaeridia, a form taxon that groups together simple, smooth-walled spheres and probably includes eukaryotic forms (Javaux et al. Reference Javaux, Knoll and Walter2004). Multiple species of Leiosphaeridia have been named over the years, but most were synonymized into four species, divided on the basis of size and wall thickness (the latter usually estimated using opacity; L. jacutica, L. crassa, L. tenuissima, and L. minutissima; Jankauskas et al. Reference Jankauskas, Mikhailova and Hermann1989; Butterfield et al. Reference Butterfield, Knoll and Swett1994). These species are themselves almost certainly a polyphyletic mix, and they are present in nearly every fossil assemblage. Including them in our analyses would raise diversity counts across the board by the addition of four species, but otherwise not affect the pattern. Therefore, with the exception of L. kulgunica, which on the basis of its circular pylome we consider a likely eukaryote, and L. wimanii, which on the basis of its large size (800 to 2500 μm) we consider a possible eukaryote, we opted not to include Leiosphaeridia species in our analyses.
Other differences in species counts may reflect the recognition of taphonomic variants (e.g., Grey and Willman Reference Grey and Willman2009) and organ taxa (e.g., Butterfield Reference Butterfield2004), as well as the discovery of new forms from previously studied units. Thus, eukaryote species counts from any individual formation may contract and expand with each subsequent compilation, reflecting continued critical assessment and new discovery. The late Tonian Upper Visingsö Formation illustrates this dynamic. Its fossils were first described by Vidal (Reference Vidal1976), with 24 species counted in initial compilations (Vidal and Knoll Reference Vidal and Knoll1982, Reference Vidal and Knoll1983), then 16 (Knoll Reference Knoll1994), then 12 (Knoll et al. Reference Knoll, Javaux, Hewitt and Cohen2006), then 8 (Cohen and Macdonald Reference Cohen and Macdonald2015). However, additional studies published after Vidal’s (Reference Vidal1976) monograph added more than a dozen new species (Martí Mus and Moczydłowska Reference Martí Mus and Moczydłowska2000; Porter et al. Reference Porter, Meisterfeld and Knoll2003; Loron and Moczydłowska Reference Loron and Moczydłowska2018; Riedman et al. Reference Riedman, Porter and Calver2018), and our count now stands at 18. Were it not for these additional species, our count from Vidal (Reference Vidal1976) would be five.
A final note about crown versus stem eukaryotes and the timeline of early eukaryote evolution: the oldest convincingly eukaryotic fossils (“likely eukaryotes” in our dataset, ca. 1.7 Ga), include several species characterized by ornamented or otherwise elaborate vesicles such as the concentrically striated Valeria lophostriata (e.g., Javaux Reference Javauxs. d.; Lamb et al. Reference Lamb, Awramik, Chapman and Zhu2009; Miao et al. Reference Miao, Moczydłowska, Zhi and Zhu2019; Riedman et al. Reference Riedman, Porter, Lechte, Santos and Halverson2023), the plate-bearing Satka favosa (e.g., Miao et al. Reference Miao, Moczydłowska, Zhi and Zhu2019; Riedman et al. Reference Riedman, Porter, Lechte, Santos and Halverson2023) and the process-bearing Tappania plana (Yin Reference Yin1997; Prasad and Asher Reference Prasad and Asher2001; Riedman et al. Reference Riedman, Porter, Lechte, Santos and Halverson2023; Fig. 3). These characters—complex ornamentation, platy construction, and elaborate extensions known as processes—suggest the presence of Golgi-like organelles, a sophisticated cytoskeleton and a complex endomembrane system, characters common across eukaryotes but absent in prokaryotes (Javaux Reference Javauxs. d.; Agić et al. Reference Agić, Moczydłowska and Yin2015; Riedman et al. Reference Riedman, Porter, Lechte, Santos and Halverson2023). This does not imply, however, that these fossils are part of crown eukaryotes, the clade that includes the last eukaryotic common ancestor (LECA) and all of its descendants. Rather, these characters could have evolved in the stem lineage of eukaryotes, after the first eukaryotic common ancestor (FECA) had split from eukaryotes’ closest living relatives, but before the LECA had evolved. Hence, we can confidently assign these fossils to total eukaryotes, but do not know whether they fall in the crown or the stem (Porter and Riedman Reference Porter and Riedman2023). In fact, nearly all early eukaryote fossils, including many from the Tonian, cannot be confidently assigned to crown eukaryotes, and in previous diversity compilations, distinctions between stem- and crown-group taxa were not made. (We assume the term “eukaryote” in these papers refers to total-group [stem + crown] eukaryotes.) We therefore have not made any attempt to distinguish between crown and stem eukaryotes in our own analyses. Rather, the terms “likely eukaryote” and “possible eukaryote” map on to our interpretations of “total eukaryote” and “possible total eukaryote” respectively.
The Raw Data
Figure 4 shows the total number of eukaryotic species in each formation for all eukaryote-bearing formations in our dataset. These are divided into six 200 Myr time bins and ordered within each bin from most to least speciose. Because shales and cherts represent different environmental windows, we plotted species counts for shale-hosted assemblages and chert-hosted assemblages separately.
Number of eukaryotic species in each formation in our dataset, rank ordered from most to least diverse within each time bin. All eukaryotic species, including possible eukaryotes, are shown; formations are divided into shales (left) and cherts (right). Note that some formations preserve both chert- and shale-hosted fossils, and thus are represented in both plots. See Supplementary File 1 for more details.
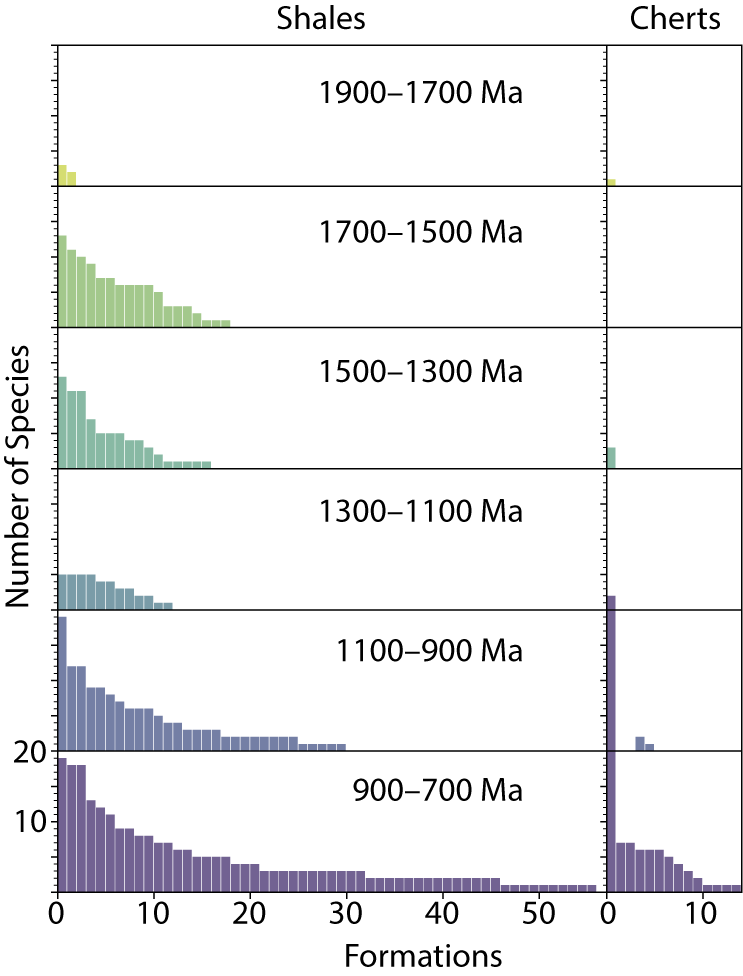
There are several striking features of these plots. Most striking is the difference in the number of eukaryote occurrences in shale versus chert lithofacies. In contrast to the shales, for which we have 136 formations that host eukaryote fossils, the chert window is nearly devoid of eukaryotes. Two of the chert bins are empty and three others have one or two formations with one to three species each. Only in the youngest bin do eukaryotes show up with some regularity in chert assemblages, and even then they occur in relatively low species numbers (one to seven species), with the exception of a single unit, the “Reefal Assemblage” in the Fifteenmile Group, Canada, which hosts a diverse assemblage of ASMs along with four species of organic-walled microfossils (OWMs; all likely eukaryotes), totaling 42 species (Allison and Hilgert Reference Allison and Hilgert1986; Allison and Awramik Reference Allison and Awramik1989; Cohen and Knoll Reference Cohen and Knoll2012; Cohen et al. Reference Cohen, Irvine and Strauss2017). This difference between eukaryotes in shale versus chert facies was evident in the earliest compilations: both Vidal and Knoll (Reference Vidal and Knoll1983) and Schopf (Reference Schopf, Schopf and Klein1992) remarked on the absence of eukaryote fossils in supratidal and intertidal carbonate environments where early diagenetic chert forms and suggested this reflects the absence of eukaryotes from these restricted and often hypersaline environments (Knoll Reference Knoll1985). This pattern still holds after 40 years of additional data, with the notable exception of the late Tonian VSMs, which occur more often in chert facies (10 VSM assemblages) than in shale facies (6 VSM assemblages) and are the sole eukaryotic fossils in 7 of the 14 eukaryote-bearing chert assemblages from 900–700 Ma.
A second striking feature is that the time bins vary dramatically in their number of formations (Fig. 4). We suspect this reflects variations in paleontological sampling efforts and possibly sedimentary rock volume through time, and discuss this in more detail below (see “Discussion.”)
Finally, for any given time bin, there are only a small number of formations for which relatively high levels of diversity are recorded; units with three or fewer species account for about one-third to one-half of the formations in each time bin. We suggest that this primarily reflects differences in the depth of taxonomic study, rather than differences in preservation or environment. Schopf (Reference Schopf, Schopf and Klein1992) estimated that about 5% of the assemblages in his analysis had had a monographic level of study, whereas 70–80% were reports of “first discovery,” and an additional ~25% were follow-up studies. We estimate a roughly similar breakdown in our dataset and suggest that more extensive studies of these units will turn up additional species. In this sense, our dataset serves as a “to-do list” of units ripe for restudy.
Comparisons with Previous Compilations
One of the questions motivating this paper is the extent to which diversity patterns have changed over the decades with the addition of new fossil discoveries. Figure 1D shows global diversity of all eukaryotes (possible+likely) based on our new dataset, plotted to match that of Knoll (Reference Knoll1994); note bins are of unequal span. Each bin shows the total number of species observed in that bin plus the number of range-through taxa inferred to have been present in that bin based on occurrences before and after. (The oldest and youngest bins therefore lack range-though taxa.) The dashed black line in Figure 1D represents the estimates from Knoll (Reference Knoll1994). While our diversity estimates for the 750–700 Ma bin are somewhat lower than those of Knoll (Reference Knoll1994)—probably reflecting a combination of redated units and the fact that unlike Knoll (Reference Knoll1994), we present a 750–700 Ma bin with no range-through taxa—the other bins show an increase by ~200% to >500%. We also plotted within-formation diversity for the four most diverse formations in each time bin (Fig. 2C) in the style of within-assemblage diversity plots of Knoll et al. (Reference Knoll, Javaux, Hewitt and Cohen2006; Fig. 2A) and Cohen and Macdonald (Reference Cohen and Macdonald2015; Fig. 2B), wherein the width of the bar represents age constraints on the formation. Similar to the global diversity estimates (Fig. 1D), these plots show that the dramatic difference in diversity between the Tonian Period and earlier intervals present in older studies (e.g., Knoll et al. Reference Knoll, Javaux, Hewitt and Cohen2006) has diminished significantly.
The Effect of Different Interpretations and Different Taxa on Diversity Patterns
Figure 5 shows global diversity through time for different sets of fossil taxa, using a 200 Myr moving window. Most evident is the spike in diversity ca. 800 Ma driven entirely by the apatitic scale microfossils (ASMs), a variety of complexly ornamented, circular, square, oval, or polygonal disks 7–68 μm wide that provide the earliest evidence for controlled biomineralization in eukaryotes (Allison and Hilgert Reference Allison and Hilgert1986; Cohen et al. Reference Cohen, Schopf, Butterfield, Kudryavtsev and Macdonald2011, Reference Cohen, Irvine and Strauss2017). These are known only from a single locality, but they contribute 38 species, 21% of all species in our dataset.
Global eukaryote diversity as a function of time, for different sets of taxa. All eukaryotic species in the dataset (dotted red line); all eukaryotic species except apatitic scale microfossils (ASMs; solid line); all species except ASMs and possible eukaryotes (blue line); all eukaryotic species except ASMs, possible eukaryotes, and macroscopic fossils (orange line). Data were generated using a 200 Myr moving window with 20 Myr shifts; values are presented as the midpoint of each window (e.g., global diversity and the number of formations for the 950–750 Ma window is plotted at 850 Ma); the window’s left edge runs from 1900 to 800 Ma. Range-through species are not included.

More interesting is the effect of removing possible eukaryotes, which account for 30 species in our database (and 27% of non-ASM species). This translates the curve downward, somewhat more so in earlier intervals than later, reflecting the fact that the proportion of possible eukaryotes drops through time from 30–40% to 10–20% (Supplementary Fig. S1; this analysis does not include ASMs). This is perhaps not surprising if some of these possible (i.e., ambiguous) eukaryotes represent either prokaryotes or early branching stem eukaryotes, which would have been proportionally more common earlier in eukaryote history. The overall diversity trend, however, is not substantively different. Similarly, further removing species of macroscopic eukaryotes (N = 15) results in no substantive difference in the overall trend, consistent with the fact that they compose a relatively small part of our dataset.
Given the outsize effect that ASMs have on diversity patterns and the fact that their time of origin is poorly constrained, we do not include them in the analyses shown in Figures 6–8; note that including them does not have an effect on the patterns discussed later (Supplemental File 5, Supplementary Figs. S2, S5, S6). We do include macroscopic species in these analyses. We show results for both likely eukaryotes only and all eukaryotes (possible + likely), but as is the case with the analyses that include ASMs, these tell the same story.
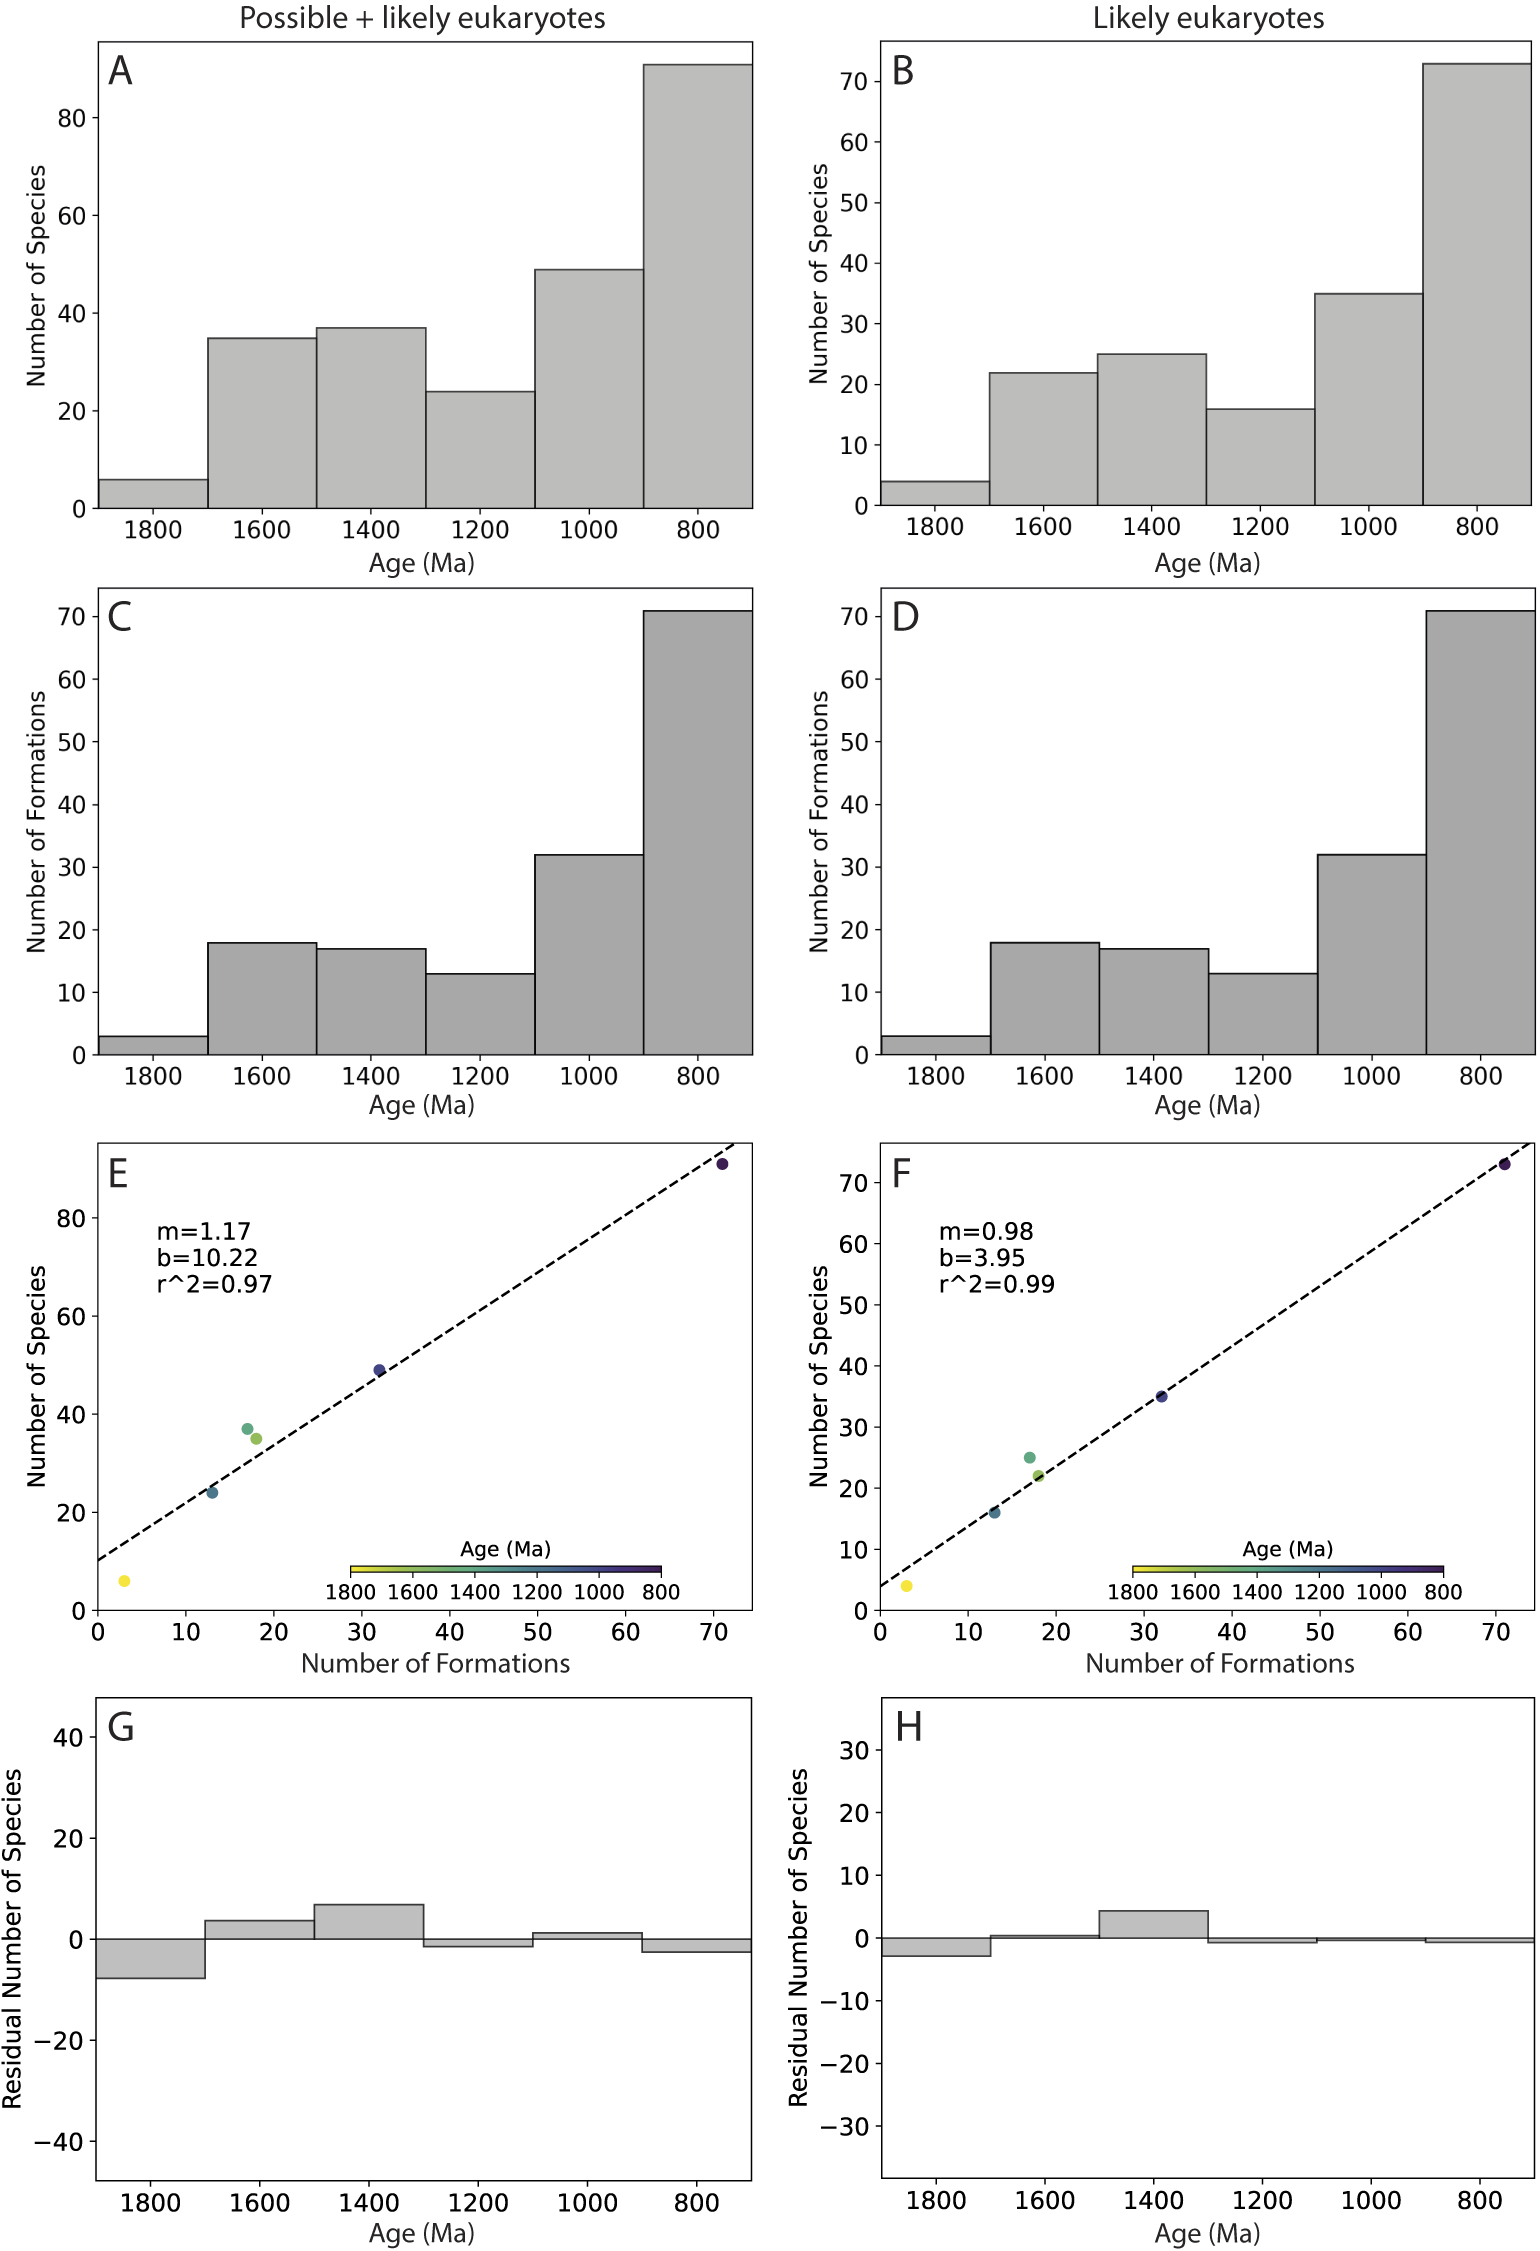
Global diversity and the number of eukaryote-bearing formations through time. A,B, Global eukaryote diversity as a function of time, using 200 Myr bins. C,D, The number of eukaryote-bearing formations as a function of time, using 200 Myr bins. E,F, Global eukaryote diversity as a function of the number of eukaryote-bearing formations. G,H, The residual number of species for each time bin based on the linear best-fit model (shown in E–F). Left column (A, C, E, G) shows analyses for all eukaryotes (possible + likely); right column (B, D, F, H) shows analyses for likely eukaryotes only. Range-through species and apatitic scale microfossils (ASMs) are excluded from the analyses.
Global Diversity, Within-Formation Diversity, and the Number of Formations
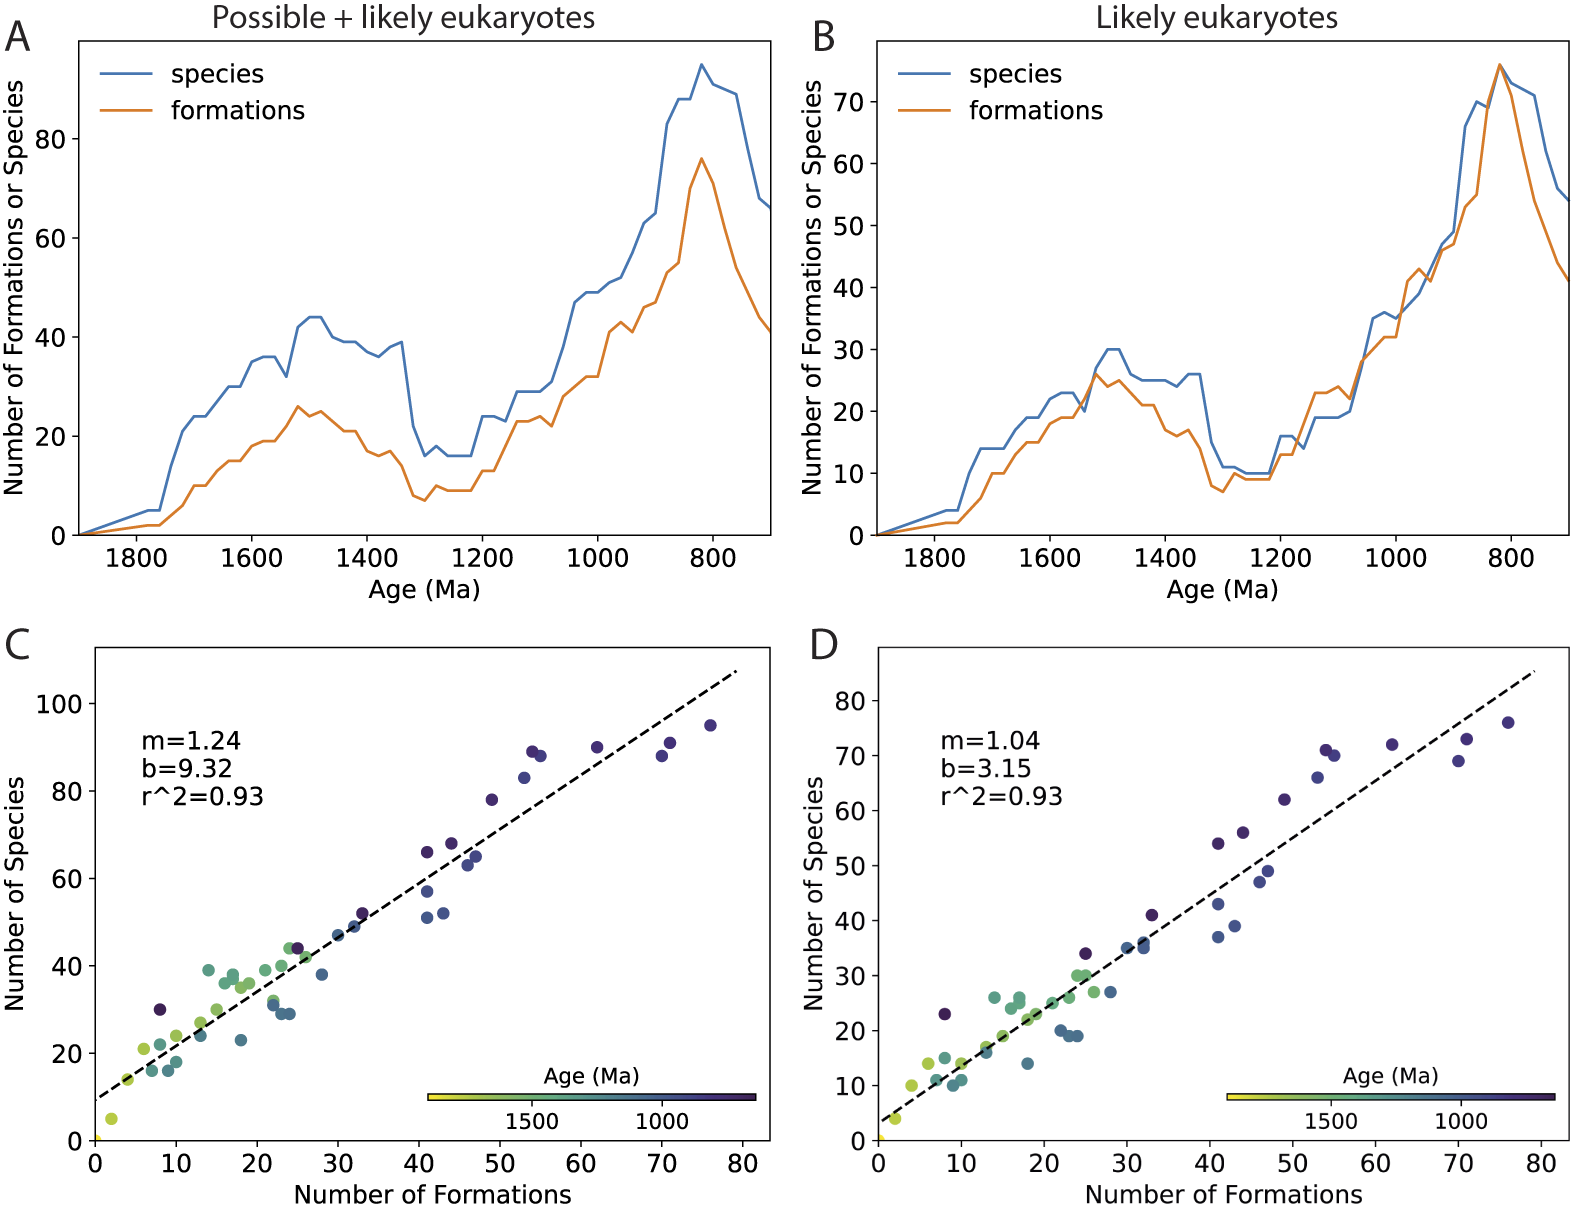
Figure 6A,B shows global eukaryote diversity through time for possible + likely eukaryotes and for likely eukaryotes only, separated into 200 Myr bins (no range-through species are included here or in any subsequent plots). These plots show a striking similarity to the number of eukaryote-bearing formations in each bin (Fig. 6C,D). Plots of global diversity versus the number of formations (Fig. 6E,F) confirm that there is a strong linear relationship between these two variables (r 2 = 0.97, 0.99). Figure 6G,H shows the residuals, that is, the extent to which the number of species is over- or underpredicted by the linear best-fit models in Figure 6E,F. We also made plots that varied the taxa (e.g., all taxa including ASMs; Supplementary Fig. S2), bin size (100 Myr; Supplementary Fig. S3), and lithofacies (shales only; Supplementary Fig. S4), and consistently found strong linear relationships between the number of samples and the number species in a bin (r 2 = 0.99, 0.90, and 0.98, respectively). We also plotted estimates of global diversity and the number of formations versus time using a moving window of 200 Myr to get around the effect that arbitrary bin boundaries have on the pattern (Fig. 7A,B); Figure 7C,D shows the estimates of global diversity plotted against the number of formations, color coded with respect to time. The strong relationship between the number of species and the number of formations through time is evident here as well (r 2 = 0.93, 0.93), and analyses that included ASMs also show a strong relationship (Supplementary Fig. S5; r 2 = 0.89). Overall, these analyses indicate that the number of eukaryote-bearing formations in our dataset from any given time interval is an exceptionally strong predictor of global eukaryote diversity during that time interval.
The 200 Myr moving window plot of global eukaryote diversity and the number of eukaryote-bearing formations through time. Left column shows analyses for all eukaryotes (possible + likely); right column shows analyses for likely eukaryotes only. Apatitic scale microfossils (ASMs) are excluded from both analyses. A,B, Global eukaryote diversity (blue line) and number of eukaryote-bearing formations (orange line) plotted as a function of time using a 200 Myr moving window with 20 Myr shifts. C,D, Global eukaryote diversity plotted as a function of the number of eukaryote-bearing formations through time. Values are presented as the midpoint of each window; the window’s left edge runs from 1900 to 800 Ma. Range-through species are not included. Note that the individual points are not fully independent; any single formation will appear in 10 different bins. However, note also that roughly the same slope seems to describe variation within a broader age range (e.g., 1600–1200 Ma) and between broader age ranges (e.g., 1800–800 Ma).
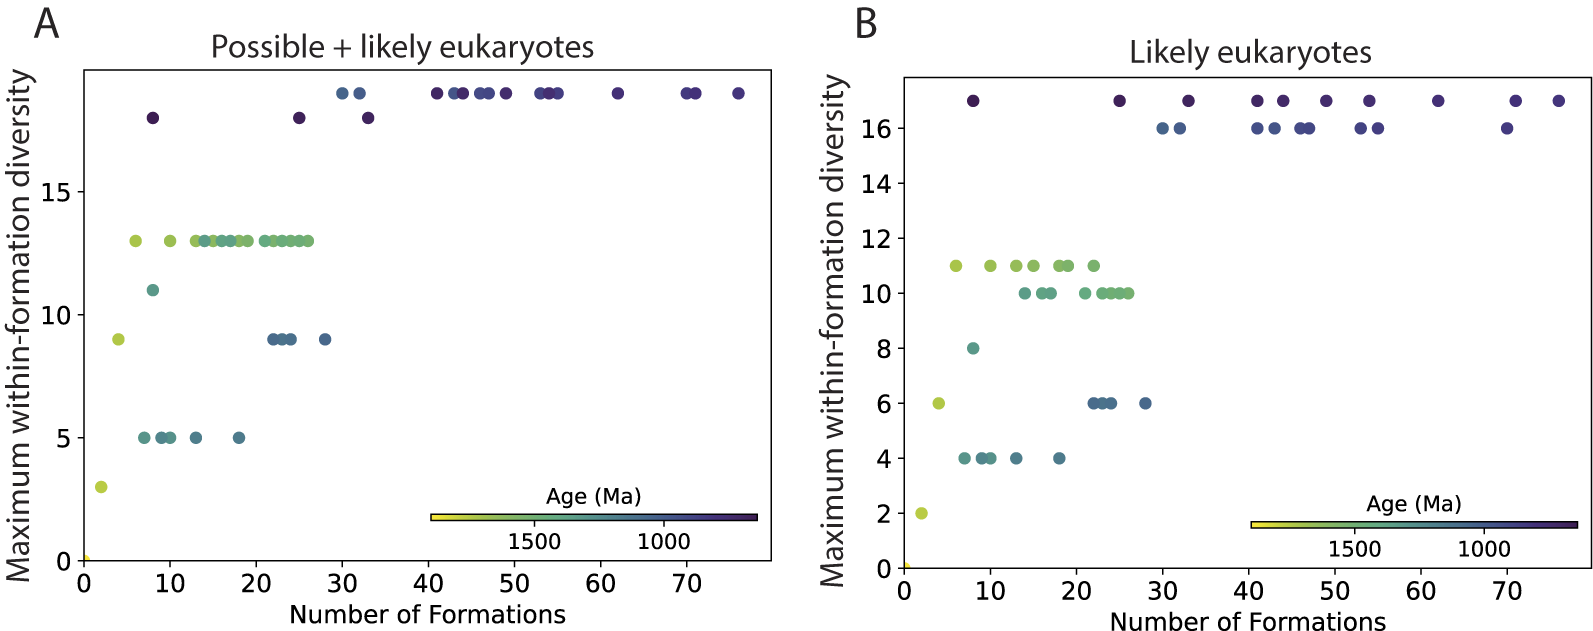
Within-assemblage diversity estimates have been used to circumvent sampling bias (e.g., Bambach Reference Bambach1977; Knoll et al. Reference Knoll, Javaux, Hewitt and Cohen2006), but our analyses suggest that here, too, the number of eukaryote-bearing formations in a bin influences these estimates. Figure 8 shows the within-formation diversity (WFD) for the single most diverse formation within a time bin (maximum WFD), plotted against the total number of formations within that bin using a 200 Myr moving window. The results suggest there is a lower bound on a bin’s maximum WFD that is predicted by the number of formations in that bin. For example, the analysis for possible + likely eukaryotes (Fig. 8A) shows that for a bin with 10 formations, its maximum WFD is at least 5 species; for a bin with 25 formations, its maximum WFD is at least 9 species; and for a bin with 50 formations, its maximum WFD is no fewer than 19 species. Similar results are found for likely eukaryotes only (Fig. 8B) and for all taxa including ASMs (Supplementary Fig. S6).
Maximum within-formation diversity (WFD), defined as the diversity of the highest-diversity formation, for a given time bin plotted as a function of the number eukaryote-bearing formations in that bin. Values were calculated using a 200 Myr moving window with 20 Myr shifts. A, All eukaryotic species (possible + likely). B, Likely eukaryotes only. Apatitic scale microfossils (ASMs) are excluded from these analyses.
Do Eukaryote-bearing Assemblages Become More Common through Time?
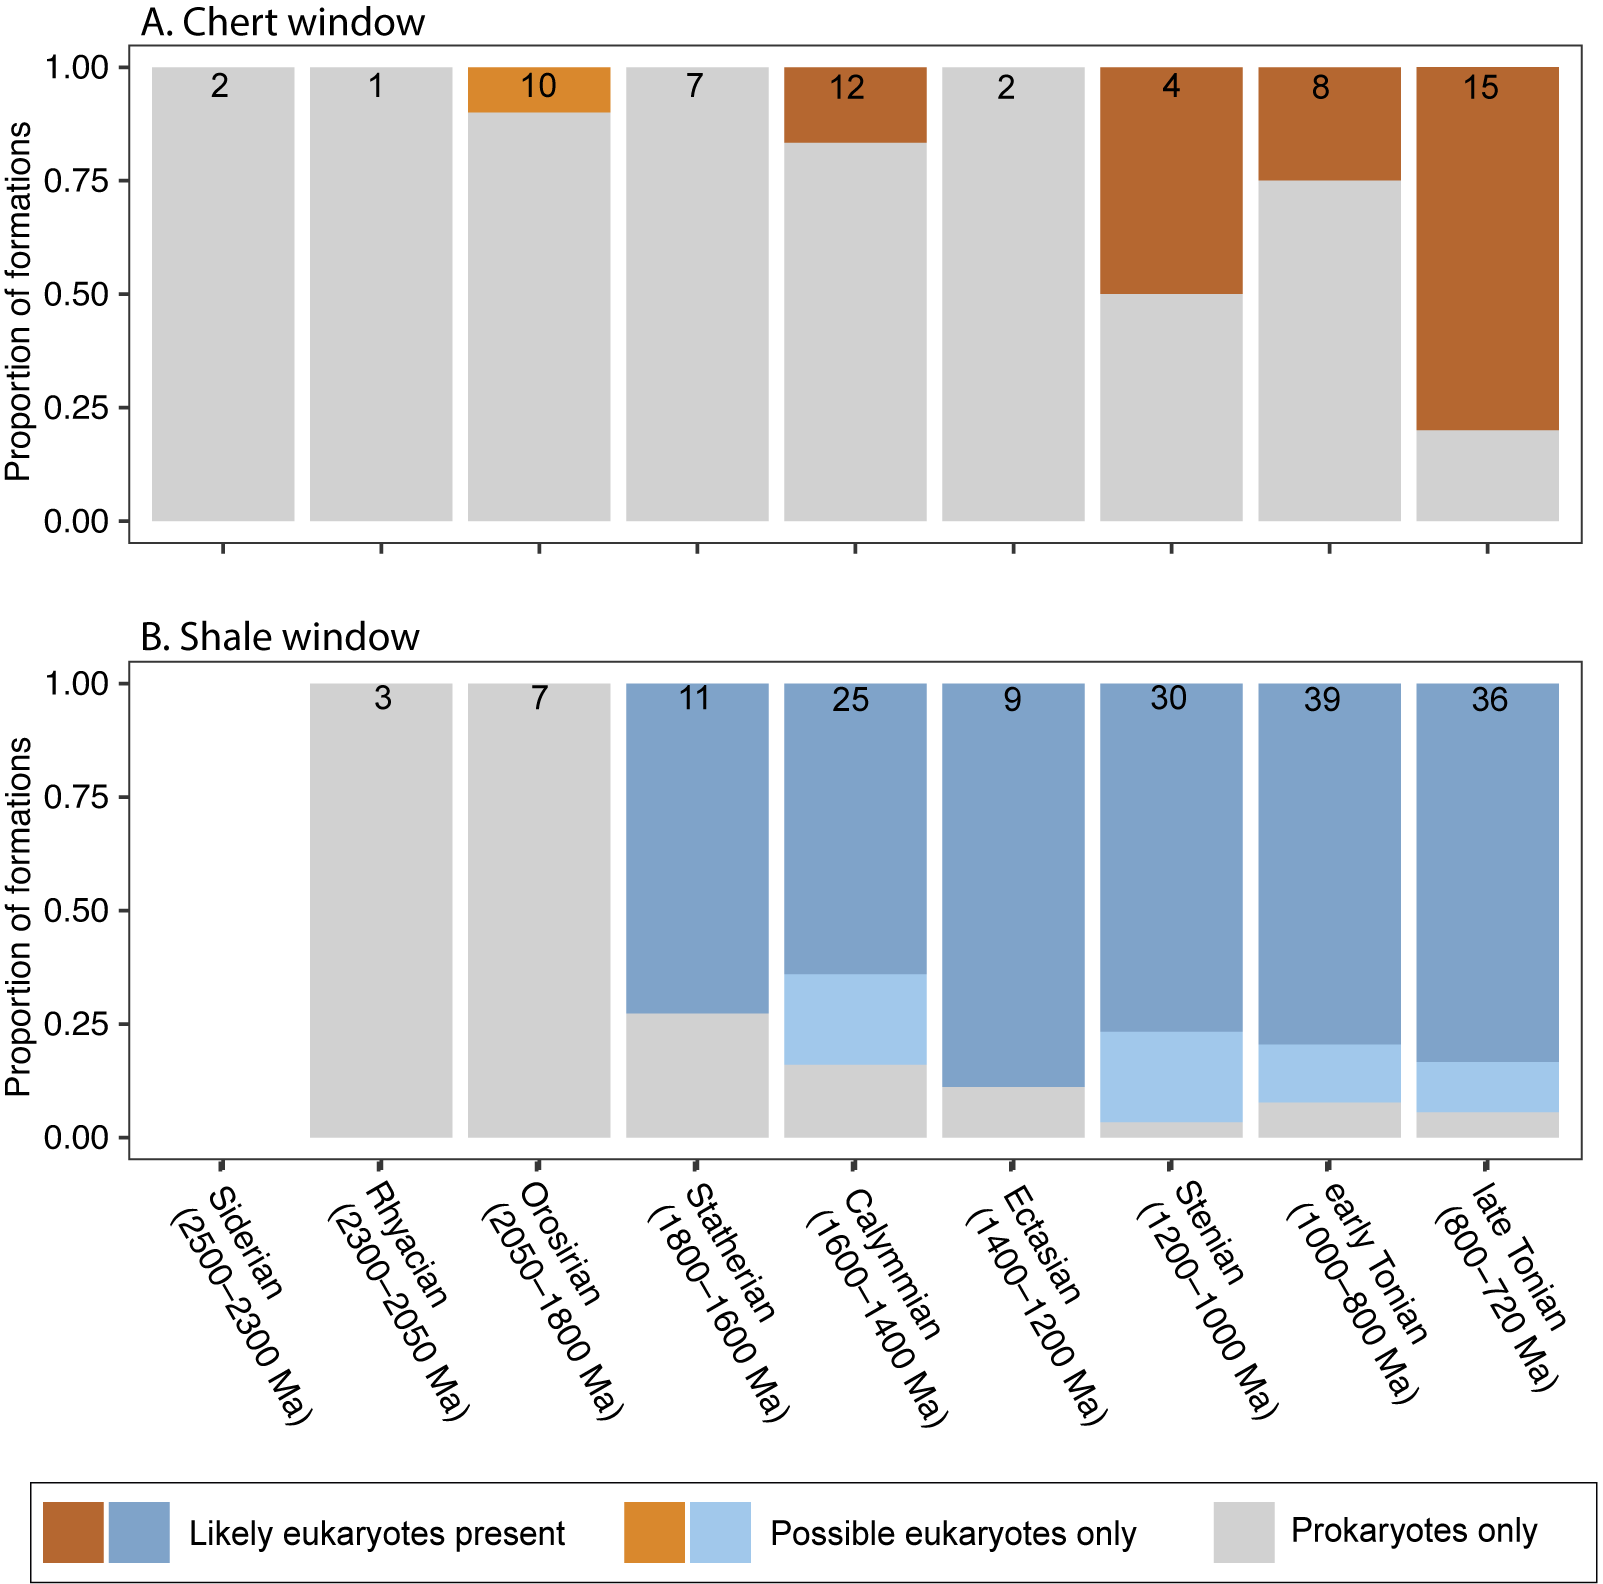
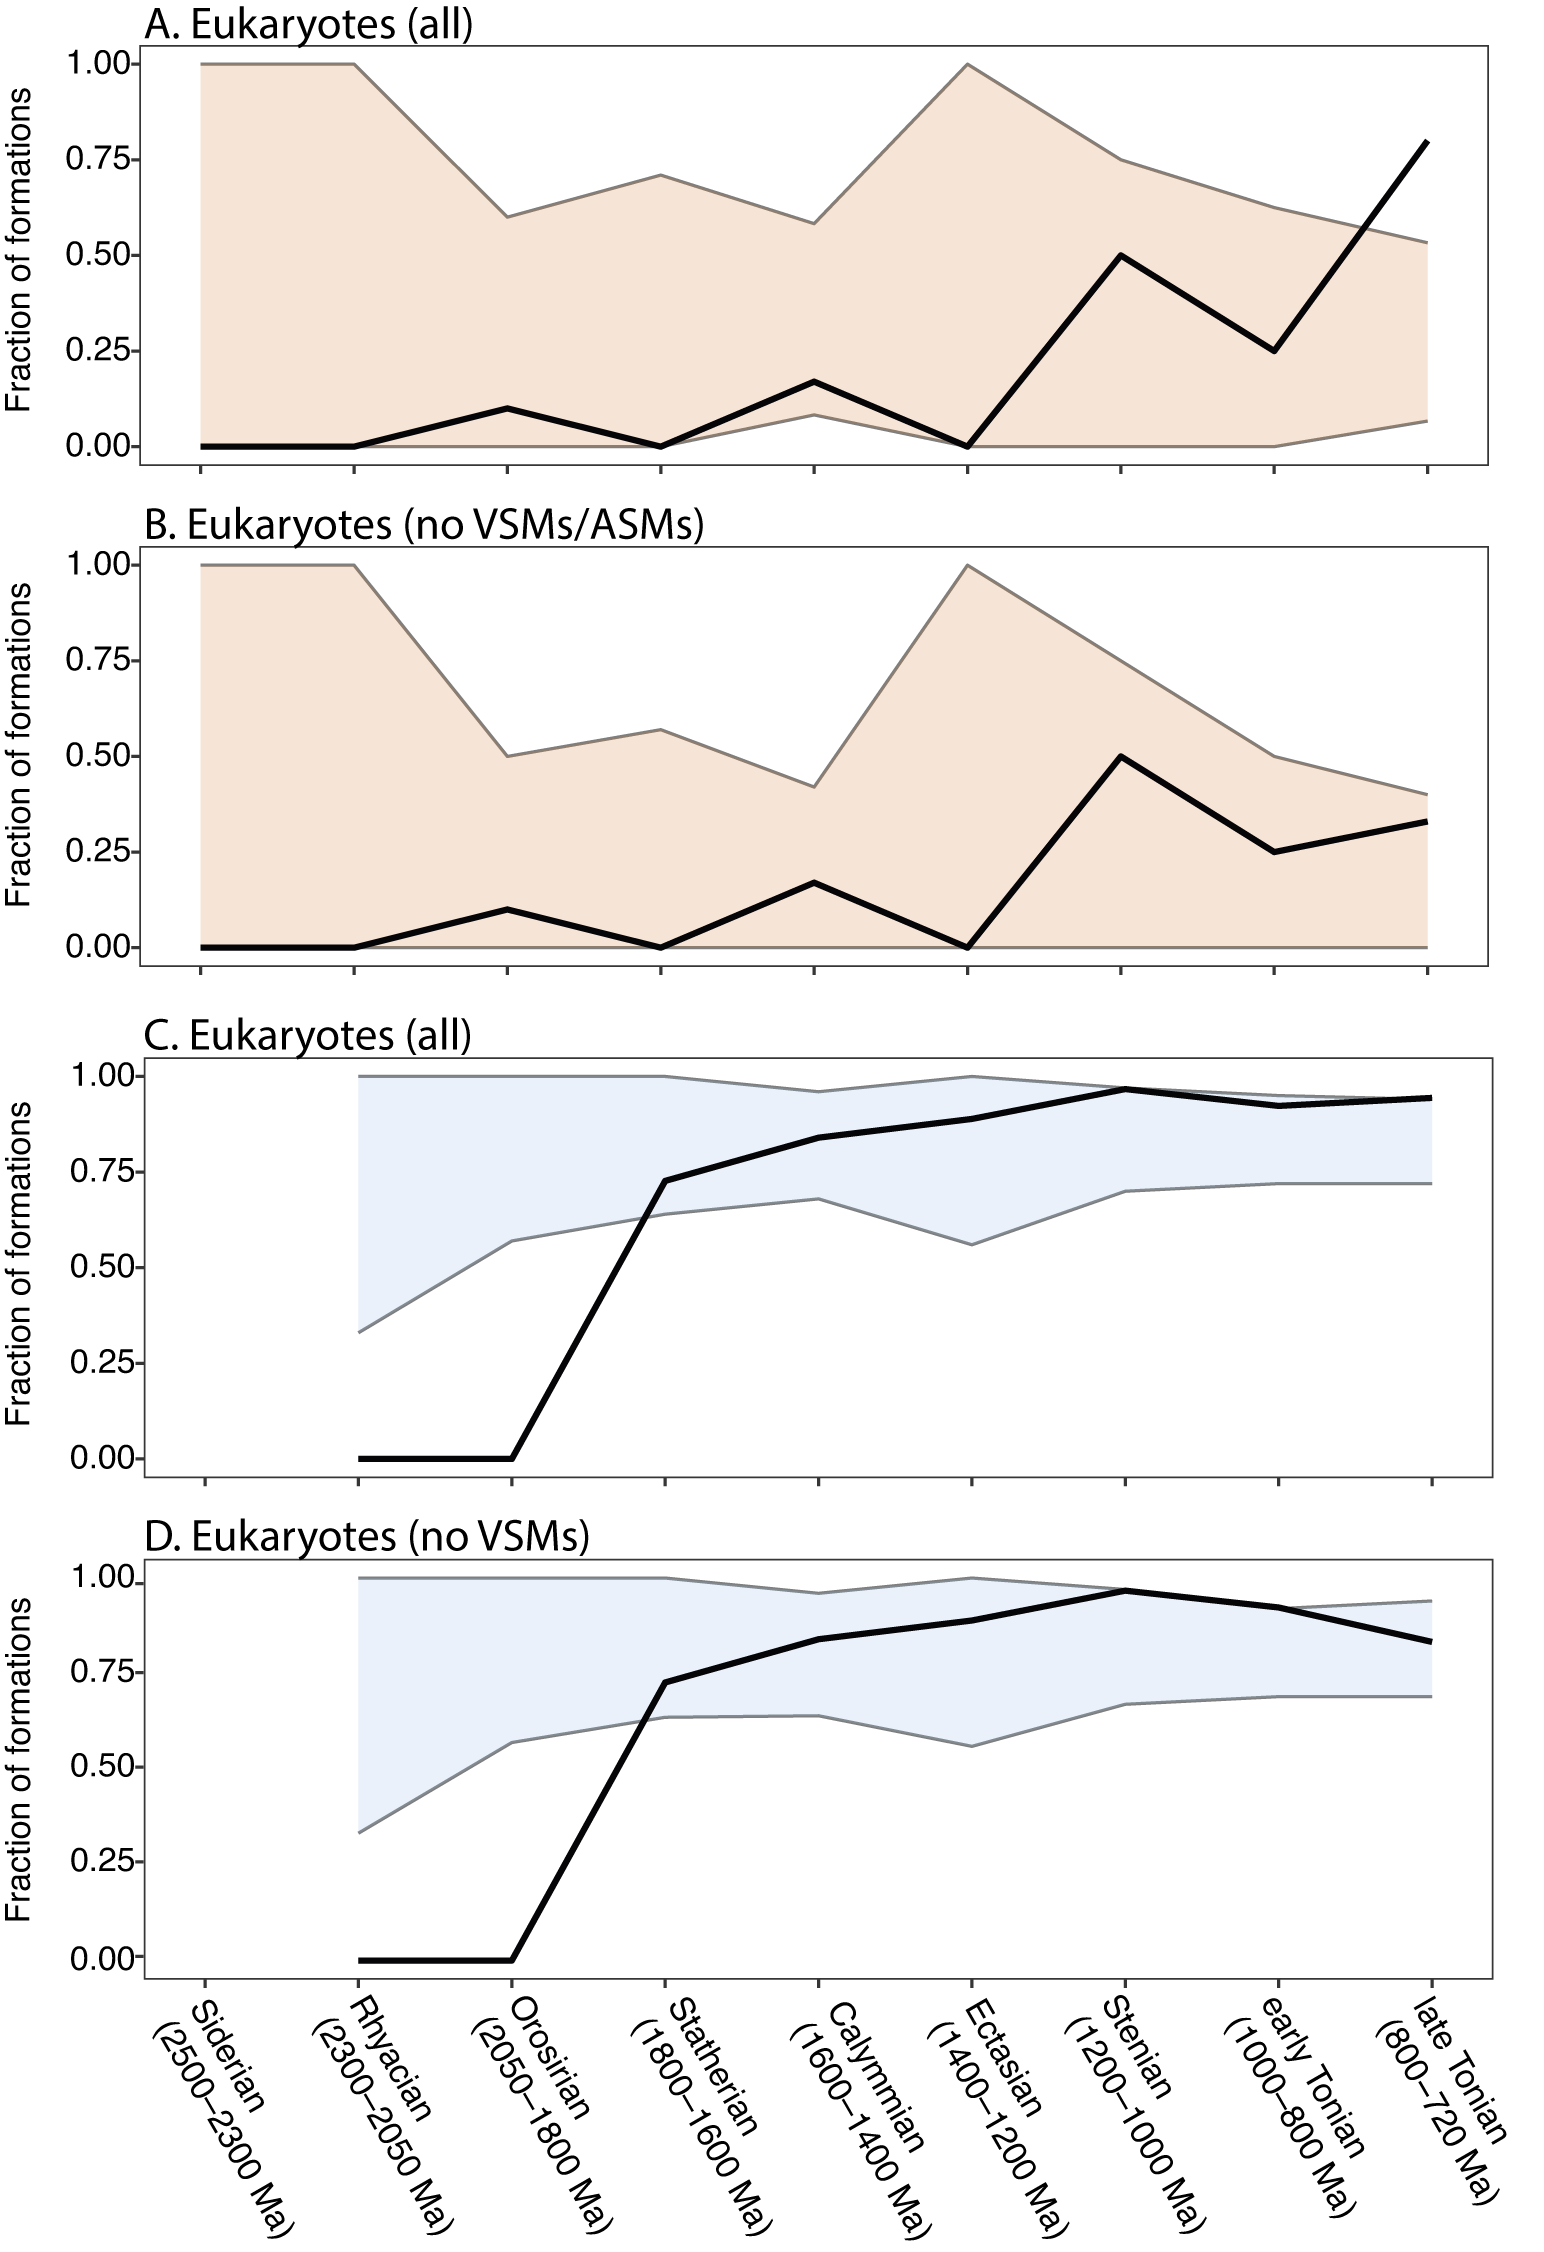
A recent paper by Slater and Bohlin (Reference Slater and Bohlin2022) showed that during the Ediacaran–Cambrian radiation of animals, organic-walled microfossil assemblages began to record, in increasing proportion, the presence of animals (or possible animals), from 0% of assemblages in the Tonian through early Ediacaran, to ~25% in the late Ediacaran, to ~50% in the earliest Cambrian (Fortunian). We were curious to see whether there was a similar pattern associated with the diversification of eukaryotes across the Proterozoic, that is, whether eukaryote-bearing assemblages might become more common relative to all fossil assemblages as a result of an ecological expansion of eukaryotes, especially during the Tonian. Figure 9 shows the number of eukaryote-bearing formations as a fraction of the total number of fossiliferous formations for both the chert window (Fig. 9A) and the shale window (Fig. 9B). Within chert, the proportion of eukaryote-bearing formations generally increases over time, with the Stenian (1200–1000 Ma) and late Tonian (800–720 Ma) containing the highest proportions (50% and ~80% of formations, respectively). Within the shale window, the proportion of eukaryote-bearing formations steadily increases from 73% to 94% after the first appearance of eukaryotes in the Statherian (1800–1600 Ma). Not surprisingly, however, the total number of fossiliferous units also varies through time. To test whether the increase in eukaryote-bearing formations is driven by the number of formations that have been sampled within each time interval, we compared the observed fraction of eukaryote-bearing formations with the range of possible values that would be expected if there were no change in the frequency of eukaryote-bearing formations through time (Fig. 10). This was achieved by randomly resampling (with replacement) the number of formations found within each time bin (see Fig. 9) from the total number of formations (N = 61 for chert; N = 160 for shale), calculating the proportion of eukaryote-bearing formations from the subsample, and then repeating this process 1000 times. The 95% confidence interval of these repetitions represents the likely range of eukaryote-bearing formations based on the level of sampling of each time bin. We find that, in most cases, the reported fraction of eukaryote-bearing formations falls within these confidence intervals. Within the chert window, the late Tonian (800–720 Ma) is an exception; the observed fraction of eukaryote-bearing formations exceeds the range predicted by random resampling (Fig. 10A). However, when the occurrences of both VSMs and ASMs are removed, all observed fractions are within the 95% confidence interval of the randomly resampled data (Fig. 10B). Within the shale window, no eukaryote-bearing formations occur within the Rhyacian and Orosirian (2300–1800 Ma), and therefore observed values fall below the resampled data. Other than showing that no eukaryotes have been found before 1800 Ma, the large difference in the observed values and randomly sampled values is a reflection of the large mismatch in the sampling intensity of shales before the appearance of eukaryotes (N = 10) as well as the generally low number of formations reported that contain only prokaryotic taxa after the appearance of eukaryotes (N = 19). These results do not significantly change when considering only likely eukaryotes (excluding possible eukaryotes; Supplementary Fig. S9). Thus, with the exception of VSMs in late Tonian cherts, there is no evidence that eukaryote-bearing formations became proportionally more common through the Proterozoic.
Prokaryote- and eukaryote-bearing formations through the Proterozoic. Formations are divided by lithology into (A) chert/carbonate (orange) and (B) shale/mudstone (blue). Bar plots show the proportion of formations within each time bin that contains prokaryotes only (gray), possible eukaryotes only (light orange and blue), and likely eukaryotes (dark orange and blue). The number of formations within each time bin is displayed on top of each bar.
The fraction of eukaryote-bearing formations relative to the total number of fossiliferous formations through the Proterozoic. Black lines are the observed fractions (see Fig. 9). Orange and blue regions represent the null hypothesis—95% of possible fractions calculated by random resampling, with replacement, of x number of formations (where x is the number of formations observed within each time interval) from the total number of formations, and repeating 1000 times. The fraction of eukaryote-bearing formations in (A) chert including likely and possible eukaryotes, (B) chert excluding vase-shaped microfossils (VSMs) and apatitic scale microfossils (ASMs), (C) shale including likely and possible eukaryotes, and (D) shale excluding VSMs (ASMs do not occur in shale).
The Early Eukaryote Biomarker Record and Its Limitations
Steranes, the diagenetic products of sterol lipids, are often used as a molecular fossil for early eukaryotes, and changes in their relative abundance in the rocks are expected to chart the diversification of eukaryotes through time (Brocks et al. Reference Brocks, Jarrett, Sirantoine, Hallmann, Hoshino and Liyanage2017). Until recently, a large gap existed in the biomarker record between simple steroids recovered in the ca. 1.6 Ga Barney Creek Formation and true steranes in the late Tonian (Brocks et al. Reference Brocks, Love, Summons, Knoll, Logan and Bowden2005; Brocks et al. Reference Brocks, Jarrett, Sirantoine, Hallmann, Hoshino and Liyanage2017). A number of studies have looked for, and failed to identify, steranes in Mesoproterozoic rocks (Blumenberg et al. Reference Blumenberg, Thiel, Riegel, Kah and Reitner2012; Luo et al. Reference Luo, Hallmann, Xie, Ruan and Summons2015; Suslova et al. Reference Suslova, Parfenova, Saraev and Nagovitsyn2017; Gueneli et al. Reference Gueneli, McKenna, Ohkouchi, Boreham, Beghin, Javaux and Brocks2018; Nguyen et al. Reference Nguyen, Love, Zumberge, Kelly, Owens, Rohrssen, Bates, Cai and Lyons2019; Duda et al. Reference Duda, König, Reinhardt, Shuvalova and Parkhaev2021; but see Zhang et al. Reference Zhang, Su, Ma, Wang, Wang, He, Wang and Canfield2021). Brocks et al. (Reference Brocks, Nettersheim, Adam, Schaeffer, Jarrett, Güneli, Liyanage, van Maldegem, Hallmann and Hope2023) have potentially bridged this gap with the discovery of “protosteranes,” which they interpreted as the by-products of early steps in the sterol biosynthesis pathway. One way to read the protosterane record—the one that Brocks et al. (Reference Brocks, Nettersheim, Adam, Schaeffer, Jarrett, Güneli, Liyanage, van Maldegem, Hallmann and Hope2023) advocated—is that they are biomarkers for stem eukaryotes that had yet to evolve the full biosynthesis pathway. In this framework, the progression of ca. 1.6 Ga protosteranes to ca. 1.4 Ga 24-methyl protosteranes to ca. 0.8 Ga steranes recapitulates the evolution of the sterol biosynthesis pathway, with intermediate products in the modern pathway representing end products produced by stem eukaryotes. In a strict interpretation, this hypothesis requires all eukaryote fossils before the Tonian to be stem-members, for if crown eukaryotes predate the protosterane record, then there is no reason to presume the record relates to the actual evolution of eukaryotic steranes. The alternative interpretation is that crown eukaryotes evolved before the Tonian, but were a minor part of the ecology. In this scenario the signal from pre-Tonian rocks could be coming from stem eukaryotes and/or bacteria, some of which can also generate protosterane precursors (Wei et al. Reference Wei, Yin and Welander2016; Hoshino and Gaucher Reference Hoshino and Gaucher2021; Brown et al. Reference Brown, Olagunju, Giner and Welander2023). This second interpretation is consistent with a “long fuse” hypothesis regarding geochemical biomarkers, which predicts a long gap between the time organisms first start producing a biomarker and the time it takes for the organisms to become ecologically common enough to leave a biosignature in the geologic record (Gold Reference Gold2018). Regardless of interpretation, the first appearance of steranes in not just one but several late Tonian formations has been used to support the hypothesis that eukaryotes radiated at this time.
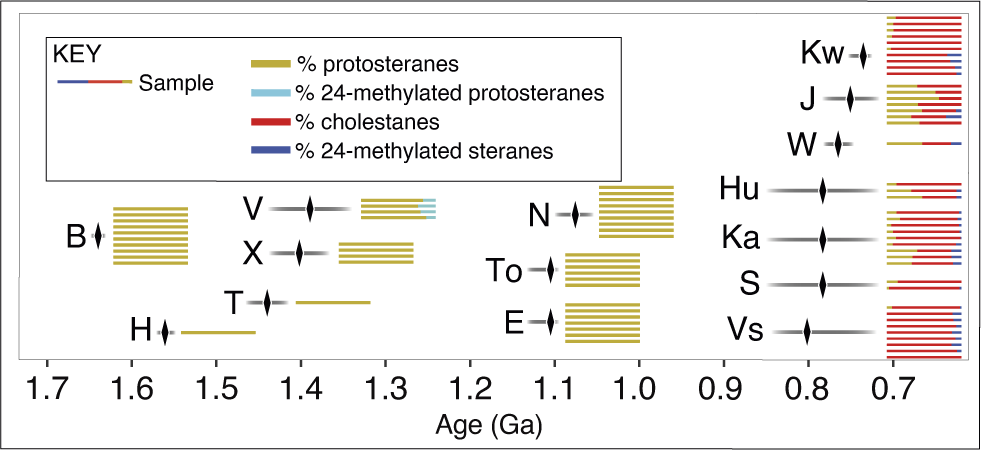
There are reasons for caution, however. The Proterozoic biomarker record is extremely spotty; it is also strongly biased in favor of offshore environments (Brocks et al. Reference Brocks, Nettersheim, Adam, Schaeffer, Jarrett, Güneli, Liyanage, van Maldegem, Hallmann and Hope2023), a depositional setting that does not tend to host eukaryotic fossils during this time (Butterfield and Chandler Reference Butterfield and Chandler1992). Figure 11 illustrates the number of formations where sterane/protosterane biomarkers have been successfully identified from Tonian or older rocks, with individual lines representing the number of samples with steranes/protosteranes in each formation, their colors indicating the relative abundance of these molecules in the samples (Supplementary File 4). This manner of visualizing the data helps reveal the limitations in the current biomarker record. Late Tonian samples come from a variety of geographic locations, including the Buldya Group in Australia, the Chuar Group in North America, and the Visingsö Group in Europe. In contrast, there are no Tonian samples older than the upper Bitter Springs Group (<850 Ma), leaving a >150 Myr gap between those and the >1 Ga Nonesuch Formation. Furthermore, the interval between the Nonesuch and Barney Creek steroids is sparsely sampled. The Calymmian (1.6–1.4 Ga), for example, is represented by two formations with one sample each, both from North China. The impact of these limited data is exemplified by 24-methylated protosteranes in the Velkerri Formation. These protosteranes, as interpreted by Brocks et al. (Reference Brocks, Nettersheim, Adam, Schaeffer, Jarrett, Güneli, Liyanage, van Maldegem, Hallmann and Hope2023), represent an evolutionary link between “stem-group” cyclosteranes and the “crown-group” steranes of the late Tonian. Yet 24-methylated cyclosteranes have not been found in the broadly contemporaneous Xiamaling Formation or in the younger En Nesoar, Touirist, or Nonesuch Formations. Without the Velkerri data, there would be no evidence of 24-methylated cyclosteranes in the biomarker record, and even with these data, there is a ca. 488 Myr gap between them and “crown-group” steranes. These results show how a single formation can dramatically impact the story of eukaryote biomarker evolution. Differences in methodology also affect the steranes recovered from rocks. For example, Kwagunt Formation samples analyzed by Brocks et al. (Reference Brocks, Nettersheim, Adam, Schaeffer, Jarrett, Güneli, Liyanage, van Maldegem, Hallmann and Hope2023) contain only protosteranes and cholestanes, while Zumberge et al. (Reference Zumberge, Rocher and Love2020), who also examined Chuar Group bitumens using hydropyrolysis, recovered more complex ergostanes as well. Ultimately, differences in technique and the paucity of samples currently analyzed leave plenty of questions about the actual pattern of early eukaryote evolution as told by biomarkers. However, if the hypothesis of Brocks et al. (Reference Brocks, Nettersheim, Adam, Schaeffer, Jarrett, Güneli, Liyanage, van Maldegem, Hallmann and Hope2023) is correct, then total-group eukaryotes were widespread throughout the Mesoproterozoic, in contradiction with the idea that eukaryotes (stem + crown) first radiated in the Tonian.
Biomarkers through the Proterozoic. Each formation is represented by a gray bar, with horizontal black line showing age constraints. Individual colored lines within each gray bar representing the number of samples with biomarkers from each formation, the colors indicating the relative abundance of different steranes/protosteranes in the sample (Supplementary File 4). Most data taken from Brocks et al. (Reference Brocks, Nettersheim, Adam, Schaeffer, Jarrett, Güneli, Liyanage, van Maldegem, Hallmann and Hope2023), with additional data from Zumberge et al. (Reference Zumberge, Rocher and Love2020). Note that Zumberge et al. (Reference Zumberge, Rocher and Love2020) were not looking for cyclosteranes in their analyses, which impacts ratios in some of the samples illustrated in the Kwagunt and Upper Visingsö formations. Formation identifiers: B, Barney Creek; T, Tieling; H, Hongshuizhuang; V, Velkerri; X, Xiamaling; E, En Nesoar; To, Touirist; N, Nonesuch; J, Johnny’s Creek; W, Wallara; S, Steptoe; Ka, Kanpa; Hu, Hussar; Kw, Kwagunt; Vs, Upper Visingsö.
Discussion
What’s Driving the Correlation between Eukaryote Diversity and the Number of Formations?
Figures 6 and 7 and Supplementary Figures S2–S5 indicate a near-perfect correlation between eukaryote diversity and the number of eukaryote-bearing formations through time. As with any correlation between x and y, there are several possible explanations: x is driving y, y is driving x, or a third variable, z (a “common cause”) is driving both x and y. We consider each of these below, arranged in order of our least favored to our most favored option.
Option 1: Eukaryote Diversity Is Driving the Number of Eukaryote-bearing Formations (y drives x)
If eukaryotes diversified in the Tonian, we might expect that they would also increase in their abundance and geographic distribution, and this would drive the number of eukaryote-bearing formations higher relative to all fossiliferous formations (cf. Slater and Bohlin Reference Slater and Bohlin2022). However, the data in Figures 9 and 10 suggest this is not the case: there is no evidence that the proportion of formations that include eukaryotes changed through time. (The exception to this—the appearance of VSMs in the late Tonian chert window—contributes very little to the correlation [Fig. 4], as evidenced by the fact that the relationship remains strong if only the shale window is analyzed [r 2 = 0.98; Supplementary Fig. S5].) Nor is there evidence that the relative proportion of diverse (vs. non-diverse) eukaryote assemblages changes through time. Different time bins have similar distributions of within-formation diversity, with low-diversity formations (one to three species) making up a large proportion (30–50%) of the formations within any bin (Fig. 4). This also undermines the explanation that intervals of high eukaryote diversity get more attention paid to them (and thus more formations studied), because paleontologists are not as motivated to report low-diversity assemblages. There are, proportionally, just as many low-diversity formations reported from the Tonian as there are from older time intervals.
Option 2: A Common Cause (z drives x and y)
A second possibility is that the correlation between global eukaryote diversity and the number of eukaryote-bearing formations reflects a “common cause”: a third, hidden variable that is controlling both the number of species and the number of formations through time. Peters (Reference Peters2005) concluded that the strong relationship between the diversity of marine animals and the amount of sedimentary rock through the Phanerozoic was largely due to changes in sea level through time: highstands generated vast epicontinental seas where sediment accumulated and marine animals diversified, while lowstands resulted in the destruction of these habitats and therefore widespread extinction (see also Hannisdal and Peters Reference Hannisdal and Peters2011). A similar “common cause” might at least in part explain the pattern for early eukaryotes: the breakup of Rodinia in the Tonian generated a high number of shallow rift basins where early eukaryotes might have flourished. This hypothesis rests on the assumption that the number of eukaryote-bearing formations in our analysis is a proxy for sedimentary rock volume (cf. Peters and Foote Reference Peters and Foote2001), a possibility that has yet to be tested. Therefore we cannot rule this out.
Option 3:The Number of Sampled Formations Is Driving the Pattern of Eukaryote Diversity (x drives y)
This explanation—that early eukaryote diversity patterns merely reflect sampling efforts—is the most straightforward explanation and the one we favor here. It is consistent with the fact that Precambrian paleontology is a young field, that the data used to generate these patterns are limited in number (181 species, 713 occurrences, and 145 formations for >1 Gyr), and that with each passing decade, diversity patterns have continued to change quite dramatically (e.g., Figs. 1, 2). In this view, the distributions of within-formation diversity for each time bin, shown in Figure 4, and the relationship between species and formations, shown in Figures 6E,F and 7C,D (and Supplementary Figs. S2–S5), are telling us about the effort it takes to find diverse assemblages in the Proterozoic. The linear regression models (Fig. 6E,F, Supplementary Figs. S2–S7) suggest that about one to two species will be discovered for every new formation studied; the distributions in Figure 4 suggest that, in fact, most of the new species will be concentrated in a just few units—Precambrian “jackpots” that we hit by virtue of luck (e.g., great preservation) and effort (e.g., in-depth study). This “jackpot” phenomenon is also apparent in the relationship between the number of formations and the maximum within-formation diversity in a time bin (Fig. 8, Supplementary Fig. S8), which suggests that the more formations we sample, the more likely we are to be rewarded with an even bigger prize.
Weak Evidence for a Tonian Radiation
Initial studies of global diversity suggested a radiation of eukaryotes in the Tonian (Vidal and Knoll Reference Vidal and Knoll1982; Schopf Reference Schopf, Schopf and Klein1992). Over the decades, additional observations seemed to bolster this hypothesis, including the timing of molecular clock estimates of divergences within crown eukaryotes; an increase in the diversity of multicellular/coenocytic forms; the first occurrence of eukaryotic steranes; and the appearance of biological innovations such as biomineralization (the ASMs) and tests (the VSMs), all ca. 800 Ma (Knoll Reference Knoll2014 and references cited therein). However, as with the pattern of global diversity, these rest on shaky grounds. First, aside from concerns about the accuracy and precision of molecular clocks, divergence times of (arbitrarily chosen) clades within crown eukaryotes are going to be affected by the combination of sampling and extinction that currently delimits the modern group, and thus may shift forward or backward in time with further extinction or sampling. Crown groups are defined by our current moment in time and their times of origin tell us nothing about actual diversification rates among primarily now-extinct species. Second, there are far too few multicellular/coenocytic forms to make any sort of statistically significant statement about their relative diversity (Bykova et al. Reference Bykova, LoDuca, Ye, Marusin, Grazhdankin and Xiao2020), and even if they were higher in number, they would be susceptible to the same sampling biases discussed here. Finally, the ASMs—the earliest example of biomineralization in eukaryotes—occur in a single unit at a single locality; they are not easy to spot in thin section or in acid maceration residues, suggesting that they could be easily missed in older rocks (Allison and Hilgert Reference Allison and Hilgert1986; Cohen et al. Reference Cohen, Schopf, Butterfield, Kudryavtsev and Macdonald2011; Cohen and Knoll Reference Cohen and Knoll2012). Thus there are effectively no good time constraints on the origin of the ASMs—or on the first appearance of that innovation, eukaryote biomineralization. (Other scale-like microfossils, as yet unnamed and of uncertain relationship to the ASMs [Riedman et al. Reference Riedman, Porter and Czaja2021], are known from more localities, but are similarly easy to overlook.) This leaves the VSMs, which are well enough represented in the fossil record that we can have some confidence that their appearance approximates their origin in time (Riedman et al. Reference Riedman, Porter and Calver2018). It is therefore probably accurate to say that these tests represent a eukaryotic innovation in the Tonian; this may be the strongest line of evidence—by itself a rather weak one—for a Tonian radiation of eukaryotes.
We want to emphasize that our analysis does not refute the hypothesis that eukaryotes diversified in the Tonian. This hypothesis is plausible, and it may be evidenced by other measures we have not addressed here, such as the relative abundance of eukaryotic versus prokaryotic fossils in Proterozoic strata. However, we suggest on the basis of global eukaryote diversity analyses, which, critically, prompted the idea in the first place (Vidal and Knoll Reference Vidal and Knoll1982; Schopf Reference Schopf, Schopf and Klein1992; Knoll Reference Knoll1994, Reference Knoll2014; Knoll et al. Reference Knoll, Javaux, Hewitt and Cohen2006), the Tonian radiation of eukaryotes might simply reflect an artifact of sampling.
On the Steep Part of the Collector’s Curve
The collector’s curve, or “species discovery curve,” is the total number of species known from a given environment plotted as a function of the total number of samples taken from that environment. Initial collections identify new species at a regular rate, and thus the curve initially approximates a straight line, but as sampling continues and new discoveries become increasingly rare, the curve asymptotes toward a value that approximates the total number of species in that environment. Though it is perhaps strange to think of a collector’s curve for a >1 Gyr interval of time, it seems an apt analogy. We are on the steep part of a Precambrian collector’s curve, where a single discovery, a single sample, or a single in-depth monographic effort can have a significant impact on our view of early eukaryote history.
Conclusions
In his 1994 paper presenting evidence for an accelerating tempo in early eukaryote evolution, Knoll cautioned that “we still glimpse early biological history through a glass darkly” but suggested that “broad patterns are beginning to come into focus” (Knoll Reference Knoll1994: p. 6749). Thirty years later, we are still peering through a glass darkly, and it is not clear whether we do know the broad patterns of early eukaryote evolution. This is not because preservation is poor—there are exceptional assemblages from throughout the billion year interval preceding the Cryogenian—but because the record is as yet not adequately explored. Our analysis points to several strategies that might be employed to improve the efficiency of this exploration:
-
• Revisit low-diversity formations. Although some of these may be truly low in diversity (e.g., those in offshore settings; Butterfield and Chandler Reference Butterfield and Chandler1992), many may simply be understudied. Those in particular that show excellent preservation are low-hanging fruit for future taxonomic work, especially SEM studies that might reveal species overlooked under light microscopy (e.g., Loron et al. Reference Loron, Halverson, Rainbird, Skulski, Turner and Javaux2021).
-
• Target shales, particularly from poorly sampled time intervals. This is the predominant facies in which eukaryote fossils are found, and the last 10 years have shown how much such efforts can change the picture of early eukaryote diversity (e.g., Adam et al. Reference Adam, Skidmore, Mogk and Butterfield2017; Miao et al. Reference Miao, Moczydłowska, Zhi and Zhu2019; Loron et al. Reference Loron, Halverson, Rainbird, Skulski, Turner and Javaux2021; Riedman et al. Reference Riedman, Porter, Lechte, Santos and Halverson2023).
-
• Identify the conditions that favor the preservation of organic-walled microfossils in shales. Searching for fossils of early eukaryotes can seem like looking for a needle in a haystack. We need proxies that we can use to target rocks most likely to yield fossils (Butterfield Reference Butterfield1990; Anderson et al. Reference Anderson, Tosca, Cinque, Frogley, Lekkas, Akey, Hughes, Bergmann, Knoll and Briggs2020, Reference Anderson, Woltz, Tosca, Porter and Briggs2023; Woltz et al. Reference Woltz, Porter, Agić, Dehler, Junium, Riedman, Hodgskiss, Wörndle and Halverson2021, Reference Woltz, Anderson, Tosca and Porter2023).
-
• Identify other rock types and preservational modes that might yield other fossil types. Macerations of carbonate rocks, for example, have yielded not only ASMs (Cohen and Knoll Reference Cohen and Knoll2012) but other organic remains (from Cryogenian rocks; Cohen et al. Reference Cohen, Macdonald, Pruss, Matys and Bosak2015). Maceration of shales have also yielded three-dimensionally preserved organic microfossils (Bloeser Reference Bloeser1985) that might be missed if search images are focused on conventional flattened organic-walled microfossils.
Sepkoski (Reference Sepkoski, Schopf and Klein1992) noted that a primary benefit of diversity compilations is that they provide an agenda for future research by pointing out the gaps in our knowledge. The primary agenda suggested by our work is simple: more paleontological exploration of Proterozoic rocks.
Acknowledgments
We are grateful to N. Butterfield, M. Henderson, and Q. Tang for supplying images for Figure 3. S. Xiao and N. Butterfield provided constructive and thorough reviews that greatly improved the article. This work was supported by the Moore–Simons Project on the Origin of the Eukaryotic Cell, Simons Foundation 735933LPI (https://doi.org/10.46714/735933LPI) to S.M.P., and by the National Science Foundation (EAR-1855092 to S.M.P., EAR-PF 2204590 to C.R.W., and EAR-2044871 to D.A.G.).
Data Availability Statement
The Supplementary Material include the three datasets referred to in the article. Supplemental File 1: the listing of likely and possible eukaryotic species for each formation, age ranges and lithofacies for each formation, descriptions of taxa and basis for determining whether a species is considered a “likely eukaryote” or “possible eukaryote,” and references cited within all supplemental files. Supplemental File 2: data used in developing Figures 2D, 3C, 4–8 and Supplementary Figures S1–S9. Supplemental File 3: a listing of Archean–Tonian fossiliferous units including those with only prokaryotes. Supplemental File 4: biomarker data. Supplemental File 5: Supplementary Figures S1–S9, mentioned in the text. Supplementary Material is available from Zenodo at https://doi.org/10.5281/zenodo.12788825.
Competing Interests
The authors declare no conflicts of interest.


 Open access