


The metabolic syndrome is a cluster of metabolic disorders of which obesity and insulin resistance are considered the major underlying risk factors. Because of the increasing incidence of the metabolic syndrome worldwide, there is increased interest in the potential protective role of dietary Ca in the development of these metabolic disorders(Reference van Meijl, Vrolix and Mensink1, Reference Major, Chaput and Ledoux2). Human as well as rodent studies have previously shown that dietary Ca increases faecal fat excretion by the formation of insoluble Ca-fatty acid soaps in the intestinal lumen(Reference Govers, Termont and Van der Meer3–Reference Papakonstantinou, Flatt and Huth6). This Ca-driven lowering of fat absorption is suggested to be a potential dietary intervention to prevent or at least reduce weight gain and adiposity in the current society. However, studies conducted so far do not provide a conclusive answer regarding the effect of Ca supplementation, independent of other changes in the diet (e.g. dairy intake), on faecal fat excretion and its association with a reduction in weight gain or adiposity(Reference Bendsen, Hother and Jensen4, Reference Boon, Hul and Stegen7, Reference Christensen, Lorenzen and Svith8).
Next to precipitation of fatty acids, dietary Ca is also able to bind bile acids in the intestinal lumen, thereby increasing faecal bile acid excretion(Reference Govers, Termont and Van der Meer3, Reference Bendsen, Hother and Jensen4, Reference Van der Meer, Welberg and Kuipers9). Interestingly, Kobayashi et al. (Reference Kobayashi, Ikegami and Fujisawa10) previously reported that bile acid-binding resins ameliorated diet-induced obesity and insulin resistance, presumably by reducing fat accumulation in the liver and subcutaneous fat. Studies with diabetic patients have also showed that a reduced hepatic lipid accumulation was associated with improved insulin sensitivity and normalised gluconeogenesis(Reference Petersen, Dufour and Befroy11, Reference Tiikkainen, Bergholm and Vehkavaara12). On the contrary, an increased faecal bile acid excretion may also imply a reduced enterohepatic circulation of bile acids, which might consequently diminish energy expenditure according to Watanabe et al. (Reference Watanabe, Houten and Mataki13). This might then induce an adverse effect of bile acids on body-weight gain.
A more systemic effect of Ca on adiposity is suggested by Zemel(Reference Zemel14). According to their hypothesis, high dietary Ca intake is associated with reduced plasma 1,25-vitamin D and parathyroid hormone (PTH) levels. This would then lead to a decreased Ca ion influx into adipocytes, eventually resulting in the stimulation of lipolysis and the inhibition of lipogenesis. Ca supplementation trials in human subjects and aP2-agouti transgenic mice conducted by Zemel(Reference Zemel14) confirmed an inverse association between Ca and adiposity. This protective effect of Ca was, however, not found in many other intervention trials(Reference Boon, Hul and Viguerie15–Reference Schrager18). Thus, conclusive evidence for a systemic effect of dietary Ca is again lacking.
In the present study, we investigated the effect of Ca supplementation on precipitation of fatty acids and bile acids in the intestinal lumen, as well as the systemic effects of dietary Ca in relation to the development of the metabolic syndrome. Therefore, we fed C57BL/6J mice a high-fat diet with a low Ca concentration that mimics a habitual Western-type human diet, with a Ca intake of about 1000 mg/d(Reference Newmark19), or a high-fat diet with a three times higher Ca concentration. In contrast to several related diet intervention studies that have suggested a protective effect of Ca on obesity and insulin resistance, in the present study, Ca is the only nutritional compound that differs in concentration between the high-fat diets. Our effects are therefore due solely to dietary Ca. Moreover, the chosen dietary Ca concentrations in the high-fat diets support extrapolation to the human situation.
Methods
Animals and diets
Male C57BL/6J mice were purchased from Harlan (Horst, The Netherlands) and were housed two per cage in the light- and temperature-controlled animal facility of Wageningen University. They had free access to water, and before the diet intervention, they received standard laboratory chow (RMH-B; Arie Blok BV, Woerden, The Netherlands). For all experiments, the institutional and national guidelines for the care and use of animals were followed, and all experiments were approved by the Local Committee for Care and Use of Laboratory Animals at Wageningen University.
After a run-in period of 3 weeks on a low-fat diet, 9- to 12-week-old mice were fed a palm oil-rich, high-fat purified diet with either a low (LCa diet, 50 mmol/kg) or high concentration of Ca (HCa diet, 150 mmol/kg) for 8 weeks. Dicalcium phosphate and calcium carbonate were the sources of dietary Ca. The diets were composed by Research Diet Services (Wijk bij Duurstede, The Netherlands), and their complete composition is given in the supplementary material (Additional file 1, available online at http://www.journals.cambridge.org/bjn). Note that a low-fat-diet group was also included in this diet intervention study to ensure high-fat diet-induced development of obesity and insulin resistance (data previously published(Reference de Wit, Bosch-Vermeulen and de Groot20)). During the diet intervention, body weight was recorded weekly. After 2 weeks of intervention, six mice per diet group were killed in the fed state. The small intestines were excised, and the adhering fat and pancreatic tissue were carefully removed. The small intestines were divided into three equal parts along the proximal-to-distal axis (proximal, middle and distal part of the small intestine). Small-intestinal mucosal cells were scraped, snap-frozen in liquid N2 and stored at − 80°C until RNA isolation. At week 7, an oral glucose tolerance test was performed; after a 6 h fast, six mice per diet group received 0·5 ml of a 20 % glucose solution via oral administration, and blood glucose was measured after 15, 30, 45, 60, 90 and 150 min using Accu-Chek blood glucose meters (Roche Diagnostics, Almere, The Netherlands). At week 8, twelve mice per diet group were killed after a 6 h fast to determine parameters of (hyper)glycaemia in blood and to perform lipid metabolism-related measurements in epididymal white adipose tissue. White adipose tissue was weighed, snap-frozen in liquid N2 and stored at − 80°C until RNA isolation. Approximately 1 ml blood was collected in microtubes containing 1·6 mg EDTA (Sarstedt AG & Co, Nümbrecht, Germany). Plasma was obtained after centrifugation at 11 000 g for 10 min and frozen at − 80°C. Before the killing at weeks 2 and 8, mice were anaesthetised with isoflurane (1·5 % in 70 % nitrous oxide/30 % oxygen).
Faecal and plasma analyses
After 5 weeks of diet intervention, faeces were collected for 48 h. Faeces were lyophilised, weighed and homogenised. Total NEFA and total bile acids in faeces were determined as described previously(Reference Govers, Termont and Van der Meer3). Appropriate standards and reference samples were assayed simultaneously. The recovery of added standards always exceeded 95 %. The absorption efficiency of dietary fat was calculated by subtracting the faecal amounts of fat excreted per d from the daily fat intake.
Plasma NEFA were assayed enzymatically (NEFA-C kit; Wako Chemicals, Neuss, Germany), and plasma PTH was measured using the Mouse Intact PTH ELISA kit (Immunotopics, Inc., San Clemente, CA, USA). Plasma insulin levels were detected by the Insulin (Mouse) Ultrasensitive EIA (Alpco Diagnostics, Salem, NH, USA) and glycated Hb (HbA1C) using the A1cNow+ test (Metrika BV, Sunnyvale, CA, USA).
RNA isolation
Total RNA was isolated using TRIzol reagent (Invitrogen, Breda, The Netherlands) according to the manufacturer's instructions. The isolated RNA was further column-purified using the SV total RNA isolation system (Promega, Leiden, The Netherlands). RNA concentration was measured on a NanoDrop ND-1000 UV–Vis spectrophotometer (Isogen, Maarssen, The Netherlands) and analysed on a bioanalyser (Agilent Technologies, Amsterdam, The Netherlands) with 6000 Nano Chips (Agilent Technologies) according to the manufacturer's instructions.
Complementary DNA synthesis and real-time quantitative PCR
Single-stranded complementary DNA was synthesised from 1 μg of total RNA using the Reverse Transcription System (Promega) following the supplier's protocol. Complementary DNA was PCR amplified with Platinum Taq DNA polymerase (all reagents were from Invitrogen). Primer sequences used for real-time quantitative PCR were chosen based on the sequences available in the GenBank database (www.ncbi.nlm.nih.gov), and these are listed in the supplementary material (Additional file 2, available online at http://www.journals.cambridge.org/bjn). Quantitative PCR were performed using SYBR green (Invitrogen Molecular Probes) and a MyIQ thermal cycler (Bio-Rad Laboratories BV, Veenendaal, The Netherlands). The following thermal cycling conditions were used: 8 min at 94°C, followed by forty-five cycles at 94°C for 15 s and 60°C for 1 min. PCR were performed in duplicate, and all samples were normalised to cyclophilin A expression.
Microarray hybridisation and analysis
For each part of the small intestine, total RNA was pooled per diet group (n 6). RNA was hybridised to Mouse Genome 430 2.0 arrays (Affymetrix, Santa Clara, CA, USA). Detailed methods for the labelling and subsequent hybridisations to the arrays are described in the eukaryotic section of the GeneChip Expression Analysis Technical Manual Rev. 3 from Affymetrix, which is available upon request. Arrays were scanned on an Affymetrix GeneChip Scanner 3000 (Affymetrix). Data analysis was performed in MAS 5.0, which is also provided by Affymetrix. To estimate the magnitude and direction of differential gene expression, MAS 5.0 software provides signal log ratios. If the signal log ratio is equal to or greater than zero, fold change is obtained with 2(signal log ratio), otherwise ( − 1) × 2− (signal log ratio). Based on perfect match and mismatch probes, MAS 5.0 software also calculates the significance of differential gene expression. Array data have been submitted to the Gene Expression Omnibus accession numbers GSE8582 and GSE18581.
Statistical analysis
Physiological data and quantitative PCR results are reported as means with their standard errors. The differences between the mean values were tested for statistical significance by the independent samples t test (PASW Statistics 17.0 software; SPSS, Inc., Chicago, IL, USA). In short, this means that based on Levene's t test for equality of variance, ‘equal variances assumed’ or ‘equal variances not assumed’ t tests were used. P values < 0·05 are considered to be statistically significant.
Results
Dietary calcium precipitates fatty acids and bile acids in the gut lumen
First, we determined the capacity of the HCa diet to precipitate dietary fat and bile acids in the small-intestinal lumen (Table 1). We found a significant increase in faecal fat and faecal bile acids on a HCa diet compared with a LCa diet. To gain more insight into the effect of dietary Ca on the absorption of fat, we used food intake measurements and faecal excretion data to estimate absolute values and percentages of absorbed dietary fat. Table 1 shows that there is a significant difference in the percentages of fatty acid absorption on a HCa and LCa diet; however, the absolute values are very close together and are not significantly different. Furthermore, the increase in faecal bile acid excretion indicates a reduced reabsorption of bile acids in the small intestine.
(Mean values with their standard errors)
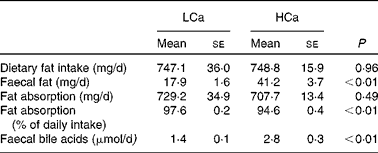
LCa, high-fat, low-Ca diet; HCa, high-fat, high-Ca diet.
The effect of dietary calcium on high-fat diet-induced obesity and adiposity
To determine the effect of dietary Ca on obesity, we measured food intake and body weight. We found that energy intake on the LCa (59·8 (se 1·7) kJ/d) diet was slightly lower, but was not significantly different from that on the HCa diet (61·9 (se 1·7) kJ/d). Fig. 1 shows that mice on the LCa and HCa diets gained equal weight during the 8 weeks of diet intervention. However, this did not exclude the possibility that the ratio between fat mass and lean mass differed between mice on the HCa and the LCa diets. To study the proposed effect of dietary Ca on adipose tissue, we first analysed epididymal fat pads for weight and determined gene expression of the lipogenesis marker fatty acid synthase and the lipolysis marker hormone-sensitive lipase. The weights of epididymal fat pads were not significantly different between the LCa and HCa diets (2·4 (se 0·1) and 2·5 (se 0·1) g, respectively). Also, fatty acid synthase and hormone-sensitive lipase showed no differential gene expression (Fig. 2). Additionally, we measured plasma NEFA and plasma PTH levels to determine Ca-induced changes in the rate of lipolysis. We found no significant differences in plasma NEFA and PTH after 8 weeks of LCa and HCa diet intervention (Table 2). Together, our data indicate that dietary Ca has no effect on fat-induced obesity and adiposity.
Body-weight gain. Body weight of C57BL/6J mice was recorded weekly during a diet intervention of 8 weeks. Values are means, with standard errors represented by vertical lines. LCa, high-fat, low-Ca diet (–○–); HCa, high-fat, high-Ca diet (–●–).

Fatty acid synthase (Fasn) and hormone-sensitive lipase (Hsl) expression in epididymal white adipose tissue. Gene expression in epididymal white adipose tissue of the lipogenesis marker Fasn and lipolysis marker Hsl after 8 weeks of high-fat, low-Ca diet (LCa, □) and high-fat, high-Ca diet (HCa, ■) intervention, analysed by quantitative PCR. Values are means, with standard errors represented by vertical bars.

(Mean values with their standard errors)
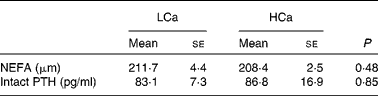
LCa, high-fat, low-Ca diet; HCa, high-fat, high-Ca diet; PTH, parathyroid hormone.
Dietary calcium-induced changes in small-intestinal gene expression
In a previous study, we found that dietary fat-induced gene expression changes in the small intestine could already be detected after 2 weeks of diet intervention(Reference de Wit, Bosch-Vermeulen and de Groot20). Therefore, we now also performed microarray analysis of mucosal scrapings after 2 weeks of LCa and HCa diet intervention to determine whether the effects of dietary Ca on precipitation, and therefore also (re)absorption of fatty acids and bile acids, modulate gene expression (Table 3). For lipid metabolism-related genes, we found hardly any changes in the proximal and middle part of the small intestine, where most of the fatty acids are usually absorbed. In the distal part of the small intestine, however, dietary Ca induced a decrease in the expression of genes, which are key regulators in the catabolism of fatty acids (Cpt1a, β-oxidation; Cyp4a10, ω-oxidation; Hmgcs2, ketogenesis). No or minimal gene expression changes could be determined in fatty acid transport and chylomicron synthesis. As expected, the most pronounced changes in gene expression related to bile acid metabolism were seen in the distal part of the small intestine, as this is where reabsorption occurs. We found a small down-regulation of Fgf15 and an up-regulation in apical (Slc10a2) and basolateral (Ostb) bile acid transporters.
Diet-induced differential gene expression in the small-intestinal mucosa

SI, small intestine; NC, no change; A, absent.
* Differential gene expression is indicated by fold changes of HCa/LCa. Positive and negative numbers indicate a significant up- and down-regulation, respectively.
According to the hypothesis of Kobayashi et al. (Reference Kobayashi, Ikegami and Fujisawa10), binding of bile acids in the intestinal lumen might prevent the development of insulin resistance. To get a first impression whether the Ca-induced precipitation of bile acids that we found in the present study could indeed prevent the development of insulin resistance, we determined gene expression of the intestinal signalling molecules Angptl4, Igfbp3, Mif and Il18. An up-regulation of Angptl4, Igfbp3 and Mif and a down-regulation of Il18 were previously found to be associated with the onset of dietary fat-induced insulin resistance(Reference de Wit, Bosch-Vermeulen and de Groot20). In this study, we found a dietary Ca-induced up-regulation of Angplt4, Mif and Il18 and no differential gene expression of Igfbp3, after 2 weeks of diet intervention.
The effect of dietary calcium on high-fat diet-induced insulin resistance
To ascertain that the early Ca-induced gene expression changes in intestinal signalling molecules precede the development of insulin resistance, we performed an oral glucose tolerance test after 7 weeks of diet intervention (Fig. 3). We found no significant difference in blood glucose clearance between the diets, although the area under the curve was slightly higher on the HCa diet (P = 0·1). Additionally, at the end of the diet intervention, we measured the percentage of glycated Hb (HbA1C) in the plasma and calculated the homeostasis model assessment for insulin resistance index from fasting glucose and fasting insulin levels (fasting glucose × fasting insulin/22·5) (Table 4). We also found no significant differences for these parameters between the LCa and HCa diets, but together with the oral glucose tolerance test data, the present results suggest a slightly compromised insulin sensitivity on the HCa diet. This is in accordance with the early gene expression changes of Angptl4 and Mif.
Oral glucose tolerance test. An oral glucose tolerance test was performed after 7 weeks of diet intervention. After oral administration of 100 mg glucose, blood glucose levels were monitored for 150 min. The changes in blood glucose levels and the area under the curve (AUC) were calculated (see inset; P = 0·1). Values are means, with standard errors represented by vertical lines. LCa, high-fat, low-Ca diet (–○–); HCa, high-fat, high-Ca diet (–●–).

Physiological parameters that are (in)directly associated with insulin sensitivity (Mean values with their standard errors)
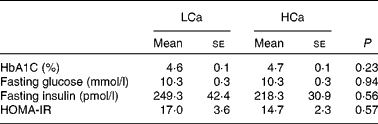
LCa, high-fat, low-Ca diet; HCa, high-fat, high-Ca diet; HbA1C, glycated Hb; HOMA-IR, homeostasis model assessment for insulin resistance.
Discussion
In the present study, we clearly showed that dietary Ca precipitates fatty acids and bile acids in the small intestinal lumen and thereby increases the faecal excretion of both components. For fatty acids, we calculated that this increase in faecal excretion on the HCa diet leads to a slight decrease in the percentage of dietary fat that is absorbed. This change in fat absorption is most pronounced in the distal part of the small intestine based on our gene expression data. Nevertheless, the absolute values of absorbed dietary fat on a HCa and LCa diet are still very similar and are not significantly changed by dietary Ca. This could explain why we do not see a lower weight gain on the HCa diet, which contrasts with the hypothesis proposed by Astrup and co-workers(Reference Bendsen, Hother and Jensen4, Reference Christensen, Lorenzen and Svith8).
The dietary Ca-induced down-regulation of Fgf15, a target gene of the nuclear bile acid receptor farnasoid X receptor(Reference Makishima, Okamoto and Repa21), suggests a decreased bile acid reabsorption on a HCa diet. The decreased expression of Fgf15 is probably a compensatory mechanism for the faecal loss of bile acids on a HCa diet, as reduced Fgf15 signalling triggers the liver to increase the bile acid synthesis(Reference Jung, Inagaki and Gerard22). This is in accordance with other studies that reported an increase in biliary bile acid secretion upon increased faecal excretion of bile acids(Reference Kobayashi, Ikegami and Fujisawa10, Reference Moutafis, Simons and Myant23). Kobayashi et al. (Reference Kobayashi, Ikegami and Fujisawa10) reported that an increase in bile acid synthesis, which is induced by bile acid-binding resin, results in changes in lipid and glucose metabolism which are related to reduced obesity and insulin resistance. However, as we found no effect of dietary Ca on fat-induced obesity and insulin resistance, we conclude that the effects of bile acid-binding resins on these metabolic disorders cannot be extrapolated to dietary Ca. The unexpected up-regulation of bile acid transporters Slc10a2 and Ostb that we found in the present study can be explained by the relative increase of hydrophilic bile acids in the intestinal lumen on the HCa diet, as Ca predominantly precipitates hydrophobic bile acids(Reference Govers, Termont and Lapre24). Asamoto et al. (Reference Asamoto, Tazuma and Ochi25) previously found that hydrophilic bile acids are associated with an induction of bile acid transporters. The up-regulation of Slc10a2 and Ostb also implies that the Ca-induced increase in faecal excretion of bile acids does not necessarily lead to a reduced enterohepatic circulation(Reference Dawson, Haywood and Craddock26) and a consequent reduction in energy expenditure(Reference Watanabe, Houten and Mataki13).
In contrast to the hypothesis of Zemel(Reference Zemel14, Reference Zemel27), the low (50 mmol/kg, 0·2 %) v. high Ca concentrations (150 mmol/kg, 0·6 %) in our high-fat diets did not induce differences in body-weight gain and adiposity after an 8-week diet intervention. A similar result for body weight was recently described by Zhang & Tordoff (Reference Zhang and Tordoff17) using dietary Ca concentrations that were highly comparable to the ones we used in the present study as well as higher Ca concentrations (1·8 %), all of which were not effective in the regulation of body weight. One might argue that the Ca concentration in the LCa diets (0·2 %) used in Zhang's and the present study was still adequate for optimal metabolic functioning and that therefore no effects on adiposity could be found. Our LCa diet mimics a human Ca intake of 1000 mg/d, assuming a daily food intake of 500 g dry weight. The results of the present study are in line with recent human studies, in which obese adults were supplemented with 1500 mg Ca/d for 3 months or 2 years, showing no effect of dietary Ca on body weight, lipid oxidation or lipolysis(Reference Sampath, Havel and King16, Reference Yanovski, Parikh and Yanoff28). Note that in these studies, subjects with a habitual Ca intake exceeding 850 mg/d or even 700 mg/d were excluded. Zemel et al., who used Ca concentrations in the diets ranging from 0·4 to 2·4 %, based their hypothesis of dietary Ca-induced inhibition of lipogenesis and stimulation of lipolysis mainly on aP2-agouti transgenic mice studies. They found a dietary Ca-induced reduction in body weight(Reference Shi, Dirienzo and Zemel29). However, this transgenic mouse model of diet-induced obesity is probably not very representative for effects in wild-type mice. Parra et al. (Reference Parra, Bruni and Palou30) did report an anti-obesity effect of dairy Ca in wild-type C57BL/6J mice. However, similar to the studies in aP2-agouti transgenic mice, the compared diets did not differ only in Ca content, but also contained variations in casein and sucrose concentrations. These additional dietary changes might very well also have an effect on the regulation of body weight(Reference Elliott, Keim and Stern31, Reference Westerterp-Plantenga, Nieuwenhuizen and Tome32). Moreover, in contrast to the present study, a substantial amount of Ca in their diets was derived from dairy products. There is growing evidence that other components in dairy products, such as medium-chain fatty acids, and dairy proteins work synergistically with Ca to alter lipid metabolism(Reference van Meijl, Vrolix and Mensink1, Reference Schrager18, Reference Shah33, Reference Pfeuffer and Schrezenmeir34).
After 2 weeks of diet intervention, the gene expression data of intestinal signalling molecules Angptl4, Igfbp3 and Mif already indicated no preventive effect of dietary Ca on the development of insulin resistance. Only the up-regulation of Il18 suggested a preventive effect of dietary Ca-induced precipitation of bile acids on the development of insulin resistance. After 7 and 8 weeks of diet intervention, we measured multiple physiological parameters that are directly or indirectly associated with insulin sensitivity. Next to an oral glucose tolerance test and HbA1C, we measured fasting glucose and fasting insulin to calculate the homeostasis model assessment for insulin resistance index. The homeostasis model assessment for insulin resistance index is a commonly used measure of insulin sensitivity in rodent studies; however, note that it should be interpreted with caution as it was never validated for animal models. Surprisingly, both gene expression data and physiological parameters suggest even a slightly worsened insulin sensitivity on the HCa diet. In accordance with the present results, Hoppe et al. (Reference Hoppe, Molgaard and Vaag35) previously reported that a short-term high milk intake leads to increased insulin resistance. A possible explanation for this impairment in insulin sensitivity on a high dietary Ca intake might be a lowered absorption of Mg due to the formation of an insoluble calcium–magnesium–phosphate complex in the intestinal lumen(Reference Brink, Beynen and Dekker36). Changes in Mg intake were previously linked to insulin resistance(Reference He, Liu and Daviglus37, Reference Barbagallo and Dominguez38). However, further research is necessary to gain more insight into this phenomenon.
In conclusion, the present study showed no protective effect of dietary Ca on the development of fat-induced obesity and/or insulin resistance, despite the significant increase in faecal excretion of fatty acids and bile acids on a HCa diet. Therefore, the present results do not support hypotheses which suggest that Ca by itself has the capacity to regulate body weight, adiposity and insulin sensitivity.
Acknowledgements
The present study was funded by the Netherlands Genomics Initiative. The authors declare that there are no conflicts of interest. N. J. W. d. W., M. M. and R. v. d. M. designed the research; N. J. W. d. W., H. B.-V. and E. O. conducted the research; N. J. W. d. W. wrote the manuscript; N. J. W. d. W. and R. v. d. M. had primary responsibility for the final content. All authors read and approved the final manuscript. N. J. W. d. W. thanks Janneke de Wilde, Bert Weijers and Rene Bakker for their excellent and stimulating technical assistance with the animal studies.



