

INTRODUCTION
Forecasting changes in freshwater flows due to adjustment of glaciers with the present and future warmer climate is one of the major challenges for modern hydrology (Jiménez Cisneros and others, Reference Jiménez Cisneros2014). More than 1 billion people worldwide live in catchments where glacier melt forms a component of the river flow and changes in glaciers can significantly impact the ecosystem service the river provides, for example: regulating flooding, hydroelectric production, drinking water supply, fishing, irrigation, groundwater recharge and biogeochemical functioning. Current understanding is that warming will lead to increased meltwater and potentially impact the seasonality of flows; thereafter, when individual glaciers reduce to a critical volume, meltwater will be reduced (Casassa and others, Reference Casassa, Lopez, Pouyaud and Escobar2009). Other sources of runoff, such as precipitation, snowmelt and groundwater flows are then likely to dominate, changing the timing and magnitude of flows within the rivers. This long term reduction in the role of glaciers as flow regulators will fundamentally change the nature of these rivers. However, the lack of understanding of the hydrological regimes of glacially fed rivers is cited as one of the main sources of uncertainty for assessing the impact of climate change on water resources (Kaser and others, Reference Kaser, Großhauser and Marzelon2010; Lutz and others, Reference Lutz, Immerzeel, Shrestha and Bierkens2014) leading to calls to increase the number of catchments studied.
Iceland is an ideal laboratory for studying glacial hydrology. Glaciers cover ~11% of the total area and store 15–20 a worth of average annual precipitation (Fenger, Reference Fenger2007). They feed the largest rivers in the country, providing an estimated third of the total runoff (Björnsson and Pálsson, Reference Björnsson and Pálsson2008). There have been a number of recent studies forecasting the impact of predicted climate change in Iceland on river runoff (Jóhannesson and others, Reference Jóhannesson2007; Einarsson and Jónsson, Reference Einarsson and Jónsson2010). The maximum relative runoff increase in the next 100 a for all glaciers and icecaps in Iceland is potentially as great as 50–100% with respect to the period 1981–2000 from the area currently covered by ice (Jóhannesson and others, Reference Jóhannesson2006). In Icelandic glaciated regions, the average annual runoff is projected to increase until 2050–2150 when the increase will reach a flat maximum before decreasing (Jóhannesson and others, Reference Jóhannesson2007; Aðalgeirsdóttir and others, Reference Aðalgeirsdóttir2011). Einarsson and Jónsson (Reference Einarsson and Jónsson2010) suggest that winter runoff is likely to increase on average due to periodic snowmelt events. The greatest spring snowmelt could occur 1 month earlier in the spring, however its overall magnitude will have decreased.
With such significant changes in runoff forecast to occur as glaciers melt, it is imperative to investigate the hydrology of these glaciated river catchments to determine how the river systems respond to current climate. For example, characterising and quantifying the component of meltwater in the river system, and the presence of other stores of water within the catchment. To gain this insight, reliable and continuous river monitoring is required covering periods of low flow as well as high flow. To help observe and distinguish different sources of water in the river, tracers must be used. Stable isotopes are good tracers of water provenance, particularly under cool climates when they are unlikely to be affected by evaporative fractionation (Kendall and McDonnell, Reference Kendall and McDonnell1998). Interpretations based on stable isotopes can be cross checked against specific electrical conductance (SEC) or specific geochemical tracers measured on the same samples.
In this study we investigate the flow and provenance of water in a well-defined meltwater channel from the outlet glacier Virkisjökull in SE Iceland. River stage and flow were measured over a 3 a period, 2011–14, and the meltwater, ice and shallow groundwater sampled for δ18O and δ2H and SEC.
SITE DESCRIPTION OF VIRKISJÖKULL
The British Geological Survey, in collaboration with the Icelandic Meteorological Office, have been working in the Virkisjökull glacier since 2009: monitoring the rapid retreat of the glacier (Bradwell and others, Reference Bradwell, Sigurdsson and Everest2013); investigating mechanisms for this rapid retreat (Phillips and others, Reference Phillips, Finlayson and Jones2013, Reference Phillips, Finlayson, Bradwell, Everest and Jones2014); and monitoring the hydrology of the glacier, meltwater river and groundwater. The glacier is drained by the river Virkisá, which has a catchment area of ~31 km2 (see Fig. 1) and extends southwestwards from the summit crater of Öræfajökull. The catchment is bounded to the west by steep cliffs above Svínafellsheiði, with a more open aspect to the east. The glacier has a significant gradient, ranging from >1800 m at the summit plateau to <100 m at the terminus and comprises the two arms of Virkisjökull and Falljökull, which separate around a nunatak before converging ~500 m up-ice of the terminus (for simplicity, the twin glaciers are generally referred to collectively as Virkisjökull throughout the rest of the paper). Average mass-balance gradients on glaciers draining the Öræfajökull caldera are the strongest in Iceland. Annual net balance (averaged from 1991 to 2006) ranges from −10 m in the terminal zone to +5 m above 1800 m elevation (Björnsson and others, Reference Björnsson, Pálsson, Guðmundsson and Haraldsson1998; Björnsson and Pálsson, Reference Björnsson and Pálsson2008). This mass-balance gradient combined with steep glacier profiles makes Virkisjökull one of the highest-mass-turnover glaciers in Europe (Dyurgerov, Reference Dyurgerov2002). Equilibrium Line Altitude (ELA) on the combined Virkisjökull glacier is ~1150 m.
The Virkisá river catchment and extent of the Virkisjökull and Falljökull glaciers, plotted on a shaded digital elevation model. The location of the automatic weather stations and river gauge at Virkisá bridge are also shown. Hillshade model generated from LiDAR DEM, © Veðurstofa Íslands, 2010.

Virkisjökull experiences a relatively mild oceanic climate with a low mean annual temperature (~5.5°C measured at the terminus from 2011 to 2015 at automated weather stations 1 (AWS1)) (BGS data:www.bgs.ac.uk/research/glaciermonitoring/home.html). Regional mean summer temperatures (1971–2000) at the nearest long-term weather station (Fagurhólsmýri ~100 m a.s.l.) are between 8 and 12°C, but daily maxima of 20°C are not uncommon in summer. Mean annual precipitation immediately south and west of Öræfajökull is ~1800 mm. By contrast, precipitation on the eastern side of the mountain averages 3000 mm a−1, and can locally exceed 7000 mm a−1 on the summit plateau (Guðmundsson, Reference Guðmundsson2000). There is estimated to be ~150 rain/snow days a−1.
Similarly to most Icelandic glaciers, Virkisjökull is undergoing a phase of retreat. The most recent maximum areal extent was reached in 1990, but since then the glacier has retreated circa 1 km, and surface lowering has been extensive, with the rate of retreat accelerating markedly from 2007 onwards (Bradwell and others, Reference Bradwell, Sigurdsson and Everest2013). Recent research has indicated that this change was caused by an alteration in the mode of glacier operation, from active retreat, punctuated by small winter re-advances, to year-round decline, stagnation and abandonment of the lower portion of the glacier (Bradwell and others, Reference Bradwell, Sigurdsson and Everest2013; Phillips and others, Reference Phillips, Finlayson and Jones2013, Reference Phillips, Finlayson, Bradwell, Everest and Jones2014).
Interpretation of photographs from the weather stations (Fig. 2) from 2011 to 2015 and multiple field campaigns have given some insight into the general hydrology of the glacier. Water flow from the glacier emerges in a defined channel at the snout of Falljökull and also within the bed of a small shallow ice cored proglacial lake system 500 m downstream (Fig. 2). The snout can be difficult to access, and for much of the year, flow at the snout is less than flow from the lake outlet. The proglacial area and lake is ice covered with ice thicknesses of tens of metres. Water flows through conduits within this area, periodically emerging at the surface before passing back into conduits again eventually discharging to the lake. Small ice marginal streams are perennially present, and supraglacial streams develop on the glacier surface before being discharged through moulins to the main conduit systems. From the lake, the flow is then channelled through an 800 m long bedrock controlled section downstream of the proglacial lake, beyond which the river enters a large sandur, which extends 1.2 km to the gauging station at a road bridge and then a further 3 km to the large Skeiðarárjökul sandur (Figs 1 and 2).
Locations for stable isotope δ18O and δ2H samples.

METHODS
Sampling of water for Stable Isotopes and SEC
Samples were taken from water sources within the catchment during three summer campaigns in September 2011, 2012 and 2013; three spring campaigns in April 2012, 2013 and May 2014; and two winter campaigns in February 2012 and January 2013. The locations of the sample points are shown in Figure 2. The main points for repeat sampling were the meltwater channel at the Virkisá Bridge, the river outlet from the proglacial lake, perennial groundwater springs in moraines to the east of the river, the glacier snout at Falljökull, and shallow groundwater from the sandur taken from dug holes and springs. Occasional samples were also taken of glacier ice, from supraglacial and ice marginal streams and from the lake.
Field measurements of SEC and temperature were made where possible on-site at the water source using a Metler Toledo SevonGo SG7 conductivity metre, calibrated daily and with a working precision of 0.5%. Samples for stable isotope analysis were collected unfiltered. Analysis was carried out by isotope ratio measurement on a VG-Micromass Optima mass spectrometer in laboratories at BGS Wallingford or Keyworth. Data are expressed in permil (‰) with respect to Vienna Standard Mean Ocean Water (VSMOW) (Craig, Reference Craig1961). Measurement precision was ±0.1‰ for δ18O and ±1.0‰ for δ2H. Existing rainfall isotope data from the International Atomic Energy Agency (IAEA) recorded at the meteorological station in Reykjavik (IAEA/WMO, 2016) were synthesised to show general variation in isotopic composition of precipitation. Where average compositions are quoted, uncertainty is given by calculating the standard deviation. A binary mixing model was used to examine the contribution of meltwater and groundwater to riverflow. The mean composition of δ2H in glacier ice (δ2HICE) and local groundwater (δ2HGW) were used as end members, and the fraction of groundwater in river (F GW) calculated using the formula F GW = (δ2HR − δ2HICE)/(δ2HGW − δ2HICE) where δ2HR is the composition in the river sample.
Measurement of river flows and climate data
River stage was measured at the Virkisá bridge from September 2011 until December 2014 using two water-level sensors (IML 0–3 m stainless steel silicon sensor, accuracy 0.1% and IML 0–10 m ceramic sensor, accuracy 0.25%), and checked with daily photographs and continuous velocity measurements from a bridge mounted radar sensor (Ott Kalesto-V, stated velocity range 0.5–4.0 ms−1 resolution 0.001 ms−1). Fifteen minute river flow data were calculated from the water-level measurements using rating curves generated from wading and bridge gauges from throughout the time period undertaken at 1 m intervals across the channel. The continuous velocity measurements and photographs were used to identify shifts in the rating curve and periods of icing in the channel.
The BGS Virkisjökull Glacier Observatory operates three AWS around the glacier (http://bgs.ac.uk/research/glacierMonitoring/GlacierClimate.html). For this analysis, data were taken from AWS1, positioned slightly above the glacier terminus at 156 m. The station is mounted on a tripod and powered by solar panels and gel cell batteries. Precipitation is measured using a tipping bucket raingauge. Temperature and solar irradiance are also recorded, as are three photographs of the glacier per day. Data are recorded hourly with a Campbell Scientific CR800 Datalogger, and transmitted daily to BGS.
RESULTS
Meltwater river flow
Daily average flow in the Virkisjökull meltwater channel from September 2011 to December 2014 is shown in Figure 3, along with weekly total precipitation and weekly mean air temperature measured in AWS 1, close to the glacier snout. Measured river flow during the months November–February can be unreliable due to ice buildup on the control structure at the gauging station, and where this has been identified, the data have been removed. Precipitation data as measured by the tipping bucket raingauge are given as weekly totals, and can include large weekly volumes due to snowmelt within the gauge.
Average daily river flow at Virkisá bridge from September 2011 to December 2014. Average weekly temperature and average weekly precipitation from AWS 1 at the glacier terminus are also shown. The arrows refer to the periods when water samples were taken.

Despite these caveats, the overall pattern of river flow is clear: highest sustained flows within the meltwater river occur during the summer melt period when weekly average temperatures recorded at the terminus are above ~7°C (Fig. 3). There is an identifiable spring melt event in each of the three study years, with baseflow increasing from 1–3 m3 s−1 to 5–10 m3 s−1 over a matter of days during May, corresponding to a sustained increase in weekly temperature above 7°C. The mean flow for the period is 4.5 m3 s−1, the Q95 (the flow exceeded for 95% of the flow record) 0.95 m3 s−1 and the Q10 (the flow exceeded for 10% of the flow record), 11.5 m3 s−1. The highest flow recorded during the 3 a was 72 m3 s−1 and corresponded to a rainfall event in October 2014, and the lowest recorded flow, 0.3 m3 s−1. Mean summer flows for the 3 a of monitoring have been in the range 5.3–7.9 m3 s−1 (Table 1). Average winter flows for the period are in the range 1.6–2.4 m3 s−1.
Mean measured summer and winter flow in Virkisá and estimated total water volume
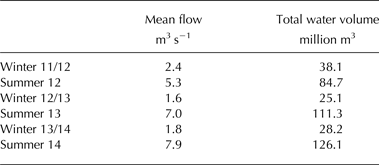
Summer is May–October and Winter November–April. Missing data during the winter are assigned a flow of 0.5 m3 s−1.
To examine in more detail the behaviour of the meltwater river throughout the year, 4 weeks were selected to represent ‘baseline’ river flow conditions in early spring (pre spring melt), late spring (after spring melt), late summer and early winter. For each chosen week there was negligible precipitation for at least the 3 previous days and the 7 d for which the data are shown. River flow during the four representative periods is shown in Figure 4. In April (pre spring melt), flows are low, ~0.8–1.9 m3 s−1, with diurnal variation <1 m3 s−1. Maximum flow usually occurs between 18:00 and 19:00 GMT and minimum flow between 09:00 and 11:00. During late spring (June), flow is in the range 3–5 m3 s−1, with a larger and more predictable diurnal variation of up to 2 m3 s−1; maximum flows at 18:00–19:00 and minimum flows between 08:00 and 09:00 GMT. In summer (August), flow is 5–15 m3 s−1 with diurnal variation generally of 5 m3 s−1, with lowest flows between 08:00 and 10:00, and highest flows between 17:00 and 19:00. River flow at the beginning of winter (late October) showed no diurnal variation and flow is between 1 and 2 m3 s−1.
Flow in the meltwater river at Virkisá bridge for four different weeks throughout the year, demonstrating the magnitude of the impact of the summer melt on river flow. During each period (and for at least 3 d prior) there was negligible precipitation.

Similarly, four recession events were identified to investigate the behaviour of the meltwater system during flood events at different times of the year (Fig. 5). Distinct events were chosen to represent late summer storms (September and early October) and winter storms. The four events had negligible precipitation during the following 5 d, which enabled the recession to be examined. For both the large storms and smaller storms, the time of year does not impact the nature of the recession for the first 2–3 d, the responses are almost identical. This suggests similar hydrological connectivity in both summer and winter. After 3 d, the responses differ, most likely due to the additional input from icemelt in the summer. The slight difference in recession gradient between the larger and small events, indicates that larger events recess slower. Photographic evidence of these floods suggests that this may be caused by the widespread flooding of the entire proglacial area, beyond the river channels adding to storage in the catchment.
Recessions after four distinct flood events in the catchment. There was negligible precipitation during each recession period.

Stable Isotopes
Rainfall
The mean monthly isotopic composition of rainfall in Reykjavík for the period 1993–2006 is shown in Figure 6. There is a systematic seasonal variation in isotopic composition, with more enriched composition in summer (April–September) precipitation. The range in composition is −65 to −45‰ for δ2H and −9 to −6‰ for δ18O (data from IAEA/WMO, 2016). The weighted mean of δ2H for south west Iceland was calculated as −58‰ by Árnason (Reference Árnason1977), who also estimated δ2H in precipitation in southeast Iceland, close to the snout of the glaciers surrounding Öræfajökull to be ~−58‰. Sveinbjörnsdóttir and others (Reference Sveinbjörnsdóttir, Johnsen and Arnórsson1995) studied the δ2H, δ18O relationships of cold groundwaters of south Iceland and defined the local meteoric line as δ2H = 6.5 δ18O − 3.5 when δ18O ≥ −10.5‰ (and δ2H ≥ −76‰). This meteoric line is consistent with the Reykjavík rainfall and has been used as a reference for the water samples from Virkisjökull.
Monthly average stable δ2H and δ18O composition of rainfall collected at the Reykjavík GNIP monitoring site from 1993 to 2006 (IAEA/WMO, 2016), 64°07′48″N021°55′48″W, altitude 14 m.

Water samples
The stable isotopic composition of the water samples is shown in online Supplementary Table S2 and plotted in Figure 7 along with the relative SEC. The samples all plot approximately on the local meteoric water line. There is a distinct difference in isotopic signature from the various water sources. The main end members are: precipitation at sea level (−65 to −45‰ δ2H and −9 to −6‰ δ18O (data from IAEA/WMO, 2016) and glacier ice (−85 to −70‰ δ2H and −12 to −10‰ δ18O). The depleted signatures of both δ2H and δ18O from the ice (mean −77.3 ± 3.7‰ δ2H, and −11 ± 0.49‰ δ18O) are consistent with snow deposition at high altitudes in the accumulation zone (Árnason, Reference Árnason1977) and the measured range can be accounted for by the altitude difference across the current accumulation zone, 1150–1800 m. Most of the other water samples lie between these two end members, ice and precipitation (Fig. 7). Moraine waters are within the range expected from precipitation indicating that they are mainly sourced from local precipitation rather than icemelt. Sandur groundwaters are more variable, and although dominated by local precipitation, show some influence of icemelt, particularly for samples in the lower sandur, downstream of the Virkisá bridge. The ice marginal streams derive primarily from icemelt. Meltwater sampled directly from the snout at Falljökull during four different sampling campaigns at different times of year are the most depleted of all the samples (see online Supplementary Table S2 and Fig. 7), at the lowest end of δ2H measured in ice, and with more depleted δ18O than measured in ice. During most sampling periods, flow directly from the snout was low (estimated at <25% of the flow in the meltwater river) and often had a much stronger diurnal signal than the meltwater channel. During the September 2011 sampling campaign, there was no observed flow from the snout at the ice terminus, and the snout sample was taken at the estimated location of a conduit emergence within the proglacial lake. The reasons for the consistently more depleted signal of both δ2H and δ18O are difficult to explain, but may relate to the particular body of ice that the snout drained during the sampled years.
Stable isotopes δ2H and δ18O and SEC plotted for each of the main water sources sampled in the Virkisá catchment between September 2011 and May 2014. The local meteoric water line (LMWL) is taken from Sveinbjörnsdóttir and others (Reference Sveinbjörnsdóttir, Johnsen and Arnórsson1995).

River samples
Samples of river water were repeatedly collected from two locations: the outlet from the proglacial area and the Virkisá bridge, 2 km downstream in the middle of the extensive sandur (Figs 1 and 2). As the meltwater river leaves the proglacial area it captures much of the visible outflow from the catchment, and no major tributaries enter the river between the proglacial area and the Virkisá Bridge. At least one small ephemeral spring contributes minor flow to the river after rain or snowmelt events; and several other moraine springs feed a number of small ephemeral and one small perennial stream that flow onto, and infiltrate into, the permeable sandur.
Figure 8 shows the stable isotopic composition and relative SEC of river water samples taken at the Virkisá bridge and proglacial outlet in winter, spring and summer. All samples were taken at moderately low flow (<4 m3 s−1 as measured at the Virkisá bridge gauging station) and none relate to major storms in the catchment. The data indicate a significant change in stable isotope composition within the river between summer (δ18O = −11.2 ± 0.17‰, δ2H = −78 ± 1.1‰, n = 14) and winter/spring (δ18O = −10.7 ± 0.3‰, δ2H = −74.9 ± 2.1‰, n = 17) (two-sample t-test, p < 0.001). This pattern is also observed individually for both monitoring sites in the river, and indicates that winter flow is sustained in part by local groundwater stored in moraines upcatchment from the proglacial area lake as well as from the sandur. Using a binary mixing model for δ2H with ice (−77.7 ± 3.6‰, n = 21) and local groundwater in moraines and upper sandur (−58.5 ± 6‰, n = 16) as endpoints, the contribution from local groundwater to winter flows is 15–20%, and in the summer is negligible. This proportion should be considered as a minimum, however since the stable isotopes cannot distinguish icemelt that then recharges the groundwater system to mix with local groundwater. The stable isotope interpretation is supported by the measurements of SEC, which show a significant change between summer (31 ± 6 µScm−1 @25°C) and winter 52 ± 9 µScm−1 @25°C). Although local groundwater contributes to river flow in winter, the stable isotopes strongly suggest that the winter flow is still dominated by glacial melt, reflecting the long periods when temperatures at the glacier terminus are above freezing (Fig. 3).
Stable isotopes δ2H and δ18O, and relative SEC in river samples collected at (a) the proglacial outlet and (b) the gauging station at Virkisá bridge (see Figs 1 and 2 for locations). Repeat wade gauging of flow at these two locations indicated flow to be similar to within 10%.

There is also an observable change in the isotopic composition of the river water between the proglacial outlet and the Virkisá bridge (Fig. 8 and online Supplementary Table S2). Samples taken from the bridge, in the same field campaign at similar river flows, are consistently less depleted (by −1.3 ± 1.2‰ δ2H, n = 9) than at the proglacial outlet. The binary mixing model suggests there is an additional contribution of 5% of flow to the river from groundwater in this upper part of the sandur in winter and spring.
DISCUSSION
Regular monitoring of the stable isotopes and continuous monitoring of river flow have proved useful tools for investigating the hydrology of this meltwater dominated catchment. There are considerable difficulties in capturing reliable data throughout the year, such as monitoring meltwater for both high and low flows, and accessing and sampling the different water sources across the catchment in summer and winter conditions. However, the investment in the Virkisá catchment has enabled a more complete understanding of catchment hydrology and storage and flow throughout the year. The large altitude difference between the accumulation zone and terminus has meant that the isotopic end members in the system are distinct and can be parameterised. Glacier ice exhibits a range of values for stable isotopes −85 to −70‰ δ2H and −12 to −10‰ δ18O (mean δ2H −77.3 ± 3.7‰, and δ18O −11 ± 0.49‰, n = 21), which reflects both the variation in the isotopic composition of precipitation and also the large elevation range of the accumulation zone. Local precipitation close to the terminus as measured in shallow groundwater away from the meltwater has distinct isotopic signature, similar to that interpolated by Árnason (Reference Árnason1977) (δ2H 58.5‰ ± 6‰, and δ18O −8.13‰ ± 0.8‰, n = 16). SEC also proved a useful indicator of provenance with higher SEC reflecting inputs from groundwater in the moraine and sandur and also turbid water, such as samples from ice marginal streams.
Average summer river flows in the 3 a period of 5.3–7.9 m3 s−1 and winter flows of 1.6–2.4 m3 s−1 show that there are appreciable flows in the river throughout the year. Summer flows are dominated by glacier melt, but summer storms and snowmelt also impact the flow. Winter flow is more complex, but the generally depleted stable isotopes (δ2H and δ18O) in winter indicate that glacier melt is still the dominant water source in winter time, accounting for up to 80% of flow (estimated from the binary mixing model). Winter temperatures are rarely below zero for a sustained period of time at the terminus (see Fig. 3) and melting is continuing throughout the year. This observation is critical in understanding the hydrology of the catchment as the glacier responds to rising temperatures, demonstrating that increased winter flows result from significant winter glacial melting in addition to the increased snowmelt forecast by others (Einarsson and Jónsson, Reference Einarsson and Jónsson2010).
The similarity in hydrological response to precipitation during summer and winter is also of interest. This indicates that the main englacial channel system in the lower part of the glacier is still broadly functioning through winter and summer allowing water to rapidly move through the catchment throughout the year. Significant volumes of water are therefore, unlikely to be preferentially stored within the conduit system during the winter. The stagnation of the lower part of the Virkisjökull glacier (Bradwell and others, Reference Bradwell, Sigurdsson and Everest2013) may be linked to this highly developed englacial system. The high efficiency of the drainage system has the effect of reducing water pressure within the ice and therefore forward motion (Anderson and others, Reference Anderson2004; Bartholomaus and others, Reference Bartholomaus, Anderson and Anderson2008). The large network of englacial meltwater channels could also lead to weakening of the ice by thermal erosion and accelerate the collapse of the glacier margin (Gully and Benn, Reference Gully and Benn2007; Phillips and others, Reference Phillips, Finlayson, Bradwell, Everest and Jones2014).
The study has also demonstrated that groundwater moderates low flows. In winter, 15–20% of river water originates from groundwater, discharging from the moraines and sandur. This additional water helps to sustain low flows. As the glacier recedes and more permeable moraine is exposed, this contribution from the moraines is likely to increase, at some point becoming the dominant mechanism for sustaining winter flow. The sandur has a complex relationship with the river. The range in measured stable isotopic compositions in sandur groundwater provides evidence that the sandur receives recharge both from local precipitation and directly from the meltwater river. This has implications for water storage within the catchment and both the moraines and sandur aquifer will play an increasingly important role in moderating flows as the glacier retreats.
In conclusion, the detailed monitoring of stream flows in the river Virkisá and regular monitoring of catchment water sources for stable isotopes and geochemistry has helped uncover some of the processes governing river flow in a catchment with a rapidly retreating glacier. Year round glacier icemelt, the presence of permanent englacial drainage, the contribution of groundwater storage from moraines and the complex interaction of the river with groundwater in the sandur are all important processes that together determine how this, and other similar rivers will respond to current and future climate variability.
SUPPLEMENTARY MATERIAL
The supplementary material for this article can be found at http://dx.doi.org/10.1017/aog.2016.22.
ACKNOWLEDGEMENTS
This research was funded by the BGS-NERC Earth Hazards and Systems Directorate. We thank Vegagerðin, the Icelandic Road and Coastal Administration, and Vatnajökulsþjóðgarður, the Vatnajökull National Park Authority, for permission to site monitoring equipment on the Virkisá River, and Veðurstofa Íslands, the Icelandic Meteorological Office, for their support for our research. The authors would also like to thank Icelandair for assistance with transportation of equipment, and the people of Svínafell for their support, interest and kindness throughout our research. Helen Bonsor, Paul Wilson, Hugh Barron and Heiko Buxel helped with field water sampling and Tim Heaton in the BGS laboratories helped undertake some of the stable isotope analysis. The paper is published with the permission of the Executive Director of the British Geological Survey (NERC).


 Open access