

1. Introduction
Due to the large population of Southeast Asia and its vulnerability to droughts and floods, a better understanding of the variability associated with the southwest monsoon would be immensely beneficial. However, relatively little is known about climatic changes in the region over time- scales ranging from centuries to thousands of years. the Himalayan region contains many subtropical high-elevation glaciers where ice-core records with high resolution can be collected (Reference Mayewski, Lyons, Ahmad, Smith and PourchetMayewski and others, 1984; Hou and others, 1999; Qin and others, 2000; Reference Thompson, Yao and Mosley-ThompsonThompson and others, 2000). Moreover, the Himalayan range acts as a boundary due to its high elevation, limiting the northern extent of the Indian summer monsoon. Ice-core records from such sites could therefore provide insight into variations of the monsoon in the past, as well as the background knowledge necessary to identify temporal and spatial variations in the linkages between various climate systems in Asia helpful in determining controls on climate change in this region.
In August 1998, an 80.4m ice core was recovered from a site at 6500ma.s.l. on East Rongbuk (ER) Glacier, <5km northeast of the peak of Qomolangma (Mount Everest) (Fig. 1). Here we present a discussion of the climatological and environmental significance of the chemical records of the ER core.
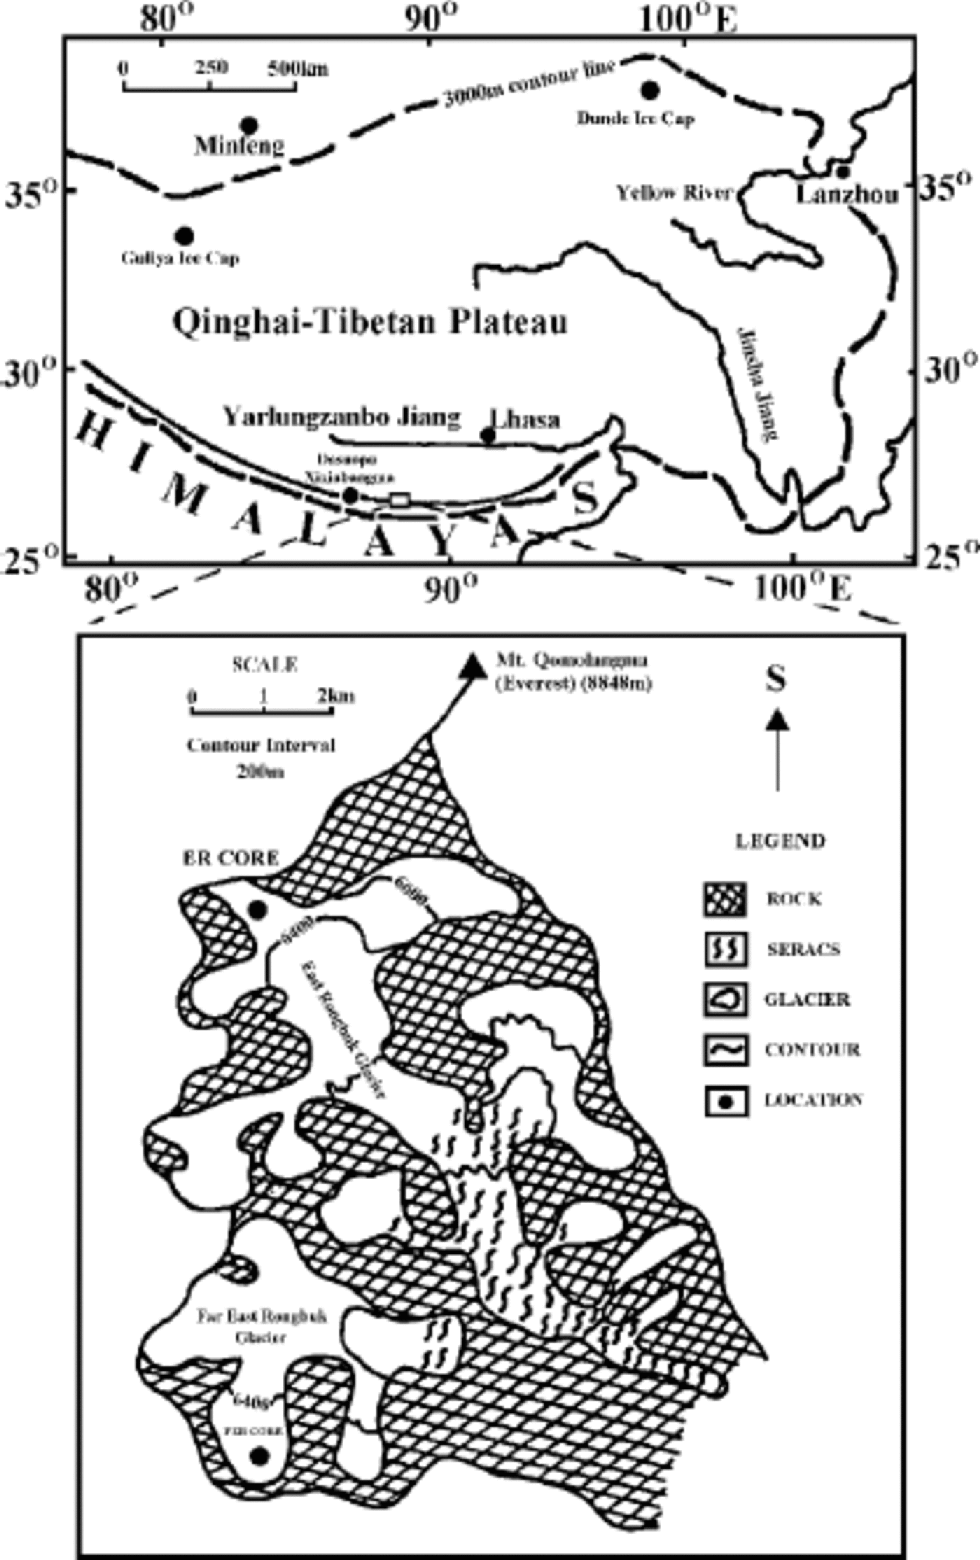
Fig. 1 Location map of ice-core drilling sites in the central Himalaya.
2. Methodology
Standard methods were used for ice-core sampling (Reference Buck, Mayewski, Spencer, Whitlow, Twickler and BarrettBuck and others, 1992; Reference Whitlow, Mayewski and Dibb.Whitlow and others, 1992). to avoid possible contamination, strict protocol was followed during processing. All sampling tools and sample containers were pre-cleaned using ultrapure water. During sampling, personnel involved wore polyethylene gloves, non-particulating clean suits and masks. Samples were kept frozen (in the field and during transportation) until analysis. In addition, blanks were analyzed at the beginning, middle and end of each processing day.
The ice core was cut at intervals of 3.5–5 cm for a total of 1816 samples. for each of the samples, an outer 2 cm annulus was removed and the inner sections were immediately put into pre-cleaned plastic sample containers for further chemical analysis. At the same time, the scraped ice material was collected for β -activity measurement. Each of the β -activity samples weighed about 1kg, corresponding to a length of 110 cm ice core.
Analyses of oxygen isotope ratios (δ18O) were performed in the Laboratory of Ice Core and Cold Regions Environment, Chinese Academy of Sciences, using a Finnigan delta-plus mass spectrometer (accuracy 0.05%), and results are expressed as the relative deviation of heavy-isotope content of Standard Mean Ocean Water. Measurements of the major chemical species were performed using a Dionex model 4000 ion chromatography system, and the β -activity samples were filtered twice through cation exchange filters and analyzed with a gas-flow proportional counter at the Climate Change Research Center, University of New Hampshire.
Snow and ice chemistry in the Himalaya shows a clear seasonal variation that can be used for ice-core dating. Based on the deuterium content of precipitation samples collected at Lhajung (4420m), Nepal Himalaya, from April 1974 to March 1975, Reference WushikiWushiki (1977) found high δD values in the pre-monsoon precipitation, and lowest values in the middle of the monsoon season, which are believed to be due to a ``precipitation-amount effect’’. This style of seasonal variation of stable-isotopic content in precipitation is also apparent on the north slope of the Himalaya (Reference Wake and StiévenardWake and Stiévenard,1995; Kang and others, 2000). High concentrations of Ca2+, Mg2+ and SO4 2– in the spring/summer season suggest that dust raised during the spring dust-storm period is transported southward from the Taklimakan desert and the Qaidam basin, China, by persistent northwesterly surface winds (Reference Wake, Mayewski, Zichu, Ping and ZhongqinWake and others, 1993; Kang and others, 2000). the summertime peaks of Na+ and Cl– ions reflect the influx of marine air masses associated with northerly-flowing monsoon circulation (Reference Wake, Mayewski, Zichu, Ping and ZhongqinWake and others,1993; Kang and others, 2000). Therefore, internal consistency exists between the seasonal variations of stable-isotopic ratios and major-ion concentrations for our ice-core chemical records, i.e. high δ18O values roughly correspond to the major-ionpeaks.
We first use the annual signal in the δ18O series to date the ice core. When the δ18O data do not provide a clear seasonal cycle, seasonal variations in major-ion (Ca2+, Na+ and NH4 +) profiles are utilized. the dating is further verified by β -activity peaks corresponding to the annual layers 1963 and 1954 (Hou and others, 2002, fig. 2) and the sulphate volcanic events of 1877 (Suwanose-jima, Japan; 29.5˚N, 129.7˚ E), 1883 (Krakatau, Indonesia; 6.1˚ S, 105.4˚ E), 1888 (Bandai, Japan; 37.6˚N, 140.1˚ E), 1889 (Suwanose-jima, Japan; 29.5˚N, 129.7˚ E), 1902 (three eruptions at 13–15˚ N), 1929 (Komaga-take, Japan; 42.1˚N, 140.7˚ E), 1951 (two eruptions at 8.9–16.3˚ S) and 1963 (Agung, Indonesia; 8.3˚ S, 115.5˚E). However, it should be noted that some sulphate peaks in our core can be formed by spring/summer dust storms. It is also suggested that a major monsoon failure, the cause of a devastating Indian drought, occurred in 1876–77 (Reference Thompson, Yao and Mosley-ThompsonThompson and others, 2000), which corresponds to the peak concentrations of marine ions, so we set the highest Na+ concentration at 63.5 m as a reference of 1876.
3. Results and Discussion
3.1. Decline in recent net accumulation
We calculate the chronological series of the annual net accumulation since 1954 (Fig. 2) based on the dating and the density–depth profile (we measured the density of each ice-core drilling interval, and a total of 190 measurements were obtained). the results of another core recovered from a site at 6500ma.s.l. on Far East Rongbuk (FER) Glacier in 1997 (Hou and others, 1999) are compared here. Four-point smoothing is adopted to eliminate the stochastic effect of dating. the net accumulation records of the ER core (Fig. 2a) and the FER core (Fig. 2b) clearly show a sharp decline from the mid-1950s to the late 1960s, and fairly steady values since then. the average annual net accumulation values for the two periods 1954–63 and either 1964–96 (FER) or 1964– 97 (ER) as identified by the double β -activity peaks, are 581.7 mm and 321.2 mm w.e. for the ER core, and 267.5 mm and 150.3 mm w.e. for the FER core, respectively. the net accumulation ratios between the above periods are also very similar for the ER core (1.81) and the FER core (1.78). the thickness and strain rate are not yet available, so the thinning effect cannot be adjusted. Since more thinning is expected in deeper annual layers, the real decrease in amplitude from the mid-1950s to the late 1960s would be more prominent after a thinning adjustment.
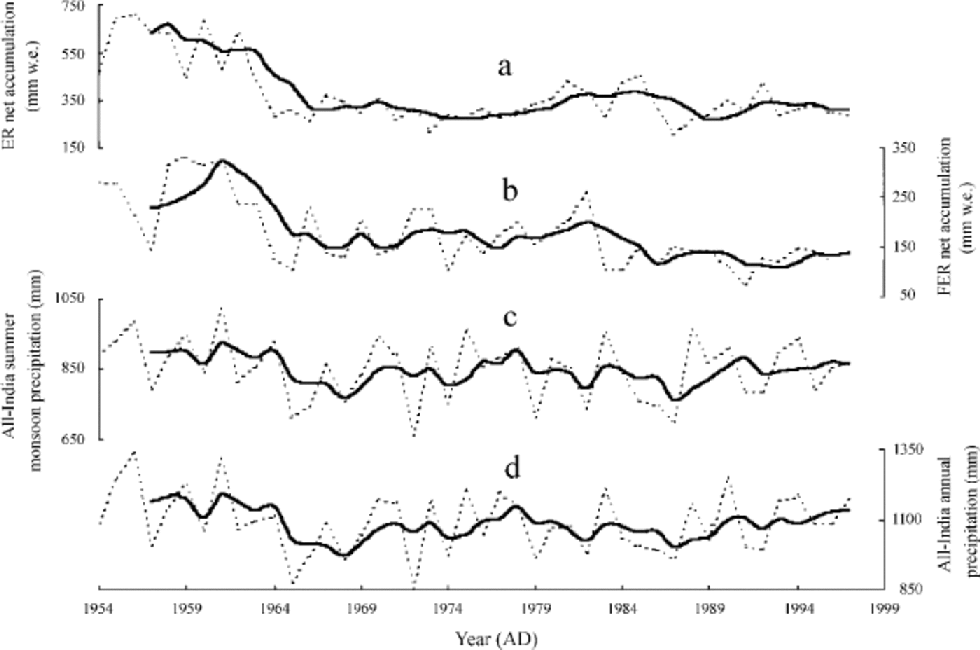
Fig. 2 The net accumulation profiles of the ice cores collected at ER Glacier (a) and FER Glacier (b), together with the all-India summer monsoonal precipitation record (c) and the all-India annual precipitation record (d). the coarse lines show the four-point smoothing results.
The average net accumulation rate at the FER core site is less than half of the corresponding value at the ER core site, though these two sites are only a few kilometers apart. the effect of orography is believed to account for the low accumulation rates at the FER site, since an east–west ridge over 7000ma.s.l. separates FER and ER Glaciers. Most of the annual precipitation received in the Himalaya originates from the Bay of Bengal and the Arabian Sea during the summer monsoon season. It penetrates through a relatively low col and deposits at the ER core site, resulting in relatively high accumulation rates there. Moreover, FER Glacier is located on the south slope, while ER Glacier is on the northern slope. Therefore, heavy snowmelting takes place on the surface of the FER Glacier, as observed in the field, but little if any melting occurs at the ER core site during the ablation season, which enhances the difference between the net accumulation rates at the two drilling sites.
We previously speculated that the decreased net accumulation at the FER site is associated with a recent temperature increase in the region that intensified the ablation (Hou and others, 1999). Qin and others (2000) also suggested a decrease in moisture flux associated with a change in atmospheric circulation. Here we compare the net accumulations with the all-India summer monsoonal and annual precipitation records (Fig. 2c and d, respectively; data are available from Indian Institute for Tropical Meteorology at http://www.tropmet.ernet.in). the substantially decreased rainfall amounts from the mid-1950s to the late 1960s are consistent with our ice-core records. Reference Subbaramayya and NaiduSubbaramayya and Naidu (1992) also suggested a sudden decrease in the all-India monsoon rainfall during 1958–69 from the 11 year moving averages of the area-weighted average monsoon rainfall in all the subdivisions of India. Thus it appears that a sudden climate change in the Asian monsoon region with respect to the total monsoon rainfall occurred from the late 1950s to the late 1960s, leading to general drought conditions through the complex interactions among monsoon rainfall, Himalayan and Eurasian snow cover, sea-surface temperature and wind field. While the decreasing rainfall trend was reversed in the early 1970s (Fig. 2c and d), it has continued in parts of central north India that are adjacent to our drilling sites (Reference Subbaramayya and NaiduSubbaramayya and Naidu, 1992). This is also true of the high Himalaya, as indicated by the continuing low net accumulation rates from the 1960s to the present (Hou and others, 1999; Qin and others, 2000).
Though model studies mostly suggest an increase in monsoon precipitation with greenhouse-gas-induced global temperature increase, as a result of intensification of monsoon circulation due to increase in land–ocean thermal contrast, decreased monsoon precipitation was also predicted based on sulfate aerosol forcing (Reference Lal, Cubasch, Voss and WaszkewitzLal and others, 1995; Reference MudurMudur, 1995). Thus the decrease in net accumulation may also be due to the location of the ice-core drilling sites between two large emission sources, i.e. China and India. the ER ice core also shows a one-third increase in sulfate concentration since the beginning of the 20th century (see below). It is likely that the increase in atmospheric sulfate aerosol has already begun to affect the monsoon in the Himalaya, offsetting the increasing trend in monsoon precipitation that would have been caused by the increase in atmospheric greenhouse gases (Reference Shrestha, Wake and DibbShrestha and others, 1997).
3.2. δ18O
The δ18O record of the ER core is negatively correlated with the monsoon precipitation for Indian region 7 (R= 0.206), and the correlation coefficient increases to –0.323 for the period 1954–97, when the dating result is more reliable due to the β -activity horizon (Fig. 3). Qin and others (2000) also suggested that atmospheric circulation is strongly associated with δ18O in the Himalaya. However, Reference Thompson, Yao and Mosley-ThompsonThompson and others (2000) hypothesized that temperature is the dominant process controlling δ18O in the Dasuopu ice core.
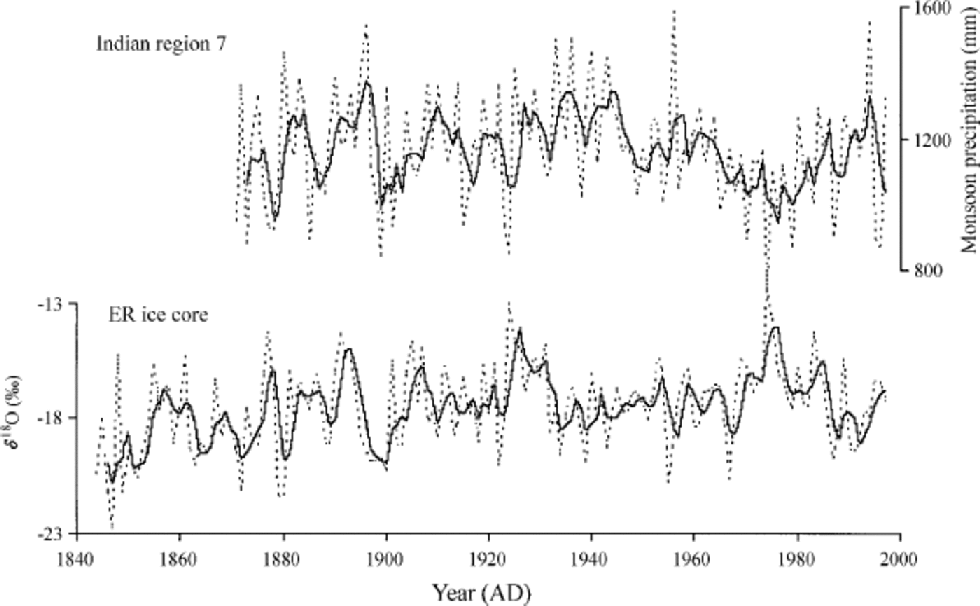
Fig. 3 The δ18O profile of the ER cores, together with the summer monsoonal precipitation record for Indian region 7. the dashed lines show the annual means, and the solid lines show the 3 year smoothing results.
In the tropics, a strong inverse relationship is recognized to exist between the δ18O in precipitation and the amount of precipitation (Reference DansgaardDansgaard,1964; Reference Rozanski, Araguás-Araguás and GonfiantiniRozanski and others, 1992). In southern regions of the Qinghai–Xizang (Tibetan) Plateau and the Himalaya, the amount effect on δ18O in precipitation is also evident based on the results from precipitation and snow-pit sampling (Reference WushikiWushiki, 1977; Reference Wake and StiévenardWake and Stiévenard, 1995; Kang and others, 2000; Qin and others, 2000). Therefore, the inverse association between ER δ18O and precipitation in Indian region 7 is to be expected, given the influence of precipitation amount on δ18O. Previous studies have also suggested the influence of local moisture transport to FER Glacier (only a few kilometers from ER Glacier) which has undergone less isotopic fractionation (Qin and others, 2000).
The ER, FER and Dasuopu cores were all dated by the reference layers of β -activity peaks, and similar sampling and analysis methods were adopted for the isotopic measurement, so we believe that the δ18O profiles of the two cores reflect their corresponding climatic signals. the apparent discrepancy between the δ18O profiles shows the difficulty of accurately interpreting ice-core records from the Himalaya, and more cores are needed to deduce the spatial characteristics of the ice-core records.
3.3. Ca2+ and Mg2+
In Figure 4 we plot the Ca2+ and Mg2+ profiles of the ER core, together with the monsoon (June–September) precipitation for Indian regions 7 and 8, and the annual dust-storm duration and days at Minfeng, located on the southern edge of the Taklimakan desert (Reference ShalamaitiShalamaiti, 1996). A negative relation is found between the crustal-source Ca2+ and Mg2+ and the monsoon precipitation. the correlation coefficients are –0.141 between the annual Ca2+ values and their corresponding regional monsoon precipitation, and 0.244 for the 3 year unweighted runningmeans, respectively. the negative relationship still exists at decadal scale, as indicated by the polynomial regressions. the agreement between the Ca2+ and Mg2+ variations and the dust-storm records for the period 1960–90 indicates the potential influence of the arid regions on the ice-core Ca2+ and Mg2+ records. Though a negative trend in dust-storm frequency and duration since the 1960s was suggested for most places in northern China, mainly due to the decreasing wind strength (Reference Parungo, Li, X., Yang and HarrisParungo and others, 1994; Reference ShalamaitiShalamaiti, 1996; Yang and others, 1998), the increasing trend of the Ca2+ and Mg2+ profile for recent decades may reflect enhanced desertification and environmental deterioration in the Himalayan region.
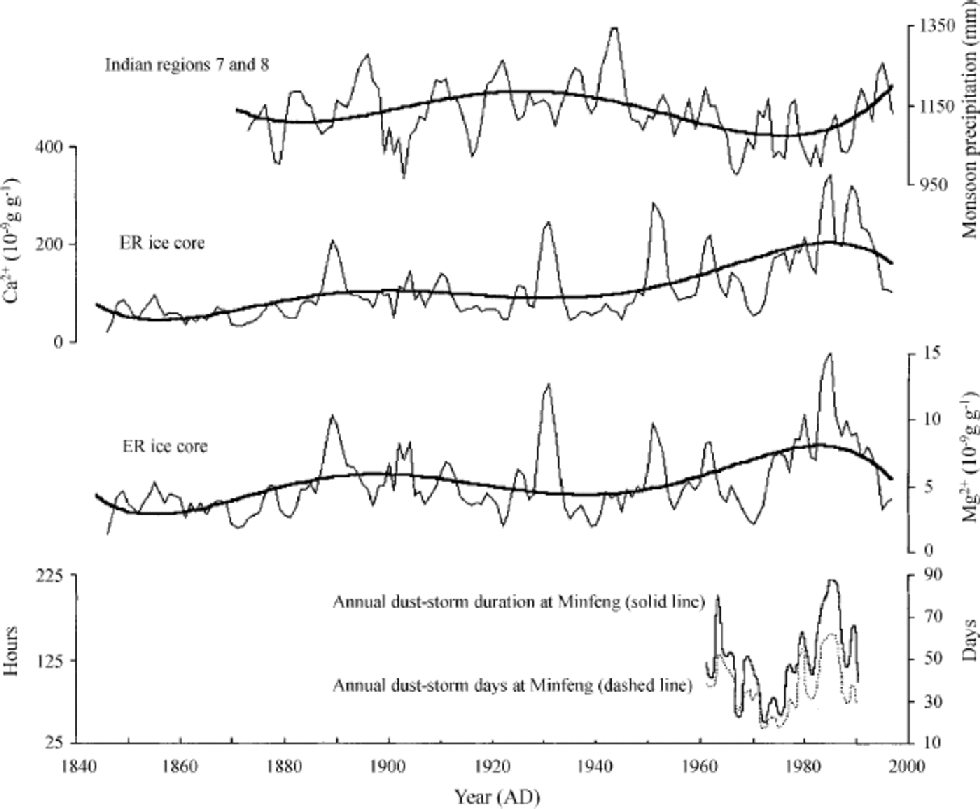
Fig. 4 Three-year smoothing results of the annual Ca2+andMg2+averages of the ER cores and the annual monsoon precipitation records for Indian regions 7 and 8. the coarse lines for Ca2+, Mg2+and precipitation profiles show the polynomial regressions to indicate their corresponding long-term variations. Annual dust-storm history at Minfeng is from Reference ShalamaitiShalamaiti (1996). the original ionic concentrations were resampled to yield average annual values in order to match with the other annual data, and a 3 year smoothing mean was applied to eliminate the stochastic effect of dating error.
3.4. NH4 +
The NH4 + profile is fairly flat until the 1940s, then substantially increases until the end of the 1980s, with a slight decrease during the 1990s (Fig. 5). We compare our data with the decadal-average NH4 + concentration of an ice core drilled on the glacier saddle Colle Gnifetti, Monte Rosa massif (4450ma.s.l.), Switzerland, whose NH4 + level was constant until 1870 and increased afterwards by a factor of three (Reference Döscher, Gäggeler, Schotterer and SchwikowskiDöscher and others, 1996). Reference Döscher, Gäggeler, Schotterer and SchwikowskiDöscher and others (1996) have suggested that the NH4 + concentrations from the beginning of the 20th century are due to NH3 emissions in Europe. the dominant NH3 emission in Europe arises from agricultural sources, mainly bacterial decomposition of livestock wastes (81%) and fertilizer application (Reference Buijsman, Maas and AsmanBuijsman and others, 1987). Therefore, the slightly decreasing NH4 + concentrations of the ER core during the first half of the 20th century may reflect reduced agricultural activity in East and Southeast Asia due to social turbulence, especially during World War II, while the sharp increase in NH4 + concentrations during the second half of the 20th century may correspond to population explosion resulting in increased agricultural activity. In addition, fertilizer was not widely used throughout East and Southeast Asia until recent decades. Ammonium data from the Greenland Summit ice cores also showed a significant increase by more than a factor of 2 since 1950, mainly for snow deposited during the winter half-year, suggesting its anthropogenic origin (Reference Fuhrer, Neftel, Anklin, Staffelbach and LegrandFuhrer and others, 1996). Reference Asman, Drukker and Janssen.Asman and others (1988) estimated a doubling of European NH3 emissions since 1920, based on livestock statistics, and they considered contributions of natural emissions to be already negligible in Europe by 1900. Our results suggest that NH4 + did not originate substantially from anthropogenic sources in the central Himalaya before 1950.
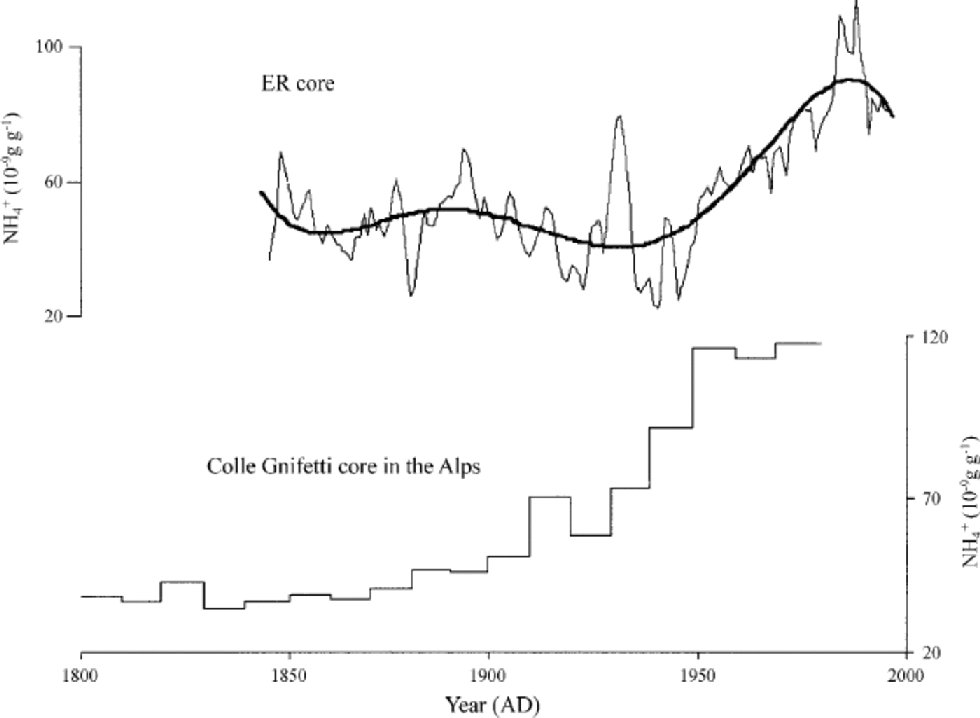
Fig. 5 Three-year smoothing results of the annual NH4 + averages of the ER cores. Coarse line for the NH4 + profile shows the polynomial regressions to indicate its long-term variations. the decadal values of NH4 +for an ice core from the glacier saddle Colle Gnifetti,Monte Rosa massif (4450 m a.s.l.), Switzerland, are from Reference Döscher, Gäggeler, Schotterer and SchwikowskiDöscher and others (1996).
Despite the 1991 Kuwait oil fires and the 1997 fires in Kalimantan and Sumatra, Indonesia (the ``best-estimate’’ total NH3 emission is 2.585 MtN for the Indonesia fires only (Reference LevineLevine, 1999)), NH4 + concentrations in the 1990s are less than in the 1980s. According to the calculations of Reference Lee and Atkins.Lee and Atkins (1994), emissions of NHx(NH3 + NH4 +) from straw burning were equivalent to approximately 20 kt Na–1 in 1981 and declined to 3.3 kt Na–1 in 1991 as a result of new agricultural practices. Moreover, fresh-snow chemistry (wet deposition) explicitly reflects monsoon air mass with more marine origin (Reference Shrestha, Wake and DibbShrestha and others, 1997). Monsoon air masses travel over low-lying valleys and mountain slopes dominated by cultivated land, forests and vegetation before reaching our drilling site. There are also many villages where animal husbandry and fertilization of fields with manure is practised, and burning of firewood is the main source of domestic energy. Therefore, the decline of NH4 + concentrations in the 1990s may be attributed to either agricultural practices (e.g. ploughing the straw and stubble into the soil instead of burning it) or changing sources of domestic energy (e.g. hydropower, oil or solar energy instead of firewood burning).
3.5.
 and
and
Significant variability is evident for the SO4 2– and NO3 – profiles (Fig. 6): for example, the maximum and minimum SO4 2– and NO3 – concentrations are 533.57, 3.05, 631.07 and 0.48 ppb, respectively. However, both the SO4 2– and NO3 – profiles show an apparent increasing trend, especially during the period 1940s–80s. Data from the Dasuopu ice core also indicate double SO4 2– and NO3 – concentrations since 1860 (Reference Thompson, Yao and Mosley-ThompsonThompson and others, 2000). SO4 2– and NO3 – concentrations are highest in the 1990s for the Dasuopu core, but there is a decline during this period for the ER record.This difference may be largely due to the lower-resolution sampling and averaging effect for the Dasuopu data.
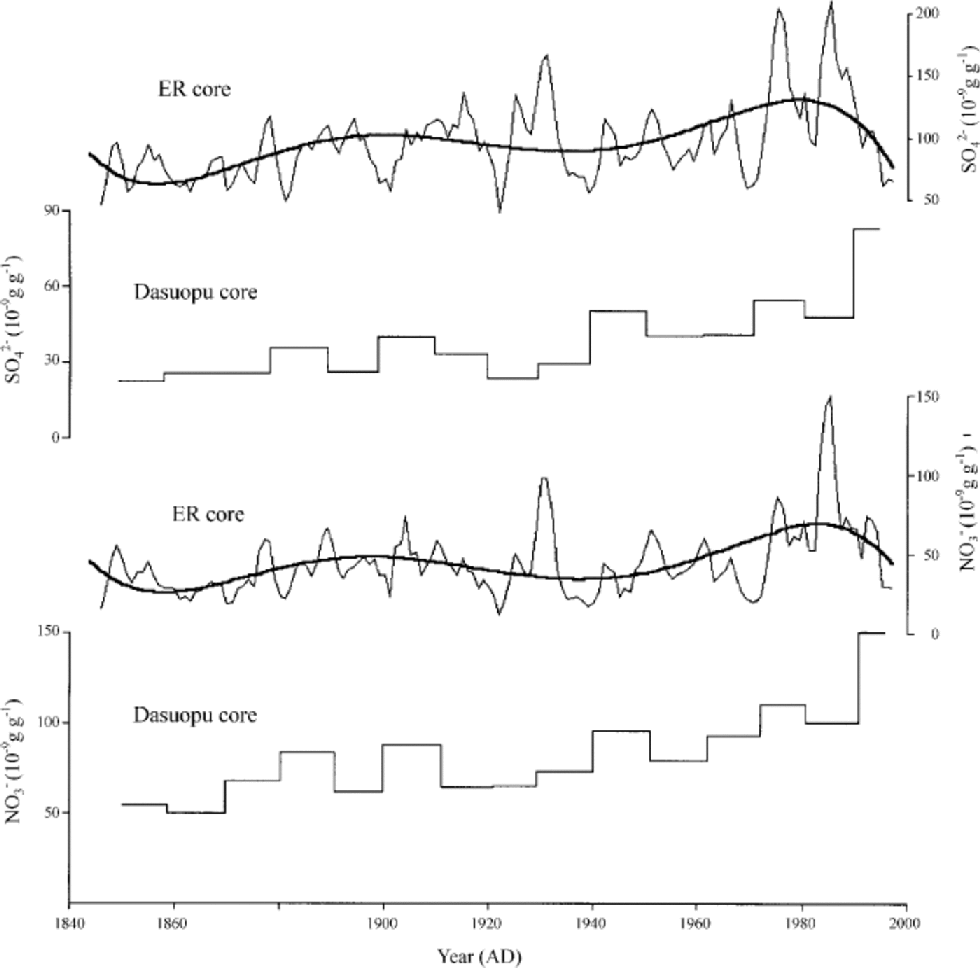
Fig. 6 Three-year smoothing results of the annual SO4 2–andNO3 –averages of the ER cores. Coarse lines for the SO4 2–and NO3 – profiles show the polynomial regressions to indicate their respective long-term variations. the decadal values of SO4 2–and NO3 – for the Dasuopu core are adapted from Reference Thompson, Yao and Mosley-ThompsonThompson and others (2000).
Previous studies have suggested that SO4 2– and NO3 – in the Himalayan snow originate from several sources, including crustal species (Reference Mayewski, Lyons and AhmadMayewski and others, 1983, Reference Wake, Mayewski, Zichu, Ping and ZhongqinWake and others, 1993), biomass burning (Reference Davidson, Lin, Osborn, Pandey, Rasmussen and KhalilDavidson and others, 1986) and local acidic gases (Reference Shrestha, Wake and DibbShrestha and others, 1997). We note that the NO3 – concentration levels are similar for both the Dasuopu and ER cores, but SO4 2– concentrations in the ER core are roughly double those in the Dasuopu core, which may be due to local human activity including that of climbing teams who visit the Everest region. However, the similar temporal variations for SO4 2–, NO3 –, Ca2+ and Mg2+ records of the ER core still reflect the dominance of natural forces in the Qomolangma (Mount Everest) region.
Fifteen years (1980–95) of observations of weekly mean concentrations of 18 constituents in the aerosol of the lower Arctic troposphere at Alert, Canada, indicated a marked decrease of SO4 2– and NO3 – since 1991, likely linked to the collapse of industry in the early years of the new Eurasian republics (Reference Sirois and Barrie.Sirois and Barrie, 1999). the substantially decreased SO4 2– and NO3 – concentrations of the ER core in the 1990s are consistent with the Arctic observation. However, the Dasuopo core does not reveal this decrease, possibly because of the lower sample resolution at this site.
4. Conclusions
Our results indicate that ice cores from high-elevation sites in the Himalaya preserve information on the change of monsoon intensity, anthropogenic activities and dust-storm history. Such kinds of information are not only critical for understanding the mechanism of the South Asian monsoon system, but also provide boundary conditions for better modeling and forecasting.
The apparent spatial discrepancy for some ice-core parameters shows the need for more cores from the Himalaya in order to deduce the real signals and the regional chemical characteristics. for this purpose, we have recovered a 116.7 m bottom core at the col of ER Glacier (6550ma.s.l.) in summer 2001, and hope to recover more bottom cores in the Himalaya next year.
Acknowledgements
We thank S. Whitlow for chemical measurements of the samples. This research was supported by the Chinese Academy of Sciences (KZCX1-10-02, KZCX2-108, KZCX2-301), Cold and Arid Regions Environmental and Engineering Research Institute (CACX210506; CACX210046) and the National Natural Science Foundation of China (49871022, 49901004). Comments from anonymous reviewers improved the manuscript.


