

Bisphenol A (BPA), used in the manufacture of polycarbonate plastics and epoxy resins, is one of the highest-volume chemicals produced worldwide( Reference Vandenberg, Chahoud and Heindel 1 , Reference Rubin 2 ) and production is predicted to reach more than 4·09 Mt (9 billion lb) by 2020( 3 ). Biomonitoring data indicate widespread, chronic low-level exposure to BPA( Reference Rubin 2 , Reference Calafat, Kuklenyik and Reidy 4 – Reference Vandenberg, Hauser and Marcus 6 ). Animal and in vitro data indicate exposure adversely affects health, but limited and conflicting human epidemiological data is often cited as a barrier for risk assessment by regulatory agencies( Reference US 7 – 9 ). While recent epidemiological data suggest that BPA may be associated with alterations in sex and thyroid hormone levels( Reference Wang, Lu and Xu 10 – Reference Galloway, Cipelli and Guralnik 18 ), infertility and polycystic ovary syndrome( Reference Kandaraki, Chatzigeorgiou and Livadas 19 – Reference Ehrlich, Williams and Missmer 21 ), obesity( Reference Galloway, Cipelli and Guralnik 18 , Reference Carwile and Michels 22 – Reference Zhao, Bi and Ma 29 ), pre-diabetes/type 2 diabetes( Reference Lang, Galloway and Scarlett 23 , Reference Sabanayagam, Teppala and Shankar 30 – Reference Kim and Park 32 ) and CVD( Reference Lang, Galloway and Scarlett 23 , Reference Shankar and Teppala 31 , Reference Melzer, Gates and Osborne 33 – Reference Bae, Kim and Lim 35 ), most are cross-sectional analyses with important limitations, such as lack of long-term exposure data which are more relevant for chronic disease risk( Reference LaKind, Goodman and Naiman 36 ).
Diet has been considered the primary source of BPA exposure( Reference Welshons, Nagel and vom Saal 37 – Reference Cao, Corriveau and Popovic 43 ) and previous studies support diet as the major route of human BPA exposure( Reference Teeguarden, Calafat and Ye 44 – Reference Morgan, Jones and Calafat 50 ). The use of polycarbonate plastics in the production of food and beverage storage containers has been largely phased out in the USA. However, BPA is still used in epoxy resin linings of metal cans and lids( Reference Vandenberg, Chahoud and Heindel 1 , Reference Rubin 2 , Reference Vandenberg, Hauser and Marcus 6 , 51 ). BPA has been measured in numerous canned (metal) food products( Reference Cao, Perez-Locas and Dufresne 42 , Reference Cao, Corriveau and Popovic 43 , Reference Thomson and Grounds 52 – Reference Poustka, Dunovska and Hajslova 68 ). A smaller number of studies have indicated that BPA levels are much lower or not present in non-canned food items, although detectable levels have been observed in some canned beverages, microwave meals and restaurant food items( Reference Cao, Perez-Locas and Dufresne 42 , Reference Mariscal-Arcas, Rivas and Granada 57 , Reference Cao, Corriveau and Popovic 69 , Reference Cao, Corriveau and Popovic 70 ). Additionally, human exposure studies have observed decreases in urinary BPA levels after exposure to BPA-containing food packaging was reduced. Urinary BPA levels in Japan decreased significantly after the food industry voluntarily removed BPA from can linings( Reference Matsumoto, Kunugita and Kitagawa 49 ). Three intervention studies have demonstrated the ability to alter urinary BPA levels by increasing or decreasing exposure to all packaged foods( Reference Teeguarden, Calafat and Ye 44 – Reference Carwile, Ye and Zhou 46 ). However, a more recent study did not observe the expected decrease in urinary BPA levels when packaged foods were removed from study participants’ diet( Reference Sathyanarayana, Alcedo and Saelens 71 ).
Among other potential sources of BPA exposure, thermal receipt paper may be an additional important source of BPA exposure in certain individuals (e.g. cashiers)( Reference Geens, Goeyens and Kannan 72 – Reference Ehrlich, Calafat and Humblet 75 ). Limited studies have been conducted, but a recent study showed increased urinary BPA levels with extensive handling of thermal receipt paper. The observed increases in urinary BPA levels( Reference Ehrlich, Calafat and Humblet 75 ) were smaller compared with what was observed with canned food intake( Reference Carwile, Ye and Zhou 46 ). BPA has also been found in products made from recycled paper( Reference Liao and Kannan 76 ), dust particles( Reference Loganathan and Kannan 77 – Reference Rudel, Camann and Spengler 79 ), dental fillings( Reference Van Landuyt, Nawrot and Geebelen 80 ) and soil, tap and surface water( Reference Santhi, Sakai and Ahmad 81 – Reference Kang, Kondo and Katayama 86 ), but current data indicate these sources of exposure contribute only minimally to overall exposure( Reference Geens, Goeyens and Covaci 59 , Reference Geens, Aerts and Berthot 73 , Reference Vandenberg, Hunt and Myers 87 , Reference Arnold, Clark and Staples 88 ).
To sufficiently estimate typical BPA exposure levels, multiple urine samples are required from study participants and measurement of urinary BPA levels is relatively expensive. Large prospective epidemiological studies, which are needed to evaluate potential causal relationships between BPA exposure and health outcomes, often have collected only spot urine samples and have limited budgets for measuring BPA levels in multiple urine samples for each participant. Spot urine samples reflect only recent BPA exposure and may lead to misclassification of exposure. Since diet is considered the major source of exposure and is thought to explain most of the variability in urinary BPA levels( Reference Geens, Goeyens and Covaci 59 , Reference Geens, Aerts and Berthot 73 , Reference Vandenberg, Hunt and Myers 87 , Reference Arnold, Clark and Staples 88 ), we hypothesized that BPA exposure data could be estimated by using a set of questions targeting known sources of BPA, similar to an FFQ. Therefore, the goal of the present study was to develop and evaluate the use of the BPA Exposure Assessment Module (BEAM) to collect data on dietary BPA exposure. A questionnaire approach to BPA exposure assessment could allow for larger sample sizes and repeated assessment to determine long-term patterns of BPA exposure.
Methods
Study population and design
Sixty-eight healthy adults were recruited for the current feasibility and validation study. While much of the existing BPA research has focused on exposures among pregnant women, infants and children, the lack of studies among other population groups does not indicate a lack of potential risk. Due to a need for research in the general population, healthy adults were targeted for inclusion in the present study. Participant recruitment occurred from August 2012 to January 2013 using advertisements in community newspapers and on Craigslist, and flyers posted on the University of Minnesota campus. Inclusion criteria were: (i) 20–59 years of age; (ii) resident of Anoka, Carver, Dakota, Hennepin, Ramsey, Scott or Washington counties in Minnesota; (iii) able to give informed consent; (iv) available during the study dates; (v) able to speak English; (vi) no history of cancer (excluding non-melanoma skin cancer), heart attack, diabetes or cerebrovascular event; (vii) non-smoker; and (viii) no body weight changes of more than 10 % in the previous 6 months. Pregnant and lactating women were excluded. Participants were screened by telephone interview.
To ensure a range of potential BPA exposure levels, we aimed to enrol equal numbers of participants in the following categories of canned food intake: <1 time/week, ≥1 to <3 times/week, ≥3 to <5 times/week and ≥5 times/week. Potential participants were asked eleven questions about dietary habits, including canned food intake, fruit and vegetable intake and meals eaten away from home. A total of 182 people were screened for eligibility. The most common reason why potential participants were excluded from the study was that their canned food intake patterns placed them in a BPA exposure group that was already full.
Demographic data collection
Participants completed a questionnaire that included the BEAM, as well as demographic and lifestyle questions (e.g. age, education, physical activity)( 89 , 90 ). Height (wall-mounted stadiometer; Holtain Ltd, Crymych, UK), weight (BWB-800 scale; Tanita Corporation, Arlington Heights, IL, USA) and waist circumference (Gulick II Tape Measure; Country Technology, Gays Mills, WI, USA) were measured by study staff. BMI was calculated as [weight (kg)]/[height (m)]2.
Collection of dietary data: BPA Exposure Assessment Module (BEAM)
The goal in developing the BEAM was analogous to the goal of nutrient intake data collected by FFQ, which is to rank participants by levels of exposure rather than determine exact exposure levels. While FFQ have important limitations, they have been useful for measuring certain exposures. The underlying premise of the FFQ, i.e. that average, long-term exposure level is more important than exact level on one or a few specific days, may be similarly relevant for BPA( Reference Willett 91 , Reference Willett and Lenart 92 ). Similar to nutrient intakes, BPA has clearly identifiable food sources (e.g. canned foods) and has high within-person variability day to day dependent on recent intake, indicating a similar approach could be feasible. A review of the scientific literature was conducted to identify major dietary sources of BPA, which indicated that canned foods, particularly legumes, vegetables and soups, are important sources of BPA exposure, while lower but detectable levels have also been observed in canned beverages, fast-food meals and microwave meals. Data also suggest that BPA levels in food products can be highly variable, even for the same food item from the same company( Reference Noonan, Ackerman and Begley 55 ); however, as mentioned, FFQ are designed to be used to rank participants rather than determine their exact levels of highly variable food and nutrient intakes. If canned food intake is the primary source of exposure, this approach assumes that a participant who eats canned foods daily, regardless of variability in actual BPA levels in the foods consumed, would be predicted to have the highest urinary BPA level because he/she has the highest potential for exposure. Conversely, a person who reports never consuming canned foods would have the lowest urinary BPA level. Usual US food intake data were used to identify the most commonly consumed canned food items in the USA( Reference Noonan, Ackerman and Begley 55 ).
The BEAM design was based on the format of the National Cancer Institute’s Diet History Questionnaire II( 90 ), which allows for the insertion of additional questions to obtain more details about a food item (such as package type). Frequency of canned food intake was assessed by asking about the proportion of servings from a metal can (for food items generally available in metal cans). Few non-canned foods have been evaluated; however, BPA has been detected in microwave meals and restaurant foods, perhaps due to the inclusion of previously canned foods or BPA present on processing equipment( Reference Cao, Perez-Locas and Dufresne 42 , Reference Mariscal-Arcas, Rivas and Granada 57 ). Metal beverage cans are also reported to contain BPA in the lining, although BPA levels observed in beverages have been low or undetectable( Reference Cao, Corriveau and Popovic 69 , Reference Cao, Corriveau and Popovic 70 ). In order to account for these potential sources, the proportion of servings prepared from frozen (e.g. microwave meals), beverages consumed from cans or plastic bottles and frequency of meals at restaurants were also ascertained.
The primary focus of the present study was on dietary sources of BPA exposure because existing data suggest that most non-dietary sources of exposure contribute minimally to overall BPA levels. The exceptions are cigarette smoking (BPA in filters)( Reference Braun, Kalkbrenner and Calafat 47 ) and frequent receipt paper handling (e.g. cashiers)( Reference Braun, Kalkbrenner and Calafat 47 , Reference Ehrlich, Calafat and Humblet 75 ), which may contribute substantially in certain individuals. Smokers were excluded from the present study, removing our ability to consider smoking as a potential exposure factor. Data on frequency of receipt paper handling data were collected and included in the analyses. While receipt paper handling is not a dietary exposure, collecting these data allowed us to account for this source of exposure and was ascertained with minimal additional participant burden (a single question added to the study questionnaire). The entire study questionnaire (BEAM and non-diet questions) is provided as online supplementary material. Complete questionnaire data were obtained from all participants.
Frequency (per day) of canned food intake reported on the BEAM was quantified for the following categories: canned vegetables, canned fruit, canned meals and total canned food intake. Frequency (per day) of intake of beverages from cans or plastic containers, microwave meals and restaurant meals was also estimated.
Collection of dietary data: 24 h food records
Three 24 h food records were collected as a method for comparison to the BEAM. Participants recorded all foods and beverages consumed on two weekdays (Tuesday and Thursday) and one weekend day (Saturday), which is consistent with the minimum number of days needed to ensure a reasonably accurate representation of usual intake while limiting participant burden( Reference Buzzard 93 ). The food record instructions included recording of details about the food packaging and brand names of the foods consumed.
On the food records, the frequency of intake of canned foods, beverages from cans or plastic containers, microwave meals and restaurant meals was manually abstracted and summed for a three-day total. A serving size of canned food was defined as the proportion of a 113 g (4 oz) serving of food and a serving of beverage as the proportion from a 355 ml (12 fl oz) can/bottle. Any meal eaten at a restaurant was counted as one restaurant meal, excluding baked goods (scones, muffins, cake, etc.) and beverages (including lattes, mochas, smoothies), as these eating episodes could not be clearly labelled as meals (e.g. often purchased ready-to-eat from grocery stores or eaten as snacks) and were unlikely to contribute to differential BPA exposure based on known sources of BPA. Sixty-seven of the sixty-eight participants provided complete food records. Food record nutrient data were calculated using the Nutrition Data System for Research (NDSR, version 2012; University of Minnesota, Minneapolis, MN, USA)( Reference Sievert, Schakel and Buzzard 94 , Reference Schakel, Sievert and Buzzard 95 ).
Measurement of urinary bisphenol A
As a criterion measure of BPA exposure, participants were asked to collect three spot urine samples on each of the two weekdays and one weekend day that corresponded with the days that 24 h food records were collected (n 9). Single-void urine samples and single 24 h samples have been shown to have high within-person variability( Reference Townsend, Franke and Li 96 – Reference Lassen, Frederiksen and Jensen 98 ). Data suggest that using multiple spot urine collections results in estimated BPA levels that are close to the mean concentrations observed after multiple 24 h urine collections( Reference Ye, Wong and Bishop 97 ).
On each day, participants collected the first morning void (first void, at or after 05.00 hours), a midday sample (between 11.00 and 14.00 hours) and an evening sample (between 18.00 and 21.00 hours pm) in labelled, sterile, commercial 118 ml (4 fl oz) polypropylene containers (BPA-free( 99 )). Time of sample collection was recorded by the participant and samples were refrigerated until their next study visit. Total BPA is stable in urine during short-term storage and does not require immediate processing( Reference Nepomnaschy, Baird and Weinberg 100 ).
The nine spot urine samples from each participant were pooled, mixed thoroughly and stored at −70°C until sent for analysis. Specific gravity was measured using a digital handheld refractometer (ATAGO PAL-10S; ATAGO USA, Inc., Bellevue, WA, USA) to account for urine concentration( Reference Boeniger, Lowry and Rosenberg 101 , Reference Teass, DeBord and Brown 102 ). Samples were shipped as a single batch on dry ice overnight to NMS Labs (Willow Grove, PA, USA) for analysis. Sixty-two participants provided all nine urine samples, five participants provided eight and one participant provided seven.
Total (free and conjugated) urinary BPA was measured by GC–MS( Reference Brock, Yoshimura and Barr 103 ). The detection limit was 0·50 ng/ml and the blinded replicate CV was 14 %. All but one participant had measurable levels of BPA in their urine.
Urinary BPA concentrations were adjusted for dilution by multiplying measured BPA values (μg/l) by [(1·024−1)/(specific gravity – 1)]( Reference Levine and Fahy 104 , Reference Mahalingaiah, Meeker and Pearson 105 ). Urinary BPA concentrations below the limit of detection (0·50 μg/l) were divided by the square root of 2( Reference Hornung and Reed 106 ).
Creation of bisphenol A exposure scores
To evaluate overall potential BPA exposure from all known sources of BPA exposure collected, a total BPA exposure score, based on known sources of BPA reported in the literature, was created for both the BEAM and the food record data. The scores included canned foods, microwave meals, canned beverages, restaurant meals and receipt handling. Microwave meals and restaurant meals have previously been shown to be additional sources of BPA exposure, possibly due to use of canned food items in preparation or contact with non-BPA-free storage containers; thus, microwave and restaurant meals are included in the score( Reference Cao, Perez-Locas and Dufresne 42 , Reference Mariscal-Arcas, Rivas and Granada 57 ). While receipt paper handling is not a dietary source of exposure, we chose to include this variable because we wanted to account for all the potential major contributing factors to the variability in urinary BPA levels and frequent handling of thermal receipt paper is a known source of BPA exposure( Reference Geens, Goeyens and Kannan 72 – Reference Ehrlich, Calafat and Humblet 75 ). The score was weighted to account for reported variation in BPA content of foods. Canned foods were considered the primary BPA source (canned food×1·0), as the BPA content of canned foods has been reported to range from an average of 9·8 μg/kg (fruit) to 69·6 μg/kg (meat)( 9 ). The reported BPA content of canned beverages (average: 1 μg/l)( 9 ), microwave meals (1·33–2·02 μg/kg)( Reference Cao, Perez-Locas and Dufresne 42 , Reference Mariscal-Arcas, Rivas and Granada 57 ) and restaurant meals (1·61 μg/kg in sandwich, 2·32 μg/kg in hot dog, 1·45 μg/kg in chicken burger, not detected in chicken nuggets)( Reference Cao, Perez-Locas and Dufresne 42 ) typically is significantly lower than that of canned food items, and the presence of BPA in these items is inconsistent. Thus, beverages from cans, microwave meals and restaurant meals were given a lower weight in the overall score (intake×0·25). Handling of thermal receipt paper has been shown to increase urinary total BPA levels, but at levels lower than canned food items even with constant handling, so receipt handling was weighted higher than canned beverages, microwave meals and restaurant meals, but lower than canned foods (receipts×0·5)( Reference Ehrlich, Calafat and Humblet 75 ).
Data analysis
In all analyses, urinary BPA levels were log-transformed to normalize the distribution. Spearman correlations were calculated to compare the data on reported intakes of canned food, canned beverages, restaurant meals and exposure scores on the BEAM with the 24 h food records. Spearman correlations were also calculated to evaluate the correspondence between hypothesized sources of BPA exposure assessed by the BEAM and 24 h food records and observed urinary BPA levels.
Multivariable linear regression models were used to evaluate the degree to which data collected on the BEAM explained variability in urinary BPA levels. Primary exposures were evaluated as categorical variables and included canned foods, microwave meals, canned beverages, restaurant meals, receipt handling and combined exposure scores. Exposure scores were additionally evaluated as continuous variables. Age, sex, education, BMI, waist circumference, income, occupation, physical activity, energy intake and chronic health issues were evaluated as potential covariates. No individual variables were found to be associated with both urinary BPA levels and packaged food intake (all P values >0·10). Consequently, only age and sex were included as covariates in the models. All analyses were replicated using data from the 24 h food records.
Weighted kappa (κ w) was used to evaluate agreement between the different measurement approaches. Categories of canned food intake as assessed by the BEAM (<1 time/week, 1–4 times/week, ≥5 times/week) and food records (none/3 d, >0–<3 servings/3 d, ≥3 servings/3 d) were compared with each other and with urinary BPA tertiles( Reference Jakobsson and Westergren 107 ). Combined BPA exposure scores for the BEAM and food records were divided into tertiles and compared with each other and with urinary BPA tertiles.
Since certain types of canned fruits have been reported to not have epoxy resin linings, analyses were performed excluding canned fruits from total canned food intake evaluations. Results did not differ (see online supplementary material, Supplementary Tables 1 and 2) and presented results include canned fruits. Sensitivity analyses were also performed excluding participants with missing urine samples (n 6), high urinary BPA outliers (>95th percentile from the National Health and Nutrition Examination Survey 2009–2010; n 2) and reported food consumption that would result in an implausible energy intake level (>20 920 kJ/d (>5000 kcal/d) or <2092 kJ/d (<500 kcal/d); n 2). Excluding participants with missing urine samples did not alter the observed associations, so the presented results include these participants, but exclude high urinary BPA outliers (n 2). Urinary BPA outliers did not have any identifiable dietary or lifestyle differences from the rest of the study population that would explain their higher levels.
All data analyses were performed using the statistical software package SAS version 9·2. P values <0·05 were considered statistically significant.
Results
Participants ranged in age from 20 to 55 years (Table 1). Most were normal weight (BMI=18·0–<25·0 kg/m2), white, female and college educated. The population was generally healthy and reported high levels of physical activity. Urinary BPA levels were not associated with any demographic or lifestyle characteristics examined. Handling of receipt paper was infrequent in this population with only six participants reporting typically handling more than five receipts per day. Age- and sex-adjusted mean urinary BPA levels were higher among these participants (mean=4·99 μg/l; 95 % CI 2·96, 8·42 μg/l; P=0·03) compared with the rest of the participants (mean=2·77 μg/l; 95 % CI 2·35, 3·27 μg/l; adjusted model R 2=0·14). Unadjusted and specific gravity-adjusted geometric means and medians for the overall population are presented in Table 2.
Characteristics and mean urinary BPA levels (μg/l) of the study sample (n 68) of healthy adult volunteers (aged 20–55 years), Minneapolis/Saint Paul, Minnesota, USA, August 2012–January 2013

BPA, bisphenol A.
* Linear regression. Geometric means, specific gravity-adjusted for concentration.
† Linear regression. Adjusted for age and sex. BPA levels are specific gravity-adjusted for concentration. Sex model is age-adjusted only. Age model is sex-adjusted only. Geometric means.
‡ Hispanic/Latino (n 1), Hawaiian/Pacific Islander (n 1), Other (n 2).
§ Don’t know or prefer not to answer.
|| Average daily energy intake. Three-day total/3. Food record-reported energy intake.
Urinary BPA levels in the study sample* and adults aged 20–59 years in NHANES 2009–2010
BPA, bisphenol A; NHANES, National Health and Nutrition Examination Survey; LOD, limit of detection.
* Healthy adult volunteers (aged 20–55 years; n 68), Minneapolis/Saint Paul, Minnesota, USA, August 2012–January 2013.
Canned vegetables were the most frequently reported canned food item on the BEAM. On food records, legumes (baked beans, black beans), soups and vegetables (corn, green beans, peas, carrots) were the most commonly reported canned foods.
BEAM questions v . food record intake
Canned food intake estimated from the BEAM was non-significantly positively correlated (r=0·22, P=0·08; Fig. 1) with food record-estimated canned food intake and κ w=0·15 (data not shown) also suggests a poor ability of the two tools to similarly rank participants’ canned food intake. The number of meals away from home estimated from the BEAM and the food records were significantly positively correlated (r=0·34, P=0·005). The total BPA exposure scores from the BEAM and food record data were not significantly correlated (r=0·15, P=0·25; Fig. 1) and the κ w value was low (=0·06; data not shown).
Reported canned food intake comparison between BEAM and food record data among healthy adult volunteers (aged 20–55 years; n 68), Minneapolis/Saint Paul, Minnesota, USA, August 2012–January 2013: (a) BEAM-reported canned food intake compared with food record-reported canned food intake (r=0·22, P=0·08); (b) BEAM score compared with food record score (r=0·15, P=0·25). ——— represents observed regression line. Scores were calculated as follows: (total canned food×1·0) + (microwave meals×0·25) + (canned beverages×0·25) + (restaurant meals×0·25) + (receipts×0·50) (BEAM, BPA Exposure Assessment Module; BPA, bisphenol A; r, Spearman correlation coefficient)

BEAM data and urinary bisphenol A levels
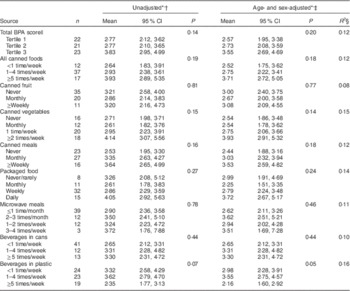
BEAM-assessed intakes of canned foods (Table 3), all types of packaged foods combined (Table 3) and restaurant meals (Table 4) were not significantly associated with urinary BPA levels. The BPA exposure score derived from the BEAM was significantly correlated with urinary BPA when examined as a continuous variable (r=0·26, P=0·03; Fig. 2), but not when evaluated as a categorical variable (P=0·20; Table 3). Frequency of BEAM-reported canned food intake alone (adjusted for age and sex) explained 12 % of the variability (R 2) in urinary BPA levels (P=0·18). A model including all a priori hypothesized predictors (age, sex, canned food intake, restaurant meals, canned beverage intake and receipt handling) explained 25 % of the variability (R 2) in urinary BPA levels (full model P=0·30) and no individual predictor in the model was significantly associated with urinary BPA levels (data not shown). Consistent with regression analyses, weighted kappa analyses indicated that there was poor agreement with both the BEAM total BPA exposure score (κ w=0·15) and total canned food intake alone (κ w=0·21) when compared with observed urinary BPA levels (Table 5).
Urinary BPA and reported canned food intake on BEAM and 24 h food records among healthy adult volunteers (aged 20–55 years; n 68), Minneapolis/Saint Paul, Minnesota, USA, August 2012–January 2013: (a) urinary BPA levels compared with reported canned food intake on the BEAM (r=0·19, P=0·14); (b) urinary BPA levels compared with reported canned food intake on 24 h food records (r=0·35, P=0·004); (c) urinary BPA levels compared with BEAM score (r=0·26, P=0·03); (d) urinary BPA levels compared with food record score (r=0·32, P=0·008). ——— represents observed regression line; the data points (♦) reflect individual, SG-adjusted urinary BPA levels; r and P were calculated using log-transformed, SG-adjusted urinary BPA levels. Scores were calculated as follows: (total canned food×1·0) + (microwave meals×0·25) + (packaged beverages×0·25) + (restaurant meals×0·25) + (receipts×0·50) (BPA, bisphenol A; BEAM, BPA Exposure Assessment Module; r, Spearman correlation coefficient; SG, specific gravity)

Mean urinary BPA levels (μg/l) by BEAM total BPA score and packaged food intake levels among healthy adult volunteers (aged 20–55 years; n 68), Minneapolis/Saint Paul, Minnesota, USA, August 2012–January 2013
BPA, bisphenol A; BEAM, BPA Exposure Assessment Module.
* Specific gravity-adjusted geometric means.
† Specific gravity-adjusted BPA only.
‡ Additionally, adjusted for age and sex.
§ R 2 value is coefficient of determination from age- and sex-adjusted model.
|| Weighted score. Weighting=(total canned food×1·0) + (microwave meals×0·25) + (canned beverages×0·25) + (restaurant meals×0·25) + (receipts×0·50).
Mean urinary BPA levels (μg/l) by BEAM-reported frequency of meals eaten away from home among healthy adult volunteers (aged 20–55 years; n 68), Minneapolis/Saint Paul, Minnesota, USA, August 2012–January 2013

BPA, bisphenol A; BEAM, BPA Exposure Assessment Module.
* Specific gravity-adjusted geometric means.
† Specific gravity-adjusted BPA only.
‡ Additionally, adjusted for age and sex.
§ R 2 value is coefficient of determination from age- and sex-adjusted model.
Weighted kappa analysis to evaluate agreement between the different measurement approaches in the study sample (n 68) of healthy adult volunteers (aged 20–55 years), Minneapolis/Saint Paul, Minnesota, USA, August 2012–January 2013

BPA, bisphenol A; BEAM, BPA Exposure Assessment Module; κ w, weighted kappa.
* κ w=0·61–0·80→ good agreement; κ w<0·40→ poor agreement( Reference Altman 120 ).
† Weighted score. Weighting=(total canned food×1·0) + (microwave meals×0·25) + (canned beverages×0·25) + (restaurant meals×0·25) + (receipts×0·50).
Food record data and urinary bisphenol A levels
Both the food record total BPA score (r=0·32, P=0·008) and canned food intake (r=0·35, P=0·004) were significantly positively correlated with urinary BPA levels (Fig. 2). Participants who reported no canned food intake on the food records had the lowest urinary BPA levels (geometric mean=2·51 μg/l; 95 % CI 2·08, 3·02 μg/l), while those who reported a total of three or more servings had the highest mean urinary BPA levels (geometric mean=5·45 μg/l; 95 % CI 3·84, 7·74 μg/l; P<0·001; Table 6). The number of meals away from home and packaged beverage intake were not associated with urinary BPA levels. Frequency of food record-reported canned food intake (adjusted for age and sex) explained 22 % of the variability (R 2) in urinary BPA levels (P<0·001). The model including all a priori predictors (age, sex, canned food intake, restaurant meals, canned beverage intake and receipt handling) explained 41 % of the variability (R 2; full model P=0·003), but only canned food (P<0·001) intake was a statistically significant predictor of urinary BPA levels (data not shown). Similar to the BEAM, there was poor agreement between predicted BPA exposure levels from all sources of exposure and from canned food only when compared with observed urinary BPA levels (food record total BPA score, κ w=0·18; canned food intake, κ w=0·20; Table 5).
Mean urinary BPA levels (μg/l) by food record total BPA score and intake of selected food categories as estimated from the 24 h food records among healthy adult volunteers (aged 20–55 years; n 68), Minneapolis/Saint Paul, Minnesota, USA, August 2012–January 2013

BPA, bisphenol A.
* Specific gravity-adjusted geometric means.
† Linear regression. Specific gravity-adjusted BPA only.
‡ Linear regression. Additionally, adjusted for age and sex.
§ R 2 value is coefficient of determination from age- and sex-adjusted model.
|| Weighted score. Weighting=(total canned food×1·0) + (canned beverages×0·25) + (restaurant meals×0·25) + (microwave meals×0·25) + (receipts×0·50).
¶ Summed intake for all 3 d of food records.
** Serving=113 g (4 oz) for foods; 355 ml (12 fl oz) for beverages.
Discussion
The BEAM-derived measures of foods believed to be major sources of BPA and overall BPA exposure score were weakly or not associated with urinary BPA levels. Reported intake of canned foods on food records from the same time period as the urine samples were collected was more predictive of urinary BPA levels than the BEAM-reported intakes. However, regardless of diet assessment method, less than half of the variability in urinary BPA levels was explained by expected dietary BPA sources (canned foods, canned beverages, microwave meals and restaurant meals) in the present study. More frequent receipt paper handling was also associated with urinary BPA levels, but was infrequent in this population.
There are multiple explanations for the apparent poor validity of the BEAM, including limitations of FFQ and the possibility that foods are not currently the predominant source of BPA. While some studies indicate that diet accounts for more than 90 % of potential BPA exposure in the environment of the general population( Reference Morgan, Jones and Calafat 50 , Reference Geens, Aerts and Berthot 73 ), other studies have found that diet explains a significantly lower proportion of urinary BPA levels( Reference Teeguarden, Calafat and Ye 44 , Reference Braun, Kalkbrenner and Calafat 47 , Reference Casas, Valvi and Luque 48 , Reference Stahlhut, Welshons and Swan 108 ). Intervention studies have demonstrated the ability to lower, but not eliminate BPA exposure among study participants( Reference Morgan, Jones and Calafat 50 , Reference Geens, Goeyens and Covaci 59 , Reference Sathyanarayana, Alcedo and Saelens 71 , Reference Liao and Kannan 109 ). In the current study, only recent canned food intake, as measured by the food records, was associated with urinary BPA levels. This suggests that canned food intake is an important source of exposure, but that it may not be the only important source of exposure in the general population.
Canned food intake was moderately positively correlated between the two different measurement tools. Variability in canned food intake throughout the year (often consumed in colder months of the year) and variability in BPA levels in food items could help explain why canned food intake assessed by the BEAM was not associated with urinary BPA levels. Studies suggest that BPA levels in food items, even from the same company, are highly variable( Reference Cao, Perez-Locas and Dufresne 42 , Reference Cao, Corriveau and Popovic 43 , Reference Noonan, Ackerman and Begley 55 , Reference Goodson, Summerfield and Cooper 58 , Reference Vandenberg, Hunt and Myers 87 , 90 , Reference Cao and Corriveau 110 ) and BPA levels reflect recent exposure. These inconsistencies could make it difficult to estimate dietary BPA exposure and could bias associations towards the null.
Restaurant and packaged meals (microwave or box mixes) could be an additional source of BPA as they may contain canned food or be exposed to equipment or food storage containers containing BPA. However, restaurant meals and packaged food intake were not associated with urinary BPA levels in the current study. The diversity of restaurant and packaged meal options likely attenuates any potential associations towards the null. Few previous studies have evaluated BPA levels in relation to restaurant meals and intake of non-canned packaged foods, but detectable levels were previously observed in fast-food items( Reference Cao, Perez-Locas and Dufresne 42 ).
The premise of the BEAM was based on the assumption that diet (canned foods) is the primary source of BPA exposure. Despite current literature suggesting canned foods and diet as a primary source of exposure, there is increasing debate as to whether diet is the primary source of BPA exposure given the lack of paired dietary intake data and data on urinary or serum BPA concentrations( Reference Geens, Goeyens and Covaci 59 , Reference Vandenberg, Hunt and Myers 87 , Reference Stahlhut, Welshons and Swan 108 , Reference Christensen, Lorber and Koslitz 111 ). While current data indicate that other known sources of exposure likely contribute only minimally to exposure levels( Reference Geens, Goeyens and Covaci 59 , Reference Geens, Aerts and Berthot 73 , Reference Vandenberg, Hunt and Myers 87 , Reference Arnold, Clark and Staples 88 ), diet has long been assumed to be the primary source of BPA exposure in the general population and this may have led to limited investigation of other potential dietary and non-dietary sources of exposure. BPA is also used in cigarette filters, but smokers were excluded from the present study( Reference Geens, Goeyens and Covaci 59 , Reference Vandenberg, Hunt and Myers 87 , Reference He, Miao and Herrinton 112 ). A recent study observed associations between personal care product usage, such a mouthwash, and higher urinary BPA levels( Reference Meeker, Cantonwine and Rivera-Gonzalez 113 , Reference Lewis, Meeker and Peterson 114 ), which is consistent with recent evidence suggesting BPA can be absorbed sublingually( Reference Gayrard, Lacroix and Collet 115 ). These additional sources of BPA exposure were not captured in our study.
An important strength of the present study was simultaneous collection of both FFQ and food record data and urine samples, allowing for evaluations of associations between reported dietary intake and BPA exposure in a free-living healthy adult population. Additionally, urinary BPA was measured using nine spot urine samples collected over multiple days from each participant and pooled for analysis. This better reflects average levels of exposure than a single spot urine sample and is more meaningful when trying to evaluate the ability of a questionnaire to capture typical exposure levels for a period of time( Reference Townsend, Franke and Li 96 – Reference Lassen, Frederiksen and Jensen 98 ).
The limitations of the current pilot project include the fact that data collection occurred over the course of a week, which did not allow for an evaluation of whether BPA levels and source of exposure vary across seasons or from year to year. Since the BEAM queries about frequency of consumption of food over a 1-year period (past year), it might have been found to perform better if we had averaged urinary BPA levels from multiple time points throughout the year. The inability of the BEAM questions to predict urinary BPA levels could also be due to the small study sample size.
It is also important to acknowledge the known limitations in FFQ, since similar limitations also apply to their use for BPA exposure estimation. While the FFQ has been an important research tool, concerns exist that it may be unable to adequately capture dietary exposures( Reference Willett 91 , Reference Willett and Lenart 92 , Reference Kristal, Feng and Coates 116 – Reference Brown 118 ). When compared with biomarker-measured levels, micronutrient and macronutrient levels estimated by FFQ have been shown to have poor agreement( Reference Schatzkin, Kipnis and Carroll 119 ) and this could present similar issues in attempting to estimate chemical exposures in the diet when using frequency of food intake. This could explain why the food records were more strongly associated with urinary BPA levels; however, food record-reported intake was also less strongly associated than would be expected if canned foods were the primary source of exposure to BPA.
Another limitation is that the choice of three 24 h food records was based on an approach validated for nutrient levels (two weekdays, one weekend day). To our knowledge, no previous study has evaluated food packaging data using a food record or the number of food records required to estimate average food packaging exposure throughout the year. It may be that the number of food record days is insufficient for estimating the average long-term exposure to packaged food items, which the BEAM is designed to assess.
With respect to study strengths, given the limited data on major sources of BPA exposure in free-living populations, the present study provides useful information. Diet is considered the major source of BPA exposure in the general population, yet our study findings suggest that we do not yet have a clear understanding about sources of BPA exposure. Previous research measuring BPA in our environment has focused on BPA from canned foods or polycarbonate plastic storage containers, perhaps reinforcing these products as primary source of exposure while providing little insight into other potential sources. While recent canned food intake was associated with higher urinary BPA levels, it was not as strongly associated as might be expected if canned food is the major source of exposure. Currently available data on sources of BPA exposure in the general population are likely not complete.
Conclusions
The results from the present study indicate that the BEAM questionnaire was able to collect data on known dietary sources of BPA exposure, but this approach may not adequately estimate BPA exposure levels. Future studies should consider the potential for other sources of dietary exposure, collect additional data on non-dietary sources of exposure (dust, personal products) and use additional time points of assessment of BPA exposures throughout the year. Study results also indicate that diet may not be the only important source of BPA exposure and further research is needed to better characterize sources of BPA exposure in free-living adult populations.
Acknowledgements
Acknowledgements: The authors thank Lori Strayer for assistance during recruitment and data collection. Financial support: This work was supported by grants from the University of Minnesota Institute on the Environment (to K.R.) and a Hawley Award from the University of Minnesota School of Public Health for dissertation research (to S.O.N.). S.O.N. was additionally supported by the National Cancer Institute at the National Institutes of Health (grant number T32 CA13267; Principal Investigator: Dr Kristin Anderson). Conflict of interest: None. Authorship: All authors contributed to this manuscript. S.O.N. conceived of the study, was the primary designer of the evaluated questionnaire, performed data analysis and wrote the manuscript. L.H. and K.R. assisted in study design and were major contributors in questionnaire development, data analysis and manuscript preparation. Ethics of human subject participation: This study was conducted according to the guidelines laid down in the Declaration of Helsinki and all procedures involving human subjects were approved by the University of Minnesota Institutional Review Board. Written informed consent was obtained from all participants.
Supplementary material
To view supplementary material for this article, please visit http://dx.doi.org/10.1017/S1368980015002116


