




Policy Significance Statement
As sustainability becomes more and more important for consumers, investors, and policymakers, corporations face increased incentives to exaggerate their sustainability efforts through greenwashing. Such practices threaten transparency and accountability, potentially misleading different stakeholders and undermining policy objectives. To address this, we introduce the greenwashing tendency score (GTS), an objective and scalable measure that evaluates the authenticity of corporate sustainability communications using natural language processing (NLP) techniques. Policymakers and regulators can utilize the GTS to continuously monitor greenwashing trends, measure the effectiveness of sustainability regulations, and detect emerging anomalies across, for example, companies, industries, or geographical regions. The implementation of the GTS supports informed policymaking, enhances corporate accountability, and promotes genuine sustainability practices by ensuring sustainability claims align with actual environmental and social impact.
1. Introduction
The fight against climate change faces several hard-to-overcome obstacles and is in dire need of large amounts of capital (IPCC, 2022; UNFCCC, 2024). Although governments and other public entities worldwide are investing heavily in sustainable projects, public funding alone is insufficient to provide the necessary investments (Bhandary, Reference Bhandary2022; UN, 2023). Consequently, the concept of sustainable finance has emerged to direct more capital toward companies and projects that are committed to creating positive, instead of negative, impact on the environment and society (Fatemi and Fooladi, Reference Fatemi and Fooladi2013).
To allocate these funds effectively, sustainability-conscious consumers and investors must be able to differentiate between products, projects and businesses in general that align with their sustainability goals and the ones that do not. Companies, on the other hand, have various incentives to portray their sustainability performance more positively than it actually is (Delmas and Burbano, Reference Delmas and Burbano2011; Lyon and Montgomery, Reference Lyon and Montgomery2015), a phenomenon widely known as greenwashing. This results in a typical principal-agent problem between sustainable investors and capital-seeking, profit-oriented companies (Eisenhardt, Reference Eisenhardt1989; Kimmerle, Reference Kimmerle2019; Ghitti et al., Reference Ghitti, Gianfrate and Palma2023).
Greenwashing has also become a major obstacle in the fight against climate change, as it is now a widespread phenomenon (Montgomery et al., Reference Montgomery, Lyon and Barg2023). In 2021, the European Commission released a report that screened websites of consumer products and found false or deceptive sustainability claims in 42% of cases (EC, 2021). In Europe and the Americas, the number of greenwashing cases in the banking and financial services sector rose by 70% between 2022 and 2023 (RepRisk, 2023). Although these reports mainly focus on greenwashing at the product level, primarily concerning consumers, investors are also affected by corporate greenwashing.
In recent years, it has become standard practice to incorporate environmental, social, and governance (ESG) factors into investment decisions (Amel-Zadeh and Serafeim, Reference Amel-Zadeh and Serafeim2018; Krueger et al., Reference Krueger, Sautner and Starks2020), underscoring the importance of reliable sustainability reporting for this stakeholder group as well. The motives behind this practice range from moral and ethical considerations to purely financial reasons (Krueger et al., Reference Krueger, Sautner and Starks2020). Regardless of the motive, greenwashing can harm investors by violating their trust, damaging their reputation, and causing severe financial losses. A notable example is the Volkswagen diesel scandal, which resulted in significant financial and reputational costs for the company, and consequently, its shareholders (Barth et al., Reference Barth, Eckert, Gatzert and Scholz2022). Volkswagen’s misconduct even adversely affected the stock prices of other car manufacturers, thereby financially harming their shareholders as well (Trefis, 2015; Barth et al., Reference Barth, Eckert, Gatzert and Scholz2022). Greenwashing undermines trust among consumers and investors, hindering the efficient allocation of capital toward sustainable companies and projects, which is essential for the transition towards a more sustainable economy (Wang et al., Reference Wang, Ma and Bai2020; Yang et al., Reference Yang, Nguyen, Nguyen, Nguyen and Cao2020; Gatti et al., Reference Gatti, Pizzetti and Seele2021).
It is therefore unsurprising that regulatory bodies are increasingly tackling the issue of greenwashing. At the European Union (EU) level, the European Parliament has recently introduced legislation aimed at curbing greenwashing in product marketing, prohibiting unsubstantiated environmental claims and requiring the use of certified labels and verifiable sustainability information (EP, 2024). In parallel, several national authorities have issued country-specific guidelines, including those in the Netherlands, France, the United Kingdom, and the United States (FTC, 2012; ACM, 2023; ADEME, 2023; CMA, 2024; FCA, 2024).
However, enforcing these guidelines remains challenging due to several factors, including limited complaints reaching supervisory authorities, inadequate data accessibility and comparability, restraints on resources and expertise for detection, and unclear or ambiguous definitions (ESMA, 2024). Particularly for the financial sector, Colaert and De Houwer (Reference Colaert and De Houwer2025) highlighted the lack of adequate legal tools, for both national and EU supervisors, to detect and sanction greenwashing behavior. In response, this article proposed an objective, text-based analytical tool to quantify greenwashing tendencies in corporate sustainability reporting, enhancing regulators’ capability to monitor compliance and enforce greenwashing guidelines effectively.
A key advantage of our proposed approach lies in its high potential for automation—an essential feature given the pervasive nature of greenwashing and its far-reaching consequences. Automated detection systems are increasingly vital for supporting investors, consumers, and litigators in identifying and addressing deceptive sustainability claims. Nevertheless, several challenges make the reliable detection of greenwashing particularly difficult.
First, there is no universally accepted definition of greenwashing (de Freitas Netto et al., Reference de Freitas Netto, Sobral, Ribeiro and da Luz Soares2020; Nemes et al., Reference Nemes, Scanlan, Smith, Smith, Aronczyk, Hill, Lewis, Montgomery, Tubiello and Stabinsky2022). Although most definitions agree that greenwashing involves a discrepancy between an entity’s actual sustainability performance and its exaggeratedly positive communication, the specific manifestations of greenwashing typically vary across four dimensions. While most scholars restrict greenwashing to environmental claims (Ramus and Montiel, Reference Ramus and Montiel2005; Delmas and Burbano, Reference Delmas and Burbano2011), others also consider, for example, social performance (Lyon and Maxwell, Reference Lyon and Maxwell2011). Another distinction lies in whether greenwashing requires intentional deception (Ramus and Montiel, Reference Ramus and Montiel2005; Bowen and Aragon-Correa, Reference Bowen and Aragon-Correa2014) or if intention is not a necessary prerequisite (Delmas and Burbano, Reference Delmas and Burbano2011; Walker and Wan, Reference Walker and Wan2012). Additionally, some definitions specify that greenwashing refers to companies (Delmas and Burbano, Reference Delmas and Burbano2011), while others apply the term more broadly to any organization (Lyon and Montgomery, Reference Lyon and Montgomery2015). Furthermore, greenwashing can be differentiated based on whether it occurs at the product level or the organizational level (Delmas and Burbano, Reference Delmas and Burbano2011; de Freitas Netto et al., Reference de Freitas Netto, Sobral, Ribeiro and da Luz Soares2020).
Second, greenwashing manifests through diverse methods, necessitating varied detection approaches, especially between textual and visual forms (TerraChoice, 2010; Lyon and Montgomery, Reference Lyon and Montgomery2015; Siano et al., Reference Siano, Vollero, Conte and Amabile2017; de Freitas Netto et al., Reference de Freitas Netto, Sobral, Ribeiro and da Luz Soares2020).
Finally, and in part due to the aforementioned challenges, there are limited data available on greenwashing (Oppong-Tawiah and Webster, Reference Oppong-Tawiah and Webster2023). This scarcity of data hinders the applicability of some of the data-driven approaches, such as supervised machine learning methods, which are commonly used in related fields like fake news detection (Shu et al., Reference Shu, Sliva, Wang, Tang and Liu2017; Ozbay and Alatas, Reference Ozbay and Alatas2020).
Consequently, most public exposures to greenwashing still arise from manual investigations, often conducted by journalists (Guardian, 2023) or NGOs (EC, 2024), or are discovered incidentally during unrelated investigations (Glinton, Reference Glinton2015). However, these efforts typically expose only the more severe and clearly illegal instances of greenwashing, leaving the subtler and often legally permissible cases underinvestigated.
In this study, we develop an approach designed to detect not only overt instances of greenwashing but also more subtle and pervasive forms employed by organizations. For the purposes of our analysis, we define greenwashing as a discrepancy between an entity’s (overly positive) communication of its sustainability performance and its actual performance. This deliberately broad definition synthesizes key elements from existing definitions in the literature. It is intentionally inclusive, avoiding restrictive criteria such as entity type, sustainability dimension, or intent—though these may be specified where relevant for specific applications. We define sustainability in line with the Brundtland understanding of sustainable development, namely, “development that meets the needs of the present without compromising the ability of future generations to meet their own needs” (Brundtland, Reference Brundtland1987). In our context, this encompasses all three ESG dimensions.
To quantify the components of this greenwashing definition, we employ natural language processing techniques, specifically sentiment analysis on companies’ sustainability reports and alignment analysis between these reports and the UN’s Sustainable Development Goals (SDGs), to asses the companies’ communications. We then contrast these assessments with ESG ratings from a third-party data provider, which serve as a proxy for actual sustainability performance. This method is applied to 36 companies within the German stock index (DAX) from 2020 to 2022.
While we are confident in the measure that we have developed, we deliberately named the resulting indicator the Greenwashing Tendency Score (GTS). The primary reason is that these scores are meaningful only in comparison to each other. For instance, a company with a GTS of 1.5 cannot be interpreted in isolation. It requires context, such as another company having a GTS of 1.0 or the sample mean being 1.2. As such, the GTS does not support absolute judgments about the level of greenwashing since the baseline level within the sample may be either very low or very high. Emphasizing this property of the GTS is particularly important given that even genuinely sustainable companies sometimes hesitate to communicate their achievements for fear of unjustified greenwashing accusations (Lyon and Montgomery, Reference Lyon and Montgomery2015; Gatti et al., Reference Gatti, Pizzetti and Seele2021). Thus, we explicitly emphasize that the GTS indicates tendencies rather than definitive accusations of greenwashing. Although anonymizing the results could mitigate concerns, we have opted for transparency to promote reproducibility and enable meaningful comparisons in future research on greenwashing.
The remainder of this article proceeds as follows: We first review existing greenwashing detection approaches and relevant literature. Next, we describe our methodology and the data sources used in detail. We then present our empirical findings in Section 4, followed by a comprehensive discussion of their implications in Section 5. Subsequently, we outline how policymakers can leverage the GTS to guide policy development and enhance enforcement through data-driven approaches. The article concludes by summarizing our key findings, addressing the study’s limitations, and suggesting directions for future research.
2. Related work
In the following, we provide an overview of existing approaches to greenwashing detection in the literature. We then examine examples of current policies and guidelines aimed at addressing greenwashing, before concluding this section with a review of existing enforcement mechanisms that support the implementation of these policies.
2.1. Greenwashing detection
While there is considerable literature on the concept of greenwashing and its various forms (e.g., Lyon and Montgomery, Reference Lyon and Montgomery2015; Seele and Gatti, Reference Seele and Gatti2017; de Freitas Netto et al., Reference de Freitas Netto, Sobral, Ribeiro and da Luz Soares2020; Gatti et al., Reference Gatti, Pizzetti and Seele2021), the (automated) greenwashing detection literature is still in its infancy (Moodaley and Telukdarie, Reference Moodaley and Telukdarie2023). One of the earlier works in this field is by Aggarwal and Kadyan (Reference Aggarwal and Kadyan2014), where the authors manually scored 40 companies based on different greenwashing criteria in their advertisements, websites, or sustainability reports, and then compared these scores to their Corporate Social Responsibility score. Although the authors followed a systematic approach, the manual method has inherent disadvantages introduced by the human element, that is, subjectivity involved in the scoring and assessment of possible greenwashing claims (Aggarwal and Kadyan, Reference Aggarwal and Kadyan2014), and the potential for errors that may result in missing certain claims in the companies’ communication (Zhou et al., Reference Zhou, Burgoon, Twitchell, Qin and Nunamaker2004). Finally, the manual approach is time-consuming and labor-intensive, which limits its scalability. More recently, Oppong-Tawiah and Webster (Reference Oppong-Tawiah and Webster2023) developed a promising method of detecting greenwashing via linguistic cues, inspired by the fake news detection literature. They also show that there is a relation between greenwashing and financial performance, further emphasizing the importance of uncovering organizations’ greenwashing tendencies. Their method has the advantage of not requiring a ground truth or extensive manual work, such as annotations, thereby significantly reducing potential subjectivity and scaling obstacles. Oppong-Tawiah and Webster (Reference Oppong-Tawiah and Webster2023) use linguistic cues in Twitter posts, but they also encourage future research to, inter alia, investigate content-based methods and other media. In this regard, we follow their recommendation by utilizing content-based alignment scores and the more formal medium of sustainability reports.
We identified only a few additional approaches to automated greenwashing detection. Vinella et al. (Reference Vinella, Capetz, Pattichis, Chance and Ghosh2023) created a binary classifier using self-specified greenwashing characteristics and a variation of the climateBERT model (Webersinke et al., Reference Webersinke, Kraus, Bingler and Leippold2021). A Swiss company developed an approach that compares the sentiment of forward- and backward-looking news reports about a company, attributing a high greenwashing risk when the forward-looking sentiment is higher compared to the backward-looking sentiment (Mach and Rochat, Reference Mach and Rochat2022). Finally, there was a related shared task at the SwissText 2023 conference that was also aimed at greenwashing detection. They compare sentiment analysis of internal documents (i.e., sustainability reports) with the sentiments of external documents (e.g., media reports) in a first step while repeating the same for SDG alignment in a subsequent step (Contessotto et al., Reference Contessotto, Giger and Reichmuth2023).
2.2. Sustainability policies and guidelines
Different guidelines for sustainability marketing emphasize transparency, accuracy, and substantiation of environmental claims to prevent greenwashing. At the global level, the ISO 14021 standard and ICC Advertising Code require companies to provide clear, verifiable, and relevant sustainability claims, discouraging vague terms like “eco-friendly” without proof (Klintman, Reference Klintman2016). The OECD Guidelines for Multinational Enterprises and the UN Global Compact further promote ethical sustainability communication, encouraging businesses to align their marketing with responsible environmental practices (Carlsson and Nevzorova, Reference Carlsson and Nevzorova2025).
In the EU, the Unfair Commercial Practices Directive prohibits misleading green claims, while the Corporate Sustainability Reporting Directive (CSRD) mandates transparent reporting on environmental impacts (Carlsson and Nevzorova, Reference Carlsson and Nevzorova2025). The Green Claims Directive that has been adopted in March 2023 tightened requirements by demanding scientific evidence for sustainability statements (Carlsson and Nevzorova, Reference Carlsson and Nevzorova2025). Additionally, at the national level, countries, such as Germany, France, the Netherlands, and the United Kingdom, have further regulations against greenwashing. Germany’s UWG (“law against unfair competition”) bans deceptive environmental marketing. However, it is also part of a heated debate since it rivals in some points the free competition law (Këllezi et al., Reference Këllezi, Kobel and Kilpatrick2024). France’s antiwaste law (MTE, 2020) for a circular economy mandates proof for terms like “biodegradable,” including 50 measures with new obligations, prohibitions and tools to better monitor and sanction offenses against these regulations. The Netherlands’ ACM guidelines outline five key principles for truthful sustainability claims (ACM, 2023). Meanwhile, the United Kingdom’s Green Claims Code actively investigates and enforces false green advertising claims for businesses of all sizes, defining green claims as statements about a product being recyclable, made from recycled materials, or having a lower carbon footprint (Bradley, Reference Bradley2011).
Despite these initiatives, the diverse forms and tactics of greenwashing continue to pose substantial challenges to fostering a culture of transparent and accurate sustainability reporting. A related trend, known as “greenhushing,” involves companies deliberately underreporting or downplaying their sustainability efforts to avoid scrutiny, criticism, or accusations of greenwashing (Gatti et al., Reference Gatti2024). Consequently, the effectiveness of greenwashing regulations depends heavily on the development and implementation of robust enforcement and monitoring mechanisms.
2.3. Enforcement mechanisms
The enforcement of sustainability marketing guidelines depends heavily on verification and auditing mechanisms to ensure that environmental claims made by companies are credible. Third-party certifications—such as ISO 14021 (Klintman, Reference Klintman2016), the EU Ecolabel (Cordella et al., Reference Cordella, Alfieri, Sanfelix, Donatello, Kaps and Wolf2020), Fair Trade programs (Ribeiro-Duthie et al., Reference Ribeiro-Duthie, Gale and Murphy-Gregory2021), and Cradle to Cradle certification (Hoang and Böckel, Reference Hoang and Böckel2024)—provide measurable benchmarks for manufacturing processes and product life cycles. However, these certifications still require independent and often manual verification processes to maintain integrity. Regulatory bodies at both national and international levels actively monitor compliance and enforce penalties against violators. For instance, the United Kingdom’s Competition and Markets Authority and the European Commission have imposed fines on car manufacturers for colluding to restrict competition in advertising their vehicles’ environmental performance (Goodley, Reference Goodley2025). In the United States, the Securities and Exchange Commission has fined DWS, a subsidiary of Deutsche Bank, $25 million (U.S. Securities and Exchange Commission, 2023), and Goldman Sachs Asset Management $4 million (U.S. Securities and Exchange Commission, 2022), following audits that uncovered inconsistencies in their ESG investment claims.
Compliance reporting and transparency are crucial in measuring sustainability claims. Under the CSRD (Hummel and Jobst, Reference Hummel and Jobst2024), large EU companies must publish standardized reports annually, detailing CO2 emissions, energy consumption, and waste reduction (EFRAG, 2025). For the financial sector, further metrics are mandated, such as reporting of climate-related financial risks, green and sustainable finance metrics, exposure to high-carbon industries, integration of ESG factors in risk management and lending, and sustainable investment strategies adopted, among others. Additionally, lifecycle assessments (LCA) scientifically evaluate environmental impacts, ensuring claims like “carbon neutral” or “biodegradable” are data-backed for the construction industry (Dervishaj and Gudmundsson, Reference Dervishaj and Gudmundsson2024). On the basis of such assessments, claims have been filed by third parties and individuals. For instance, KLM in the Netherlands faced legal action after failing to substantiate claims about CO2 compensation and sustainable aviation fuels, showing how reporting mechanisms help detect misleading claims (ClientEarth, 2025).
Complaint-based monitoring continues to play a significant role in the enforcement of sustainability reporting. Consumer complaints frequently serve as the initial trigger for investigations into potentially misleading environmental claims. For example, Nestlé, Coca-Cola, and Danone have all come under legal scrutiny after environmental groups challenged their use of the term “100% recycled” in bottle labeling—prompting full supply chain audits to verify the accuracy of their claims (Jakubavičius and Burinskien˙e, Reference Jakubavičius and Burinskien˙e2024). This case highlights the critical role of consumer advocacy in complementing regulatory oversight to hold companies accountable for deceptive sustainability marketing.
However, these examples also highlight that much of the greenwashing litigation and enforcement of authentic sustainability communication has relied on manual investigations, typically targeting high-profile cases involving well-known companies. As a result, more subtle instances of greenwashing, particularly those involving smaller companies that attract less media and regulatory attention, often remain overlooked.
To improve enforcement in these areas, automated and AI-based monitoring methods have also been proposed to aid in tracking greenwashing at scale. Previous research has laid out frameworks for the use of AI-powered tools to scan company websites, ads, and packaging for misleading claims (Hacker, Reference Hacker2024). Other scholars compare sustainability statements across sectors (cosmetics and electronics) to identify generalizability of automatic greenwashing detection approaches (Woloszyn et al., Reference Woloszyn, Kobti and Schmitt2021). Australia’s Active Super was fined $10.5 million in 2025 for misrepresenting its ethical investment strategy, proving how AI-driven investigations can uncover deceptive marketing tactics. Active Super’s greenwashing practices were detected through an investigation by the Australian Securities and Investments Commission by scrutinizing marketing materials, website content, and disclosure documents from February 2021 to June 2023, uncovering discrepancies between the fund’s stated investment exclusions and its actual holdings (Investment Magazine, 2024). These digital tools are early examples of how data can be leveraged to enhance regulatory oversight and deter companies from making unverified environmental claims.
Our proposed method offers a straightforward and scalable approach for detecting greenwashing tendencies, requiring only that companies publish some form of sustainability report and that their sustainability performance is assessed by a third-party data provider. As such, it can function as a first layer of broad-based greenwashing detection, flagging potentially conspicuous cases for more in-depth investigation—either manually or through the use of more targeted analytical tools.
3. Method and data
We developed our methodology based on our aforementioned definition of greenwashing that builds on the intersection of already existing concepts of greenwashing in the literature. To quantify the key components of greenwashing, we identify variables that capture both how companies communicate their sustainability efforts and how they actually perform in terms of sustainability.
For the latter, we use ESG ratings from a third-party data provider (LSEG, formerly Refinitiv). We use the LSEG score because it provides consistent coverage for our full sample and is widely used in sustainable finance research (Avramov et al., Reference Avramov, Cheng, Lioui and Tarelli2022; Bauer et al., Reference Bauer, Huber, Rudebusch and Wilms2022; Alves et al., Reference Alves, Krüger and Dijk2025). Moreover, it is performance-oriented, drawing on reported policies, outcomes, and impacts rather than focusing on ESG-related financial risk exposure. Given well-documented divergence across ESG rating providers (Berg et al., Reference Berg, Fabisik, Sautner, Albuquerque, Berg, Fahlenbrach, Koskinen, Liang, Malloy, Moreau, Rockinger, Seru, Schnitzler and Zhang2020, Reference Berg, Kölbel and Rigobon2022), we do not treat this score as ground truth. Instead, it serves as one transparent external proxy within our relative framework. The LSEG ESG score is built in a hierarchical pillar structure. The overall score is built up from the environmental, social and governance pillars, each of which again comprises subscores, such as “Resource Use,” “Emissions,” and “Innovation” for the environmental pillar. It is also worth noting that the weighting of these categories is subject to each companies’ industry. Companies are thus rated relative to their peers (for details on the LSEG ESG methodology, please refer https://www.lseg.com/en/data-analytics/sustainable-finance/esg-scores#methodology). The hierarchical structure aligns well with the modular design of our approach (e.g., matching selected ESG dimensions to subsets of SDGs where an application calls for it). Although external media outlets might be a viable alternative to ESG scores and are used in related studies (Mach and Rochat, Reference Mach and Rochat2022; Contessotto et al., Reference Contessotto, Giger and Reichmuth2023), their coverage often exhibits biases, such as favoring advertisers (Ellman and Germano, Reference Ellman and Germano2009; Blasco and Sobbrio, Reference Blasco and Sobbrio2012; Beattie et al., Reference Beattie, Durante, Knight and Sen2021), larger companies (Fang and Peress, Reference Fang and Peress2009; Nokelainen and Kanniainen, Reference Nokelainen and Kanniainen2018), or salient industries during crises (Jonkman et al., Reference Jonkman, Trilling, Verhoeven and Vliegenthart2018).
For the assessment of the organizations’ communications, we use two different data sources and indicators, and our sample consists of the DAX companies for the years of 2020, 2021, and 2022. We focus on Germany as the EU’s largest economy and as representative of the European business system (Chen and Bouvain, Reference Chen and Bouvain2009). We then use the DAX as the main German equity index ( $ \approx $
80% of market capitalization). The final sample comprises 36 firms because complete sustainability reports were not available for four constituents in all years. While the pipeline is highly automated once reports are available, report collection itself remains largely manual because we are not aware of any open-source repository that provides sustainability reports at scale yet. Increasing reporting standardization and obligations (e.g., CSRD) should ease this constraint going forward. We downloaded the companies’ sustainability reports from their websites, in a few cases where this was not possible, we requested them via email or extracted corresponding sustainability-related parts from annual reports. For some companies (Daimler Truck, Porsche AG, Porsche Automobil Holding SE and Siemens Healthineers), we were unable to obtain reports for every year; thus, we excluded them from our analysis. Sustainability reports are likely the most formal and comprehensive communication of a company’s organization-wide (compared to the product level) sustainability efforts that is currently publicly available. In this regard, they differ from more informal and targeted forms of communication such as social media posts or advertisements and are thus more suitable for assessing a company’s overall greenwashing tendencies. Sustainability reports currently constrain full automation of our approach. To our knowledge, there is no reliable open database for systematically downloading sustainability reports in bulk, so we collected them manually.
$ \approx $
80% of market capitalization). The final sample comprises 36 firms because complete sustainability reports were not available for four constituents in all years. While the pipeline is highly automated once reports are available, report collection itself remains largely manual because we are not aware of any open-source repository that provides sustainability reports at scale yet. Increasing reporting standardization and obligations (e.g., CSRD) should ease this constraint going forward. We downloaded the companies’ sustainability reports from their websites, in a few cases where this was not possible, we requested them via email or extracted corresponding sustainability-related parts from annual reports. For some companies (Daimler Truck, Porsche AG, Porsche Automobil Holding SE and Siemens Healthineers), we were unable to obtain reports for every year; thus, we excluded them from our analysis. Sustainability reports are likely the most formal and comprehensive communication of a company’s organization-wide (compared to the product level) sustainability efforts that is currently publicly available. In this regard, they differ from more informal and targeted forms of communication such as social media posts or advertisements and are thus more suitable for assessing a company’s overall greenwashing tendencies. Sustainability reports currently constrain full automation of our approach. To our knowledge, there is no reliable open database for systematically downloading sustainability reports in bulk, so we collected them manually.
The second source is the description of the SDGs (UN, 2015). The SDGs are widely accepted international guidelines that cover a broad range of sustainability issues, including environmental, social, and governmental goals, and are often used as a benchmark (Pattberg and Widerberg, Reference Pattberg and Widerberg2016; Stevens and Kanie, Reference Stevens and Kanie2016; Elalfy et al., Reference Elalfy, Weber and Geobey2020). Additionally, investors who aim to make a positive impact also utilize the SDGs to guide their sustainable investments (Bauer et al., Reference Bauer, Ruof and Smeets2021; Paetzold et al., Reference Paetzold, Busch, Utz and Kellers2022), demonstrating their relevance for this particular stakeholder group. Therefore, we use the SDGs as an objective and comprehensive framework for sustainability to facilitate our content comparisons.
Not all SDGs are equally relevant for all firms, we therefore interpret SDG alignment as a broad content-breadth proxy rather than an expectation that every report must address every goal. The framework is modular and can be restricted to subsets of SDGs (e.g., industry materiality or a specific policy focus). Importantly, we are conservative with respect to not mentioning. Omitting a goal would receive a lower GTS than mentioning it expansively with positive narratives. We considered alternatives (e.g., keyword-based ESG dictionaries, binary SDG disclosure indicators, and external-media benchmarks) but opted for SDGs due to their broad ESG coverage and increasing integration into reporting practice (Heras-Saizarbitoria et al., Reference Heras-Saizarbitoria, Urbieta and Boiral2022).
Our first communications indicator, similar to some related studies (Mach and Rochat, Reference Mach and Rochat2022; Contessotto et al., Reference Contessotto, Giger and Reichmuth2023; Vinella et al., Reference Vinella, Capetz, Pattichis, Chance and Ghosh2023), is sentiment analysis which we use to capture the tone and emphasis of the companies’ sustainability reports. Sentiment and SDG alignment do not directly measure the outcomes, impacts, or targets of a firm’s sustainability efforts, nor is this the aim of the GTS. Rather, the GTS aims to approximate how a human reader would perceive the tone and topical breadth of a report: whether the narrative is comparatively neutral and factual versus optimistic or ostentatious, and how expansively it presents sustainability relevance. For example, “We reduced our carbon emissions by 50,000 tons” and “We made great progress by reducing our carbon emissions by 50,000 tons” convey the same fact, but differ clearly in tone.
Concern-focused statements, for example, “climate change is a critical issue,” can score as negative. We interpret them as typically signaling awareness rather than sustainability effort itself. In practice, communicating strong performance or ambition usually requires positively framed statements about actions, initiatives, or progress. Thus, a report that is dominated by expressions of concern without corresponding actions or ambitions would likely be interpreted by readers as weak or negative communication as well, which is consistent with how our sentiment measure operates. Finally, the GTS is a relative indicator for comparisons across firms facing similar reporting incentives, thus, limitations of sentiment and alignment apply broadly and symmetrically across the sample. The GTS therefore does not penalize poor outcomes per se but flags comparatively more positive or expansive communication given similar levels of externally assessed sustainability performance, so more neutral or cautious reporting lowers the GTS and is interpreted as less indicative of greenwashing.
To increase the reliability of the results, we first apply multiple text preprocessing methods. We start by normalizing the texts as much as possible. We transformed all texts to lowercase and removed diacritics, extra whitespace, URLs, named entities, and contact details (e.g., email addresses and phone numbers). Furthermore, we expanded abbreviations and contractions. We then use the Natural Language Toolkit (Bird et al., Reference Bird, Klein and Loper2009) to perform tokenization, lemmatization, part-of-speech tagging and removal of stop words. After these preprocessing steps, we apply the widely recognized VADER (Hutto and Gilbert, Reference Hutto and Gilbert2014) sentiment analysis model at the sentence level. Although VADER was originally developed for analyzing sentiment in social media texts, its effectiveness has also been demonstrated in more formal and extended text formats, such as news articles (Castellanos et al., Reference Castellanos, Xie and Brenner2021), making it a suitable choice for our analysis of corporate sustainability reports.
To validate our sentiment component in the specific context of sustainability reporting, we conducted two additional checks on a random sample of 100 sentences that we drew from the reports. First, four researchers independently labeled sentence sentiment in context, that is, how the sentence would be perceived in a sustainability report and how it appeared intended to convey sustainability performance. Interrater agreement, measured by Krippendorff’s $ \alpha $
, was 0.42, comparable to prior work on sentiment annotation (Mozetič and GrčarMand Smailović, Reference Mozetič and GrčarMand Smailović2016).
$ \alpha $
, was 0.42, comparable to prior work on sentiment annotation (Mozetič and GrčarMand Smailović, Reference Mozetič and GrčarMand Smailović2016).
Second, in addition to VADER, we benchmarked multiple sentiment models (We tested the following models that can be found on Hugging Face: FinBERT (yiyanghkust/finbert-tone), RoBERTa (cardiffnlp/twitter-roberta-base-sentiment-latest), GPT2 (openai-community/gpt2), BERTweetSentiment (finiteautomata/bertweet-base-sentiment-analysis), Llama (Futurix-AI/LLAMA_7B_Sentiment_Analysis_Amazon_Review_Dataset), and Qwen (Qwen/Qwen2.5-32B-Instruct). We also prompted ChatGPT 5.2 to give us a sentiment score for our sample sentences.) against the human majority vote. The strongest agreement with human labels was achieved by the largest models (with ChatGPT 5.2 and Qwen 2.5 performing best), while several smaller transformer-based models and VADER performed similarly and were therefore retained as viable options. Two models were discarded as not viable because of their weak performance (GPT-2 and Llama 7B). Importantly, when computing sentiment across the full set of reports and recalculating GTS, company-year rankings were stable across all viable models: correlations against QWEN 2.5 (the best human-aligned model after GPT 5.2, which was not viable for us to use because of token restrictions) ranged from 0.72 to 0.84 (Spearman) and 0.78 to 0.87 (Pearson). Given this robustness and the steep cost differences in computing (VADER computes in 1–5 minutes on a standard laptop, whereas the QWEN 2.5 model required more than 12 hours on GPU hardware), we retain VADER for the main analysis and recommend periodically using more advanced models as validity checks when resources permit.
However, sentiment analysis alone captures only the emotional tone of a text and does not account for the relevance or substance of its content. To address this limitation, we incorporate a second measure to evaluate the content-related aspects of corporate communication. Without this additional component, two companies could receive similar greenwashing scores, even if their communication strategies differ significantly. For instance, one company might present overly positive sentiment across a wide range of sustainability topics, despite having limited actual performance, while another might also communicate positively but only in the few areas where it has verifiable achievements. Although both may exhibit similarly high sentiment scores and low ESG ratings (because they are not covering all areas of sustainability), the first case would intuitively be perceived as more misleading. This example underscores the need to account not only for tone but also for the alignment and specificity of communicated content in assessing greenwashing.
Our solution involves a second factor in the communication assessment: an alignment score that compares the content of the sustainability reports with that of the description texts of the SDGs. We employ the pretrained word embedding algorithm flax-sentence-embeddings/all_datasets_v3_mpnet-base from Hugging Face that is based on the MPNet language model (Song et al., Reference Song, Tan, Qin, Lu and Liu2020) at the sentence level. After aggregating the sentence vectors into single document vectors, we calculate their distance to the corresponding SDG vector via the popular cosine similarity measure (e.g., Lahitani et al., Reference Lahitani, Permanasari and Setiawan2016; Gunawan et al., Reference Gunawan, Sembiring and Budiman2018; Sitikhu et al., Reference Sitikhu, Pahi, Thapa and Shakya2019).
These three measures—sentiment, alignment, and ESG score—form the basis of the GTS that is calculated for each company and year. The GTS can be summarized by the following formula:
 $$ {GTS}_i=\frac{SV_i\ast {SDGA}_i}{{\left(\frac{ESGS_i}{100}\right)}^2}\ast 10 $$
With the index $ i $
representing the respective year for which the report and the ESG score are obtained,
$ i $
representing the respective year for which the report and the ESG score are obtained, $ SV $
being the computed sentiment value,
$ SV $
being the computed sentiment value, $ SDGA $
is the corresponding alignment score (cosine similarity) between the sustainability report and the SDGs, and
$ SDGA $
is the corresponding alignment score (cosine similarity) between the sustainability report and the SDGs, and $ ESGS $
is the ESG score provided by our data provider LSEG. By design, SV and SDGA can both take on values between −1 and 1, indicating a negative or positive sentiment and very low or very high alignment, respectively. However, we expect the sentiment score to be nonnegative because companies are unlikely to use negative language when talking about their own sustainability efforts. Similarly, given the prescribed common topic of sustainability, we also expect the SDGA to be nonnegative.
$ ESGS $
is the ESG score provided by our data provider LSEG. By design, SV and SDGA can both take on values between −1 and 1, indicating a negative or positive sentiment and very low or very high alignment, respectively. However, we expect the sentiment score to be nonnegative because companies are unlikely to use negative language when talking about their own sustainability efforts. Similarly, given the prescribed common topic of sustainability, we also expect the SDGA to be nonnegative.
The scale of the ESGS, on the other hand, is prescribed by the data provider and ranges from 0 to 100. Therefore, we divide these scores by 100 to align them with the scale of the numerator of the fraction. Additionally, we square the denominator to match the multiplication of the two factors in the numerator. This ensures that both communication and actual performance are equally represented in the GTS. Finally, to achieve a more convenient overall scale, we multiply by 10. As we will show in the next section, this results in GTS values that are approximately between 0.7 and 3, with higher values indicating a higher greenwashing tendency.
4. Results
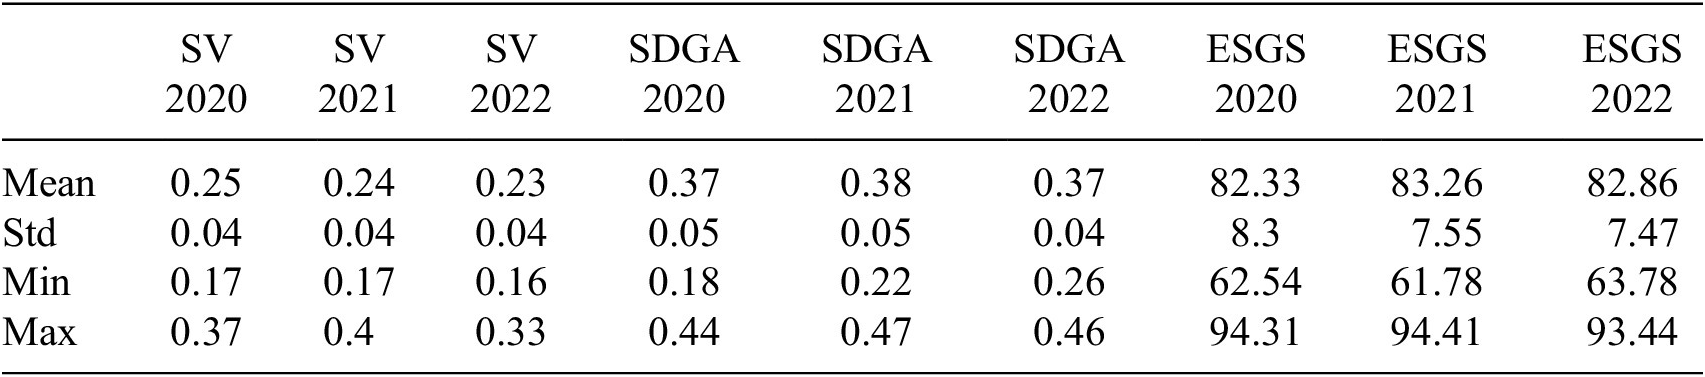
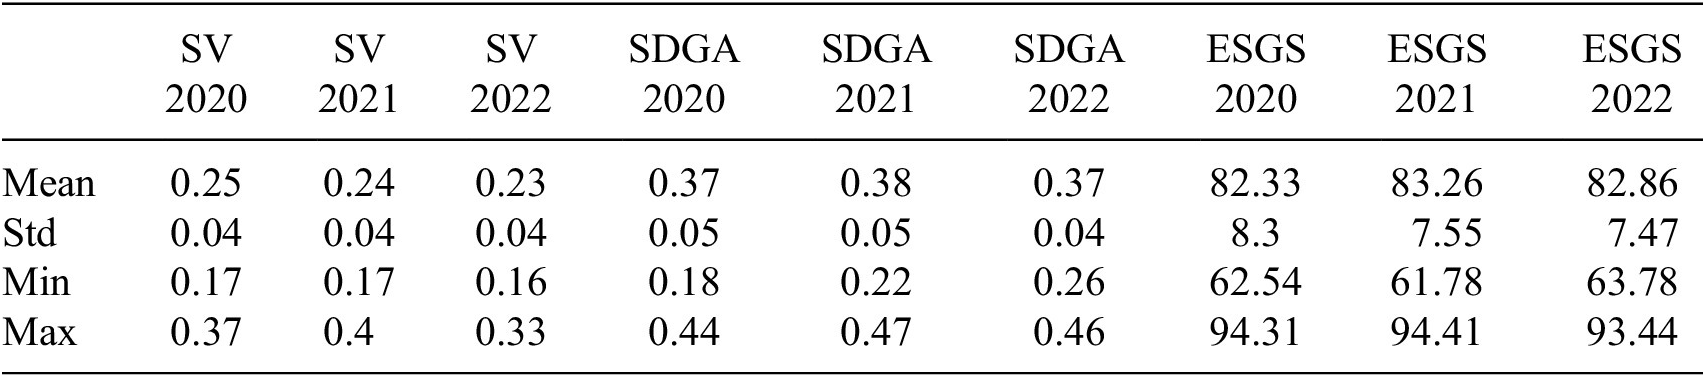
To calculate the GTS we first compute the SV, SDGA and ESGS. The summary statistics for these scores are shown in Table 1. As expected, both SV and SDGA have positive values, ranging from 0.17 to 0.4 and 0.18 to 0.47, respectively. Their means and standard deviations remain very stable over the three years, indicating no clear trends during this period. The same stability applies to the ESGS, which ranges between 62.54 and 94.41, with its means and standard deviations also remaining consistent over the considered period.
Summary statistics for the single factors of the GTS from 2020 to 2022
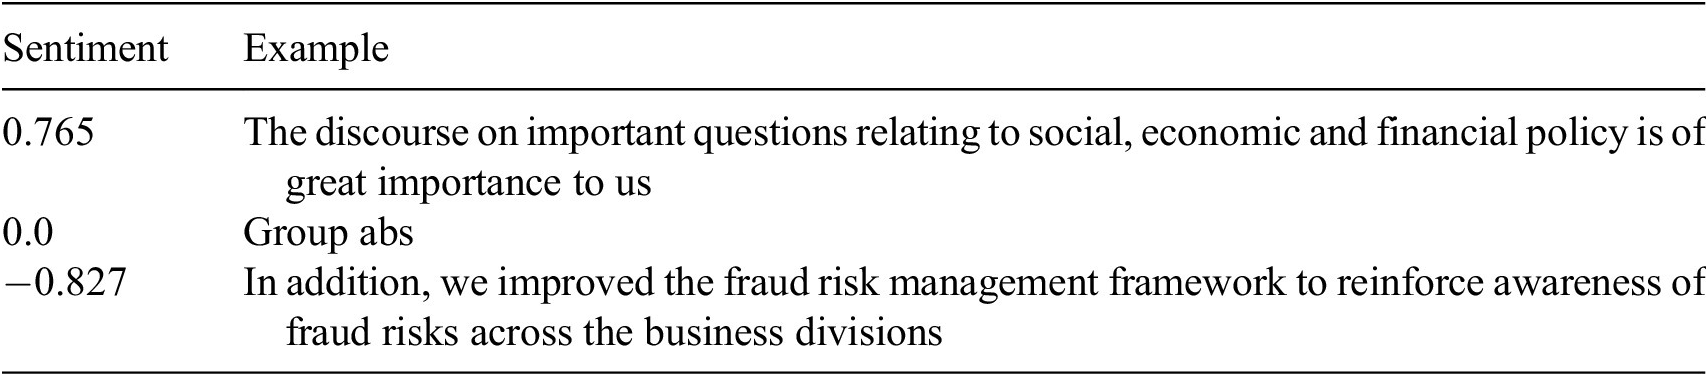
To illustrate how sentiment scores are assigned to different types of content, Table 2 presents randomly selected sentences from the top 10% most positive, negative, and neutral sentences in our 2020 dataset. The positive and neutral examples appear to be appropriately classified. Given that sustainability reports frequently include tables and figures, many of the neutral sentences are likely to be short snippets, such as labels or captions, rather than substantive narrative text, as reflected in the example provided.
Example sentences for positive, negative, and neutral sentiment
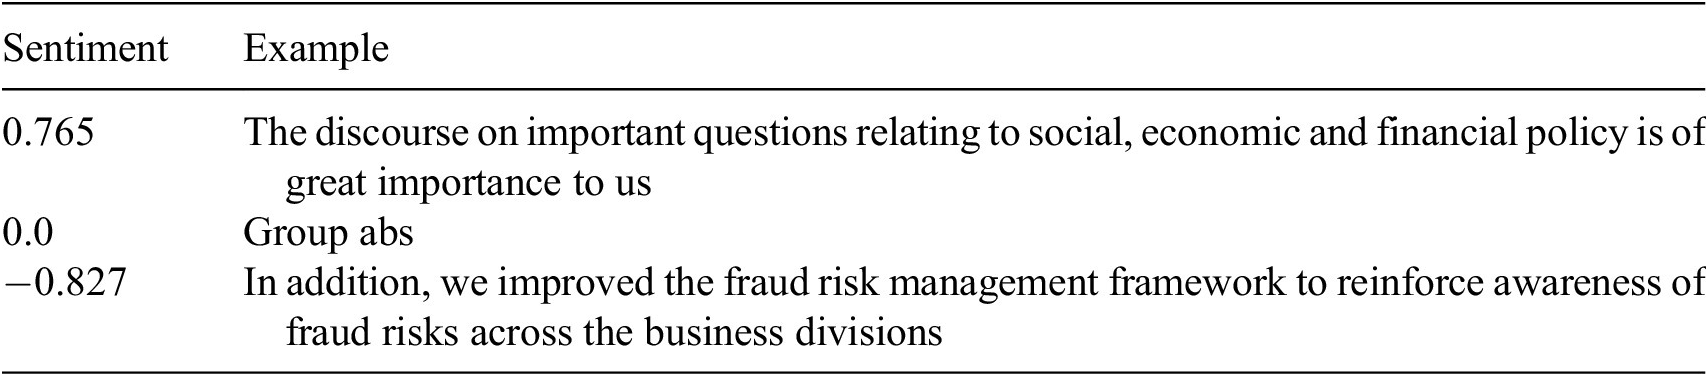
The negative example, however, appears counterintuitive since the company reports on improving their systems. Nevertheless, the prevalence of negative words such as “fraud” and “risk” makes it understandable that the algorithm assigned a negative sentiment. This is not necessarily detrimental to the company, as a more negative sentiment value will decrease the GTS. In this particular case, it could also be argued that the need to improve the “Fraud Risk Management Framework” implies the company acknowledges previous issues, making a negative assessment justified. However, we cannot generalize this interpretation to all similar cases, which is a limitation of fully automated sentiment-based assessments.
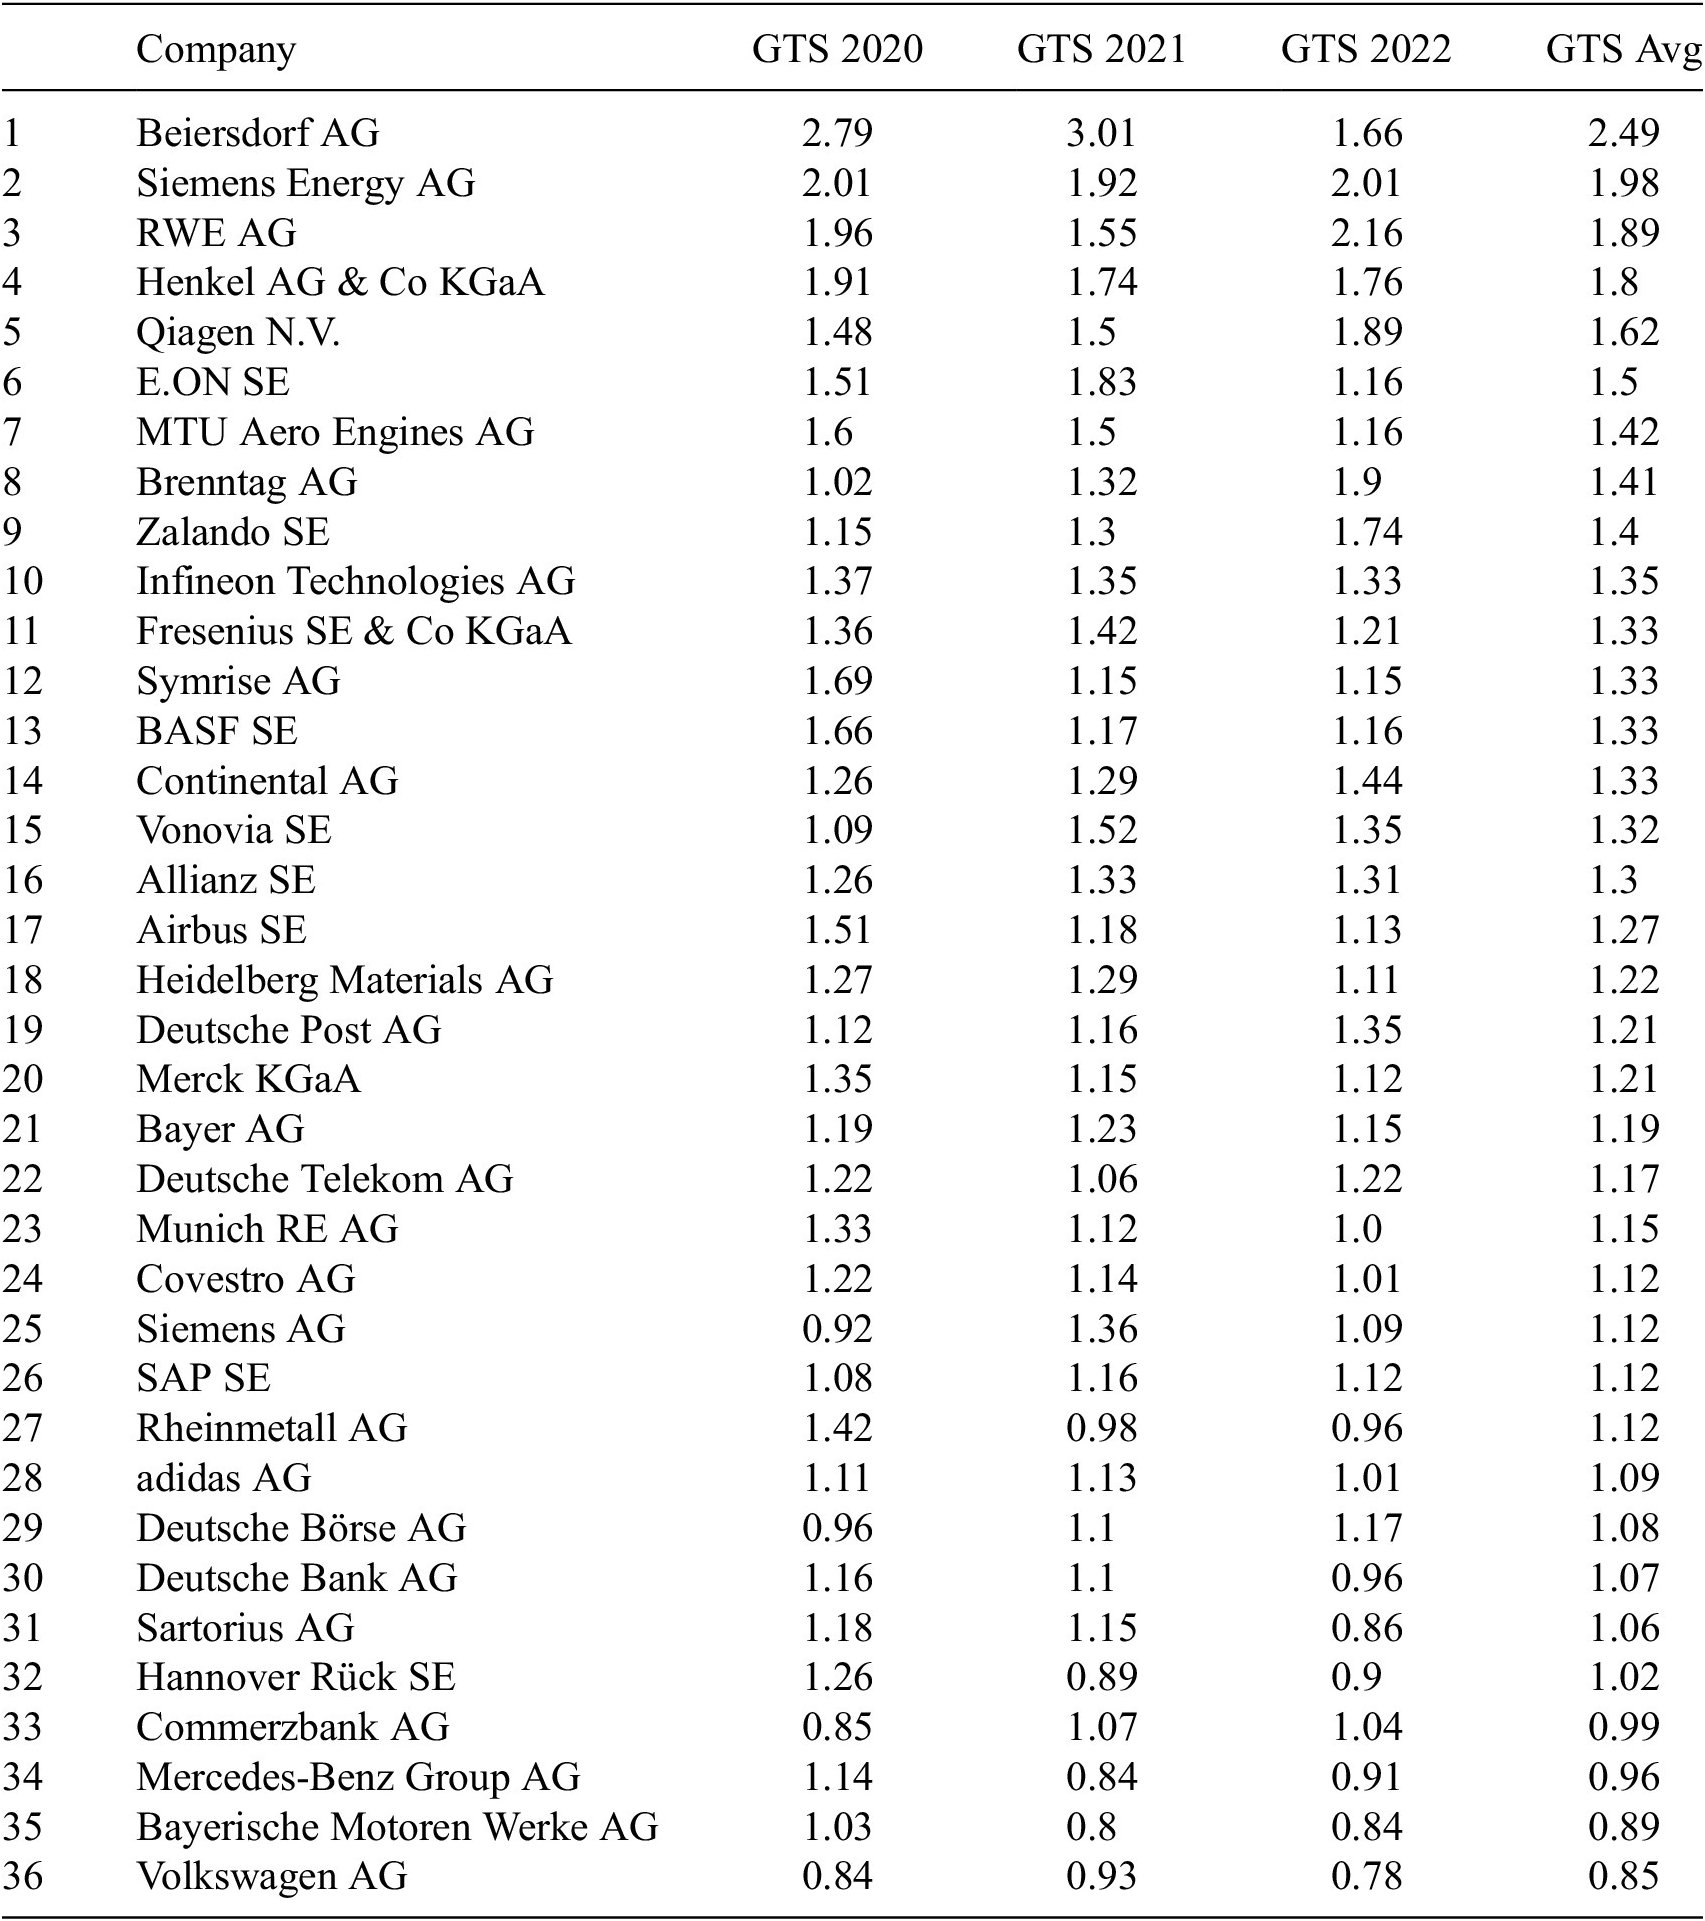
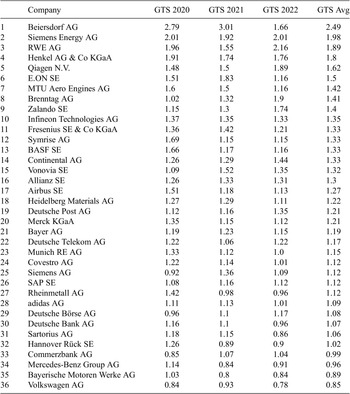
Combining the components via the GTS formula gives us the ranking shown in Table 3, with higher values indicating higher greenwashing tendency. Table 4 shows descriptive statistics on the percentage changes of the GTS and its components between 2020 and 2022. On average there is a reduction of −3.64% in GTS from 2020 to 2022, indicating a slight decrease in greenwashing tendency for the DAX companies over the three years. The standard deviation at 26.1%, however, shows considerable variation between the companies.
GTS of DAX companies from 2020 to 2022 sorted by average GTS over this period
Percentage changes of average GTS and its components between 2020 and 2022

For instance, Beiersdorf shows the largest decrease in greenwashing tendency (−27.13%) despite still having the highest GTS overall. This reduction is achieved by lowering their SV by 22.8%, their SDGA by 11.3% and an increase in ESGS over the same period of 7.27%, indicating a uniform development towards a lower greenwashing tendency. Conversely, Brenntag, which ranks eighth overall in the GTS ranking, increased their GTS from 1.02 in 2020 to 1.9 in 2022, placing it with the third-highest greenwashing tendency in that year. In their case, the change mainly stems from a steep increase of over 101% in SDGA, while SV (−5.74%) and ESGS (0.94%) changed only slightly in comparison.
Similarly, Table 5 demonstrates how the GTS captures the different aspects of greenwashing using data from three example companies in 2022. First, Qiagen, despite having an ESGS slightly above the sample mean, ranks fifth over the three years and fourth in 2022. This is due to their very positively framed communications, reflected in their SV and SDGA, which are both the second highest for 2022. In contrast, Hannover Rück is among the companies with the lowest greenwashing tendency, despite their relatively low ESGS, primarily due to their more neutral reporting. Finally, Bayer, which has the highest ESGS in 2022, only ranks in the lower midfield in terms of GTS because their communication factors also have relatively high values.
Composition of GTS using the example of three companies in 2022

5. Discussion
In this study, we developed the GTS, a novel approach to detecting greenwashing tendencies in corporate sustainability reports with a high potential for automation. Following a general definition of greenwashing, the GTS leverages the NLP techniques of sentiment and alignment analysis to contrast corporate sustainability communications with actual sustainability performance, as measured by ESG ratings.
The results show that the GTS effectively captures various aspects of greenwashing, that is, the emotional tone of sustainability communication, its relevance in terms of content and actual sustainability performance. For example, a company with a relatively weak actual sustainability performance can receive a lower GTS than a company with a comparatively strong performance, if it reports more neutrally about its efforts. However, this method also allows for a company that has the highest actual sustainability performance (measured by the ESG score) to only receive a medium rank because their reporting was also more positive than that of the other companies in the sample. It is reasonable in this situation to argue that given their surpassing actual performance, they should also be allowed to report positively about their accomplishments.
While this critique is valid, we believe that the GTS still holds significant merit. Firstly, it is a fully automated approach for detecting greenwashing tendencies once the database is established, which can potentially be scaled to a large number of companies and reporting years with minimal manual labor. Additionally, it relies solely on open-source Python packages for text processing, making it easily reproducible. Second, the GTS provides a holistic view by analyzing overall communication rather than focusing on isolated statements or advertisements. Third, while the GTS offers an initial overall indication, it is also a transparent measure that allows users to examine its components and investigate the different factors that play into it separately if necessary. Fourth, it is largely objective, as the algorithms and data used are widely recognized and have been utilized in various research projects. This approach requires no additional manual annotations or subjective decisions beyond the chosen methods. Finally, although the GTS currently focuses on sustainability in general, it can be further developed. For example, different factors can be weighted according to personal preferences (e.g., to avoid companies with very high ESGS to still receive high GTS), or the focus can be narrowed to specific sustainability issues by using only relevant SDGs and corresponding ESG subscores.
Our study contributes to the sustainable finance and greenwashing detection literature by introducing an automated, scalable, and largely objective method for indicating greenwashing tendencies in corporate sustainability communication. By using open-source software and data, we ensure that our approach is reproducible, allowing for validation and adaptation in future research. Researchers can utilize the GTS to explore the interplay between greenwashing and other corporate behaviors, such as corporate social responsibility initiatives and financial performance. Additionally, our approach and results provide a valuable reference for evaluating and comparing other greenwashing detection methods and tools, thereby fostering further innovation in this critical area.
The findings of this study also have substantial implications for practitioners in sustainable finance and the broader fight against climate change. By quantifying the discrepancy between a company’s communicated and actual sustainability performance, the GTS indicates differences between the extent to which some companies might engage in greenwashing compared to others. By pointing out these discrepancies, the GTS can help to detect greenwashing practices, thereby improving trust and integrity in the market and ensuring that investments are directed toward companies that truly adhere to sustainable practices.
More specifically, the GTS provides a valuable tool, for example, for investors, consumers, regulators, NGOs, and companies. Investors and consumers can use the GTS to identify and avoid companies that exaggerate their sustainability performance, enabling more informed and ethical investment and purchasing decisions. Regulators can adopt the GTS to monitor long-term greenwashing trends and the impact of their legislation. NGOs and activists can leverage the GTS to identify less obvious greenwashing practices and further investigate uncertain cases, thereby increasing transparency and accountability. Companies can use it to analyze their own and their competitors’ communications, improving the reliability and tone of their sustainability reporting to better match their actual performance.
While the GTS provides a constructive tool for companies seeking to increase the credibility of their sustainability reporting, it is important to acknowledge that its impact may be two-sided. On the one hand, firms committed to transparency can apply the GTS to their draft reports to identify instances of inadvertent greenwashing and adjust their messaging to more accurately reflect their actual ESG performance. On the other hand, a firm intent on presenting an exaggerated image of its sustainability efforts could potentially refine its language to lower its GTS without improving its underlying practices. Recognizing this dual possibility underscores the need for continued methodological refinement and vigilance by regulators and auditors to discourage strategic manipulation.
6. Implications for policymaking and enforcement
As we have outlined earlier, governments and regulatory bodies have acknowledged the severity of the problem and are actively working to counteract greenwashing. However, the effectiveness of these policies remains an open question, raising the need for systematic and automated monitoring and evaluation systems (Woloszyn et al., Reference Woloszyn, Kobti and Schmitt2021).
Our approach offers valuable implications for policymakers by providing a scalable and data-driven framework to analyze and monitor greenwashing trends from different perspectives. By systematically tracking the evolution of sustainability claims and evaluating their credibility over time, the GTS enables regulators to assess the effectiveness of policy interventions and identify areas where further regulation or enforcement may be needed. For instance, changes in corporate sustainability reporting can be measured in the periods immediately following the introduction of new regulations and compared to historical baselines, offering empirical insights into regulatory impact. Policymakers can also tailor the GTS for targeted assessments—if, for example, legislation addresses a specific social or environmental issue, the analysis can focus on corresponding ESG dimensions and restrict SDG alignment to relevant goals. In this way, the GTS supports more precise policy evaluation, strengthens regulatory oversight, and facilitates evidence-based decision-making in the struggle against greenwashing.
Beyond temporal analysis, our approach can be applied across industries to identify sectors particularly prone to greenwashing. At the company level, it enables the detection of abrupt or suspicious shifts in sustainability communication. For example, leveraging our automated detection pipeline, an alert mechanism could be implemented to flag firms whose GTS exhibits significant year-over-year fluctuations, warranting closer scrutiny.
In sectors such as finance—where regulatory frameworks like the EU’s Sustainable Finance Disclosure Regulation and the CSRD already mandate comprehensive sustainability reporting—the GTS offers an additional layer of analysis. It not only considers what is being reported but also how sustainability efforts are being framed. As such, it can enhance both the interpretability and enforceability of regulatory standards by identifying inconsistencies in the tone and substance of corporate sustainability communication.
7. Conclusion, limitations, and future work
This study introduces a novel, automated approach for detecting greenwashing tendencies in corporate sustainability reports through the development of the GTS. By leveraging sentiment and alignment analysis techniques in combination with ESG ratings, our method quantifies the gap between a company’s reported sustainability efforts and its actual performance. The results demonstrate significant differences in greenwashing tendencies among the investigated DAX companies, highlighting the need for more transparent and reliable sustainability reporting. Furthermore, by examining the various components of the GTS, the results help identify the drivers behind greenwashing tendencies, which vary between companies.
The GTS presents a promising tool for various stakeholders, including investors, consumers, regulators, and NGOs, to identify and address greenwashing practices. By enhancing the scalability of greenwashing detection, this approach can contribute to greater accountability and integrity in corporate sustainability communications, fostering a more trustworthy sustainable finance ecosystem.
However, the GTS is not without limitations. The model relies on the quality and availability of ESG ratings, which can be subject to biases and inconsistencies. Additionally, while effective, the sentiment and alignment analyses may not capture the full complexity of corporate communications, especially in cases where subtle greenwashing tactics are employed. Tone and reporting conventions may vary across industries, languages, and cultures, which can affect sentiment-based components even under human evaluation. Where relevant, analyses should be stratified or controlled (e.g., by region/industry), and future work should test multilingual or domain-adapted sentiment models.
Further validation and comparison to other methods are necessary to ensure the robustness of our approach. Benchmarking against a “ground truth” is currently constrained because no public, standardized database of verified greenwashing claims exists and claim classification is inherently context-specific (Calamai et al., Reference Calamai, Balalau, Guenedal, le and Suchanek2025). Comparing results across studies is also difficult because most studies do not publish company-level outputs and/or rely on closed or nonshared data. For these reasons, we frame the GTS as a tendency score and prioritize transparency to enable replication and future comparisons as shared datasets and standards emerge. Finally, the level of automation is restricted to the analytical part until now because it is difficult to acquire large numbers of sustainability reports systematically.
Future research could focus on enhancing the GTS by incorporating more sophisticated models, such as GPT-5, to improve the accuracy and depth of text analysis. Expanding the scope of the analysis to include other forms of corporate communication, such as social media posts and advertisements, could provide a more comprehensive view of a company’s greenwashing practices. Additionally, applying the GTS on a larger sample size across different industries, geographical regions and longer time periods allows for empirical studies on differences and their causes. As the number of greenwashing detection indicators and methods increases, future work should also compare the results of individual studies to ensure validity and detect potential discrepancies between methods.
Data availability statement
The datasets (Motz and Uzun, Reference Motz and Uzun2026) analyzed for this study can be found in the KITOpen Repository under https://10.35097/kksgzxd5yw37tp4u.
Acknowledgments
We acknowledge that this manuscript builds upon our study presented at the 58th Hawaii International Conference on System Sciences (see Motz et al., Reference Motz, Uzun, Hariharan and Weinhardt2025). We thank the anonymous reviewers as well as the audience of our presentation at the HICSS 58 conference for their engagement with our work and their helpful comments to further develop our study. We express our appreciation to the HICSS 58 organizers for providing a valuable platform for scholarly exchange and experience. AI tools GPT (5.2) have been used to proofread and improve the language.
Author contribution
Conceptualization: M.M., S.U.; Data Curation: M.M., S.U.; Formal Analysis: M.M., S.U.; Investigation: M.M., S.U.; Methodology: M.M., S.U.; Project administration: M.M.; Resources: C.W.; Supervision: A.H., C.W.; Writing – original draft: M.M., S.U., A.H.; Writing – review and editing: M.M., A.H.
Funding statement
This work received no specific grant from any funding agency, commercial or not-for-profit sectors.
Competing interest
The authors declare that the research was conducted in the absence of any commercial or financial relationships that could be construed as a potential conflict of interest.
Ethical standard
The research meets all ethical guidelines, including adherence to the legal requirements of the study country.



 Open access


Comments
No Comments have been published for this article.