


The majority of Americans believe in free will(Reference Nahmias, Morris and Nadelhoffer1). This concept lies at the heart of our legal system and is fundamental to many religions. Wikipedia, a reflection of a public consensus, defines free will as ‘the purported ability of rational agents to exercise control over their actions, decisions, or choices to such an extent that they can be held responsible for their selections’. Having free will means that we are ‘free’ to choose what foods and how much to eat. Consequently, we must accept personal blame for the persistent gain in body weight observed over the past 30 years referred to as the ‘obesity epidemic’. It is this myth – that we are free to choose what we eat – that is the foundation of the obesity epidemic. Only by banishing this myth will we be able to make the changes necessary to control the incessant trends towards increasing body weight.
As illustrated by the bottom curve in Fig. 1, the percentage of the US population that is obese (BMI ≥ 30·0 kg/m2) has been increasing steadily since the early 1980s(2). This increase in body weight is not limited to the USA, but is evident almost everywhere in the world where accurate anthropological records of human populations have been measured over the past 40–50 years(Reference Caballero3). The costs associated with the chronic treatment of the medical pathologies that coexist with obesity make this issue a serious societal concern.
Mean daily energy intake, uncorrected for wastage, estimated from food disappearance data (—○—) and prevalence of obesity (BMI ≥ 30·0 kg/m2; —▪—) in the USA as a function of time. Adapted from National Center for Health Statistics(2)

Is the obesity epidemic caused by a decrease in energy expenditure or an increase in energy intake?
Before arguing the role free choice plays in the obesity epidemic, it is necessary to focus on the specific behaviours responsible for this gain in body weight. An increase in body weight can only be caused by changes in very different behaviours: an increase in food intake or a decrease in energy expenditure (or a combination of the two). The predominant behaviour found to be responsible for the increasing body weight of the population will have profound economic ramifications. The idea that body weight is increasing because of a decline in energy expenditure, as argued by the restaurant industry's Center for Consumer Freedom(4) and scientists(Reference Hamilton, Hamilton and Zderic5–Reference Ravussin, Lillioja and Knowler10), is appealing because it is so intuitive. Technological advances have produced affordances such as electric toothbrushes, remote controls, moving sidewalks, and buses to transport us to and from the parking lot, all of which allow us to use less body energy to perform various daily tasks. Obtaining accurate historical records of the energy expenditure of the population over the last 40 or 50 years is difficult; some researchers have attempted to determine whether a decrease in energy expenditure can account for the increase in body mass.
Klaus Westerterp and John Speakman(Reference Westerterp and Speakman11) have provided a series of arguments suggesting that the increase in body weight is not due to a decrease in energy expenditure. Both individuals are well-recognized experts in the measurement of energy expenditure using a technique called doubly labelled water. This technique allows the safe and accurate measurement of the total energy expenditure of animals, including humans, over many days. Using published data, Westerterp and Speakman found that the amount of energy expended in daily activities, a term referred to as physical activity level (PAL), by urban-dwelling contemporary humans is not significantly different from (i) a wide variety of other mammals (when corrected for body size) or (ii) primitive, indigenous, cultures. They demonstrate that the energy expenditure of the control groups reported in studies using doubly labelled water published over the past 40 years has not shown a decline. Data from the Centers for Disease Control and Prevention confirmed Westerterp and Speakman's conclusion by demonstrating that the percentage of the US population who report they do not engage in physical activity in their leisure time has actually decreased significantly over the past 20 years(12). Other observations have supported the conclusion that a reduction in activity levels is not responsible for our increases in body weight(Reference Bruce and Katzmarzyk13–Reference Talbot, Fleg and Metter16).
Because deciding which side of the energy balance equation is responsible for the obesity epidemic has major economic ramifications, a correlation is not sufficiently convincing. It is also necessary to demonstrate that an increase in caloric intake can account for the increase in weight. Like with activity, no consistent measures of actual food intake exist across the time period when the population-level increase in body weight is observed.
The change in daily energy intake in the population can be estimated using food disappearance data. The US Department of Agriculture has been recording the amount of food produced (food disappearance) in the USA since the turn of the 19th century. The top curve in Fig. 1 is a plot of these data starting in 1960. The open circles represent the daily food energy intake estimated from food disappearance data in the USA expressed as kcal per capita and adjusted for imports and exports. Only about 70 % of the food produced is actually consumed. The rest is discarded as waste. Because food wastage has not changed considerably over time(Reference Hall, Guo and Dore17), the trend in per capita food production may be used to approximate change in actual intake. From Fig. 1, food disappearance can be divided into two linear components. One component begins in 1960 and ends in the early 1980s and the other begins around 1980 and continues until the present.
As mentioned previously, also plotted in Fig. 1 is the portion of the population considered obese, defined as having a BMI ≥ 30·0 kg/m2. Most health experts agree that a BMI of 30·0 kg/m2 represents the upper limit of a healthy weight(Reference Flegal, Graubard and Williamson18). A BMI of ≥ 30·0 kg/m2 is associated with increases in the prevalence of CVD(Reference Potier, Darcel and Tome19), stroke(Reference Strazzullo, D'Elia and Cairella20), atherosclerosis(Reference Fantuzzi and Mazzone21), hypertension(Reference Kotsis, Stabouli and Bouldin22), diabetes(Reference Kahn, Hull and Utzschneider23), arthritis(Reference Leveille, Wee and Iezzoni24) and several cancers(Reference Pischon, Nothlings and Boeing25). Just as with the food disappearance data, the obesity data can be divided into two linear components – one beginning in 1960 and ending around 1980 and the other continuing from 1980. These two lines change course at approximately the same point in time (early 1980s). The corresponding increase in intake and increase in the prevalence of obesity provide strong evidence that the increase in obesity and body weight seen in the US population is more closely associated with an increase in energy intake rather than a decrease in energy expenditure.
How much has intake increased?
Is the increase in food intake, as reflected by the food disappearance data, sufficient to explain the observed increase in body weight? The increase in food intake can be estimated from the slope of the food disappearance data displayed in Fig. 1. The value is about 125 kJ (30 kcal)/d per year – a value so small it would be barely detectable with current methods of measuring daily intake. Another way to estimate the degree to which energy intake has exceeded energy expended over the past 40 years is to calculate the average gain in body weight during that period of time by examining the weights of adults as a function of age. After reaching maximum height for age, adult weight per age reflects accumulated error in energy balance. A small degree of overeating relative to expenditure will result in a small increase in body mass. Figure 2 shows data published as part of the 2008 National Health and Nutrition Examination Survey (NHANES)(26) and represents adult mean body weight as a function of age in Americans between the ages of 20 and 40 years corrected for height, gender and ethnicity. This range of ages was selected because after the age of 40 years, mean body weight begins to descend with increasing age mostly due to age-related illness. This cohort of people lived through the period where the increase in energy intake has been observed. The slope of this plot indicates that in the 2007 survey, adults in this age range gained 0·417 kg or a little less than a pound (0·9 lb) per year. A one-pound per year increase in body weight would be imperceptible to the average person. We can estimate the amount of energy necessary to produce this amount of weight gain by multiplying the weight gain by the standard value of the energy required for weight gain (32 220 kJ (7700 kcal)/kg). Thus, a yearly gain in body weight of 0·419 kg requires approximately an additional 13 430 kJ (3210 kcal; 0·417 kg × 32 220 kJ (7700 kcal)/kg) or an additional 38 kJ (9 kcal)/d relative to energy expenditure. The consumption of an additional 38–125 kJ (9–30 kcal) of food per day per year is more than sufficient to account for the increase in body weight from a mean of 58·9Footnote * (sd 26·6) kg in the early 1970s to 66·73* (sd 29·3) kg(26) and is consistent with other estimates of the amount of overeating necessary to account for the increase in body weight in the USA(Reference Levy, Mabry and Wang27, Reference Hill28).
Mean body weight as a function of age corrected for height, gender and ethnicity, using data from the National Health and Nutrition Examination Survey 2008. Adapted from Centers for Disease Control and Prevention/National Center for Health Statistics(26)

Who controls our food intake?
Why have we been ingesting an extra 38–125 kJ (9–30 kcal)/d since the early 1980s? The most popular view, advocated by believers of the myth of free will, is that individuals are free to make choices and they must be held responsible for determining the amount and type of food they eat. This argument is espoused by the Center for Consumer Freedom(4), a non-profit organization representing the restaurant industry, that defines its mission as ‘promoting personal responsibility and protecting consumer choices’. It defines choice as ‘the freedom to buy what we want, eat what we want, drink what we want, and raise our children as we see fit’. This position has increased in importance for the food industry in the wake of a lawsuit filed by the parents of two girls who argued that eating in McDonald's made their children obese and diabetic. This lawsuit preceded pressure being applied to state and federal governments to enact legislation to protect the food industry against further lawsuits that accused them of contributing the obesity epidemic(Reference Werner, Feonstein and Hardigree29).
The food industry wants individuals to believe that they are free to choose what and how much they eat. Most Americans agree. A Gallup poll indicated that 89 % of Americans believed the food industry should not be held responsible for our overeating and increasing body weight(30). Apparently, Americans believe their eating behaviour is totally controlled by their own will. For most Americans, the obesity epidemic is a result of being weak willed, lacking the will-power to make healthy decisions.
This firmly held belief among Americans that eating is governed by their own will is evident by the large portion of the population who elect to control their weight by reducing their food intake. Forty-six per cent of US women and 33 % of US males report that they are currently attempting to lose weight(Reference Bish, Blanck and Serdula31). These values increase to about 60 % in men and 70 % in women who are obese(Reference Bish, Blanck and Serdula31) or suffer from hypertension or diabetes(Reference Zhao, Ford and Li32). Of the many methods available to lose weight, the one most frequently chosen is voluntary caloric reduction(Reference Andreyeva, Long and Henderson33) – dieting.
The evidence is extraordinarily clear: losing weight by dieting is futile. Perhaps the best evidence of the futility of dieting is that despite the third of Americans who are dieting, as a population, we continue to gain weight (see Fig. 1). Figure 3 depicts results of a meta-analysis analysing weight change of people after they successfully completed weight-reduction programmes(Reference Anderson, Konz and Frederich34).
Mean weight loss as a function of time since termination of dietary therapy for weight reduction. Adapted from meta-analysis by Anderson et al.(Reference Anderson, Konz and Frederich34)

Even these data are overly optimistic; most people do not succeed in losing weight within a weight-reduction programme. Drop-out rates of 77 % have been reported of standard out-patient treatments during the first year(Reference Inelmen, Toffanello and Enzi35), and attrition has been estimated to be as high as 93 % in commercial weight-loss programmes(Reference Finley, Barlow and Greenway36). As can be seen in Fig. 3, the minority of people who complete weight-reduction programmes lose only a little more than 10 kg after 1 year of therapy. They regain about half the lost weight 1 year after the termination of therapy. By 4 years, weight is about 2 kg less than what it was before dieting. Thus, although a minority of people succeed in losing weight, even those who are successful seem unable to maintain the weight loss once treatment is completed.
Will-power is insufficient to control eating behaviour
Despite the many studies that show the unsustainability of weight loss, a considerable number of studies demonstrate the ability of people to lose weight. Perhaps the most effective of these techniques is gastric bypass surgery. Figure 4 shows the results of a fairly large, Swedish multicentre study that examined the effectiveness of three common surgical procedures used to reduce the size of the stomach(Reference Sjostrom, Lindroos and Peltonen37). A large number of participants were divided into one of four groups based on the type of surgery they had: (i) fixed or variable banded gastroplasty; (ii) vertical gastroplasty; (iii) gastric bypass; or (iv) a control group. They were matched on the basis of age, gender and weight and were observed for 10 years following the operations. Three important observations, as illustrated in Fig. 4(b), emerged from this study. First, clearly the most effective procedure in terms of producing weight loss is gastric bypass. Although this operation is the most invasive, requiring major restructuring of the gastrointestinal tract, results from this study suggest about a 37 kg weight loss at about a year following the surgery, a value very close to the mean weight loss derived from a recent meta-analysis of similar studies(Reference Maggard, Shugarman and Suttorp38). No other surgical, dietary or pharmacological treatment comes close to producing this degree of weight loss. The second important observation is that despite the surgery, considerable recovery of the lost weight is evident with time. Following gastric bypass, about 12 kg or about a third of the weight returns 10 years post-operatively. Similarly, following the gastric banding operations about 6 kg of the 23 kg is recovered or about 25 % of the lost weight. The third observation is once weight stabilizes it appears to remain below the starting weight, reaching an asymptote and suggesting that weight will probably remain below original starting weight. This effect must be contrasted with losing weight through dietary restriction where weight seems to totally recover after 5 years following the termination of treatment(Reference Anderson, Konz and Frederich34).
(a) Daily energy intake (▪, control; ●, surgery) and (b) change in body weight (▪, control; ●, banding; ▴, vertical banding; ▾, gastric bypass) as a function of time since surgery. Values are means with their 95 % confidence intervals represented by vertical bars; to convert to kJ, multiply kcal value by 4·184. Adapted from Sjostrom et al.(Reference Sjostrom, Lindroos and Peltonen37)

Although some malabsorption may occur with gastric surgeries, most the weight loss results from a significant reduction in the amount of food consumed(Reference Poitou Bernert, Ciangura and Coupaye39). This reduction in food intake does not depend upon improved will-power, but rather upon the physical constraint imposed by the surgery of the gastrointestinal tract limiting the amount of food that can be eaten at one time. This effect can be seen in Fig. 4(a) and was taken from the same Swedish study discussed earlier(Reference Sjostrom, Lindroos and Peltonen37). It shows daily food intake of the combined surgical techniques v. control participants. Caloric intake is reduced almost in half after surgery, but recovers slowly, paralleling the body weight recovery curve evident in Fig. 4(b). The final difference in daily intake is about 1046 kJ (240 kcal)/d, a sufficient difference to maintain approximately a 25 kg weight difference. Surgical interventions that prohibit the individual from making ‘free choices’ to eat whatever they like, in quantities they choose, whenever they want, by physiologically limiting the amount of food they can ingest are effective in producing a sustained decrease in food intake and a sustained reduction in body weight.
A less invasive technique that has been found to be fairly successful in producing a weight loss is the use of an intra-gastric balloon. Unlike gastric surgery, the alterations of the stomach are not permanent and are easily reversed by removing the balloon, which usually happens after 6–12 months. The implantation of an intra-gastric balloon produces an average weight loss of about 15 kg at the end of treatment(Reference Imaz, Martinez-Cervell and Garcia-Alvarez40), a therapeutically significant value(Reference Goldstein41). Because the intra-gastric balloon is reversible once the balloon is removed, individuals return to the same environmental conditions that produced the excessive weight.
Figure 5 shows the results of a multicentre study of patients who underwent implantation of an intra-gastric balloon, which stayed in place for 1 year. A placebo group was used in which the same operation was performed but the balloon was never implanted. Such a group is important because besides the operation, patients receive considerable nutritional and behavioural advice on weight control; the use of such a group allows for the separation of the effects of the intra-gastric balloon from the effects of the additional treatments. There are three remarkable features about Fig. 5. First, the weight change after 1 year of having the balloon implanted was about 25 kg, an amount in the same realm as the weight loss produced through gastric surgery (see Fig. 4). Second, the placebo operation produced almost the same degree of weight loss, approximately 20 kg, demonstrating that the power of the additional nutritional advice and believing the stomach to be full was sufficient to protect the individuals from eating a normal amount of food. Last, approximately half the weight was regained within 1 year following the removal of the balloon (or placebo). If the recovery continued at a linear rate, the participants would have totally recovered all the weight they had lost in about 2 years.
Weight loss as a function of time following insertion and removal of an intra-gastric balloon (▪, placebo group in which surgery was performed but a balloon was not implanted; ●, treatment group in which a balloon was implanted). Values are means with their standard deviations represented by vertical bars. Adapted from Imaz et al.(Reference Imaz, Martinez-Cervell and Garcia-Alvarez40)

One reason for the effectiveness of gastric surgery and the intra-gastric balloon (while the balloon is inserted) is that it removes the decision of how much to eat. Although people may desire to eat more, the physical limitations imposed by either the surgery or the balloon will not allow people to consume as much as they would without the physical limitation in place. Indeed, both the recovery of food intake following gastric surgery and the return of body weight to pre-treatment levels after removal of the intra-gastric balloon indicate the powerful effect the environment has on how much people eat.
Similar effects can be seen with non-surgical techniques that successfully produce weight loss. Although not nearly as effective as gastric surgery in terms of amount of weight loss produced, significant weight loss can be achieved through the use of meal replacements. Originally sold as liquid supplements for medically supervised fasts, meal replacements are small containers of high-protein, nutritionally complete liquids packaged in quantities consisting of about 837–2510 kJ (200–600 kcal) – less energy than would be normally consumed at a meal. Like gastric surgery, the decision of how much to eat is removed from the individual. Instead, how much to eat is determined by the portion-controlled package. Consuming meal replacements for one or two meals per day has been demonstrated to be significantly better at producing weight loss after 1 year of treatment than conventional caloric restriction(Reference Heymsfield, van Mierlo and van der Knaap42–Reference Flechtner-Mors, Ditschuneit and Johnson50). Figure 6 shows the results from a 4-year study examining the effect of eating two meal replacements daily on body weight. After about 30 months, weight begins to increase; whether this trend represents a metabolic adjustment or a decrease in compliance is, however, unclear.
Mean weight loss of people consuming two meal replacements each day for 4 years. Adapted from Flechtner-Mors et al.(Reference Flechtner-Mors, Ditschuneit and Johnson50)

Subsequent work has found that meal replacements neither have to be liquid nor high in protein to be effective. Breakfast cereals have been used as a meal replacement to effectively reduce meal intake and produce significant weight loss(Reference Mattes51, Reference Vander Wal, McBurney and Cho52). Similarly, pre-packaged meals have been shown to produce a significant weight loss(Reference Wing, Jeffery and Burton53–Reference Hannum, Carson and Evans57). These meals consist of commercial-grade, ready-prepared foods, packaged in smaller sizes than would ordinarily be served. What appears to be critical for meal replacements to produce a weight loss is that free choice to determine what and how much food to eat is removed from the individual. The fewer choices individuals have to make concerning consumption, the greater the ability of people to restrict their intake and lose weight.
Another commercial technique that is effective in producing a weight loss is the use of weight-loss groups(Reference Finley, Barlow and Greenway36). These groups usually provide sound nutritional advice, but in addition have a very powerful ‘social’ component in which the individual must expose his/her weekly weight loss progress to a group of peers. Praise is given for successful weight loss. These programmes help people lose weight through social reinforcement, although many such programmes have turned towards utilizing meal replacements in addition to their nutritional advice. Several studies have demonstrated that losing weight in groups is more effective than individual counselling(Reference Gucciardi, Demelo and Lee58–Reference Ashley, St Jeor and Schrage60). Still, social affiliation and praise act as reinforcement for behaviours necessary to constantly restrict intake. Social reinforcement is not powerful enough as a motivator since the rate of attrition from commercial weight-loss groups such as the ‘Jenny Craig’ programme is very high, averaging about 90 % at the end of 1 year(Reference Martin, Talamini and Johnson61). Encouraging attendance through ‘motivational interviewing’ appears to increase attendance at meetings slightly and produce greater weight loss(Reference Martin, Talamini and Johnson61–Reference West, DiLillo and Bursac63). Unfortunately, even those who successfully complete a commercial weight-loss programme (Weight Watchers) and reach their goal weight regain more than half of their weight within 5 years of terminating the programme(Reference Lowe, Miller-Kovach and Phelan64, Reference Lowe, Kral and Miller-Kovach65).
Finally, pharmacological treatment must be included as a potential treatment for weight loss. Weight-loss drugs were originally developed as an adjunct to traditional nutritional advice to boost the amount of weight reduction by dieting in the first 12 weeks, further motivating participants to lose weight. As soon as people stopped taking the medication, weight regain occurred. Figure 7 shows the results of a 1-year study of the effects of d-fenfluamine plus dietary restriction and a dietary restriction only group. After 1 year, average weight loss amounted to about 11 kg. Also of note, almost all weight loss while under drug treatments occurred mostly in the first 6 months, a fairly consistent finding with many kinds of anorectic drugs(66). Although the drug treatment caused a slightly more rapid weight loss than the diet alone, by the end of the 12-month treatment period the difference in average weight loss per group was only 1·5 kg. When both the nutritional advice and drug were discontinued, weight regain ensued. Use of medications that activate brain mechanisms to suppress eating behaviour are effective in helping an individual remain on a diet and lose weight, but once removed from the treatment intake returns to its normal levels, resulting in a return of body weight to pre-treatment levels.
Weight loss during 1 year of dietary restriction plus dexfenfluramine (···○···) or placebo (—▪—) and recovery of weight 3 years after stopping treatment. Values are means with their standard errors represented by vertical bars. Adapted from Pfohl et al.(Reference Pfohl, Luft and Blomberg149)

After decades of research, many methods successfully facilitate weight loss. However, all require removing people from or modifying their ‘natural’ environment by surgery, meal replacements, group reinforcement or medication. In doing so, we remove some of the freedom for people to eat whatever they want or whenever they desire. In every case, when these restraints are removed and people return to their pre-treatment environments, weight regain is inevitable; weight quickly returning to pre-treatment levels.
Determinism and the control of food intake
At the opposite end of the philosophic spectrum from those who believe eating behaviour is modulated by ‘free will’ stand the Determinists who believe that eating behaviour is controlled by biological events. These Determinists in the field of the study of eating behaviour can be divided into two groups: the Biological Determinists and the Environmental Determinists. Although the Biological Determinists acknowledge some contribution of the environment in the determination of intake, their major argument is that eating behaviour is an essential part of a larger set of physiological process involved in the control of body weight(Reference Lutz67–Reference Woods70). Such a view may explain why people fail to maintain their weight after successfully losing weight through the treatments described above; however, this view fails to explain why the population has been gaining weight over the past 40 years as illustrated in Fig. 1 or why people who immigrate to the USA gain weight(Reference Goel, McCarthy and Phillips71–Reference Cairney and Ostbye73).
The insistence by the Biological Determinists that body weight (adiposity) is strongly regulated through the control of energy intake and/or the control of energy expenditure actually may be harming efforts to develop programmes that may effectively deal with the obesity epidemic. For example, skipping a meal or fasting for a whole day would be expected to cause overeating in order to compensate for the energy deficit. It is currently recommended that people who want to lose weight should not skip breakfast for this reason(Reference Davis74). A close examination of the evidence shows that this does not happen. When a meal is skipped or one fasts for a day, energy intake may increase, but the overeating is never sufficient to overcome the energy deficit(Reference Levitsky and DeRosimo75). Even a month of alternate-day fasting and refeeding does not lead to hyperphagia to either compensate for or anticipate the fast(Reference Heilbronn, Smith and Martin76).
In addition to the necessity of the Biological Determinists to maintain the ideas of physiological regulation of food intake, the idea that we are driven to eat more by energy deficits and to eat less after consuming a large meal seems true because of our own experience. After overeating, we feel full and after going without eating, we feel hungry. Neither measures of satiety(Reference Rolls, Roe and Meengs77) nor measures of hunger(Reference Rolls, Morris and Roe78–Reference Mattes81) are very good predictors of how much we actually consume. Hunger and satiety describe sensations that correlate with energy deficit and surfeit, but there is no evidence that they actually cause or terminate eating. It is plausible that these sensations are used as explanations for our behaviour rather than cause them.
The Environmental Determinists, on the other hand, do not deny the importance of biological mechanisms for the control of food intake, but believe that human eating behaviour is determined more by the environment in which humans live than by the biological mechanisms underlying the control of food intake. Of the two camps, the Biological Determinists are the most popular. The reason is money. Discovering a biological mechanism that would suppress eating behaviour without serious physiological side-effects is worth billions of dollars, a fact that is not overlooked by the pharmaceutical industry.
Susceptibility to food cues
Environmental Determinists have compiled an impressive list of environmental stimuli that produce effects that are sufficiently large to account for the increase body weight evident over the past several decades. These stimuli, for the most part, are not consciously perceived, but operate through our non-conscious mind. One of the most powerful of these cues is portion size. The amount of food people consume at a meal is determined to a large extent by the amount of food placed on the plate in front of them(Reference Rolls, Morris and Roe78, Reference Diliberti, Bordi and Conklin82–Reference Levitsky and Youn85). The weighted mean of the effect of increasing the portion served from the five laboratory studies cited is about 837 kJ (200 kcal). This increase of 837 kJ (200 kcal) for a single meal is not trivial. Having just one meal per week increased by 837 kJ (200 kcal) as a result of an increase in portion size is of an order of magnitude that is sufficient (837 kJ (200 kcal)/7 d = 117 kJ (28 kcal)) to explain the rise in food intake (125 kJ (30 kcal)/d) and body weight (42 kJ (10 kcal)/d) evident in our population since the early 1980s (see Fig. 1).
The portion size effect is problematic for the Biological Determinists. If eating behaviour were part of a larger regulatory system involved in maintaining the constancy of body weight, then consuming a surfeit of energy should cause a counter regulation and a decrease in subsequent energy intake. However, there is very little evidence to suggest that our bodies correct the energetic error created by overeating by reducing subsequent intake(Reference Levitsky, Obarzanek and Mrdjenovic86). Increasing the energy value of lunch served every working day from 3209 to 6393 kJ (767 to 1528 kcal) for 4 weeks resulted in a mean increase in total daily energy intake on average of 1389 kJ (332 kcal), a value which showed neither a tendency towards a decline across the 4 weeks nor a reduction in food consumed at other meals during the day(Reference Jeffery, Rydell and Dunn84). Increasing portion size at every meal has been shown to increase total energy intake over 2 d(Reference Rolls, Roe and Meengs87), 4 d(Reference Kelly, Wallace and Robson88) and even eleven consecutive days(Reference Rolls, Roe and Meengs89) without a diminution in its effect with repeated presentations.
This effect of larger portions inducing greater consumption is not limited to the amount of food served on an individual's plate. Studies have revealed that providing people with larger packages of food is sufficient to increase energy consumption from that food(Reference Rolls, Roe and Kral79, Reference Raynor, Van Walleghen and Niemeier90–Reference Wansink92). Even more interesting is that people do not even have to recognize the larger portions or packages. Several studies have shown that if participants are led to believe that other participants have eaten more, they are more likely to increase their intake(Reference Pliner and Mann93, Reference Roth, Herman and Polivy94).
The increase in portion size may be one of the major causes of the obesity epidemic. The food industry has been increasing portion sizes in supermarkets and restaurants, especially in fast-food establishments, for the past 40 years, a time when the increase in obesity has been observed(Reference Young and Nestle95). A subtle, yet potentially profound, consequence of exposure to larger portion sizes of food products and amounts served in restaurants can be seen in Fig. 8, which displays results of an analysis of the mean portion size of nine specific foods (salty snacks, desserts, soft drinks, fruit drinks, French fries, hamburgers, cheeseburgers, pizza and Mexican food) served in restaurants, fast-food establishments and at home between 1977 and 1996(Reference Nielsen and Popkin96), spanning the time when the surge in body weights began to occur (see Fig. 1). Size of the portion served everywhere increased during this time frame and the rate of portion size increase in fast-food establishments was even more rapid. The amount served at home also has increased, at least at the same rate as in restaurants. People's estimation of a normal-sized portion has been increasing. We may blame restaurants for serving us more food than we want in order to make a greater profit, but it is hard to explain why we are serving ourselves more food at home – other than our estimation of how much is a ‘normal’ portion size is established by subtle environmental information acquired by advertising, food products and food establishments. This process of establishing a ‘social norm’ for a food portion is subtle and non-conscious and is now fairly well documented(Reference Pliner and Mann93, Reference Wansink97–Reference Vartanian, Herman and Wansink99).
Mean portion size served in the home (—▪—), in restaurants (- -●- -) and in fast-food establishments (···▴···) as a function of year. Adapted from Nielsen and Popkin(Reference Nielsen and Popkin96)

An example of how the power of portion size's effect on individuals can affect the body weight of a population is the ‘French paradox’(Reference Rozin, Kabnick and Pete100). The French consume higher-fat foods and take more time eating than Americans. Both variables are related to increased energy consumed at a meal (see discussion below). Yet, the average weight of the French population is less and they suffer fewer pathological problems related from eating higher-fat foods than Americans. The resolution of this paradox is that their entire culture of eating is based on eating smaller portions, from the amount of food served in a restaurant to the size of the portions described in recipe books.
Another environmental cue that has been repeatedly demonstrated to affect the amount of food we consume is food variety. People consume more food at a meal if the successive courses consist of different foods than if they remain the same food(Reference Rolls, Rowe and Rolls101). People also consume more food if a greater number of different foods is offered simultaneously; for example, as the number of colours of M&M's or jelly beans increases so does consumption(Reference Kahn and Wansink102). The variety effect is not limited to snacks, but has been observed when the number of different foods that are offered simultaneously at a meal is increased(Reference Brondel, Romer and Van Wymelbeke103, Reference Levitsky104).
Like the portion size effect, increasing variety of foods offered is biologically significant. Figure 9 re-plots data collected by Smiciklas-Wright et al.(Reference Smicklas-Wright, Krebs-Smith and Krebs-Smith105) that show the correlation between the number of unique foods consumed ad libitum over a period of 3 d and total energy consumed. For every additional five foods eaten in a 3 d interval, average daily energy intake increases by 883 kJ (211 kcal).
Mean total daily energy intake as a function of the number of unique foods consumed in 3 d. To convert to kJ, multiply kcal value by 4·184. Adapted from Smicklas-Wright et al.(Reference Smicklas-Wright, Krebs-Smith and Krebs-Smith105)

The variety of foods available to the public has increased considerably over the past 30 years. Figure 10 shows the total number of new food products added to the marketplace every year since 1970. Both the number of new products introduced and the rate of introduction of new products have increased considerably since about 1980, the time when increases in body weight began. The greater the number of food products introduced into the market, the greater the variety of food available and, based on the experimental studies previously cited, the greater the intake. What is most important about both food portion size and food variety is that their effect on intake is mainly unnoticed(Reference Vartanian, Herman and Wansink99). The lack of energetic compensation for overconsumption at previous meals(Reference Levitsky106) combined with the increase in portion size and food varieties are two powerful causes of the obesity epidemic.
The number of new foods and beverages introduced into the marketplace as a function of year. Data were combined from Gallo(Reference Gallo150) and Economic Research Service, US Department of Agriculture(151)

Another stealth factor in our environment that unconsciously contributes to the increase in caloric intake is dietary fat. Since the early 1980s, the time at which body weights started to increase, the amount of fat available to the American consumer for consumption has increased(Reference Levitsky107). Like the other environmental variables discussed above, people are usually not sufficiently aware of increases in the fat content of their food to adjust the volume of food they consume to maintain their energy intake constant(Reference Lissner, Levitsky and Strupp108). Consequently, the greater the fat content of food served, the greater the caloric intake(Reference Levitsky107). This inability to energetically compensate for energy content of dietary fat does not change even with repeated exposure to higher-fat diets. In a study of the effect of changing the fat content of foods, no decrease in food intake was observed during 11 weeks of observation, resulting in a significant increase in body weight(Reference Kendall, Levitsky and Strupp109).
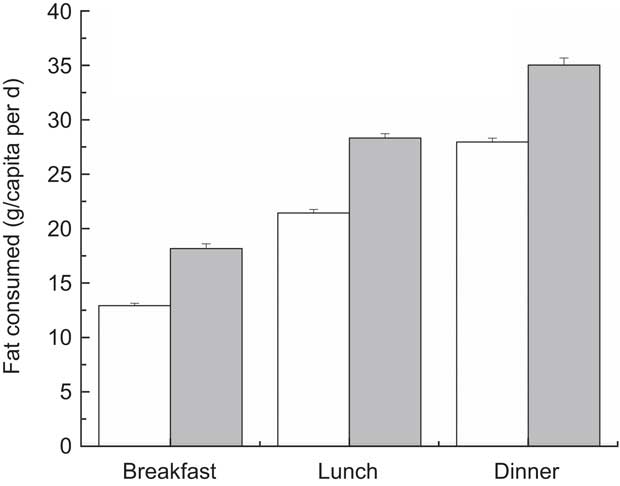
The food industry has compounded the effect of dietary fat by adding more fat to foods that are served outside the home in restaurants and fast-food establishments. Figure 11 is derived from 2007–2008 NHANES dietary data(26) and compares the amount of fat consumed in the home v. foods prepared outside the home for breakfast, lunch and dinner. Not only is it clear from these data that people consume higher amounts of fat from foods prepared outside the home, but the average difference (6·4 g/d) in fat intake is biologically significant. This difference amounts to about 243 kJ (58 kcal), which, if eaten every day, is more than enough energy (>125 kJ (>30 kcal)/d) to explain the epidemic of obesity. Eating as few as five lunches or five dinners from restaurants or fast-food establishments each week is enough to produce the weight gain observed in Fig. 1.
Amount of fat consumed at breakfast, lunch and dinner, either at home ( ) or outside the home (
 ), using data from the National Health and Nutrition Examination Survey 2008. Values are means with their standard deviations represented by vertical bars. Adapted from Centers for Disease Control and Prevention/National Center for Health Statistics(26)
Another subtle stimulus that surreptitiously increases our food intake is social facilitation. Humans are social animals. Our eating behaviour is very sensitive to others in our environment. Considerable data have been published demonstrating that the more people we eat with (particularly when we are familiar with the people with whom we are eating), the more we consume(Reference Levitsky110). The social facilitation effect is not small. The difference in energy consumed at a meal between eating alone and eating with three people is about 628 kJ (150 kcal)(Reference de Castro and Brewer111). Eating with three friends twice each month is more than sufficient to cause an increase in body weight consistent with the epidemic of obesity.
The effects of watching television may also be a significant determinant not only of what products we purchase but of how much we eat. Although a relationship between time spent watching television and eating behaviour had been suspected for many decades(Reference Dietz112), data accumulated more recently have experimentally confirmed that watching food commercials actually increases snack intake(Reference Harris, Bargh and Brownell113–Reference Halford, Boyland and Hughes115). Figure 12 shows results of a study by Halford et al.(Reference Halford, Boyland and Hughes116), in which normal-weight, overweight and obese children watched cartoons containing commercials advertising either toys or snack foods. After watching the cartoons the children were provided with an assortment of snacks to eat. Three important points can be made about Fig. 12. First, watching food commercials significantly increases snack intake relative to watching toy commercials. Second, a child's weight had no statistically significant effect on the amount of snacks consumed in the toy advertisement condition. Third, the obese children were more stimulated to eat by the food advertisements than the overweight children who, in turn, displayed a greater response to the food advertisements than the normal-weight children. The effect is enormous. The difference between energy consumed in each condition in normal-weight children was about 1046 kJ (250 kcal), in overweight children was about 1255 kJ (300 kcal) and in obese children was about 1464 kJ (350 kcal).
Amount of energy consumed from snacks by normal-weight, overweight or obese children after watching cartoons containing commercials advertising either toys ( ) or foods (
 ). Values are means with their standard deviations represented by vertical bars; to convert to kJ, multiply kcal value by 4·184. Adapted from Halford et al.(Reference Halford, Boyland and Hughes116)

Priming, obesity and free will
A common property of the environmental variables described above (portion size, food variety, fat content, social facilitation and television watching) is that people are usually unaware that they are being allured to consume slightly more energy than they would have if the environmental stimuli were not present. Unawareness of seductive stimuli is at the very heart of the obesity epidemic. The stimuli are subtle and stealthy; we do not notice their influence on our behaviour because their effects are small and produce imperceptible changes in our daily weight.
These variables affect our energy intake but are invisible to our consciousness because of two different mechanisms. The first is a reality that the Biological Determinists have long refused to acknowledge: humans are poor at adjusting energy intake at subsequent meals for changes in energy content of prior meals. Consequently changing the energy density of food by altering the amount of fat or water or air in food does not result in a sufficient change in the volume of food consumed to compensate for the alterations in energy ingested, even when the change in energy density persists long enough to produce changes in body weight(Reference Levitsky106, Reference Levitsky110).
A second, and more insidious, mechanism that causes us to be so vulnerable to environmental stimuli associated with eating is called priming. Priming refers to cognitive processing of environmental stimuli that occurs automatically, non-consciously, and that has the propensity to evoke overt behavioural responses such as eating in humans(Reference Bargh, Gollwitzer and Lee-Chai117–Reference Ferguson and Bargh119). Any environmental stimuli that are associated with food or eating have the potential to elicit feeding, whether people are conscious of them or not.
This notion that our food intake may be subtly influenced by food primes was introduced by Cohen(Reference Cohen and Farley120–Reference Cohen122) to explain how environmental cues may affect body weight. John Bargh, who has done some of the pioneering work on primes (cited above), recently published experimental data on the effect of television watching on snack eating of children in which he suggested that food advertising acts as food primes to encourage the children to eat(Reference Harris, Bargh and Brownell113). Similarly, increasing the portion size and food variety as well as watching with others eat may increase the amount consumed.
With both the increase in the number of food primes in our environment (see Fig. 10) and the availability of large-portioned, energy-dense, inexpensive foods, we have created the perfect storm for increased adiposity. As a consequence of our increasingly interconnected world, we are advertising more, not only on television, but also on billboards, the Internet, newspapers, magazines, subways, buses, pens, bags, etc. Because of globalization, signs for feeding establishments, such as McDonalds or Kentucky Fried Chicken, and for beverage products, such as Coke or Pepsi, have become ubiquitous to the extent that we often fail to consciously acknowledge them. Such frequent displays of food symbols, along with the increasing number of signs for restaurants on our streets and the display of a multitude of food items in the supermarket, produce a multitude of priming signals which unconsciously elicit a higher-order, goal-seeking behaviour to find something to eat. These food primes are so powerful that only way most people can lose weight is to be removed from eating ‘freely’ in this environment by either (i) restricting their capacity to eat with gastric surgery or (ii) limiting their access to food by portion-controlled rations or boycotting types of foods, the only two treatments that seem to work.
The concept of food priming not only offers an explanation as to why people have been gaining weight over the past 40 years, but may also help to explain why certain people, living in the same environment, gain more weight than others. A close examination of the change in the distribution of weight from the 1970s to the 1990s has shown that the increase in the average weight gain is primarily attributable to a greater increase in the heaviest part of the population(Reference Flegal and Troiano123) – larger people are getter larger. It is possible that certain individuals are more susceptible to the effects of environmental food primes than others. Genetics may contribute to the propensity of an individual to eat in response to a food cue. This idea was suggested by Stanley Schachter in 1968 in his ‘externality hypothesis’(Reference Schachter124). However, the majority of the subsequent experimental data did not confirm this belief(Reference Rodin125). One reason for this lack of confirmation may have been that researchers were expecting to find large differences in eating behaviour between the obese and the non-obese in response to variations in external cues, when the actual differences in daily energy intake or even meal intake may be too small to measure using conventional techniques.
Weight monitoring: a tool for self-regulation
The empirical data are very clear. To continue to live under the illusion that we are free to control our feeding behaviour in the current food environment is to subject ourselves to the barrage of food primes that relentlessly make us eat a little more food than we have been, pushing the limits of our body to store energy. The consequence, of course, is the increase in diabetes, high blood pressure and a myriad of other costly pathologies, and a future that appears so dismal that it is predicted our children will live shorter lives than we(Reference Olshansky, Passaro and Hershow126).
How can we stop the epidemic of obesity? Changing the environment and/or aiding the individual in defending against the food environment are possibilities. We can decrease the number and/or intensity of food primes. This is possible through decreasing the number of food advertisements on children's television shows or by introducing a tax on sugar and/or dietary fat. In addition, we may develop tools that will make the individual more aware of the effects of these probes on his/her own eating behaviour. Weight monitoring may be one of these tools.
Monitoring the accumulated energetic error resulting from consuming more energy than expended, as evidenced by an increase in body weight, may be a way to increase awareness on the individual level. Although imprecise, the accumulating difference between the amount of energy consumed daily and the amount of energy expended must be reflected in changes in body weight. A single measurement on a bathroom scales would fail to detect the subtle daily increases in body weight during the obesity epidemic. Even if more accurate scales were used, fluctuations in body water, gastrointestinal contents and tissue glycogen stores would obfuscate any change in true tissue weight that might occur. This problem of variation in daily body weight measures and a fear that daily weighing might cause, or at least aggravate, eating disorders have made daily weight monitoring, historically, an unacceptable weight-control behaviour.
We demonstrated that monitoring of daily weight on ordinary bathroom scales is effective in helping freshman prevent weight gain during their first semester in college. College freshmen, forced to make their own food choices perhaps for the first time, are even more vulnerable to the environmental signals that encourage them to eat a little more than they expend than others(Reference Levitsky, Halbmaier and Mrdjenovic127). Food services have evolved from the old ‘cafeterias’ of the past to an active college recruiting device to sell their campuses to young customers. The ‘dining halls’ are attractively arranged, display delicious food, and offer food in an ‘all-you-can-eat’ environment. In addition, food on campus is ubiquitous. Freshmen typically gain between one and two kilograms during their first semester(Reference Vella-Zarb and Elgar128).
Our study involved giving freshmen scales to put in their dorm rooms(Reference Levitsky, Garay and Nausbaum129). We asked them to weigh themselves every day and to email their weight to our staff, who plotted their current weight with their previous weights and produced a line representing the linear regression of the last seven data points. The graph was then emailed back to the students. The group that received this information gained no weight across the semester whereas the control group, who did not receive the scales, gained about 2 kg. We repeated the study the following year to be assured that the effect was not a statistical error and observed identical results.
Our weight monitoring studies demonstrate that it is possible resist food primes by providing people with a means to detect small changes in their weight. Such information plays three roles that facilitate the resistance to weight gain. First, it provides frequent biofeedback as to the status of the individual in his/her battle to resist the environmental food primes and resultant body tissue gain. It indicates the success or failure of the methods used by the individual to lose weight in the previous week. Second, successfully returning to the previous weight acts as a reinforcement of those behaviours that caused the weight change or maintenance. Third, observing success in maintaining weight enhances feelings of self-efficacy and a sense of being in control of one's weight, which may engender a psychological state that antagonizes feelings of depression.
Successful restraint
The research on weight control discussed above has taught us two important lessons. First, to live in the current environment with thousands of food primes without pushing the body to its capacity to gain weight is almost impossible. Second, only when we separate ourselves from this environment either by physically restricting the capacity of our stomach to consume large amounts of food or restricting our eating to portion-controlled meals, or by providing ourselves daily reminders of changes in our body weight, is it possible to control our weight. Constant vigilance and dietary restraint are essential.
Dietary restraint refers to a set of characteristics of people who are actively inhibiting what and how much they eat in order to maintain a weight lower than what they would achieve if they did not restrict consumption. Historically, the nutrition and medical communities have viewed dietary restraint rather negatively because people who suffer from eating disorders score very high on tests of dietary restraint. The very act of losing weight through dietary restriction causes many of the symptoms of eating disorders to occur(Reference Polivy130). This view of dietary restraint, however, is changing. Experimental evidence indicates that placing people with eating disorders on a dietary restriction does not increase the symptoms of eating disorders(Reference Wadden, Foster and Sarwer131) and, in adolescents, may actually reduce symptoms(Reference Stice, Presnell and Groesz132, Reference Presnell, Stice and Tristan133).
One of the major correlates with successful weight maintenance in the relatively few individuals able to achieve this is an increase in dietary restraint(Reference Vogels and Westerterp-Plantenga134, Reference Wing and Phelan135). This increase in dietary restraint confirms the necessity of increasing awareness of the environmental cues that seduce us to eat. Letting down our guard increases the risk of overeating and weight gain; even doing this for a weekend has been found to result in an increase in body weight(Reference Racette, Weiss and Schechtman136).
In addition to increases in dietary restraint, another characteristic of the successful weight maintainers is regular monitoring of body weight(Reference Wing and Phelan135, Reference Linde, Jeffery and French137). Frequency of scale usage may indicate both a self-awareness of susceptibility to food primes and may provide necessary feedback in the individual's success in countering such primes.
Those who do not dress in their armour of restrained eating live under the illusion that they have the freedom to choose (free will) what foods they eat and how much. Food choice is an illusion. We choose the food we eat based on our history of experiences with that food and all the environmental forces that impinge on us at that moment: what the food looks like, what others around us are eating, what we think others consider a normal portion to eat, the price of that food, the ease of obtaining food, the speed of obtaining the food, how much time we have to eat, and many other factors which have yet to be discovered. A complex network composed of these factors determines our caloric intake. In combination, these factors are so powerful that, unless we are restrained by surgery or structured eating plans, or by a dedication to prevent future weight gain (restrained eating), we become vulnerable to all stimuli presented, mostly by commercial interests who have learned to effectively use these techniques to encourage us to eat a little more.
Making decisions without free will
Thus, it appears possible to control body weight using tools such as daily weighing to monitor our interaction with the food environment. But does not the fact that we may choose to make changes in our behaviour mean that free will exists? Not necessarily. Making choices does not mean that we make them free from other influences. We make many decisions in our daily life that appear to have been made on the basis of our rational thinking. Yet, as many studies have confirmed, decision making can be greatly influenced by primes that operate unconsciously, making us believe that we arrived at a decision independent of any other influence(Reference Bargh and Ferguson118).
We can make decisions in the absence of free will based on information accumulated through experience. The problem is that most people do not believe that their decision was determined solely by experiential and biological factors(Reference Sarkissian, Chatterlee and de Brigard138). Nevertheless, we know that the more decisions people feel they can control regarding their health, the healthier they are as expressed by lower rates of mortality(Reference Dalgard and Lund Haheim139), reduced myocardial infarction(Reference Sturmer, Hasselbach and Amelang140, Reference Rosengren, Hawken and Ounpuu141), less depression and anxiety(Reference Burger142, Reference Nunn143), and better self-rated degree of health(Reference Mackenbach, Simon and Looman144). Learning that we can control our weight through adjustments in intake may not only have a direct positive effect on weight, but may also act indirectly by strengthening a sense of control over body weight and health.
If the above arguments positing that the cause of the obesity epidemic is that we are eating more food than we need are correct, then the solution to the obesity epidemic must be that we consume less food. This reduction in food intake will not be temporary, but a sustained way of life. Such a solution will not be taken passively by the food industry. We can expect attacks, particularly directed to our sense of freedom to choose what to eat. We have seen colleagues labelled as being ‘food police’ for suggesting a tax on dietary fat or sugar. But the scientific evidence is abundantly clear: reducing our consumption decreases pathologies that cause chronic disease and early death(Reference Redman and Ravussin145–Reference Anderson and Weindruch147).
The acceptance of personal responsibility to control our weight, as advocated above, does not mean that blame should be placed on the individual. Being blamed for one's weight is legitimate only if eating is simply a matter of an individual's ‘free choice’ to eat or not eat. The data presented above indicate clearly that an individual's decision to eat is not a result of personal weakness, but rather is determined, to a great extent, by the many environmental cues that have emerged since the early 1980s as a consequence of the commercialization of food.
If we add our personal responsibility to resist food cues to the collective responsibility of government to control the many food signals in our environment, as advocated by Brownell et al.(Reference Brownell, Kersh and Ludwig148), we may amass the power, and the will, to curb the epidemic of obesity.
Acknowledgements
This research received no specific grant from any funding agency in the public, commercial or not-for-profit sectors. There are no conflicts of interest. D.A.L. and C.R.P. contributed equally to the writing of the manuscript. The authors would like to thank Professors William Provine, Mal Neshiem, Paul Rozin and George Collier for their wise comments. In addition, they would like to thank Morgan Frankel, Melanie Tai, Joshua Weinstock, Anni Wong, Louise Mendes and other members of their research group for their thoughtful suggestions.



