

With increased awareness of population ageing, the link between dietary habits and chronic disease is becoming clearer( 1 ) and data on dietary habits, specific population characteristics and interventions to improve nutritional intake among older populations are increasingly needed( Reference Tourlouki, Matalas and Panagiotakos 2 ). From the public health point of view, however, target groups and approaches have yet to be fully identified; although the benefits of dietary change in later life( Reference Chernoff 3 ) have become more widely known, we still need evidence on the likelihood that particular populations can and will change their dietary behaviours in a consistent and sustained manner. It is perhaps surprising then that few studies have considered the need to differentiate subgroups under age categories in later life in order to better understand the factors influencing dietary habits( Reference Sulander, Helakorpi and Rahkonen 4 ), and even fewer have tracked change longitudinally as people age( Reference Wakimoto and Block 5 ).
Nutrition monitoring and surveillance systems have only recently included older people (aged above 65 years) in national cross-sectional studies, and their findings indicate that significant improvement in dietary patterns and nutritional intake is possible, leading to changes that affect chronic disease in the older adult population( Reference Ernst, Sempos and Briefel 6 – Reference Sulander, Helakorpi and Nissinen 12 ). To date, there are only a few reports from observational follow-up studies that are greater than 5 years in duration and focus on changes in dietary habits among older people not living in institutions. These indicate that women and men in later life are capable of making changes towards healthier food choices( Reference Garry, Hunt and Koehler 13 – Reference Toffanello, Inelmen and Minicuci 16 ). Looking more carefully at the ‘older’ age group, it has been suggested that the older-old (aged 75–79 years) may in fact make fewer changes or change more slowly than the younger-old (aged 70–74 years)( Reference Sulander, Helakorpi and Rahkonen 4 ). More substantial longitudinal and age-related data, however, have generally been lacking. It is here that the current study, spanning 21 years, makes a contribution.
In terms of factors affecting dietary habits as people age, loss of a partner has been indicated as a negative one( Reference Shahar, Schultz and Shahar 17 ), especially among men( Reference Eng, Kawachi and Filzmaurice 18 ). Among women findings are inconsistent( Reference Gustafsson and Sidenvall 19 ), with some cross-sectional studies showing that dietary habits tend to be better among older couples than single respondents( Reference Sulander, Helakorpi and Rahkonen 4 ). It was our aim to investigate whether such negative effects of being single or widowed can be seen in a longitudinal study of older women. Overall, it has been suggested that among the older population, women in particular make changes toward healthier options( Reference Fernyhough, Horwath and Campbell 15 ); it is also women who are most likely to outlive their partners, and thus are worthy of further longitudinal study into the effects of longevity and marital status. As the longitudinal effects of loss of a partner on dietary habits may differ with age, the present study investigated a narrower range than the 10 years most commonly used in large-scale surveys in order to increase understanding in this area.
The aim of the present study was to examine longitudinal changes in dietary habits over a 21-year period from 1982 to 2003 in women aged 50–60 years at baseline. This time span makes the study exceptional in terms of cohort data sources for older adults. Our longitudinal data were gathered at 10- and 11-year intervals. The study examined whether dietary habits at each time point or the changes taking place in dietary habits between time points were associated with age or marital status. Our research questions were:
-
1. How do adults’ dietary habits change over 21 years?
-
2. Are dietary habits associated with age in later life?
-
3. Are dietary habits associated with marital status and changes in it in later life?
Methods
Participants
The participants were first examined as part of the FINMONICA( Reference Vartiainen, Puska and Jousilahti 20 , 21 ) (Monitoring Trends and Determinants in Cardiovascular Disease) population-based, cross-sectional risk factor survey in 1982 in Eastern Finland. In 1991 the 299 women examined in 1982 were invited for re-examinations. Between October 1991 and March 1992, 202 women from the original cohort were re-examined at 10-year follow-up, and in 2003, a total of 113 women from the original cohort were examined at the 21-year follow-up. Details of non-participation have been presented in an earlier paper( Reference Hassinen, Komulainen and Lakka 22 ). Complete data from all three assessments were available for 103 women. To describe the changes within smaller age bands we formed two age groups within the cohort: 50–54 years and 55–60 years. Marital status was classified based upon marital status as married (including those who remarried), single/widowed by 1982 (due to low numbers of divorced or separated, respondents who did not remarry have been merged with the widowed population) and widowed after 1982. Data on sociodemographic characteristics (Table 1) were collected via a self-administered questionnaire with standardized questions from the national surveys. The study protocol was approved by the Ethics Committee of the University of Kuopio. All participants provided written informed consent.
Sociodemographic characteristics of the participants (%, except for age which is in years) by age group and study year: 103 Finnish women, FINMONICA population-based risk factor survey
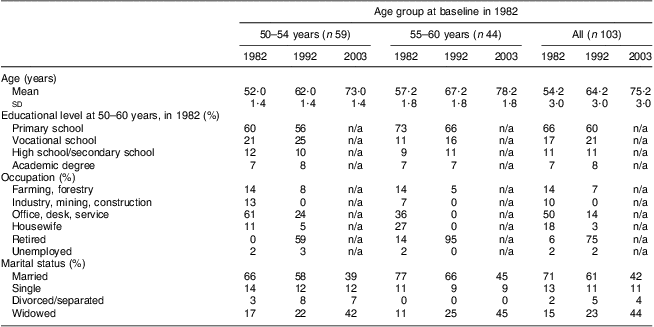
| Age group at baseline in 1982 | |||||||||
| 50–54 years (n 59) | 55–60 years (n 44) | All (n 103) | |||||||
| 1982 | 1992 | 2003 | 1982 | 1992 | 2003 | 1982 | 1992 | 2003 | |
| Age (years) | |||||||||
| Mean | 52·0 | 62·0 | 73·0 | 57·2 | 67·2 | 78·2 | 54·2 | 64·2 | 75·2 |
| sd | 1·4 | 1·4 | 1·4 | 1·8 | 1·8 | 1·8 | 3·0 | 3·0 | 3·0 |
| Educational level at 50–60 years, in 1982 (%) | |||||||||
| Primary school | 60 | 56 | n/a | 73 | 66 | n/a | 66 | 60 | n/a |
| Vocational school | 21 | 25 | n/a | 11 | 16 | n/a | 17 | 21 | n/a |
| High school/secondary school | 12 | 10 | n/a | 9 | 11 | n/a | 11 | 11 | n/a |
| Academic degree | 7 | 8 | n/a | 7 | 7 | n/a | 7 | 8 | n/a |
| Occupation (%) | |||||||||
| Farming, forestry | 14 | 8 | n/a | 14 | 5 | n/a | 14 | 7 | n/a |
| Industry, mining, construction | 13 | 0 | n/a | 7 | 0 | n/a | 10 | 0 | n/a |
| Office, desk, service | 61 | 24 | n/a | 36 | 0 | n/a | 50 | 14 | n/a |
| Housewife | 11 | 5 | n/a | 27 | 0 | n/a | 18 | 3 | n/a |
| Retired | 0 | 59 | n/a | 14 | 95 | n/a | 6 | 75 | n/a |
| Unemployed | 2 | 3 | n/a | 2 | 0 | n/a | 2 | 2 | n/a |
| Marital status (%) | |||||||||
| Married | 66 | 58 | 39 | 77 | 66 | 45 | 71 | 61 | 42 |
| Single | 14 | 12 | 12 | 11 | 9 | 9 | 13 | 11 | 11 |
| Divorced/separated | 3 | 8 | 7 | 0 | 0 | 0 | 2 | 5 | 4 |
| Widowed | 17 | 22 | 42 | 11 | 25 | 45 | 15 | 23 | 44 |
n/a, not asked this year.
Dietary habits
An indicator of dietary habits was formed from answers to five multiple-choice questions on the self-administered questionnaire( Reference Vartiainen, Puska and Jousilahti 20 , 21 ). The following choices within foods typically raising cardiovascular and metabolic disease risk in the Finnish diet( Reference Pietinen, Lahti-Koski and Vartiainen 7 , Reference Vartiainen, Jousilahti and Alfthan 23 ) were assigned one risk point and summed up to form a dietary risk score: (i) saturated fat from milk (whole milk or low-fat milk); (ii) saturated fat spreads on bread (butter, or butter and vegetable oil mix); (iii) saturated fat used in cooking (hard margarine, butter, or butter and vegetable oil mix); (iv) eggs, boiled, fried or in an omelette, more than once weekly; and (v) high sugar intake in coffee and tea (more than 8 lumps/teaspoons per d, 24 g). Each item scored one risk point, and the total dietary risk score ranged from 0 to 5. Each had been the focus of health promotion messages and dietary guidelines in Finland at the time of the study( Reference Vartiainen, Jousilahti and Alfthan 23 , Reference Prättälä 24 ).
The dietary risk score used in our study provides a simple indicator of dietary change over time in this cohort. It is not intended for the evaluation of overall diet or nutritional quality of the diet. To some extent it reflects the intake of saturated fat, cholesterol and sugar as indicated by its association with the 1992 nutritional intake data based upon 7 d dietary records from the same cohort (n 189) and analysed by Nutrica (Micro Nutrica, Research Centre of the Social Insurance Institution, Turku, Finland). Correlation coefficients between dietary risk score and SFA intake as a percentage of total energy (r = 0·62), PUFA intake as a percentage of energy (r = 0·40), cholesterol density (intake per MJ energy; r = 0·36) and sugar intake as a percentage of energy (r = 0·16) were all significant at P = 0·01 level. In a regression analysis to predict the 1992 dietary risk score, the above four estimates of nutrient intake accounted for 43 % of the variance in the score (F(4,183) = 34·9, P = 0·0001, R = 0·66, R 2 = 0·43). However, it is not intended for use in future epidemiological studies to predict risk of chronic disease; for that, validated indices are available( Reference Tourlouki, Matalas and Panagiotakos 2 , Reference Maynard, Ness and Abraham 25 – Reference DiBello, Kraft and McGarvey 27 ).
Statistical analysis
Level of education and the main occupation in adult life are presented in Table 1 to describe the data; but with or without adjusting for age, they were not significantly associated with change in dietary risk score in this cohort and so were not used in further analysis. To examine the change in risk scores within and between the younger and older age groups (50–54 years and 55–60-years at baseline) we used a longitudinal analysis (repeated-measures ANOVA, general linear model in SPSS version 15) followed by comparisons between the two groups at each time point. The association between marital status and dietary risk score was examined in a similar manner using a general linear model first within and between the marital groups and next between the groups at each time point. As age was associated with change in marital status, we adjusted the general linear model for age. All statistical analyses were performed using the SPSS for Windows statistical software package version 15 (SPSS Inc., Chicago, IL, USA).
Results
Dietary habits over the 21 years
Table 2 shows how the five foods typically contributing to intakes of SFA, cholesterol and sugar in the Finnish diet, contributed to the dietary risk score at each time point. There was a clear reduction in the proportion of women in both age groups who reported consumption of butter, high-fat milk products, eggs and sugar and an increase in the consumption of vegetable oils in cooking, low-fat and fat-free milk products and spreads containing PUFA. The total number of dietary risk points was reduced from 2·8 (sd 1·2) in 1982 to 1·6 (sd 1·2) in 2003. Table 2 also shows how a larger proportion of younger-old than older-old women improved their dietary habits during the 21-year follow-up. While the majority of the older age women improved their dietary habits, they also showed greater increases in unhealthy choices (Table 2).
Proportion reporting food choices contributing one risk point to the dietary risk scoreFootnote * by age group and study year, total number of risk points, and the number and proportion reporting change in dietary risk score from 1982 to 2003: 103 Finnish women, FINMONICA population-based risk factor survey
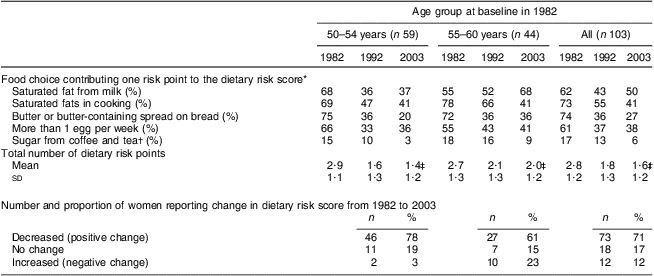
| Age group at baseline in 1982 | |||||||||
| 50–54 years (n 59) | 55–60 years (n 44) | All (n 103) | |||||||
| 1982 | 1992 | 2003 | 1982 | 1992 | 2003 | 1982 | 1992 | 2003 | |
| Food choice contributing one risk point to the dietary risk score* | |||||||||
| Saturated fat from milk (%) | 68 | 36 | 37 | 55 | 52 | 68 | 62 | 43 | 50 |
| Saturated fats in cooking (%) | 69 | 47 | 41 | 78 | 66 | 41 | 73 | 55 | 41 |
| Butter or butter-containing spread on bread (%) | 75 | 36 | 20 | 72 | 36 | 36 | 74 | 36 | 27 |
| More than 1 egg per week (%) | 66 | 33 | 36 | 55 | 43 | 41 | 61 | 37 | 38 |
| Sugar from coffee and tea† (%) | 15 | 10 | 3 | 18 | 16 | 9 | 17 | 13 | 6 |
| Total number of dietary risk points | |||||||||
| Mean | 2·9 | 1·6 | 1·4‡ | 2·7 | 2·1 | 2·0‡ | 2·8 | 1·8 | 1·6‡ |
| sd | 1·1 | 1·3 | 1·2 | 1·3 | 1·3 | 1·2 | 1·2 | 1·3 | 1·2 |
| Number and proportion of women reporting change in dietary risk score from 1982 to 2003 | |||||||||
| n | % | n | % | n | % | ||||
| Decreased (positive change) | 46 | 78 | 27 | 61 | 73 | 71 | |||
| No change | 11 | 19 | 7 | 15 | 18 | 17 | |||
| Increased (negative change) | 2 | 3 | 10 | 23 | 12 | 12 | |||
* Dietary risk score was formed by summing up the risk points from the consumption of whole milk or low-fat milk, butter, or butter and vegetable oil mix, saturated fats used in cooking (hard margarine, butter, or butter and vegetable oil mix), more than one egg per week (raw, boiled, fried or in an omelette) and high sugar intake in coffee and tea (more than 8 lumps/teaspoons per d, 24 g).
† More than 8 lumps/teaspoons (total of 24–40 g) per d.
‡ Significant time and age interaction, Wilk's Λ = 0·91, F(2,100) = 4·7, P < 0·05. Significant difference between age groups in 1992 (t = 2·0, P = 0·04) and in 2003 (t = 2·5, P = 0·016). Significant time effect, Wilk's Λ = 0·58, F(2,100) = 35·8, P < 0·0001. Significant differences within both age groups: 1982 v. 1992 and 1982 v. 2003, P < 0·01.
Table 3 shows the frequency of consumption of vegetables and fruit at the time points when these were assessed: vegetables in 1982 and 2003; and fruit only in 1982. Frequency of consuming vegetables tended to decrease from 1982 to 2003 in the older age group, but increased in the younger one (Wilcoxon test between consumption on 0–2 d/week v. 3–7 d/week: z = −2·309, P = 0·021). However, the proportion of women reporting vegetable consumption 6–7 d/week showed little change at 24 % on average in 2003. Table 4 shows the results by marital group. Only within those women who remained married throughout the study did the number consuming vegetables on 3–7 d/week show some increase, but this did not reach statistical significance (Wilcoxon test between consumption on 0–2 d/week v. 3–7 d/week: z = −1·667, P = 0·096).
Frequency of vegetable and fruit/berry consumption by age group: 103 Finnish women, FINMONICA population-based risk factor survey
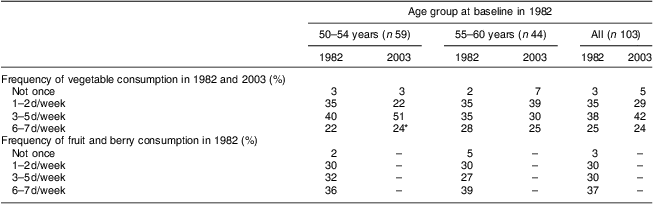
| Age group at baseline in 1982 | ||||||
| 50–54 years (n 59) | 55–60 years (n 44) | All (n 103) | ||||
| 1982 | 2003 | 1982 | 2003 | 1982 | 2003 | |
| Frequency of vegetable consumption in 1982 and 2003 (%) | ||||||
| Not once | 3 | 3 | 2 | 7 | 3 | 5 |
| 1–2 d/week | 35 | 22 | 35 | 39 | 35 | 29 |
| 3–5 d/week | 40 | 51 | 35 | 30 | 38 | 42 |
| 6–7 d/week | 22 | 24* | 28 | 25 | 25 | 24 |
| Frequency of fruit and berry consumption in 1982 (%) | ||||||
| Not once | 2 | – | 5 | – | 3 | – |
| 1–2 d/week | 30 | – | 30 | – | 30 | – |
| 3–5 d/week | 32 | – | 27 | – | 30 | – |
| 6–7 d/week | 36 | – | 39 | – | 37 | – |
*Change between 0–2 d/week and 3–7 d/week within the 50–54-year-olds, Wilcoxon test, z = −2·309, P = 0·021.
Frequency of vegetable and fruit consumption by marital group: 103 Finnish women, FINMONICA population-based risk factor survey
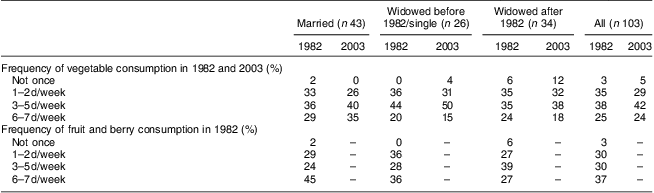
| Married (n 43) | Widowed before 1982/single (n 26) | Widowed after 1982 (n 34) | All (n 103) | |||||
| 1982 | 2003 | 1982 | 2003 | 1982 | 2003 | 1982 | 2003 | |
| Frequency of vegetable consumption in 1982 and 2003 (%) | ||||||||
| Not once | 2 | 0 | 0 | 4 | 6 | 12 | 3 | 5 |
| 1–2 d/week | 33 | 26 | 36 | 31 | 35 | 32 | 35 | 29 |
| 3–5 d/week | 36 | 40 | 44 | 50 | 35 | 38 | 38 | 42 |
| 6–7 d/week | 29 | 35 | 20 | 15 | 24 | 18 | 25 | 24 |
| Frequency of fruit and berry consumption in 1982 (%) | ||||||||
| Not once | 2 | – | 0 | – | 6 | – | 3 | – |
| 1–2 d/week | 29 | – | 36 | – | 27 | – | 30 | – |
| 3–5 d/week | 24 | – | 28 | – | 39 | – | 30 | – |
| 6–7 d/week | 45 | – | 36 | – | 27 | – | 37 | – |
Are dietary habits associated with age?
Dietary habits as reflected by the dietary risk scores were associated with age in 1992 (r = 0·27, P = 0·006, n 103) and 2003 (r = 0·29, P = 0·003, n 103), but not in 1982 (r = 0·002, P = 0·982, n 103). Thus in 1982, irrespective of age, all of the respondents made similar food choices indicating a time effect; whereas in 1992 and 2003, risk scores were lower among younger respondents. Within the 1992 and 2003 data, as indicated by linear regression analysis, when age increased by 1 year, dietary risk score increased by 0·12 points, indicating an age effect at these time points.
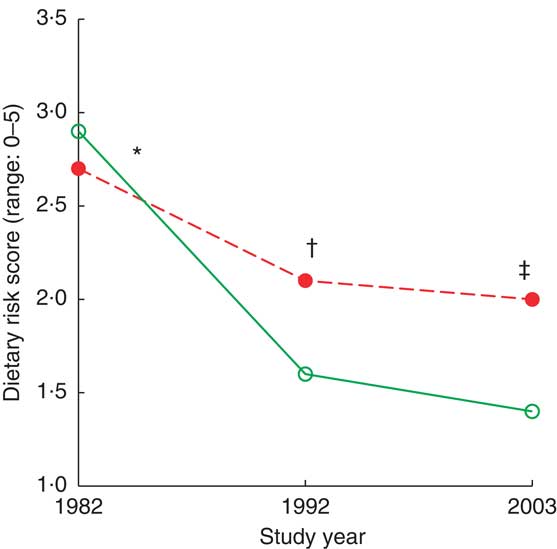
Longitudinal change in dietary risk score was significant within and between the age groups (interaction statistics: Wilk's Λ = 0·91, F(2,100) = 4·7, P = 0·011; Fig. 1). Within both age groups, the changes were significant between time points of 1982 and 1992, and between 1982 and 2003 (P < 0·01; Table 2), and the difference between age groups was significant in 1992 (t = 2·0, P = 0·04) and 2003 (t = 2·5, P = 0·016).
(colour online) Dietary risk score by age group (![]() , 50–54 years;
, 50–54 years; ![]() , 55–59 years) and study year among 103 Finnish women, FINMONICA population-based risk factor survey. *Longitudinal interaction statistics: Wilk's Λ = 0·91, F(2,100) = 4·7, P = 0·011. †Within both age groups, change from 1982 to 1992 and from 1982 to 2003 was statistically significant, P = 0·045. ‡Difference between age groups in 1992 (t = 2·0, P = 0·04) and 2003 (t = 2·5, P = 0·016)
, 55–59 years) and study year among 103 Finnish women, FINMONICA population-based risk factor survey. *Longitudinal interaction statistics: Wilk's Λ = 0·91, F(2,100) = 4·7, P = 0·011. †Within both age groups, change from 1982 to 1992 and from 1982 to 2003 was statistically significant, P = 0·045. ‡Difference between age groups in 1992 (t = 2·0, P = 0·04) and 2003 (t = 2·5, P = 0·016)
Are dietary habits associated with marital status in later life?
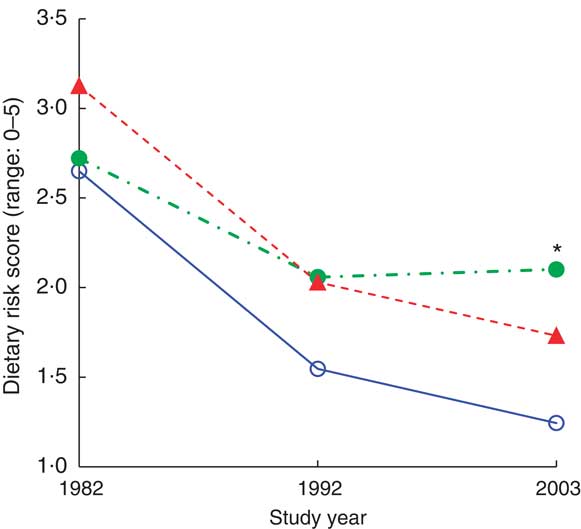
In our cohort of 103 women, those who were married showed a steadier decline in dietary risk score over the three time points (improvement in the reported dietary habits) than women who were single or widowed before 1982 and women who were widowed after 1982 (Wilk's Λ = 0·87, F(6,196) = 2·36, P = 0·0032). Further analysis comparing the three marital groups (Table 4, Fig. 2) indicated that women who were single or widowed before 1982 had higher dietary risk scores in 2003 than women who remained married for the 21 years of follow-up. Women who became widowed after 1982 tended to have the highest dietary risk scores in 1982, while women who were single or widowed before 1982 reported the highest scores in 2003 in spite of a similar score to the other groups in 1982 (Table 5, Fig. 2). Differences in vegetable and fruit consumption between marital groups were statistically non-significant at and between all time points (Table 3), and the frequency of vegetable consumption showed improvement only among married women as discussed earlier (Table 4).
(colour online) Dietary risk score by marital status (![]() , married;
, married; ![]() , widowed before 1982/single;
, widowed before 1982/single; ![]() , widowed after 1982) during the 21-year follow-up, adjusted for age, among 103 Finnish women, FINMONICA population-based risk factor survey. *Significant interaction effect: Wilk's Λ = 0·87, F(6,196) = 2·36, P = 0·032. In 2003, analysis of covariance between groups: F(2,99) = 4·9, P = 0·01, η
2 = 0·09; age accounts for 9·5 % of the variance, P = 0·002; significant difference between married/remarried v. widowed before 1982/single, P = 0·03; and almost significant between married/remarried v. widowed after 1982, P = 0·066
, widowed after 1982) during the 21-year follow-up, adjusted for age, among 103 Finnish women, FINMONICA population-based risk factor survey. *Significant interaction effect: Wilk's Λ = 0·87, F(6,196) = 2·36, P = 0·032. In 2003, analysis of covariance between groups: F(2,99) = 4·9, P = 0·01, η
2 = 0·09; age accounts for 9·5 % of the variance, P = 0·002; significant difference between married/remarried v. widowed before 1982/single, P = 0·03; and almost significant between married/remarried v. widowed after 1982, P = 0·066
Dietary risk score (mean, standard error and 95 % confidence interval) by year and marital status, adjusted for age: 103 Finnish women, FINMONICA population-based risk factor survey
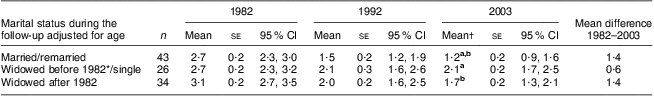
| 1982 | 1992 | 2003 | |||||||||
| Marital status during the follow-up adjusted for age | n | Mean | se | 95 % CI | Mean | se | 95 % CI | Mean† | se | 95 % CI | Mean difference 1982–2003 |
| Married/remarried | 43 | 2·7 | 0·2 | 2·3, 3·0 | 1·5 | 0·2 | 1·2, 1·9 | 1·2 a,b | 0·2 | 0·9, 1·6 | 1·4 |
| Widowed before 1982*/single | 26 | 2·7 | 0·2 | 2·3, 3·2 | 2·1 | 0·3 | 1·6, 2·6 | 2·1 a | 0·2 | 1·7, 2·5 | 0·6 |
| Widowed after 1982 | 34 | 3·1 | 0·2 | 2·7, 3·5 | 2·0 | 0·2 | 1·6, 2·5 | 1·7 b | 0·2 | 1·3, 2·1 | 1·4 |
a,bMean values within a column with the same superscript letters were significantly different: married/remarried v. widowed before 1982/single, P = 0·03; or approached significance: married/remarried v. widowed after 1982, P = 0·066.
*Includes two women who had divorced or separated before 1982.
†In 2003, analysis of covariance between groups: F(2,99) = 4·9, P = 0·01, η 2 = 0·09; age accounts for 9·5 % of the variance, P = 0·002.
Discussion
The present longitudinal study showed how women aged 50–60 years in 1982 in Eastern Finland changed their dietary habits during a 21-year follow-up. Change, as indicated by the reduction in the five-item dietary risk score, was generally in a positive direction. Age was an important factor in explaining dietary change among this adult female population: being from the younger end of the 10-year cohort was associated with more positive changes in dietary habits, which lends support to previous cross-sectional( Reference Sulander, Helakorpi and Rahkonen 4 ) and longitudinal studies in the older population( Reference Garry, Hunt and Koehler 13 – Reference Toffanello, Inelmen and Minicuci 16 ). Summarising the association between dietary habits and marital status, we can say that trends in the reduction of dietary risk scores were similar across marital status except for women who were single or widowed before 1982, the start of the follow-up, with the direction of the reduction being less pronounced among the latter; this supports the need for further studies on the effect of marital status, time of bereavement and ensuing living arrangements in relation to dietary intake as suggested by Eng et al.( Reference Eng, Kawachi and Filzmaurice 18 ) and Kallio et al.( Reference Kallio, Koskinen and Prättälä 28 ).
In terms of our first research question regarding longitudinal change in dietary habits, there was a remarkable reduction in the consumption of butter, high-fat milk products, eggs and sugar and an increase in the consumption of vegetable oils in cooking, low-fat and fat-free milk products and spreads containing PUFA. Such changes are consistent with national cross-sectional trends, which show the consumption of skimmed milk, vegetables, PUFA-containing and reduced-fat spreads and cooking oil going up, while whole milk, semi-skimmed milk and meat consumption has gone down during the past two decades( Reference Pietinen, Lahti-Koski and Vartiainen 7 , Reference Valsta, Tapanainen and Sundvall 29 ). Most of these positive changes have been attributed to improvements in nutrition policy, food availability and increased public awareness of the link between diet and chronic diseases( Reference Pietinen, Lahti-Koski and Vartiainen 7 , Reference Valsta, Tapanainen and Sundvall 29 , Reference Männistö, Laatikainen and Helakorpi 30 ).
Most of the improvement in dietary scores in our study took place between 1982 and 1992, which questions cross-sectional data showing most of the improvement in dietary habits among older women taking place from the mid-1990s to the early 2000s( Reference Sulander, Helakorpi and Rahkonen 4 ). This may reflect an increased availability of scientific evidence and advice between the first and second surveys from Eastern Finland, the proximity of the North Karelia project( Reference Pietinen, Lahti-Koski and Vartiainen 7 , Reference Vartiainen, Jousilahti and Alfthan 23 ), or the use of different study designs and different indicators.
Difference in study design, we feel, is in our favour, as while repeated cross-sectional data can show changes in diet due to policy and food availability at a given time and location, longitudinal data can highlight effects due to the process of ageing. The difference in dietary score, however, makes it impossible to directly compare results: the indicator used in Sulander et al.'s( Reference Sulander, Helakorpi and Rahkonen 4 ) study consisted of only three variables (milk, bread spread and vegetables/fruit), whereas ours consisted of five foods and did not include the consumption of vegetables/fruit as these were not assessed at all time points. In spite of the fact that the availability and use of vegetables (other than potato) in the Finnish diet gained in prominence after the late 1980s( Reference Sulander, Helakorpi and Nissinen 12 , Reference Prättälä 24 , Reference Männistö, Laatikainen and Helakorpi 30 ), vegetable consumption in our cohort showed little improvement, save for the younger end, and more than half of the cohort (63 %) reported consuming vegetables on fewer than 6 d/week even in 2003. In future studies this may be one of the main variables of interest in predicting health outcomes.
Our study has two main limitations: the use of a dietary risk score that has not been validated and the selective drop-out in our cohort. First, we chose to use this aggregate dietary risk score because, for the purpose of analysing and describing change in dietary habits in our cohort in a collated manner, it provided the only available method. Comparable diet-related data were collected only through multiple-choice questions on a questionnaire designed for large-scale epidemiological surveys( Reference Vartiainen, Puska and Jousilahti 20 , 21 ). This type of data can be used to estimate intake of certain nutrients, especially SFA, but we were interested in describing change in more than one variable. These questions are easy to respond to and across the three time points formed a relatively reliable method for data collection in our ageing cohort when compared with more detailed methods of dietary assessment. It needs to be pointed out that our aggregate score is not intended for use in risk factor studies. Our study was interested in the associations between age, marital status and dietary habits. Our findings provide more scientific evidence for those interested in the factors affecting people's food consumption in later life. Although adequate nutrition is a prerequisite to health throughout the life course( Reference Darnton-Hill, Nishida and James 31 , Reference Maynard, Gunnell and Ness 32 ), health orientation may not play a major role in dietary choice and may increasingly be surpassed by social, ethical and environmental values( Reference Cannon and Leitzmann 33 ). Further research in this field would be supported by qualitative methodology to investigate how and why dietary habits may be nurtured or changed over the adult life course.
Second, as in all longitudinal studies, the sample can easily become biased due to selective drop-out. In our cohort, women who reported to the two follow-up examinations were healthier and lived closer to the urban environment than those who did not; thus, they may have been among the first to make improvements to their diets as healthier options became available. For example, prior to 1982 there were very few low-fat products on the market, unlike in 1992 and 2003, when more scientific evidence on the link between diet and cardiovascular and other chronic diseases had become available( Reference Valsta, Tapanainen and Sundvall 29 ). The small sample size in our study also sets limits to finding statistically significant changes across age and marital groups over time.
What do our findings tell us? As both the younger and older age groups changed their dietary habits in the same direction over time, we can conclude that this represents a time effect reflecting the changes in food production (availability of healthier options), policy and health promotion initiatives as suggested by cross-sectional studies over the same years( Reference Prättälä 24 , Reference Valsta, Tapanainen and Sundvall 29 , Reference Vartiainen, Laatikainen and Peltonen 34 ). The difference seen in the amount of change in dietary habits between the two age groups indicates an ageing effect according to which people may choose to change their dietary habits according to personal requirements as they age. Understanding changes in dietary habits may require a closer study of the socio-historical context of the results. For example, slower improvement in dietary habits between 1990 and 2003 could be related to the economic recession that took place in the 1990s( Reference Prättälä, Koskinen and Martelin 35 ), pricing policy or availability of certain types of foods in local shops( Reference Vartiainen, Puska and Jousilahti 20 , Reference Prättälä 24 , Reference Valsta, Tapanainen and Sundvall 29 , Reference Männistö, Laatikainen and Helakorpi 30 ), or it could be related to changes in nutritional guidance, personal preference or belief( Reference Gustafsson and Sidenvall 19 ). At the time of our second survey, discussion about risk of inadequate vitamin D intake among the older population was heightened in Finland, vitamin D fortification of skimmed milk was started( 36 ), and consequently some of our women may have chosen to hold on to ‘real milk’ in spite of its higher fat content.
Our finding, that dietary habits were healthier among couples than among single older female respondents, varies from that reported in the SENECA study (Survey in Europe on Nutrition and the Elderly; a Concerted Action) of 70- to 75-year-old men and women in small towns across Europe in the late 1980s to the late 1990s( Reference Pearson, Schlettwein-Gsell and Van Staveren 37 ), but it concurs with other prior research( Reference Sulander, Helakorpi and Rahkonen 4 , Reference Eng, Kawachi and Filzmaurice 18 , Reference Roos, Lahelma and Virtanen 38 ). One cross-sectional study( Reference Roos, Lahelma and Virtanen 38 ) has shown among younger women that marital status may not be as strong a predictor of healthy eating habits as parental status. Women with children tend to have healthier diets due to their parental role( Reference Roos, Lahelma and Virtanen 38 , Reference Devine and Sandström 39 ). Women cooking for their marital partner in their older years may have remained in the ‘parental’ pattern that led to healthier diets in younger adulthood( Reference Roos, Lahelma and Virtanen 38 – Reference Kemmer, Anderson and Marshall 40 ). In most Finnish households women still did most of the cooking in the 1980s (at the start of our study) through to the 21st century( Reference Ekström and Fürst 41 ). In our cohort of older women, 99 % of the respondents were responsible for the cooking in their household. The interaction of cohort, gendered roles and sex is an area indicated for further study, as is a possible interaction between male and female mortality and poor diet.
Based upon our findings, we can conclude that a strong influence on change in dietary habits was exerted by the relationship between age and marital status. Tailored approaches to supporting older people in adopting and sustaining healthy dietary practices depending upon age and especially in relation to time after bereavement are needed.
Acknowledgements
This research received funding from the Ministry of Education (179/722/2003) and the Academy of Finland (101878/2002). The authors declare that they have no conflict of interest. Each author contributed to the design and execution of the study and/or analysis and participated in the writing process as follows: I.H., 2002 nutritional data collection methodology and analysis, questionnaire design; R.P., data analysis phase; K.P., 2002 questionnaire design and data analysis phase; R.M., 2002 nutritional data analysis; P.K., 2002 questionnaire design, data collection and analysis; M.H., 2002 questionnaire design, data collection and analysis; R.R., 1982–2002 study design and supervision, data collection and analysis. The authors thank Professor Aulikki Nissinen for her leadership role, enduring enthusiasm and continuing guidance during the entire follow-up study.


