


Since the discovery of a link between maternal and early-life malnutrition and an increased risk to the health of adult offspring, different nutritional manipulations (supplementation or restriction) have been tested to try understand the role of individual components in this relationship(Reference Holemans, Aerts and Van Assche1,Reference Wu and Suzuki2) . It is known that nutrition state influences epigenetic regulation(Reference Feil3) and that some nutrients can directly affect the methionine–homocysteine pathway, with s-adenosylmethionine (SAM) being an important product in this respect. SAM availability during early development may affect methylation patterns that lead to short- and long-term consequences, as it is the major donor of methyl radicals for the methylation of DNA, RNA, proteins and other compounds(Reference Kumar, Palfrey and Pathak4).
s-Adenosylhomocysteine (SAH) is the product of SAM demethylation and is further hydrolysed to adenosine and homocysteine (HCY) in a reversible reaction, wherein the thermodynamics favour SAH synthesis rather than HCY production (whose excess is related to oxidative stress). In the transsulphuration pathway, HCY is catabolised by a series of pyridoxine-dependent reactions that result in cysteine (CYS), which may be further used in GSH synthesis and other processes. Moreover, several vitamins such as riboflavin, folate, cobalamin and choline, as well as methionine, have an effect on the availability of SAM by affecting the remethylation of HCY to methionine(Reference Kumar, Palfrey and Pathak4).
The relationship between maternal folate and cobalamin deficiency and increased risk of neural tube defects is well established(Reference Molloy, Kirke and Troendle5). In addition, in a previous study by our group looking at the consequences of imbalances in this pathway, we observed that riboflavin, folate, cobalamin and choline deficiency during early development resulted in a long-term reduction in the weight of perigonadal white adipose tissue (PWAT) in the male mice offspring(Reference Cavalcante-Silva, Fernandes and Haseyama6). These findings seem to be related to a decrease in adipose tissue expansion during early development, such as that observed in undernourished mice during the lactation phase(Reference Kozak, Newman and Chao7).
As different aspects of early B-vitamin deficiency and their association with morphometric and biochemical changes have already been evaluated(Reference Cavalcante-Silva, Fernandes and Haseyama6,Reference Molina, Medici and Taranto8) , in this study, we focus on assessing the consequences of methionine supplementation during early development. The effect of methionine restriction has been studied in adult mice and has been shown to be associated with lower body and fat tissue weight and increased longevity(Reference Malloy, Krajcik and Bailey9,Reference Miller, Buehner and Chang10) . Thus, to better understand the consequences behind manipulations affecting the availability of the methyl radical, the goal of this study was to evaluate the effects of methionine supplementation during pregnancy and pregnancy/lactation on biometric, biochemical and behavioural parameters of the offspring.
Materials and methods
Animal treatment protocols
All animal experiments were conducted in accordance with the guidelines established by the Ethical and Practical Principles of the Use of Laboratory Animals(Reference Andersen and Tufik11) and approved by the Institutional Animal Care and Use Committee of the Universidade Federal de São Paulo (no. 1169/08). Adult Swiss female mice were obtained from the Centro de Desenvolvimento de Modelos Experimentais para Medicina e Biologia and were housed at the Department of Psychobiology facility in a ventilated system (365 × 207 × 140 mm, Tecniplast, Milan, Italy) with 3–5 animals/cage, maintained under standard laboratory conditions (12-h light–12-h dark cycle – lights on at 07.00 hours, controlled temperature (23 (sd 2)°C), humidity of 70–75 %, and access to food and water ad libitum). One month before pregnancy, twenty-seven female mice were randomly distributed into two groups: (a) standard diet (AIN-93M; n 10) and (b) standard diet supplemented with 1 % l-methionine (M9625, Sigma-Aldrich®) in water (AIN-93M + 1 % methionine; n 17). This concentration was previously tested and shown to induce moderate hyperhomocysteinaemia(Reference Zhou, Werstuck and Lhotak12,Reference de Rezende and D’Almeida13) . The decision to have a higher number of animals in the experimental group was based on the observation that there is decreased fertility and litter size in females with hyperhomocysteinaemia(Reference Cavalcante-Silva, Fernandes and Haseyama14). From blood samples collected from the submandibular vein, homocysteine levels of both groups were dosed after 20 d of treatment as an indirect proxy of increased methionine intake. A lancet (depth of lancet needle – 4 mm) was used to access the submandibular vein, which allows about 0·2 ml of blood to be promptly drawn without anaesthesia use(Reference Golde, Gollobin and Rodriguez15). One month after methionine supplementation was completed, male mice were placed in the females’ home cages for mating (one male to three to five females). The time interval between blood collection and mating was established in order to allow the recovery of blood volume(16) and minimise the stress involved in the collection procedure, making possible the normal conditions for mating. Although the male mice had access to the supplemented water during mating, this period was insufficient to cause any effect on the sperm involved in the fertilisation since the complete spermatogenic cycle was established to be about 8·6 d(Reference Phillips, Gassei and Orwig17). Gestational day zero was determined after confirmation of the presence of sperm in the vaginal smear.
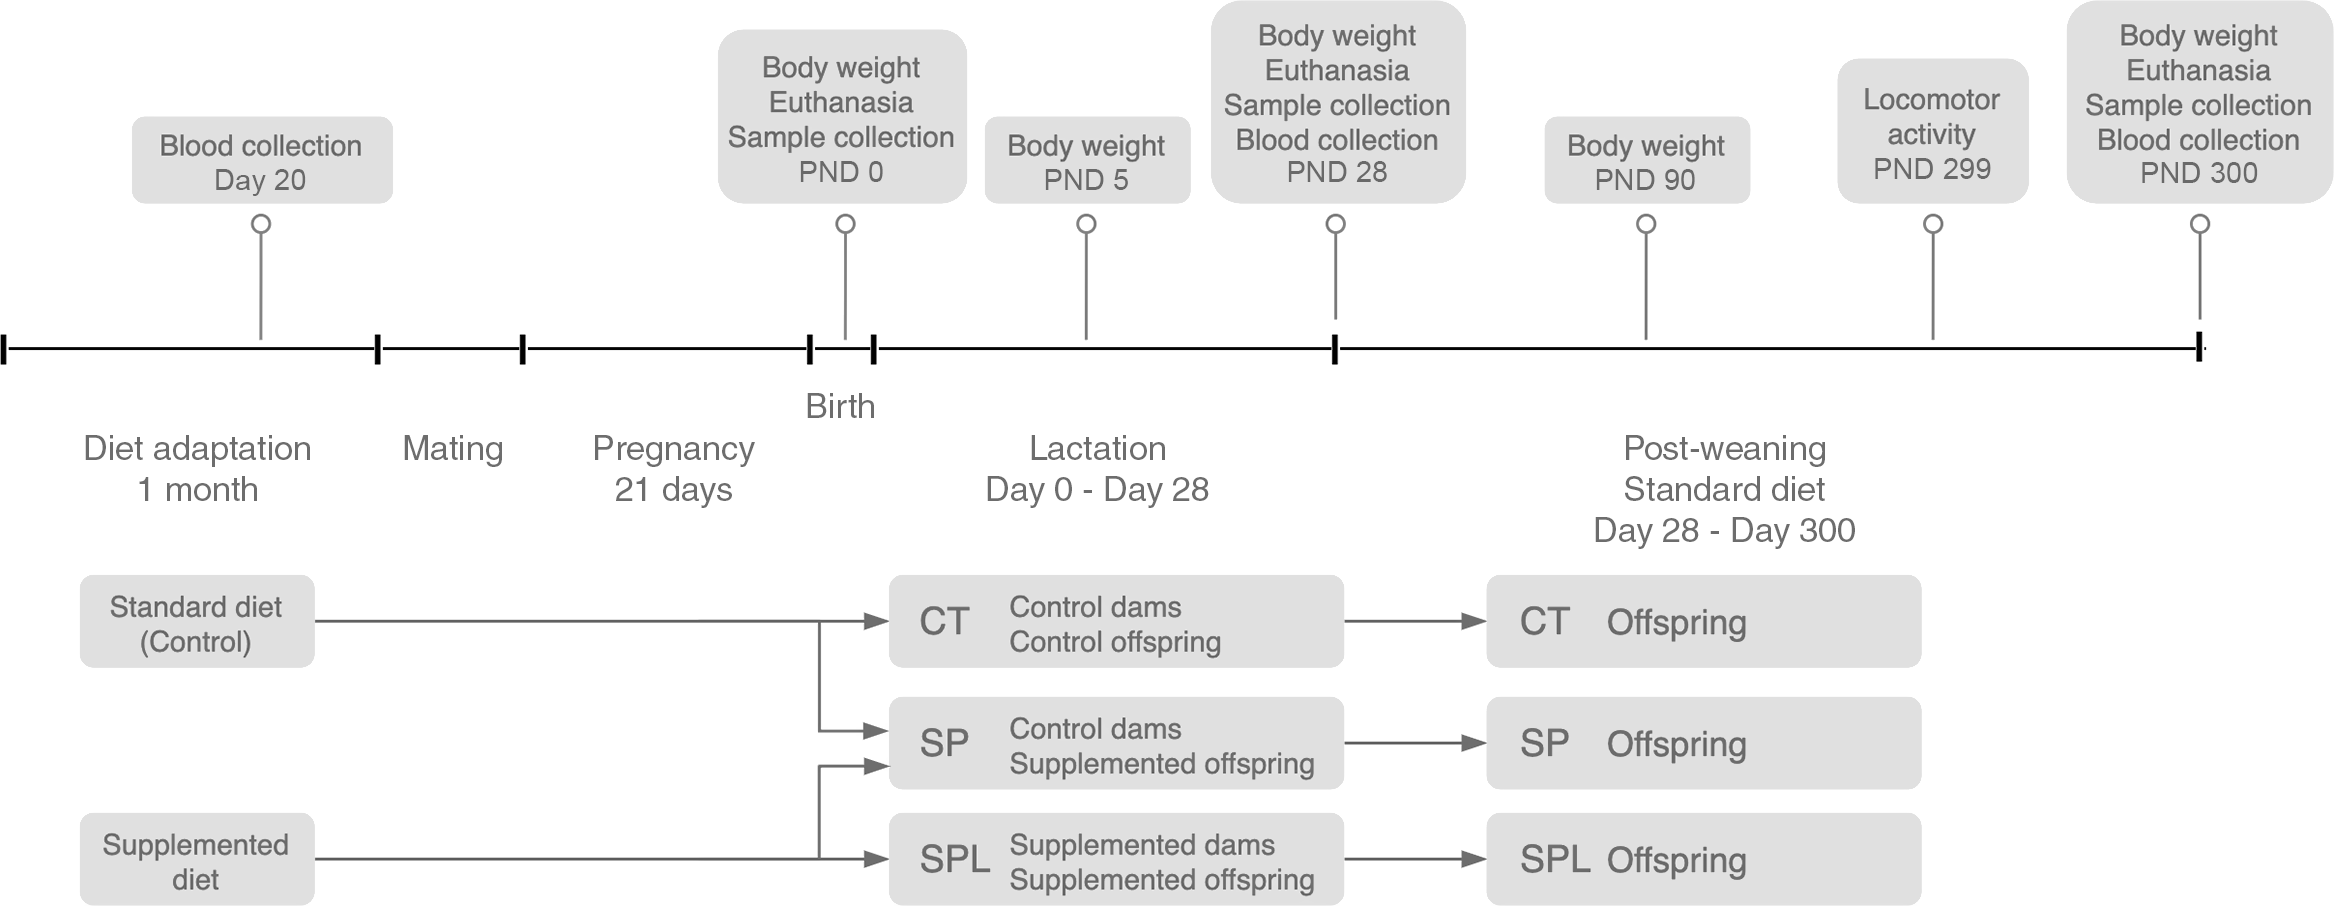
Fifteen days later, the female mice were placed in individual cages and, after birth, all offspring were weighed (control: Females (n 51), Males (n 30); supplemented during pregnancy: Females (n 63), Males (n 55) and distributed into three groups: Control (CT) – the offspring of the dams that received a standard diet; the methionine supplementation during pregnancy group (SP) – the offspring of the dams receiving methionine supplementation during pregnancy and breastfed by CT dams; and the methionine supplementation during pregnancy and lactation group (SPL) – the offspring of the dams which continued to receive supplementation during lactation). The SP offspring were breastfed by CT dams. The adoption bias by the SP group was adjusted by performing adoptions within each group, CT and SPL. After distribution, the number of animals in each offspring group was CT = 53, SP = 61 and SPL = 44. Weaning occurred on postnatal day (PDN) 28, after which all the offspring groups were placed on a standard diet. Schematic of the overall study design is presented in Fig. 1.
Overall study design. CT, control; SP, supplemented during pregnancy; SPL, supplemented during pregnancy and lactation; PND, postnatal day. Supplemented diet = standard diet + 1 % l-methionine in water.
Locomotor activity box
Locomotor activity was assessed using Opto-Varimex locomotor activity cages (20 × 30 × 40 cm), surrounded by horizontal photoelectrical sensors (Columbus Instruments). Recording was performed at PND 299 at regular intervals (every 5 min, for 30 min).
Sample collection
Animals of both sexes were evaluated at PND 0, 5, 28, 90 and 300. The analyses at these time points allowed us to follow the effects of methionine supplementation during pregnancy and pregnancy/lactation in the short term (PND 0, 5 and 28) and in the long term (PND 90 and 300). All animals were euthanised by decapitation, and the total blood was collected in two types of tubes (Becton Dickinson) containing EDTA or heparin. The blood aliquot collected in tubes containing heparin was used for glucose, TAG and cholesterol measurement. Total blood in EDTA was stored on ice for up to 90 min and then centrifuged at 805 g for 10 min at 4°C. Plasma aliquots were stored at −80°C for HCY, CYS and GSH dosages. After the euthanasia, the whole brain was rapidly harvested and stored at −80°C for subsequent SAM, SAH and total GSH analyses/quantification. PWAT, pericardial white adipose tissue, liver, kidney, spleen, heart and brain weight (from animals at PND 28 and PND 300) were determined using an analytical balance (Bioprecisa, Model-FA2104N), accurate to 0·001 g. The PWAT and pericardial white adipose tissue dissections followed the protocol described by Johnson & Hirsch(Reference Johnson and Hirsch18) and Liu et al. (Reference Liu, Fox and Hickson19), respectively. Both blood collection and killing were performed between 08.00 and 12.00 hours.
Blood, plasma and tissue measurements
Glucose, TAG and cholesterol were measured in heparinised blood using the commercially available Accutrend® Plus colorimetric system (Roche).
Plasma HCY, CYS and total GSH were analysed by HPLC based on the method developed by Pfeiffer et al. (Reference Pfeiffer, Huff and Gunter20) Measurements were performed by fluorescence detection and isocratic elution in a column C18 Luna (5 mm, 150 mm, 64·6 mm), mobile phase (0·06 m sodium acetate, 0·5 % acetic acid, pH 4·7 (adjusted with acetic acid), 2 % methanol) and a flow rate of 1·1 ml/min. The retention time was 3·6 min for CYS; 5·2 for HCY and 9·0 for GSH(Reference da Silva, Fernandes and Haseyama21).
For tissue measurements, total brain or total dissected cortex was homogenised in PBS with the tissue homogenizer T10 basic IKA (Staufen, Germany). Before SAM and SAH injection in the HPLC column (LiChroCart C 18, 5 mm, 250 mm × 4 mm), the protein and debris were precipitated from the total homogenate tissue with HClO4 and centrifuged. The mobile phase consisted of 50 mm sodium phosphate (pH 2·8), 10 mm heptane sulfonate and 10 % acetonitrile used at a flow rate of 1 ml/min. The retention time was 8·7 min for SAH and 13·6 min for SAM detected in a UV wavelength of 254 nm, a technique adapted from Blaise et al. (Reference da Silva, Fernandes and Haseyama21,Reference Blaise, Alberto and Nedelec22) . Total brain GSH measurements were performed using the same method described for measuring total plasma GSH.
Statistical analyses
Sample size was calculated by setting an effect size of 80 % at a level of significance of 5 % (G Power programme 3.1.9.7) and a power of 0·6 for females (n 15) and males (n 15) (Lenhard, W. & Lenhard, A. (2016). Calculation of effect sizes retrieved from: https://www.psychometrica.de/effect_size.html).
Data were analysed using Statistica software, version 10.0 (StatSoft). The concentration of SAH, SAM, GSH, HCY, CYS and SAM:SAH ratio was considered as dependent variables, and the independent variable was the group factor (Control (CT) – the offspring of the dams that received a standard diet; the methionine supplementation during pregnancy group (SP) – the offspring of the dams receiving methionine supplementation during pregnancy and breastfed by CT dams; and the methionine supplementation during pregnancy and lactation group (SPL), for females and males separately (sex was not considered as a variable), at every PND when measured). Body weight and the absolute and relative weights of the organs were also considered as dependent variables, adopting the same independent variable described above. For the behavioural analyses, locomotor activity in the 30 min tested was considered as a dependent variable (for females and males separately) and the group as the independent variable. The sex of the animals was not considered as a variable, so the analyses were carried out separately for females and males.
All dependent variables were tested for normality (Shapiro–Wilk test), and when non-normal distribution was detected, the data were standardised by z-score before proceeding with the analyses. A general linear model was applied with a significance level of 5 % (P < 0·05). Duncan’s post hoc test was used.
Results
Dams
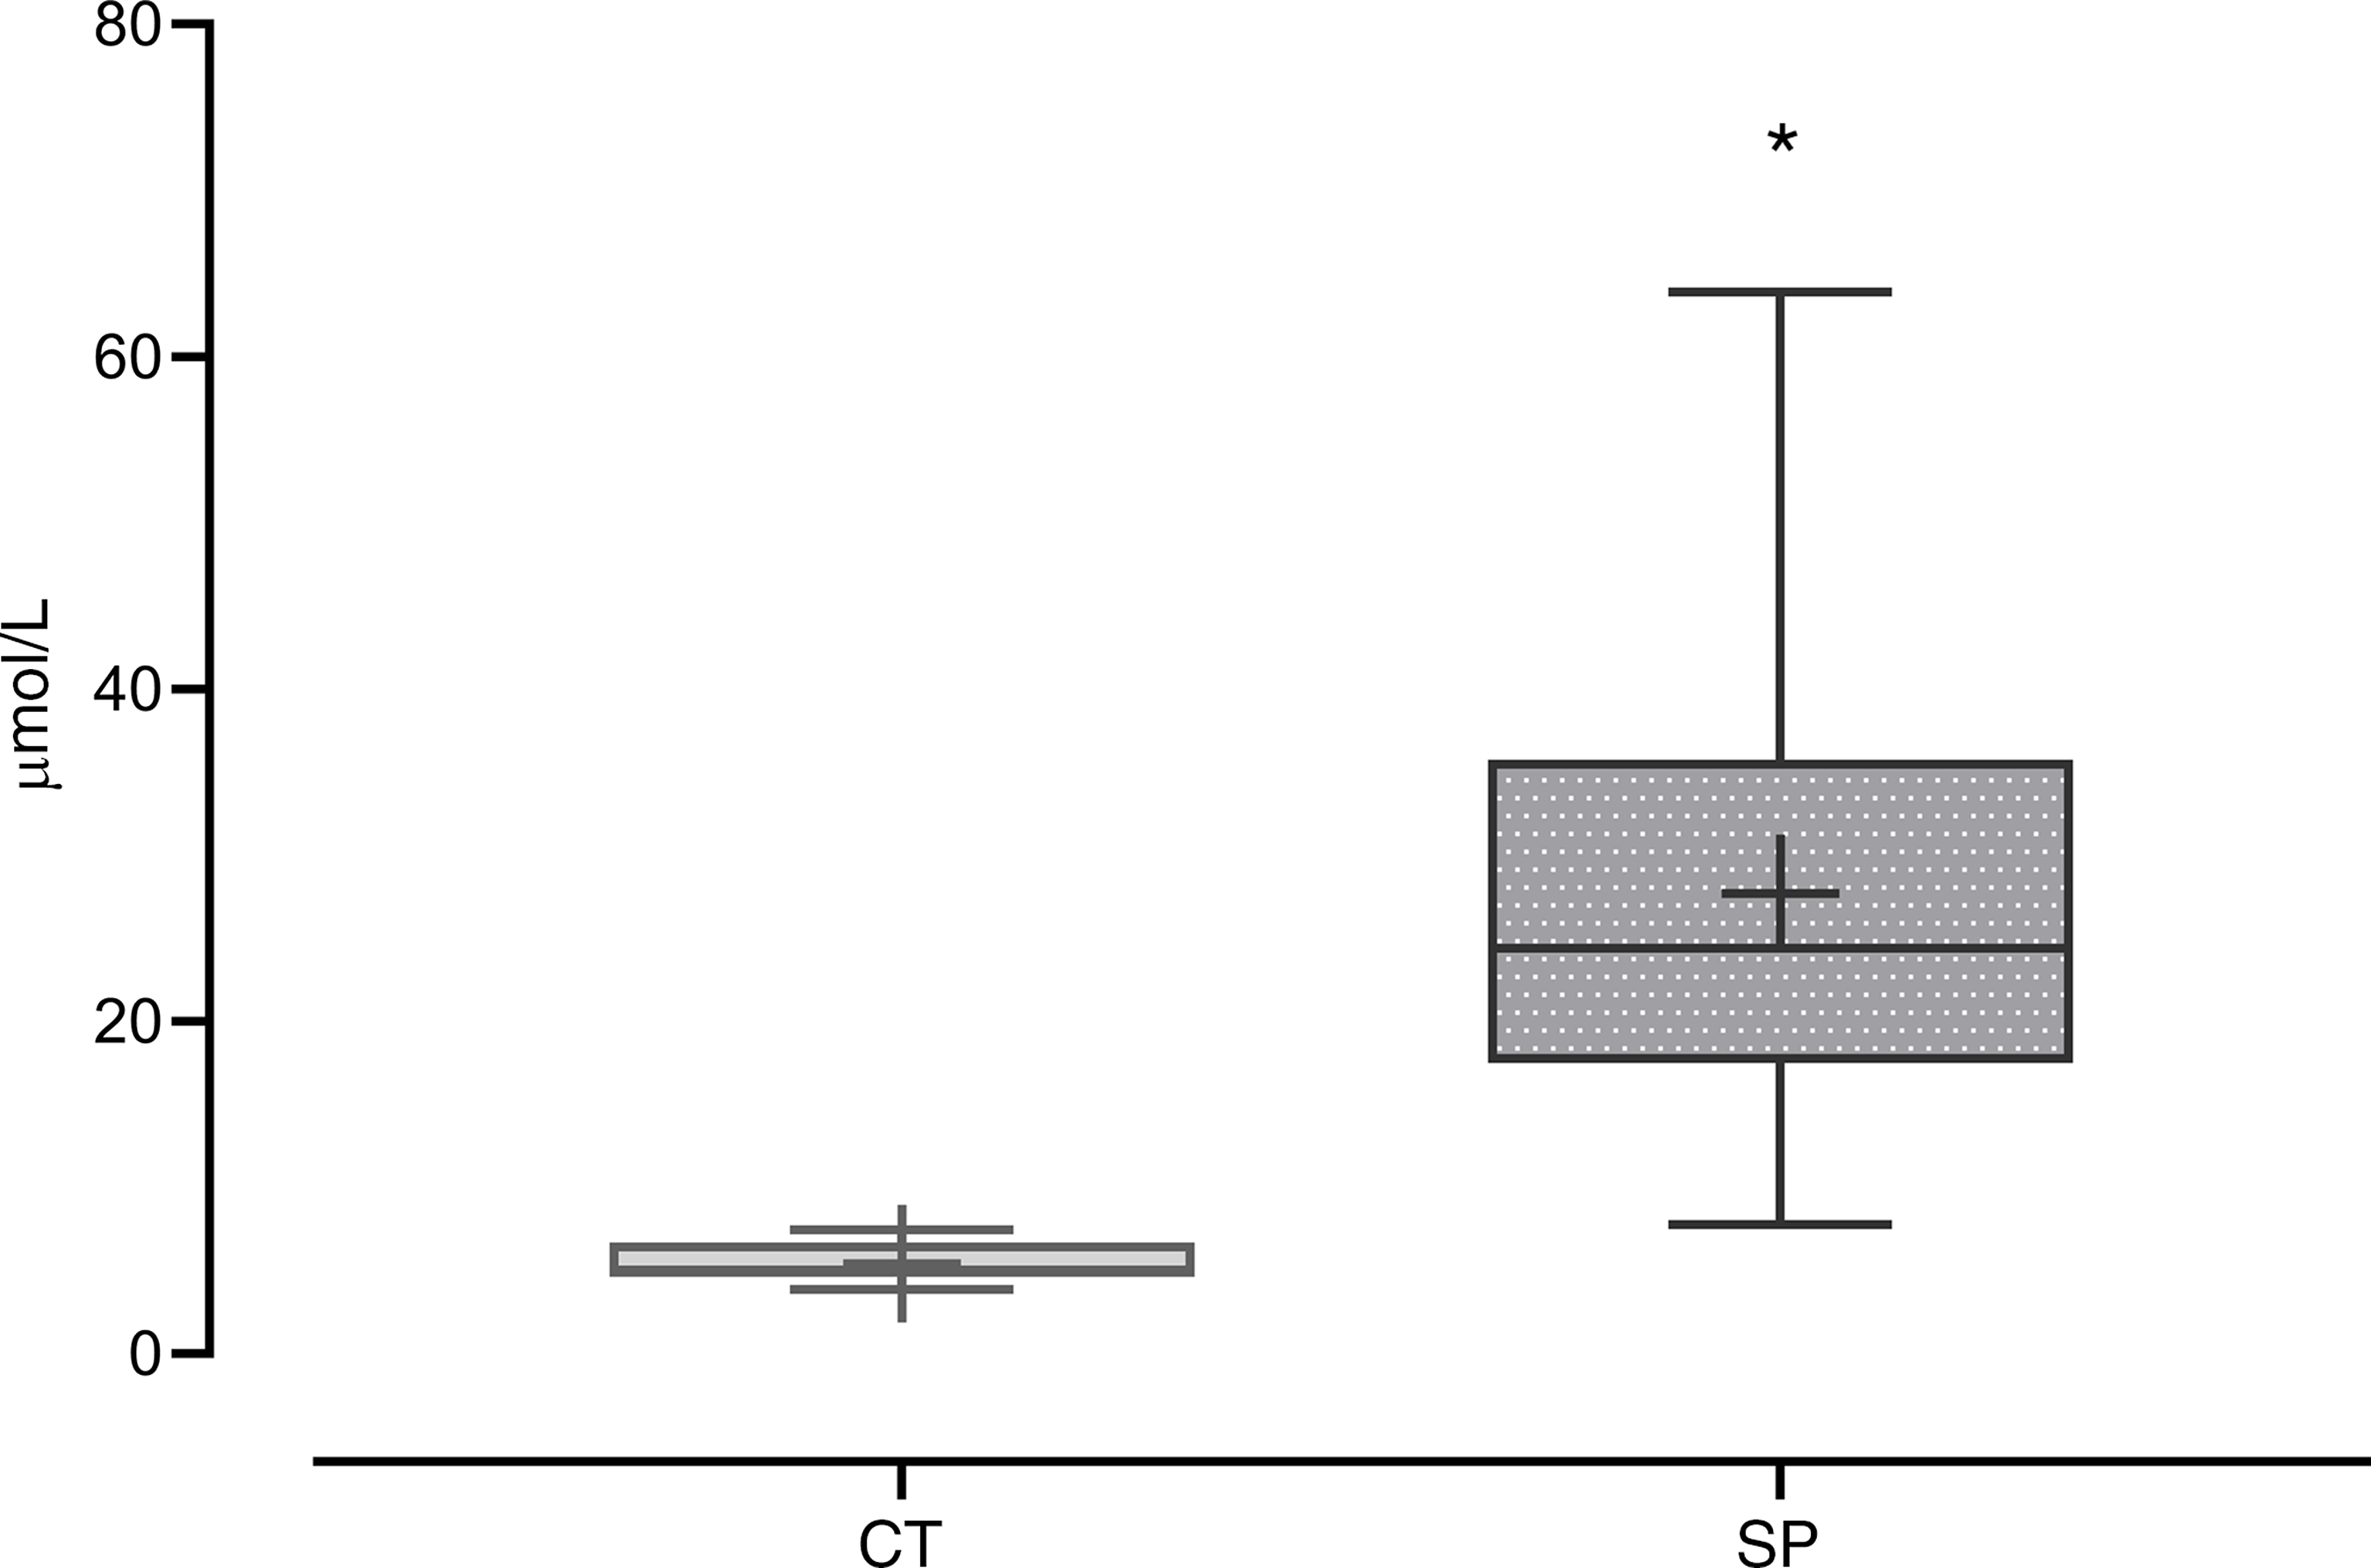
The increase of methionine availability and the consequent intracellular metabolism of this amino acid was inferred by HCY plasma concentration. Dams that were fed with a methionine-supplemented diet for 20 d showed an increase of 409 % in plasma HCY concentrations when compared with the control group (F (1,25) = 21·37; P = 9·9 × 10−4) (Fig. 2).
Homocysteine (HCY) plasma concentration in the dams. CT, control (n 10); SP, supplemented during pregnancy (n 17). Values are presented as box plot 5–95 percentile; the crosses represent mean values for each group and the line inside the box the median values. *General linear model, Duncan’s post hoc (P < 0·05).
Offspring
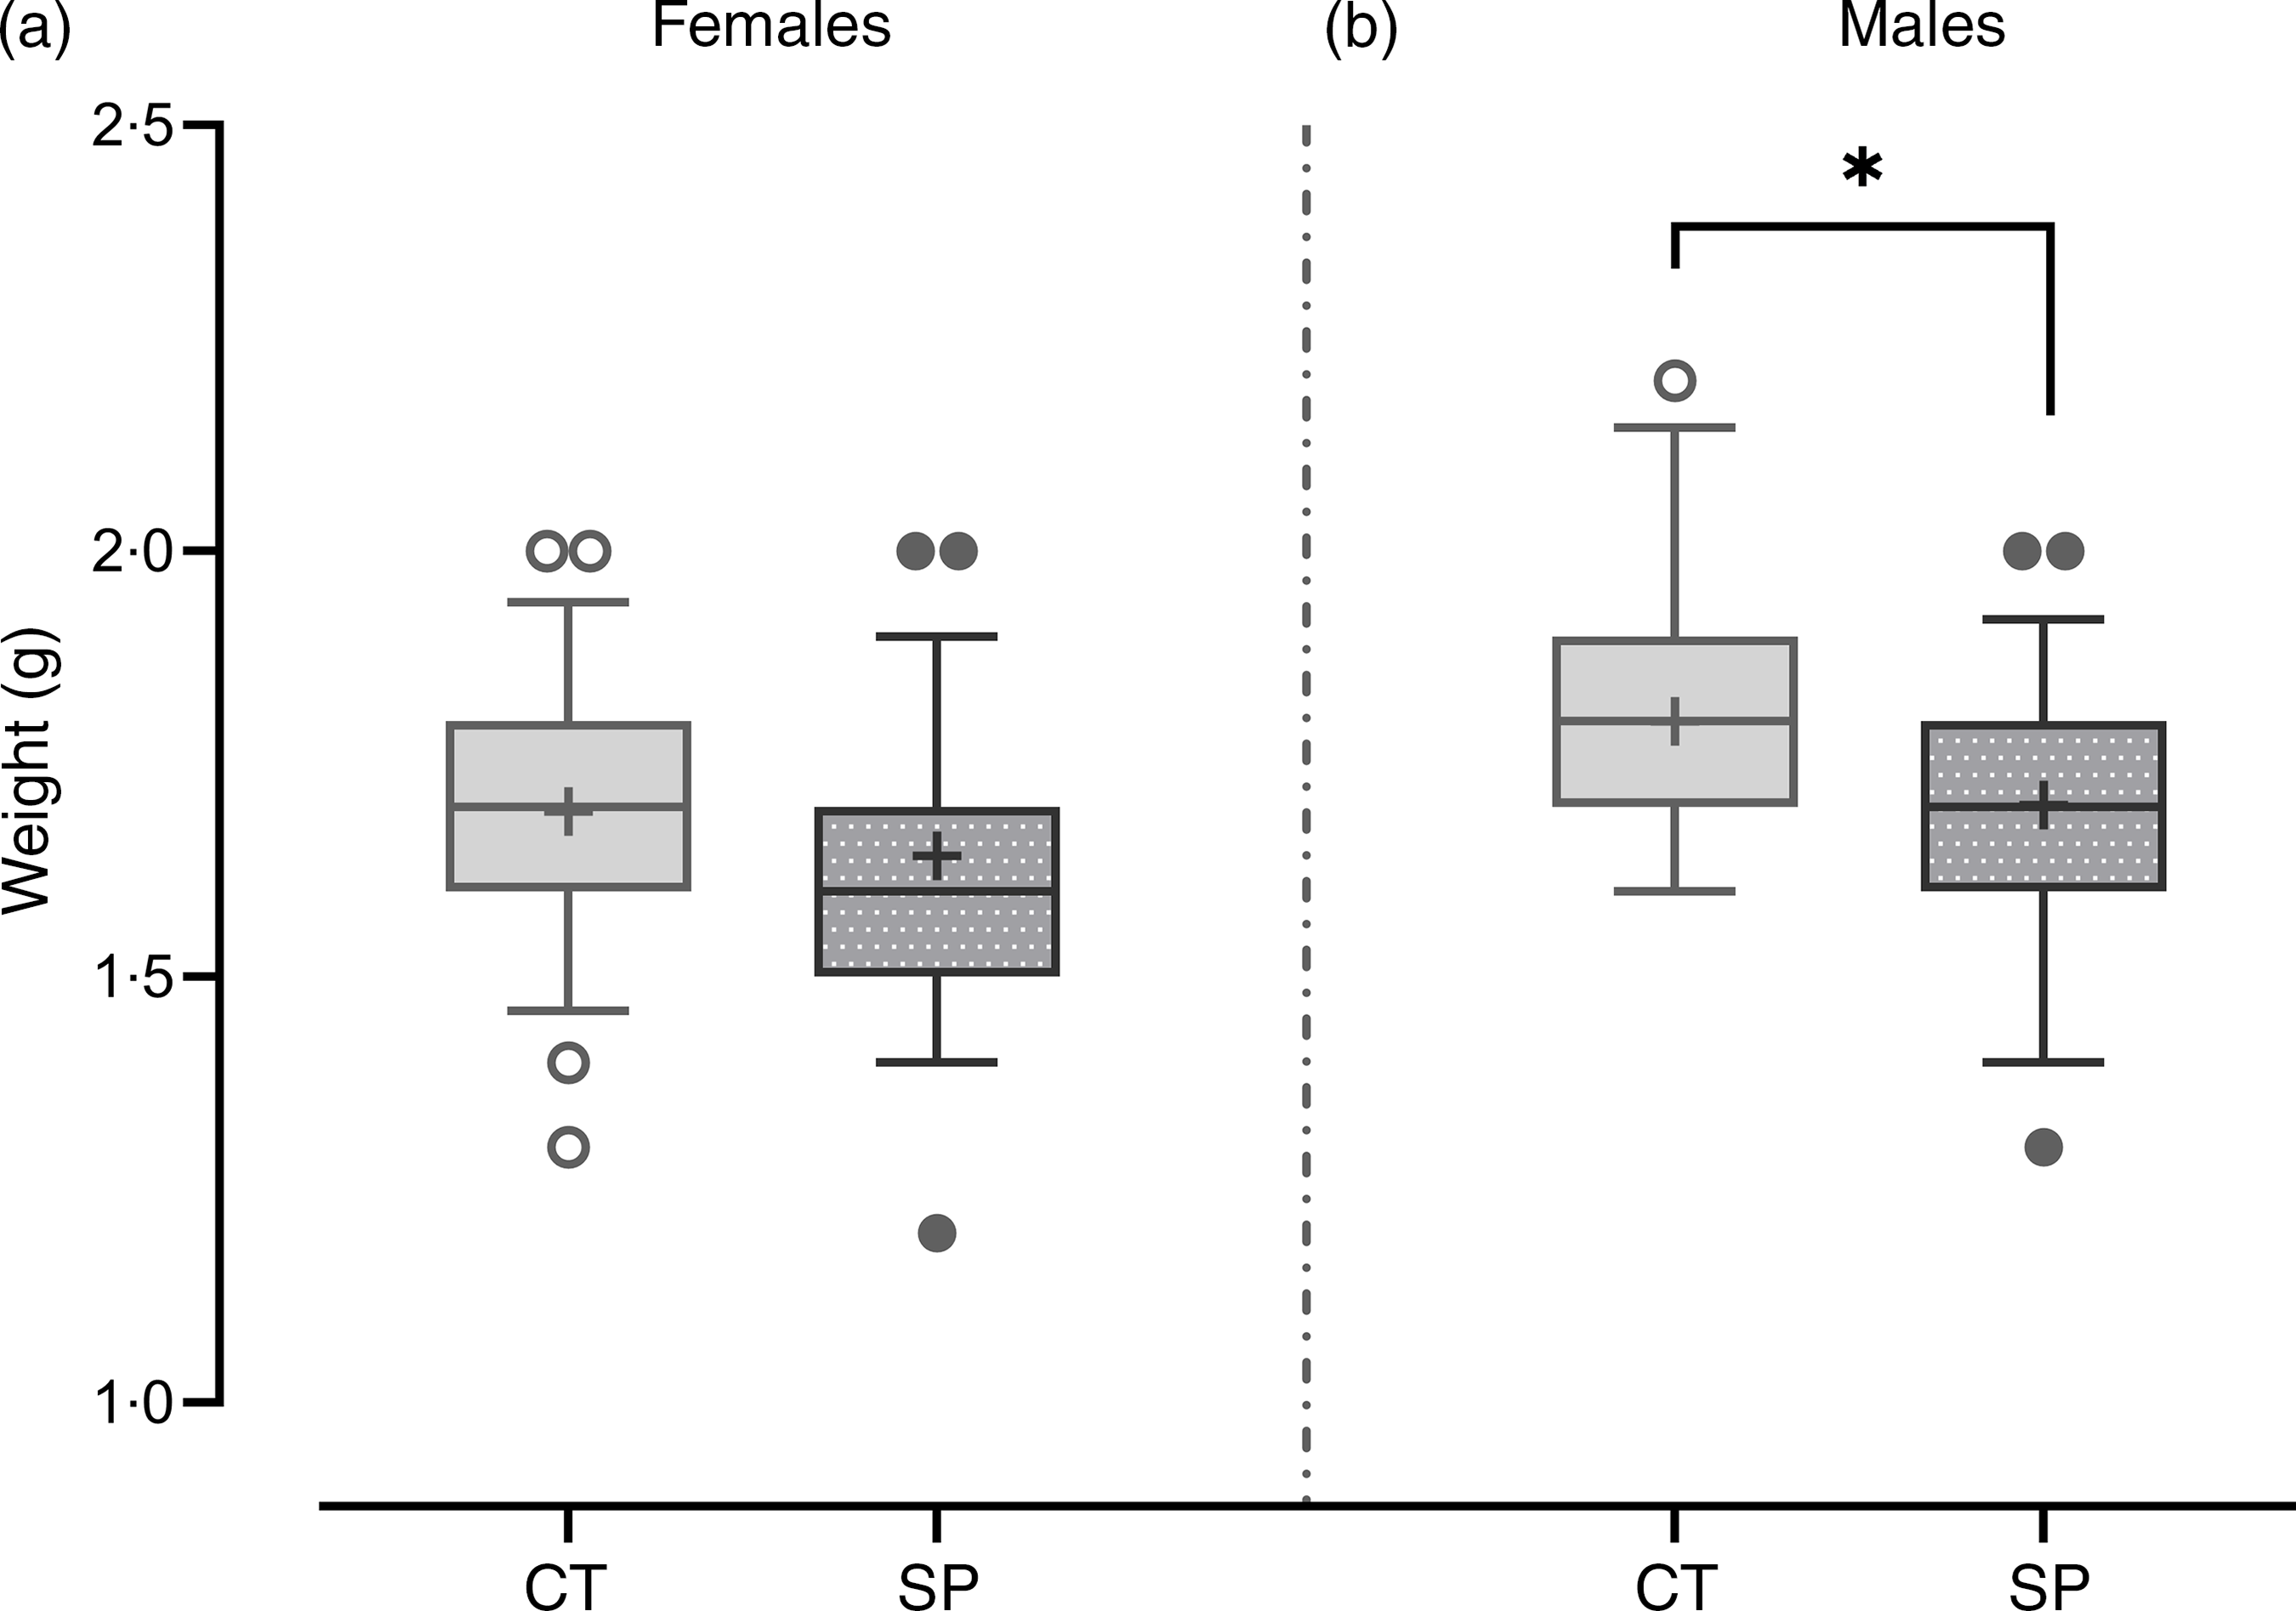
The increased availability of methionine during pregnancy did not significantly impact the birth weight of female offspring (F (1112) = 2·66; P = 0·11), but male mice offspring showed a 6 % reduction in the birth weight (F (1,83) = 8·58; P = 4·4·10−3), (Fig. 3).
Body weight after birth in female (a) and male offspring (b).Females: CT, control (n 51); SP, supplemented during pregnancy (n 63). Males: CT, control (n 30); SP, supplemented during pregnancy (n 55). Values are presented as box plot 5–95 percentile; the symbols represent values outside the 95 % CI; the crosses the mean values for each group and the line inside the box, the median values. *General linear model, Duncan’s post hoc (P < 0·05).
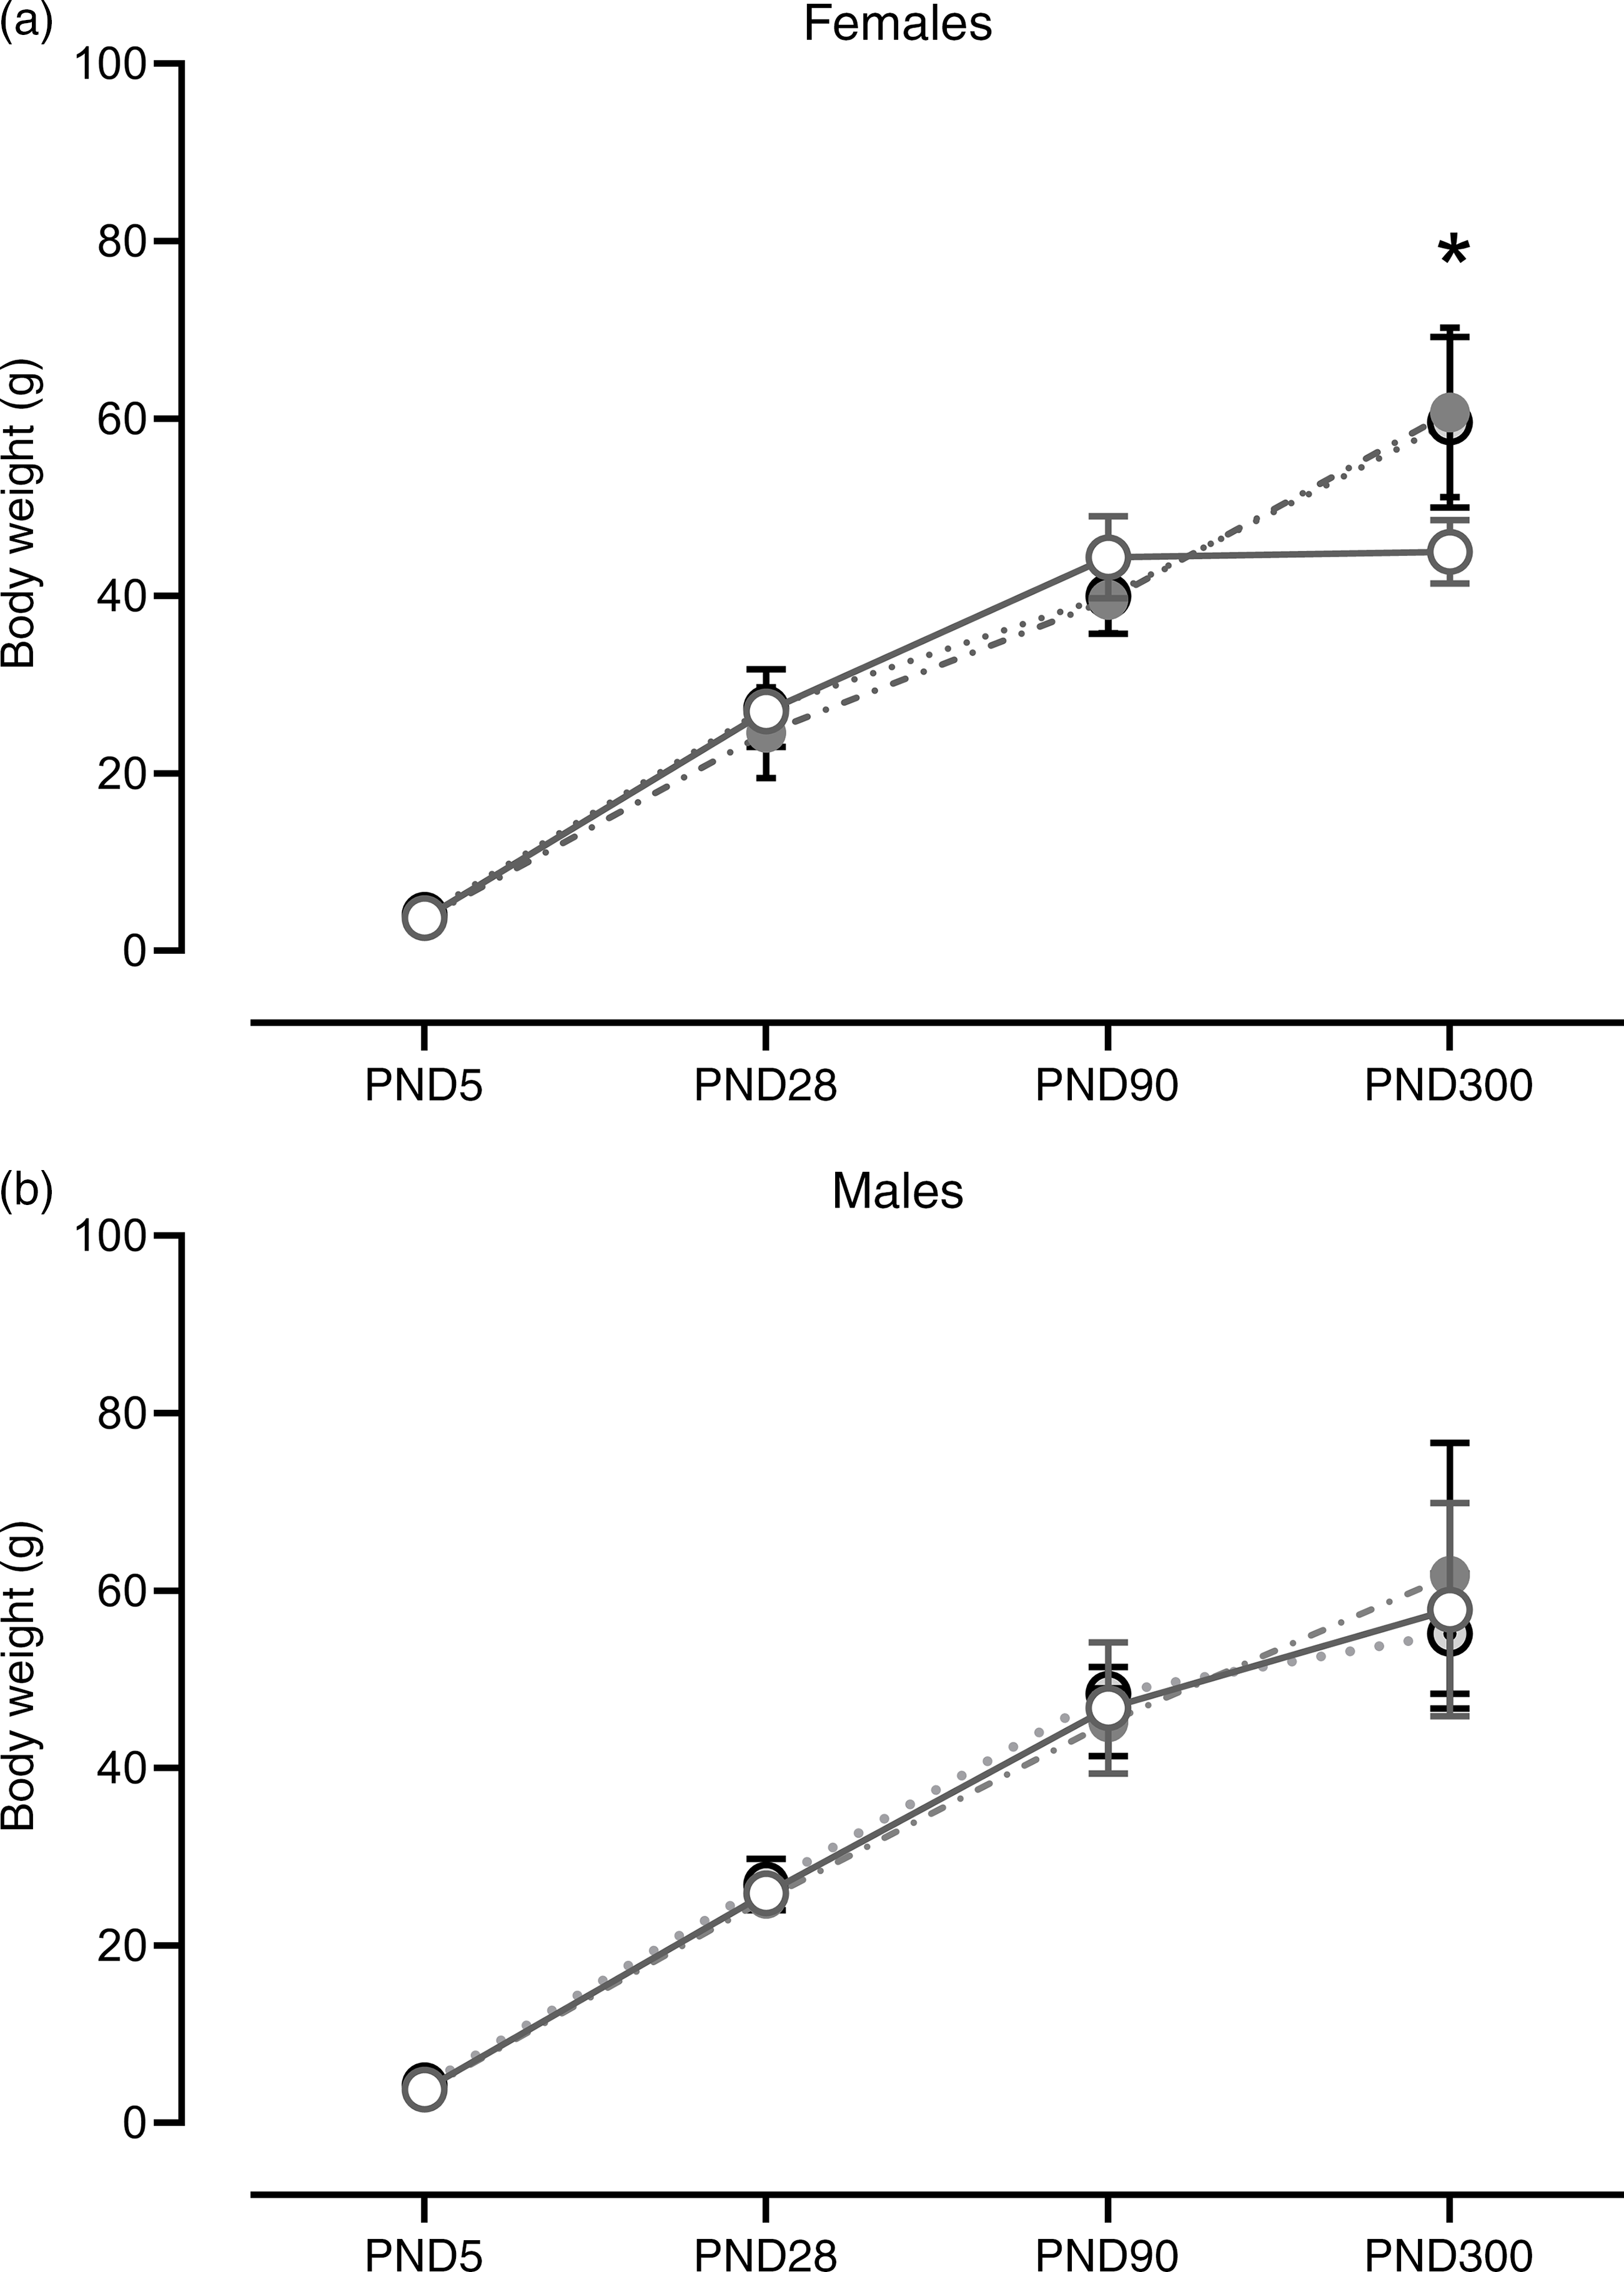
At PND 5 (F (2,13) = 0·87; P = 0·44), 28 (F (2,16) = 0·82; P = 0·46) and 90 (F (2,17) = 2·48; P = 0·11), no differences in body weight were found in the female offspring. The same results were observed for males at PND 5 (F (2,12) = 2·61; P = 0·11), 28 (F (2,19) = 0·94; P = 0·41) and 90 (F (2,18) = 0·70; P = 0·51). However, at PND 300, SP and SPL females showed an increase in body weight when compared with control (F (2,17) = 7·06; P = 5·9·10−3). No significant differences in male offspring at PND 300 were observed (F (2,16) = 0·43; P = 0·66) (Fig. 4).
Weight gain during development in female (a) and male offspring (b). Females (n 4–8). Males (n 4 - 8): CT, control; SP, supplemented during pregnancy; SPL, supplemented during pregnancy and lactation; PND, postnatal day. Values are presented as mean and standard deviation. *General linear model, Duncan’s post hoc (P < 0·05), different from CT group. ![]() , CT;
, CT; ![]() , SP;
, SP; ![]() , SPL.
, SPL.
The results in respect of the total and relative weight of the organs at PND 28 are summarised in Table 1. No significant differences were observed between the groups for any of the organs evaluated, both in females and males.
Organ weights (g) and relative organ weights (%) in female and male offspring at postnatal day (PND) 28 from dams supplemented with methionine during pregnancy and pregnancy/lactation
(Mean values and standard deviations, n 4–8; General linear model)
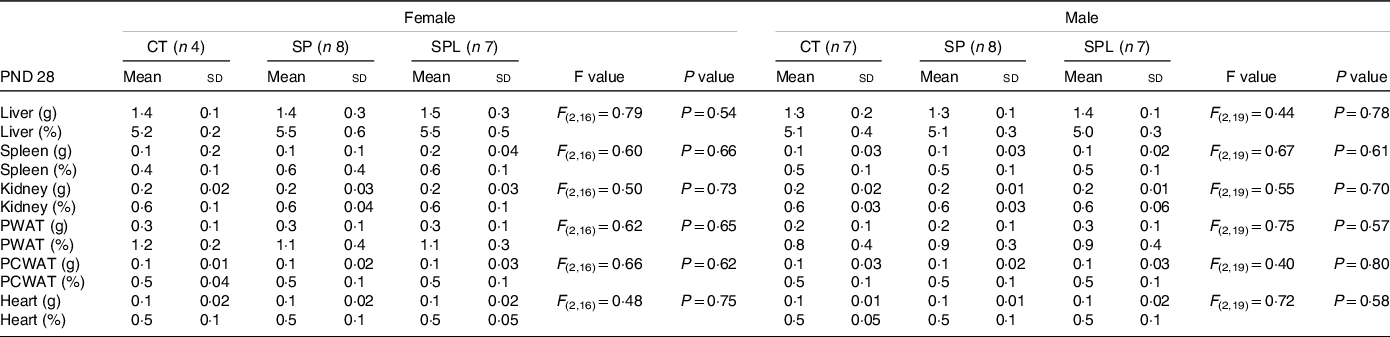
CT, control; SP, supplemented during pregnancy; SPL, supplemented during pregnancy and lactation; PND, postnatal day; PWAT, perigonadal white adipose tissue; PCWAT, pericardial white adipose tissue.
In females at PND 300, no significant differences were observed in the absolute weight of the liver, spleen, kidney, pericardial white adipose tissue and heart. However, the relative weights of liver and spleen of the SPL offspring were lower than the SP and CT groups, and the relative weights of the kidneys and heart were lower in the SP and SPL groups when compared with the CT group (P < 0·05). On the other hand, the weight of PWAT, both absolute and relative, was higher in the SP and SPL groups when compared with the CT group (P < 0·05). No significant differences were observed between the groups for any of the organs evaluated in the males at PND 300 (Table 2).
Organ weights (g) and relative organ weights (%) in female and male offspring at postnatal day (PND) 300 from dams supplemented with methionine during pregnancy and pregnancy/lactation
(Mean values and standard deviations, n 4–8; General linear model)
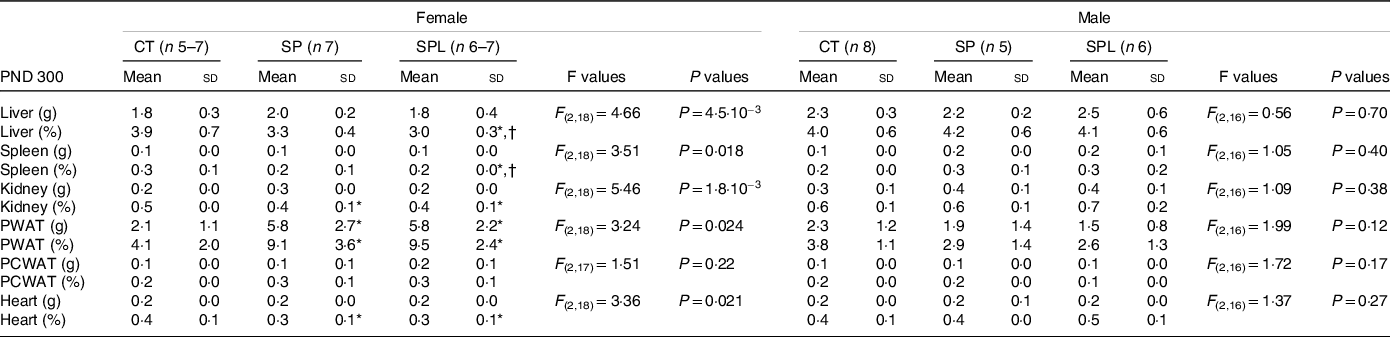
CT, control; SP, supplemented during pregnancy; SPL, supplemented during pregnancy and lactation; PND, postnatal day; PWAT, perigonadal white adipose tissue; PCWAT, pericardial white adipose tissue.
* Duncan’s post hoc (P < 0·05), different from the CT group;
† Duncan’s post hoc (P < 0·05), different from the SP group.
Plasma dosages showed no significant changes in glucose, TAG, lactate and cholesterol in female (F (2,17) = 1·32; P = 0·28) or male (F (2,16) = 2·20; P = 0·062) offspring at PND 300 (Table 3).
Blood glucose, TAG, lactate and cholesterol in female and male offspring at postnatal day (PND) 300 from dams supplemented with methionine during pregnancy and pregnancy/lactation
(Mean values and standard deviations, General linear model)
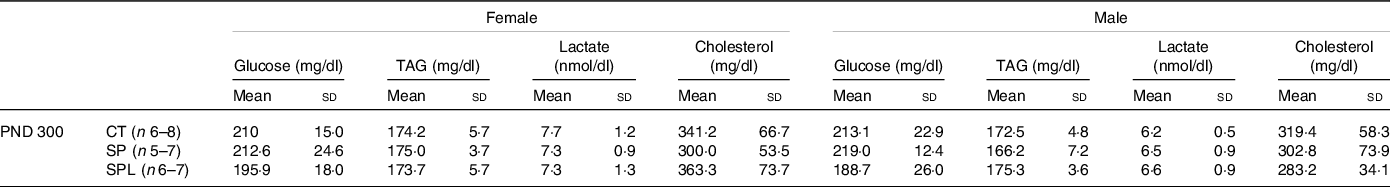
CT, control; SP, supplemented during pregnancy; SPL, supplemented during pregnancy and lactation; PND, postnatal day.
At PND 0, we measured SAM and SAH (a product resulting from methionine demethylation), and GSH, a powerful cell antioxidant concentrated in the brain. No significant changes in the SAM, SAH and SAM:SAH ratio in both females (F (1,14) = 1·83; P = 0·20) and males (F (1,13) = 0·65; P = 0·60) were observed. In respect of GSH, no differences were observed in the female (F (1,13) = 0·94; P = 0·35) or male mice (F (1,13) = 0·093; P = 0·76), Table 4.
Parameters related to transsulphuration pathway in female and male offspring at postnatal day (PND) 0 from dams supplemented with methionine during pregnancy and pregnancy/lactation
(Mean values and standard deviations, General linear model)
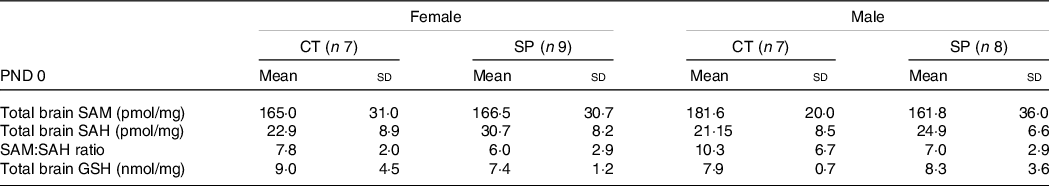
CT, control; SP, supplemented during pregnancy; PND, postnatal day.
At PND 28, females from the SPL group showed an increase in plasma HCY concentrations when compared with the CT and SP groups (F (2,16) = 2·65; P = 0·037). Male mice from this group also presented increased plasma HCY concentrations when compared with the CT and SP groups (F (2,19) = 7·27; P = 4·8·10−5). No significant differences in CYS and GSH plasma concentrations were observed in females or males.
Evaluations of the brain cortex also showed no significant changes in SAM, SAH and SAM:SAH ratio in females (F (2,15) = 0·60; P = 0·73) and males (F (2,15) = 0·87; P = 0·53), or in GSH (females, F (2,15) = 2·75; P = 0·10; males, F (2,15) = 0·19; P = 0·83), as shown in Table 5.
Parameters related to transsulphuration pathway in female and male offspring at postnatal day (PND) 28 from dams supplemented with methionine during pregnancy and pregnancy/lactation
(Mean values and standard deviations; General linear model)
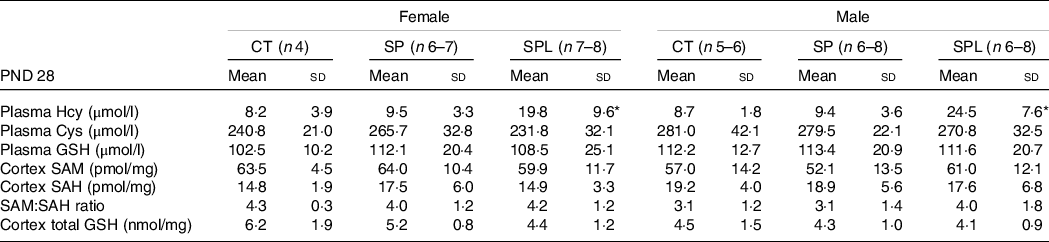
CT, control; SP, supplemented during pregnancy; SPL, supplemented during pregnancy and lactation; PND, postnatal day.
* Duncan’s post hoc (P < 0·05), different from the CT and SP groups.
For all groups, at PND 300, no changes were observed in plasma HCY, CYS and GSH in both females (F (2,18) = 1·26; P = 0·30) and males (F (2,14) = 0·64; P = 0·70). Likewise, there were no changes in brain cortex concentrations in SAM, SAH and SAM:SAH ratio in females (F (2,18) = 1·26; P = 0·31) and males (F (2,15) = 0·74; P = 0·63). Concerning GSH, no differences were observed in female (F (2,15) = 0·69; P = 0·51) or male mice (F (2,15) = 0·75; P = 0·49), Table 6.
Parameters related to transsulphuration pathway in female and male offspring at postnatal day (PND) 300 from dams supplemented with methionine during pregnancy and pregnancy/lactation
(Mean values and standard deviations; General linear model)
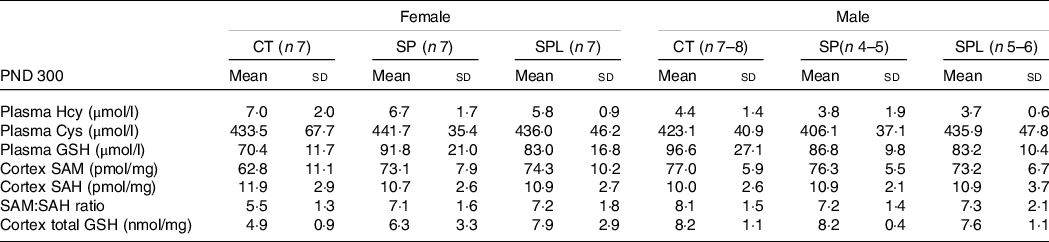
CT, control; SP, supplemented during pregnancy; SPL, supplemented during pregnancy and lactation; PND, postnatal day.
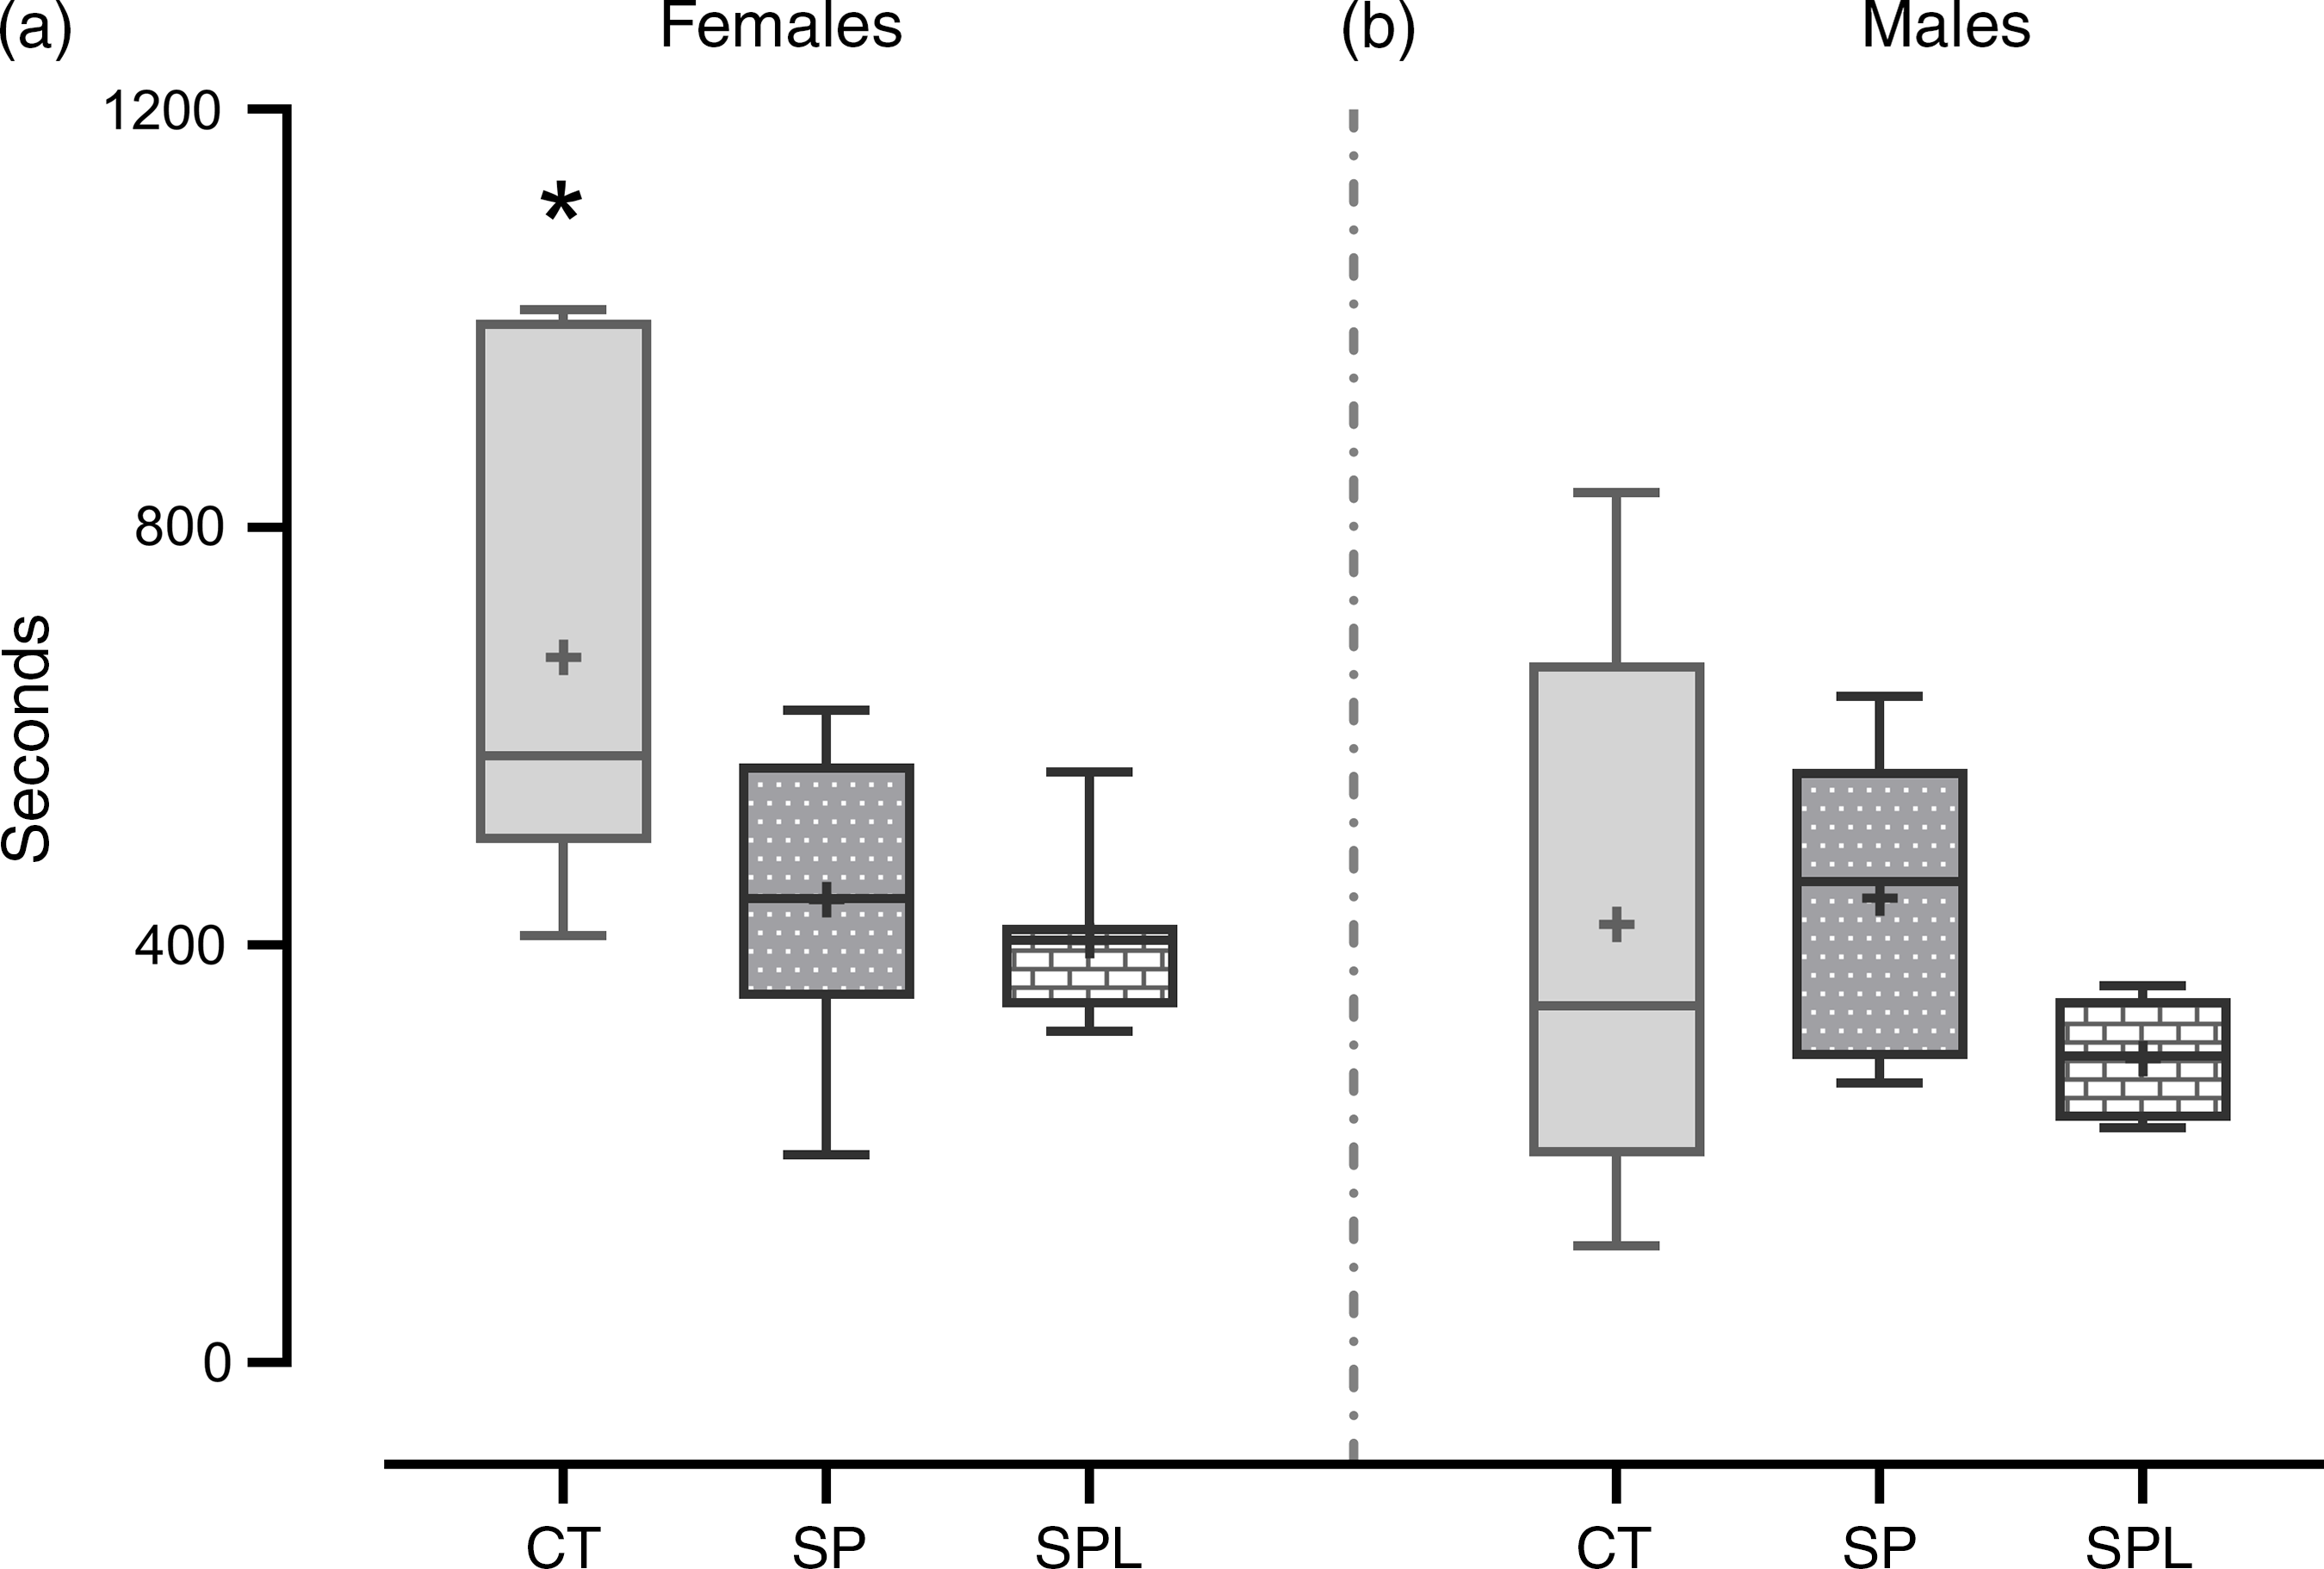
In respect of locomotor activity, the SP and SPL females presented lower locomotion when compared with the CT group (F (2,20) = 5·91; P = 9·7·10−3). No differences were observed in the males (F (2,16) = 1·02; P = 0·38) (Fig. 5).
Locomotor activity in (a) female and (b) male offspring at PND 299. Females (CT = 7; SP = 8; SPL = 8). (b) Males (CT = 8; SP = 6; SPL = 5): CT, control; SP, supplemented during pregnancy; SPL, supplemented during pregnancy and lactation; PND, postnatal day. Values are presented as box plot 5–95 percentile, the symbols represent values outside the 95 % CI; the crosses the mean values for each group, and the line inside the box, the median values. *General linear model, Duncan’s post hoc (P < 0·05), different from SP and SPL groups.
Small variations in the number of samples used in the different experiments carried out on PND 28 or PND 300 were related to experimental difficulties linked to data acquisition.
Discussion
Over the past few years, our group has studied the effects of the manipulation of methyl radicals on the early development of offspring. First, we assessed the effects of hypomethylation, produced by a decrease in SAM availability in riboflavin, folate, cobalamin and choline-deficient diets during pregnancy and pregnancy/lactation(Reference Cavalcante-Silva, Fernandes and Haseyama14,Reference da Silva, Fernandes and Haseyama21) . In the current study, we evaluated the effects of hypermethylation produced by increasing the availability of methionine, a SAM precursor, during the same period.
The results of the previous studies related to an environment with a reduced availability of methyl suggested different responses between female and male mice, as there was only a reduction in body and PWAT weight in male offspring of mice submitted to vitamin B deficiency during pregnancy/lactation(Reference Cavalcante-Silva, Fernandes and Haseyama14). In the current study, the long-term effects of an environment with increased availability of methyl resulted in increased body and PWAT weight only in female offspring of mice supplemented with methionine during pregnancy and pregnancy/lactation, reinforcing the finding that sexes respond differently to variations in the availability of methyl radicals.
In fact, at PND 0, the female offspring of dams submitted to vitamin B deficiency during pregnancy show increased SAH levels, while male offspring show decreased SAM(Reference da Silva, Fernandes and Haseyama21). In the present study, no statistically significant changes were observed in SAM and SAH concentrations after birth, although we found a suggestive effect in the 34 % increase observed in SAH concentrations in female offspring of supplemented dams, v. approximately 18 % in male offspring. We hypothesised that the increased SAH concentrations found in females in these two experiments may be a result of the greater need for methyl radicals to randomly inactivate one of the two X chromosomes present in each somatic cell during development(Reference Goto and Monk23). This raises the question of whether this female biological characteristic would be a factor that protects them in an undernourished environment, a more plausible situation in real life than an over-supply of methionine.
Interestingly, early vitamin B deficiency caused a reduction in birth weight in both female and male offspring; however, only males remained underweight throughout their development as a long-term result of the deficiency during pregnancy/lactation(Reference Cavalcante-Silva, Fernandes and Haseyama14). In the current study, both females and males presented a slight decrease in birth weight, but it was statistically significant only for males. However, evaluations at PND 5, 28, 90 and 300 showed no changes in male body weight. In females, body weight gain occurred after PND 90 and was found at PND 300 in both the SP and SPL groups. In a study of rats, maternal hyperhomocysteinaemia induced by a high methionine diet was shown to slightly decrease offspring birth weight, but it was not significantly lower than the control values; on the day before euthanasia (PND 75), no differences in body weight were observed between the groups(Reference Baydas, Koz and Tuzcu24). In another study, methionine supplementation (0·1 %, 0·2 %, 0·3 % or 0·4 % w/w) associated with a protein-deficient diet (9 % casein) during early development affected long-term body weight. The early protein deficiency decreased the long-term body weight per se, and the data suggested a trend towards reduced adult body weight related to increased methionine in the diet, which was reversed in the offspring of dams receiving the highest supplement of 0·4 % w/w methionine. However, the authors draw attention to the fact that some dams in this group gave birth to litters of less than ten pups, while others had litters with about thirteen pups, and the ‘small litter appears to have improved fetal growth, possibly because they are better able to deal with excess methionine, or because the smaller litter ameliorates the effect of reduced protein’(Reference Rees, Hay and Cruickshank25). In the current study, the litter size was adjusted to eight animals per dam to exclude this effect.
Concerning organ weights, no changes were observed at PND 28 in females or males. At PND 300, no changes were observed in males, but females showed some alterations. The increases in total and relative PWAT in SP and SPL females were in line with increased body weight; however, the decrease in the relative weight of other organs appears to have resulted only from the increase in body weight, as no changes were observed in total organ weight. Despite the increase in body and PWAT weight, no changes in glucose, TAG, lactate and cholesterol were observed. Regarding the analyses of HCY, CYS, GSH, SAM and SAH at PND 28, we observed only an increase in HCY concentrations in both females and males. The increase in this metabolite, an intermediate from methionine metabolism, was not accompanied by an increase in the concentrations of CYS and GSH, which are produced in the HCY transsulphuration pathway. A possible explanation for this is because the enzymes involved in the transsulphuration present Kms with at least an order of magnitude greater than the Km of the two HCY methyltransferases(Reference Stipanuk26). No changes in these metabolites were observed after weaning and exposition to a standard diet.
After weaning, all animals were fed with a control diet. So, the increased body weight in SP and SPL females may be related to the increased amount of methionine ingested during early development. It should be noted that these same animals also presented a decrease in locomotor activity. A study showed that acutely reduced locomotor activity was the major contributor to Western diet-induced obesity in mice. In this case, the decreased locomotor activity and consequent reduction in energy expenditure explained more than 60 % of the weight gain in these animals(Reference Bjursell, Gerdin and Lelliott27).
In the current study, locomotor activity was evaluated only at PND 299; there is no data on locomotor activity throughout the experiment. However, we know that until PND 90, no changes in body weight were observed, which leads us to infer that the reduction in locomotor activity occurred after PND 90. On the other hand, we cannot say that there is a causal relationship between these two parameters as, in another study, a reduction in locomotor activity was also observed in male pups of vitamin B-deficient mothers, but they showed lower PWAT content and body weight(Reference Cavalcante-Silva, Fernandes and Haseyama6).
The current study and our previous study(Reference Cavalcante-Silva, Fernandes and Haseyama6) both showed the important role of methyl radicals in early life, for example, in the control of adipose tissue development and body weight. Therefore, the effects of dietary methyl donors must be carefully monitored and observed, not only because of the already established association with an increased risk of neural tube defects(Reference Imbard, Benoist and Blom28) but also in relation to the important morphometric changes observed and the different effects that the availability of methyl radicals can have on males and females.
Acknowledgements
This work was supported by grants from CNPq, AFIP and FAPESP (Process no. 2010/00075-2). V. D.’A. was recipient of a CNPq fellowship. V. C.-S. and L. F. were recipients of CAPES scholarships.
The authors have no conflicts of interest to disclose.
V. C. S and V. D.’A. designed the study and wrote the protocol. V. C. S. and L. F. managed the experimental procedures and analyses. V. C. S. and J. R. S. V. undertook the statistical analysis, and V. C. S., J. R. S. V., L. F., A. C. O. and V. D.’A. wrote the first draft of the manuscript. All authors contributed to and have approved the final manuscript.


