


1. Introduction
Four decades ago, Jim Bogen and James Woodward, hereafter B&W, argued that one should sharply distinguish between data, phenomena, and theories. Data are thought of as typically observable, idiosyncratic to the context of investigation and methodology, and relatively easy to collect and analyse. Phenomena are conceived of as mostly unobservable and investigator-independent. In a typical scenario, scientists gather data through observation or measurement, and use it as evidence for the existence of a phenomenon. Subsequently, scientists develop theories—abstract and general frameworks aiming to make, predict, and/or explain claims about phenomena, not data. By making this distinction and positing an indirect relationship between data and theories, B&W challenged the long-standing empiricist tradition of taking data/observations as the basis for developing and evaluating scientific theories. While their account does not entirely dismiss the role of data, as it still figures in phenomena detection, it regards any data–theory inference as misguided and epistemically irrelevant.
This paper acknowledges the significance of the data–phenomena distinction, while challenging B&W’s epistemological claims regarding the role of data in theory construction and evaluation. We argue that modern-day scientific applications of machine learning (ML) methods and causal discovery methods provide compelling examples of how data are routinely inferred and predicted from theoretical models, and routinely used to infer and predict such models. The paper is structured as follows: section 2 presents an overview of B&W’s tripartite distinction, as well as their associated epistemological claims. Section 3 discusses two cases from ML that directly challenge B&W’s epistemological claims. Section 4 discusses a further case from the causal Bayes nets literature that also defies those claims. Section 5 helps ground the importance of those cases by motivating the theoretical nature of such models.
2. B&W’s account
In this section, we discuss B&W’s epistemological account of the relationship between data, phenomena, and theories. We provide examples and review some of the most significant reactions against it.
B&W developed their account in a series of papers that stretch across several decades (Bogen and Woodward Reference Bogen and Woodward1988; Woodward Reference Woodward1989; Bogen and Woodward Reference Bogen and Woodward1992; Woodward 2003; Woodward Reference Woodward2011). Data, or observational reports, are “public records produced by measurement and experiment that serve as evidence for the existence or features of phenomena” (Woodward Reference Woodward2011, 166). Examples include “bubble chamber photographs, patterns of discharge in electronic particle detectors, and records of reaction times and error rates in various psychological experiments” (Bogen and Woodward Reference Bogen and Woodward1988, 306). By contrast, phenomena are “relatively stable and general features of the world which are potential objects of explanation and prediction by general theory” (Woodward Reference Woodward1989, 393). Examples include “weak neutral currents, […], proton decay, capacity limitations and recency effects in short-term memory” (ibid.).Footnote 1 Scientific theories are abstract and general frameworks that “generally seek to predict and systematically explain” phenomena (Bogen and Woodward Reference Bogen and Woodward1992, 592). Examples include “classical mechanics, general relativity, and the electroweak theory that unifies electromagnetic and weak nuclear forces” (Woodward Reference Woodward2011, 166).
Crucially, on B&W’s account, phenomena are explained by theories and can provide evidence for them, whereas data only serve as evidence for phenomena and can neither be predicted nor inferred from theories, nor predict or infer them. When proposed, this account marked a radical shift in understanding the data–theory relationship. Historically, philosophers had treated phenomena as the kind of things directly perceivable or observable,Footnote 2 thereby conflating the concept of phenomena with that of data. For B&W, this ‘folly’ has roots in the etymology of the term ‘phenomenon’. As Hacking notes, “In Greek it denotes a thing, event, or process that can be seen, and derives from the verb that means, ‘to appear’ ” (Reference Hacking1983, 221).
B&W instead assert that data, not phenomena, are the actual objects of observation: while data are dependent on the context and methods of their production and collection, phenomena can be essentially regarded as investigator-independent. This understanding aligns with the way scientists, particularly physicists, conceptualise phenomena, which does not require direct observation, and may even involve unobservable entities. In principle, we have no objection to B&W’s use of the term ‘phenomenon’ in a way that departs from its historical lineage, provided it is coherently defined (which we cautiously deem it to be).
B&W’s melting point of lead example (Bogen and Woodward Reference Bogen and Woodward1988, 308–9) illustrates their view of the link between data, phenomena, and theories.Footnote 3 To detect this phenomenon, scientists collect data by measuring the temperature of lead samples, using a thermometer, and obtain a ‘final’ dataset consisting of a scattering of temperature reading points. Assuming no systematic error and controlled variation—where confounding variables “operate independently, are roughly equal in magnitude, are as likely to be positive as negative, and have a cumulative effect which is additive” (ibid.)—the distribution of measurements is normal. B&W take its mean as a “good estimate of the true melting point of lead [i.e. the phenomenon]” (ibid.) and claim that this phenomenon is not directly observable. They also argue that, on the assumption that the true melting point of lead is 327.5 °C, even an exact temperature reading of 327.5 °C would be merely a special case of occurrence, not a direct observation, as the phenomenon could be identified even without that precise value. The scattered data points only provide evidence for the melting point, which in turn provides evidence for, and is explained by, electron-bonding theories.
According always to B&W, we cannot use such theories to infer, predict, or explain data points because the mean of the observed distribution is not a property of any specific point and is unlikely to coincide with any observed value except in exceptional cases. Data, even under controlled conditions, are inevitably constrained by ‘local’ factors that do not reflect or relate the ‘non-local’ phenomenon under investigation. These ‘local’ factors can be numerous and complex, and are intimately tied to the specific measurement setup and experimental contexts—ranging from how the measuring instrument is affected by ambient conditions, to procedural decisions made by the researcher and challenges in ensuring repeatability. It is this local or idiosyncratic nature of data that B&W exploit in making the claim that data cannot be inferred, predicted, or explained by theories. In their own words, “one can justifiably believe that data provide reliable evidence for some phenomenon without being in a position to explain or derive facts about the data” (Woodward Reference Woodward1989, 398).Footnote 4
Critiques of B&W’s account have generally fallen into three broad categories. The first category concerns those who question the very need to demarcate between data and phenomena. Glymour belongs to this category, arguing that “Bogen and Woodward are mistaken in thinking that the distinction is necessary” (Reference Glymour2000, 29). He restricts his argument to statistical inferences and asserts that either the distinction corresponds to the distinction between sample structure and population structure, or it does not. Either way, he argues, it is unnecessary. If it does not correspond to it, it is unnecessary because inferences from sample structure to population structure can be made without it. If it does correspond, then it is also unnecessary because it “simply gives a new name to a distinction which is already deeply embedded in the literature on statistical inference” (34).
The second category concerns those who object to the way the distinction is drawn. Teller (Reference Teller2010), for example, argues that the distinction between observables and unobservables cuts across the distinction between data and phenomena.Footnote 5 Similarly, Leonelli (Reference Leonelli2009) argues that the distinction between local and non-local cuts across the distinction between data and phenomena. She gives as an example the case of biology, where data typically travel beyond their original experimental contexts, through the use of standardised data labels, decontextualisation procedures, and classification practices for the comparison of datasets. These practices transform data from highly localised evidence for one claim into generalised evidence for other claims in entirely different research contexts. Furthermore, she argues that claims about phenomena are not intrinsically non-local, offering examples where phenomena play a local evidential role towards theories, e.g. the terms ‘pathogen’ and ‘cell wall’ carry distinct meanings within different communities of model organism.
Finally, there are those who are inclined to accept the data–phenomena distinction but not its epistemological implications. Schindler (Reference Schindler2007), for example, argues that unobservable phenomena cannot be inferred from observable data without the involvement of theory. Votsis (Reference Votsis2011) argues that inferences from data to theories and back to data are feasible, and even useful, once suitable auxiliaries are introduced.Footnote 6 Similarly, Lusk (Reference Lusk2021) raises doubts about the inability of theories to explain data via derivation. He discusses the case of spectral data in atmospheric science. Such data cannot be employed to independently identify gas concentration profiles, since different profiles can yield very similar absorption spectra (a problem known in physics as the inverse problem). So, scientists rely on theoretical radiative transfer models to derive and explain predicted spectra from possible gas concentration profiles. Contrary to B&W’s claim, then, theoretical explanations via derivation that link data to phenomena appear to be helpful in the scientific enterprise.
3. Machine learning models and data
In this section we explore two cases from the application of ML techniques to science. We argue that both involve the inferential and predictive construction of models from data, but also the inference and prediction of (something like) data from those models. Moreover, we argue that such models function as theoretical devices. As such, they challenge B&W’s assertion that data–theory inferences are either unfeasible or, at best, irrelevant for the construction/evaluation of scientific knowledge.
In recent years there has been an exponential growth in data production. This increasing influx of data is enabling new possibilities and has had a profound impact on scientific research. One notable domain is medical diagnosis. Data from imaging, genetics, and clinical records, coupled with advancements in data science, particularly ML, have yielded results rivalling and even surpassing human physicians, as discussed below. Kadir and Gleeson (Reference Kadir and Gleeson2018) provide a comparative study of various ML approaches for predicting lung cancer from CT scan images of nodules. Their study encompassed risk models, radiomics, and convolutional neural networks (CNNs), and revealed that CNNs achieve the best performance for predictive tasks, with an AUC score—a common metric of model performance of diagnostic tests—approaching 0.9 (an AUC score of 1 indicates a perfect predictor).
CNNs can independently learn and extract features, i.e. variables, from input data, eliminating the need for manual feature engineering. This stands in contrast with, e.g., traditional radiomics approaches, where radiologists manually select predefined features. In fact, multi-layer or deep CNNs adopt a hierarchical approach to feature extraction. In image processing, this roughly means progressing from detecting basic edges to more complex patterns. A CNN’s independence from manual features underpins its high accuracy, avoiding well-known variability from radiologist measurements in measuring nodule features.
The winning model of the 2017 Kaggle Data Science Bowl illustrates CNNs’ impact on lung cancer detection. The model was trained on a combination of multiple datasets consisting of CT scan images of lung nodules labelled as malignant or benign, based on histology/follow-up information from the LIDC-IDRI public clinical dataset. Throughout training, the model learned patterns distinguishing malignant from benign nodules and optimised parameters to minimise prediction errors. After training, the model predicted malignancy likelihoods for new CT scans, expressed as likelihood scores of a nodule being malignant or benign.
Notably, the winning team not only matched traditional techniques in accuracy but also revealed the limited role of nodule size in early cancer diagnosis. Indeed, when confronted with datasets where sizes were deliberately matched between malignant and benign nodules, the model kept a strong ability to discriminate, indicating that it was picking up on morphological features beyond just size. Remarkably, test accuracy did not drop even when the model encountered unconventional variations in size, such as small but malignant nodules (2 to 6 mm) and large yet benign ones (> 10 mm). Nevertheless, the model achieved an approximately 0.2 higher AUC score on the size-matched dataset. Together, these results challenge the conventional wisdom that nodule size is the primary indicator of malignancy, highlighting the value of different nodule features such as, for instance, texture and shape.
Similarly, Nemlander et al. (Reference Nemlander, Rosenblad, Abedi, Ekman, Hasselström, Eriksson and Carlsson2022) shows how ML can advance lung cancer risk assessments. The study involves different models, all trained on patients’ smoking history and self-reported symptoms. A challenge in the early detection of lung cancer is that symptoms are often non-specific and common. To address this, they employ a stochastic gradient boosting (SGB) algorithm to train and test different risk models on the same dataset. The SGB algorithm is a type of ensemble learning, a class of methods to derive and combine multiple base models into a single final model to enhance robustness and accuracy. The two major ensemble techniques are bagging, where each model is independently fitted using a randomly selected subset of the original dataset, and boosting, where fitting is sequential, building on the results of the previous model. All models are then aggregated by summing them up, and the final classification for each observation is determined by the most frequently occurring classification among all the models. Nemlander et al. successfully identified chest pain as a crucial symptom for risk assessment and early diagnosis of lung cancer, despite its undervaluation in more traditional models.
What do these cases tell about B&W’s claim that there are no direct relations between data and theories? Let us first consider the data-to-theory direction. The above cases challenge this part of B&W’s claim, as models are directly and inferentially constructed from data. By ‘directly’, we do not mean that ML models are constructed from data alone, rather that the process of constructing them is largely data-driven.Footnote 7 In the CNN case, the training data are scan images of lung nodules. In the SGB case, the training data are smoking history and self-reported symptoms. Let us next consider the theory-to-data direction. The cases presented also challenge this part of B&W’s claim, as the trained models are unleashed onto the world to make inferences/predictions that directly bear on the data. While these inferences/predictions are not of observations or data per se, they can be conceived of as simulated observations or data. At any rate, the inferences/predictions can be directly checked against new or previously unseen data. If they come out as accurate, the models are further confirmed. If not (with enough frequency), the models must be retrained, or, in the worst case, abandoned.
To sum up, ML practices underscore both the feasibility and the importance of bidirectional data–models reasoning without requiring the explicit assumption of phenomena as mediator. Actually, reasoning from data to theory can be instrumental in identifying previously unanticipated phenomena or links between existing phenomena. Simultaneously, employing theories to make inferences/predictions that have a direct bearing on the data plays a crucial role in assessing the validity and accuracy of models.
4. Causal Bayesian nets and data
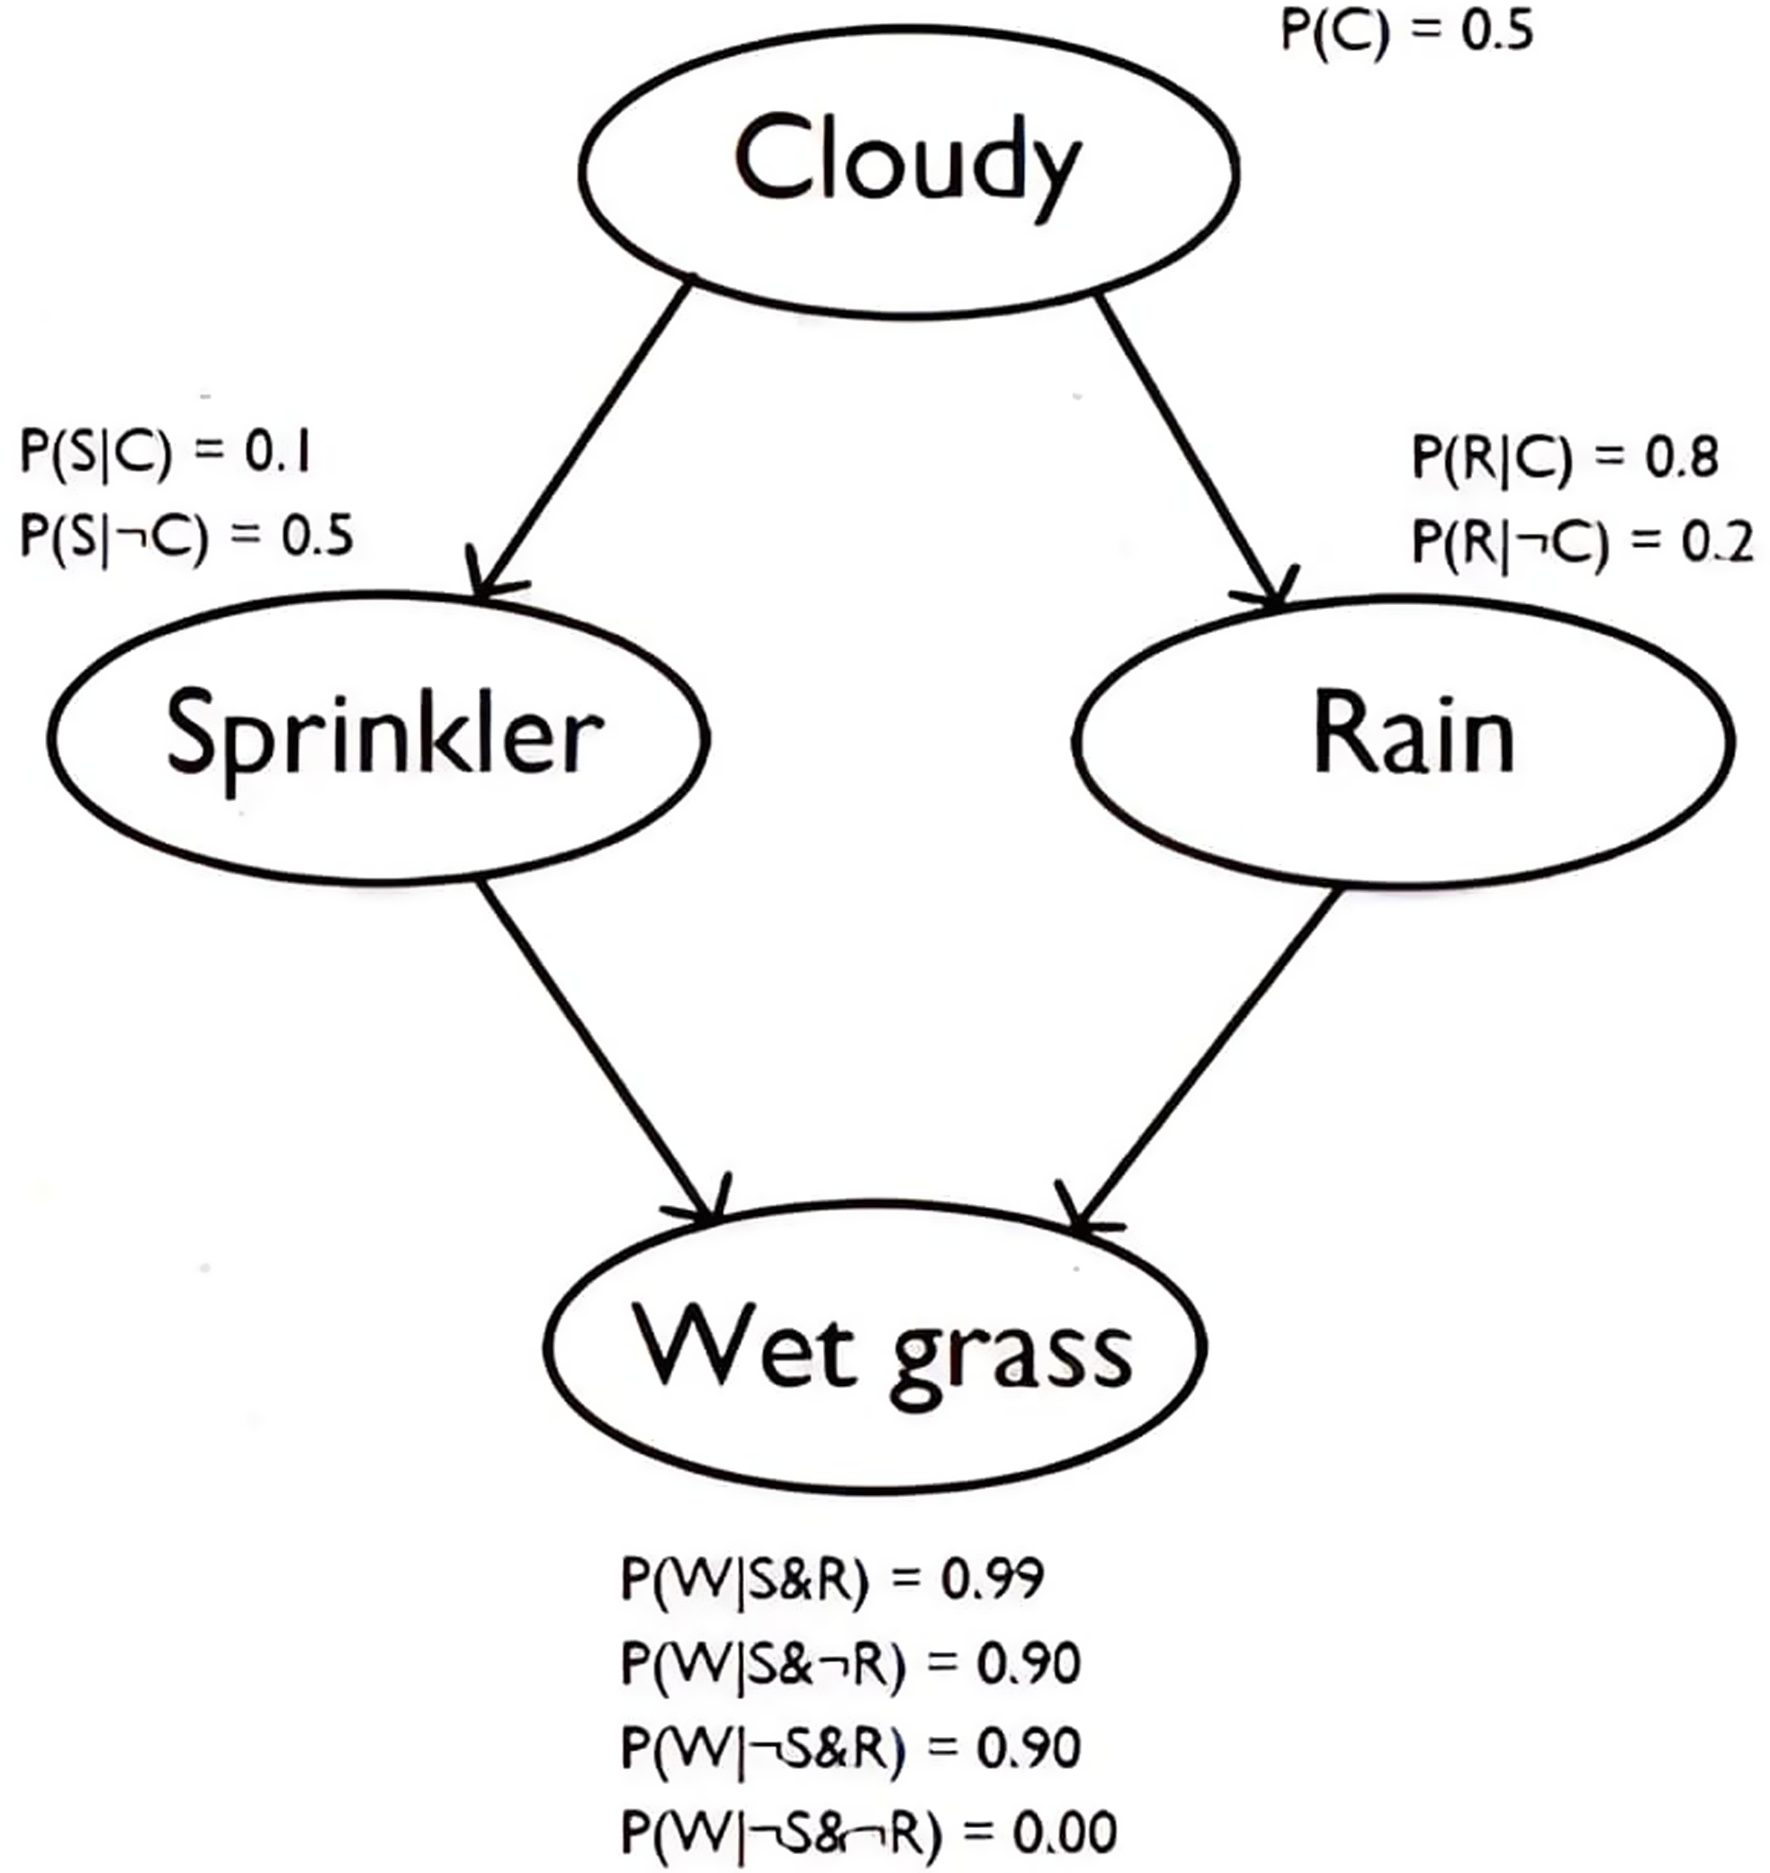
A causal Bayesian network (CBN) is a kind of model that can encapsulate theoretical claims and yet can also directly predict and explain observable data. CBNs model causal relationships amongst a set of variables of interest, as well as the joint probability distribution of those variables (Williamson Reference Williamson2005). A CBN consists of (i) a directed acyclic graph whose nodes represent the variables of interest and whose arrows represent causal relationships amongst those variables, and (ii) the probability distribution of each variable conditional on its parents in the graph. The joint distribution can be captured by the CBN if we assume the causal Markov condition: that each variable is probabilistically independent of its non-effects, conditional on its direct causes in the graph. Consider the simple example (Murphy Reference Murphy1998) of the CBN showed in Figure 1, which says that cloudy conditions affect both sprinkler use and rain, which in turn are both causes of grass being wet. Given the causal Markov condition, the conditional probability tables in the figure then suffice to determine the joint distribution over these four variables.
CBN model indicating the relationship between the variables ‘Cloudy’, ‘Sprinkler’, ‘Rain’, and ‘Wet grass’.

CBNs are widely used in ML and AI. There are many algorithms for constructing CBNs directly from data, and many algorithms for using CBNs to draw predictions, including predictions about the effects of interventions. For example, one can use the CBN in Figure 1 to predict how deciding not to use a sprinkler will influence the probability of wet grass. To see how CBNs can work in practice, consider the work of Xue et al. (Reference Xue, Cooper, Cai, Lu, Hu, Ma and Lu2019) on discovering disease mechanisms that differentiate cancer subtypes. Xue et al. used the Tumour-specific Causal Inference (TCI) algorithm to learn causal relationships between somatic genome alterations and differentially expressed genes within tumours from the Cancer Genome Atlas dataset. This allowed them to divide breast cancers into five mechanistically distinct subgroups and glioblastomas into six subgroups. These different mechanisms lead to different clinical outcomes in patients, and the authors conclude that their approach can identify clinically relevant disease subtypes.
This example illustrates the connection between CBNs and data. In one direction, data can be used to directly construct a CBN. Thus, there is a direct link from data to the model. For example, CBNs for breast cancer can be learned directly from the Cancer Genome Atlas dataset. In the other direction, CBNs predict the distribution of data: for example, they can be used to predict disease outcomes of patients with a particular kind of breast cancer. New data can then be collected to test these predictions, and thereby confirm or disconfirm the model.
In addition, there is a clear sense in which the CBNs of Xue et al. (Reference Xue, Cooper, Cai, Lu, Hu, Ma and Lu2019) encapsulate theoretical claims—claims about the differential disease mechanisms of breast and brain cancers. Thus CBNs can act as scientific theories, can be constructed directly from data, and can be confirmed or disconfirmed according to whether their predictions about data are borne out. These theoretical claims can also explain differences in outcomes amongst cancer patients, i.e., differences in data. Taken together, these facts about CBNs do not sit well with B&W’s claim that “data typically cannot be predicted or systematically explained by theory” (Bogen and Woodward Reference Bogen and Woodward1988, 305–6). In particular, no phenomena are needed to mediate between data and model.
5. Theoretically vested models
A reader may be sympathetic with the claim that there is a bidirectional relation between, on the one hand, ML and CBN models, and, on the other hand, data, without agreeing that these models can be equated to scientific theories. In this section we attempt to put this objection to bed by motivating why the aforesaid models deserve to be conceived as theories.
Sizeable disagreement exists concerning the right conceptualisation of theories and models. Some claim that theories are families of models, while others claim that theories are sets of sentences. Some view models as subordinate to theories, others as independent. Setting aside these debates, it is generally agreed that theories have greater scope and are more abstract than models. Still, both are thought of as capable of representing, generalising over, and providing explanations of phenomena (and in our view also data). That models can be explanatory is made clear by various participants in the aforementioned debates. Bokulich (Reference Bokulich2011) reports that there is “widespread use of models to explain phenomena in science” (33). Craver (Reference Craver2006) insists that “[models] are explanatory when they describe mechanisms” (367). Even Woodward, in his most celebrated work on causation, takes causal models to explain phenomena (Woodward Reference Woodward2003, 10).
We take models’ ability to represent, generalise over, and provide explanations as evidence they act as theories. After all, despite metaphysical disputes about the nature of theories, nearly all parties seem to agree that theories are what they are because they play those roles.Footnote 8 Indeed, some philosophers, make this connection more explicit: “models embody different theoretical virtues… [s]cope, precision, specificity, accuracy, generality, completeness, simplicity,… providing understanding, being explanatory, and being predictively successful” (Frigg Reference Frigg2022, 431). Having said this, we concede that most models are narrower in scope in their generalising and explanatory reach.Footnote 9 As such, they may be considered as low-level theories. To give an example, the Bohr model of the hydrogen atom can be regarded as a theory that, although less comprehensive than a high-level theory such as quantum mechanics, still represents, generalises, and explains various phenomena, namely aspects of electron behaviour such as quantised electron orbits. Given this, we hereafter say that such models are ‘theoretically vested’.
It remains to be seen whether models discussed in sections 3 and 4 are indeed theoretically vested, with particular emphasis on whether they are explanatory. In the case of CBN models, this is fairly straightforward to establish. Such models attempt to represent causal relations (a type of generalisation) and support explanations via counterfactuals. For example, a CBN model may assert that only changes in the value of a variable X systematically bring about changes in the value of a variable Y. From this, one can infer, predict, and explain that if no changes occur in the value of variable X, then no changes occur in the value of variable Y. Coincidentally, this is also the opinion of Woodward, for whom causal relationships need to be understood counterfactually (Woodward Reference Woodward2003, 10).
The case of ML models being explanatory is harder to establish. That’s because of the black-box nature of many such models. Complex models produced via deep learning are notoriously difficult to interpret and thus cannot be relied on to be explanatory. However, the SGB model presented earlier is not impacted by this, as it employs symbolic representations. These are arguably explanatory in that they track and reveal the significance of symptoms, e.g. chest pain, for risk assessment and early diagnosis in a robust way that supports counterfactual probabilities. So, for example, if chest pain were not present in patient α, then the lung cancer risk assessment for that patient is aptly revised to be more optimistic. Alas, the same cannot be said about the CNN model, as it is clearly a black box. In what follows, we attempt to motivate the claim that it still holds some explanatory value.
The CNN model challenges the simplistic assertion that nodule size is the primary indicator of malignancy. Indeed, as already noted, it outperforms other methods of detection, even when the sizes between benign and malignant nodules are matched. The problem with this model is that it is not immediately clear which aspects of nodules, e.g. texture or shape, play a discriminatory role. Even so, we would like to argue that the model is explanatory, at least in a minimal sense of the term. That’s because it clearly tells us about the relative non-significance of nodule size in lung cancer diagnoses. Doing so provides the hard-earned insight that other geometrical features (since these are the only ones encoded in the processed images) must be relevant for diagnoses.
Stronger forms of explanatory value may still be possible. Notably, there are ways to improve the interpretability, and hence potentially the explainability, of black-box models. For example, there are techniques available to identify what features are more exploited by the model, offering a glimpse into the underlying representation. One strategy employs integrated gradients (IG).Footnote 10 Broadly speaking, IG allows us to attribute an importance value to each input feature based on the gradients of the output with respect to the input, i.e., based on how changes in each feature affect predictions. IG does this by varying features from a reference point to the actual input, calculating gradients, and integrating them to capture each feature’s cumulative impact.
Another approach is pruning, which involves the selective removal of parameters or nodes from models. These are then trained/retrained using the original datasets (Le Cun et al. Reference Le Cun, Denker, Solla and David1989), to achieve “less than 10–20% of the [original model’s] size” and comparable and even higher accuracies (Frankle and Carbin Reference Frankle and Carbin2018, 1). Other methods of simplification involve weight clustering (i.e. reducing the number of unique values that weights can take) and quantisation (i.e. reducing the number of bits needed to express the parameters).Footnote 11 All these methods offer hope that neural nets may be significantly simpler, more interpretable, and more explanatory.
6. Conclusion
In this paper we sought to revaluate B&W’s data–phenomena–theory distinction. Specifically, we challenged the view that data can neither be used to make inferences about theories, nor serve as evidence for evaluating them. We did so with the help of two cases from ML practice (in the domains of lung cancer medical diagnosis and risk assessment) as well as one case from CBN practice (in the domain of cancer subtype differentiation). These cases, we argued, demonstrate the feasibility and promise of bidirectional reasoning between data and models. To counter the objection that models are not theories, we motivated the claim that models can be theoretically vested and illustrated how the specific models discussed are explanatory at various levels.
Acknowledgements
We are grateful to reviewers for their insightful and constructive feedback on earlier drafts of this manuscript. We also appreciate the valuable comments from participants at the PSA 2024 meeting in New Orleans, which helped refine and strengthen our arguments.
Financial support
None to declare.
Competing interests
None to declare.

 Open access