Assessing portion sizes of dietary intake with high accuracy (validity) has been a challenge among adults( Reference Tabacchi, Amodio and Di Pasquale 1 ) and children( Reference Foster, Adamson and Anderson 2 ). The most accurate method for estimating total energy intake is the 24 h dietary recall( Reference Burrows, Martin and Collins 3 ). However, substantial self-reporting error remains in this method( Reference Archer, Pavela and Lavie 4 ).
To minimize errors of self-report, novel technologies have used images of foods to improve the accuracy of food identification and portion size estimation( Reference Sun, Fernstrom and Jia 5 ). While different image-based methods estimate portion size in different ways, the active methods require placement of a fiduciary marker in the smartphone camera’s field of view( Reference Fang, Liu and Zhu 6 ). The eButton, a passive recording system which takes images of everything in front of a person at 4 s intervals throughout the day( Reference Beltran, Dadabhoy and Chen 7 ), uses three-dimensional flexible digital wire meshes that can be superimposed on the two-dimensional food image, manually distended or manipulated to closely adhere to the outer edge of the food image, and the volume of the three-dimensional image used to estimate the food portion size( Reference Jia, Chen and Yue 8 ).
The accuracy of this eButton three-dimensional wire mesh portion size estimation procedure has been tested with 100 Asian and Western food samples( Reference Jia, Chen and Yue 8 ). After selecting the images with food events before and after a meal, the most appropriate shaped wire mesh was selected from a virtual wire mesh shape library, and used to estimate volume and calculate portion size( Reference Jia, Chen and Yue 8 ). The wire mesh procedure employed by its designing engineers with food images obtained under naturalistic circumstances resulted in a mean relative error of 2·8 % (sd 20·4 %) against an objective index of volume (seed displacement). This mean relative error was substantially better than three human visual raters of portion size, whether they knew the sizes of the plates or did not. Our previous research with a small sample indicated that engineers scored higher validity than dietitians( Reference Beltran, Dadabhoy and Chen 7 ). Since our ultimate goal is to automate use of the wire mesh, we wanted to estimate its most accurate possible use.
The present study tested the precision (reliability) and accuracy (validity) of the use of three-dimensional wire mesh shapes as used by two experienced dietitians and three engineers from the lab that created the procedure. Validity was assessed against a known true value (but unknown by the dietitians or engineers) with the same foods and dishes, but with different portion sizes, as if before (‘served’) and after (‘left’) a meal. We expected high reliability between the two trained dietitians for the ‘served’ images (comparable to that of the engineers), since the portions were reasonably large and in usual portions, but somewhat lower reliability for the smaller irregular ‘left’ images since we believed the smaller images would present more problems in precisely deforming the wire meshes. The ‘intake’ (calculated from ‘served’ minus ‘left’) quantity (not an image) reliability was expected to be even lower, since these values reflect any unreliability in quantifying the ‘served’ and ‘left’ images. We expected the validity intraclass correlation coefficients (ICC; including a known ‘true’ value) to be only slightly lower than the reliability ICC since the previous report had 2·8 % relative error.
Methods
Seventeen foods of diverse shapes and sizes served in different plates, bowls and cups were selected (Table 1) to rigorously test the portion assessment procedure. Since the wire mesh procedure specifies volume, we elected to measure the criterion using a unit of volume (i.e. cups). A third dietitian carefully used standard cups to independently measure the quantities of food to generate the ‘true’ value for a total of seventy-five ‘served’ and seventy-five smaller ‘left’ intake images with diverse different portion sizes. For apple, orange, cheesecake wedge, slice of cake and pizza slice (those not amenable to cup assessment), the dietitian weighed the quantity to obtain the portion size, which was converted to cup equivalents using the food density obtained from the Food and Nutrient Database of Dietary Studies (FNDDS)( 9 ) database incorporated into the eButton. For each food, images were taken in different types of dinnerware (i.e. large bowl, small bowl and plain plate for food items and glass and plastic cup for drinks; Table 1). The images were presented to the dietitians and the engineers in the sequence specified by the dietitian who created this testing activity. This sequence was not randomized, but there was no attempt to simplify or complicate the sequence of images.
Foods selected for portion size validations with different dishes and wire frames
The eButton library of wire meshes contains eleven different shapes common to foods, including cuboid, cylinder, sphere, wedge, ellipse, half sphere, half ellipse, half sphere, section of sphere, tunnel and an irregular shape (Table 2). Based on the food captured in the image, the dietitians and engineers selected (independently) the wire mesh shape that best fit the food (Table 1) and the wire mesh was virtually fitted (using digital pressure points) as tightly as possible to the outer perimeter of the food image to estimate volume. Then a computer algorithm estimated the volume of the fitted wire frame to estimate portion size( Reference Jia, Chen and Yue 8 ). This procedure was followed for both ‘served’ and ‘left’ images.
Wire frames library for portion size volume estimation
Reference points are needed to calculate the real size of the food in the image. The diameter and depth of standard plates, bowls and glasses (the same as used in the images) were measured and entered into the software to calculate the food’s dimensions in relation with the image. With the dinnerware measurements, the software prompts to select six reference points, which are manually added to the image around the border of the circular dinnerware. The volume of the wire mesh (and thereby the food) can be estimated with the correspondence of the spatial points and the picture points( Reference Jia, Chen and Yue 8 ).
Two dietitians (not including the third dietitian who created the test images) with extensive experience in use of the wire mesh procedure in two earlier studies( Reference Beltran, Dadabhoy and Chen 7 ) (but no specialized training) and three engineering students who participated in the programming of the eButton software (but without any training in use of the eButton wire mesh procedure) independently estimated portion size of the larger (‘served’) and smaller (‘left’) images for the same foods. The wire mesh volumes were estimated by each rater independently, blinded from both the true measure and each other’s estimates.
Data analysis
The primary output of the wire mesh is ‘volume’ in cubic centimetres. The reliability-related ICC( Reference Shrout and Fleiss 10 ) was used between the two dietitians to assess reliability of portion assessment, and across the two dietitians and the true value to assess validity of portion assessment. The equation for ICC is:
 $$\eqalignno{ \hskip-5pc{\rm ICC}\, {\equals}\, \left( {{\rm no}{\rm .\,of}\,{\rm raters}\,/\,{\rm no}{\rm . }\,{\rm of}\,{\rm raters}\!\mines-\!{\rm 1}} \right)$$
 $$\eqalignno{ \quad \,\,\quad {\times}\left( {{\rm 1}\!\mines-\!{\rm individual}\,{\rm variance}\,/\,{\rm sum}\,{\rm of}\,{\rm variances}} \right).$$
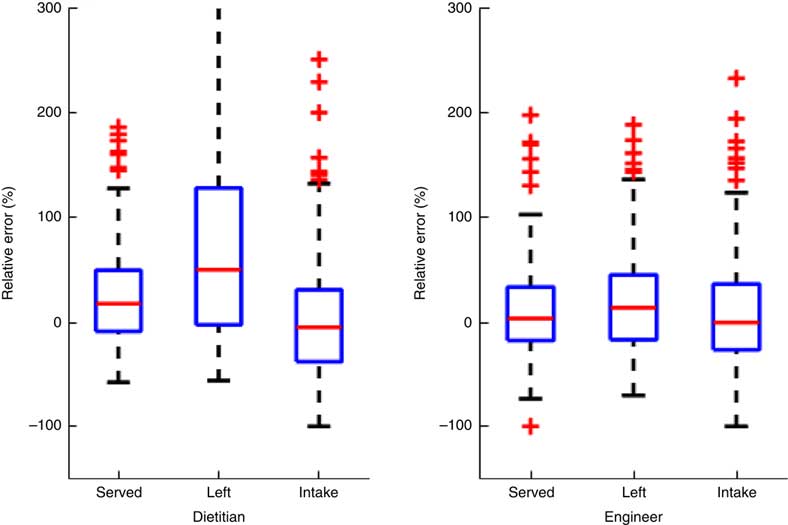
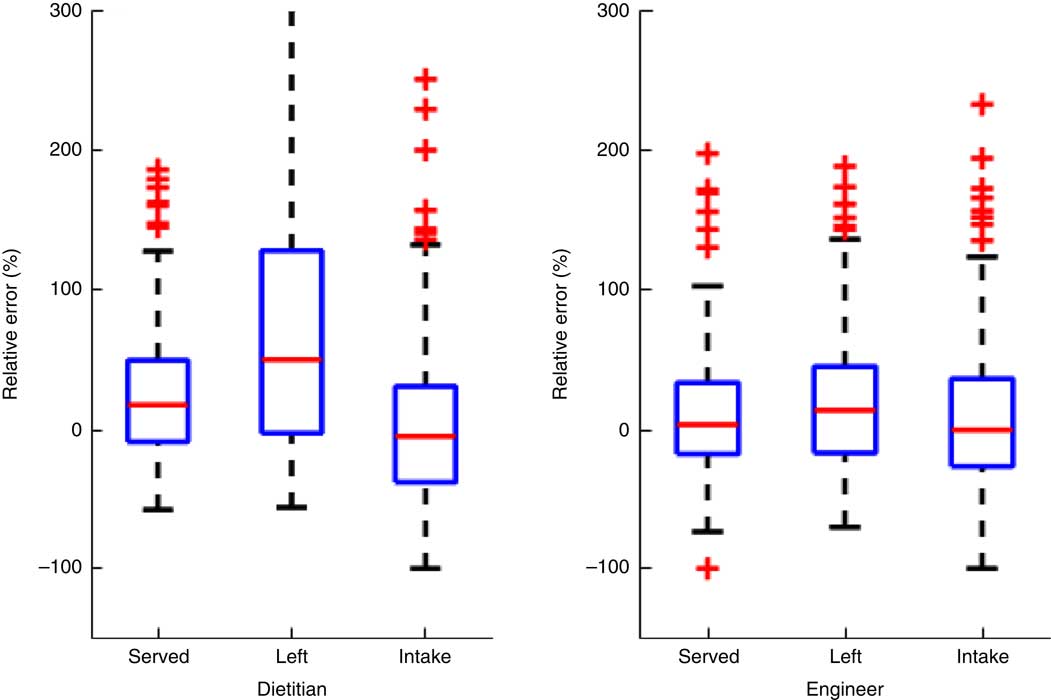
The volume assessments were provided by the eButton software using FNDDS 2013–2014 data( 11 ) for the volume of the food in the images. There were 150 total images (including seventy-five ‘served’ and seventy-five ‘left’ images) across all foods and dinnerware. Table 3 includes the ICC and 95 % CI for reliability and validity for the dietitians and engineers separately. Table 4 presents the same coefficients and 95 % CI, but for subsets by type of dinnerware. Since separating the images into serving container type categories resulted in a small number of images per category, the served and left images were combined for these analyses alone. Table 5 presents estimates of relative error percentages (true value–estimated value/true value) for dietitians and engineers separately. Figure 1 presents box-and-whisker plots of the relative error percentages to depict the distributions of error by type of image and professionals.
(colour online) Box-and-whisker plot of relative error percentages for the two dietitians and three engineers. On each box, the central line represents the median of the relative errors over all the food samples. The bottom and top edges of the box are respectively the first and third quartiles, which is the interquartile range (IQR). The extreme regions (with a greater distance from the median than 1·5 times the IQR) are the ends of the lines extending from the IQR. Points outside this region are plotted individually as plus signs, representing potential outliers. The highest relative error for dietitians for the ‘left’ images was 1100, which was substantially off the scale, the inclusion of which distorted the scale representation for all the other cases
Reliability coefficients with 95 % CI for different portion variables across different raters and the true value
ICC, intraclass correlation.
Intake is calculated as the difference between the initial ‘serving’ and what is ‘left’ on the plate, but if the estimated volume of the leftover is larger than the served, the intake is set to 0.
Intraclass correlation coefficients (ICC) with 95 % CI for different serving containers
The total number of images in this analysis is 146. Four ‘glass’ images were excluded since the same was too small to reliably estimate the ICC. Since separating the images into serving container type categories resulted in a small number of images per category, the ‘served’ and ‘left’ images were combined for these analyses alone.
Statistics of relative error percentages for dietitians and engineers separately

Relative error=[(observed−true)/true]×100; IQR, interquartile range (also called the mid spread or middle 50 %, equals the difference between the 75th and 25th percentiles).
Note: (i) *Since the real food intake in one image is zero, the relative errors from two dietitians and three engineers for this food had to be eliminated. (ii) For median values of relative error: intake<served<left. (iii) Big estimation variance can be seen in IQR, especially for ‘left’ food, probably due to the small size of the leftover. (iv) Median values (‘served’ and ‘left’) for dietitians are positive and larger than the estimates from engineers. This may be caused by the fitting procedure if outer perimeter is used. But fortunately, when calculating the volume of intake, such bias can be cancelled to some extent. (v) Overestimation can be seen in all of these conditions.
Results
Inter-rater (between the two dietitians) reliability ICC were acceptably high for volume served (0·771, 95 % CI 0·660, 0·849), but lower for volume left (0·629, 95 % CI 0·470, 0·748) and intake volume (0·590, 95 % CI 0·420, 0·720). When the ICC were calculated to include the true value (i.e. the amount actually included in the images by the third dietitian), the validity ICC were similar for volume served (0·766, 95 % CI 0·680, 0·836) and volume left (0·596, 95 % CI 0·474, 0·706), but increased substantially for intake volume (0·677, 95 % CI 0·569, 0·769; Table 3). The reliability coefficients for the three engineers were higher than for the dietitians for volume served (0·820, 95 % CI 0·750, 0·876), volume left (0·847, 95 % CI 0·786, 0·895) and intake volume (0·755, 95 % CI 0·666, 0·828; Table 3). The same was true for their validity coefficients.
When the same reliability ICC for intake volumes were estimated by type of serving container, the highest ICC were obtained for the plate (Table 4). The median relative error percentage across the dietitians for volume was 17·9 % for served, 50·7 % for left and −4·6 % for intake (Table 5). The engineers obtained substantially lower median relative error percentages for volume, with 3·7 % for served, 14·1 % for left and −0·03 % for intake. A box-and-whisker plot of the data in Table 5 (see Fig. 1) demonstrates the distributional differences in the relative error percentages between the dietitians and engineers.
Discussion
We anticipated high reliability and validity by both the dietitians and the engineers for the larger portions in the ‘served’ images, but lower reliability for the smaller ‘left’ images, which were more irregular and thereby harder to precisely fit with a wire mesh. As expected, the inter-recorder reliability (r) and validity (v) for volume served (r=0·771, v=0·766) by experienced dietitians from food images was reasonably high, but lower for volume left (r=0·629, v=0·596; Table 3). One immediately notices that both the reliability and validity values obtained by the engineers were higher for volume served (r=0·820, v=0·815) and substantially higher for volume left (r=0·847, v=0·832). Lower reliability was expected for the calculated intake volume, since the ‘serving’ minus ‘left’ values would combine errors from the two estimates. This was true for both the dietitians (r=0·590, v=0·677) and the engineers (r=0·755, v=0·745). Furthermore, reliability and validity values were consistently high among the engineers, whereas the validity values were lower for the dietitians than the engineers. The relative error percentages (Table 5) support this pattern of findings, suggesting that the dietitians had not mastered the manipulation of the wire mesh to closely conform to the outer boundary of the food image whereas the engineers who helped create the wire imaging system did. While the lower reliability and validity for intake volume reflects the unreliability in both the volumes served and left, and thereby was expected, this indicates substantial error in using the difference to estimate intake (even for the engineers).
The validity ICC for volume served for the dietitians (0·766) and the engineers (0·815) were comparable to the reliability ICC for volume served (0·771, 0·820), reflecting reasonable concordance between raters with the true value. The substantial drop in the validity ICC for volume left for the dietitians (0·596), but not for the engineers (0·832), suggests that dietitians had difficulty estimating the smaller irregular amounts, which might be improved, perhaps through training, to approximate that of the engineers.
A review of the images revealed several problems among the dietitians and engineers (but more among the dietitians): (i) when a portion of the plate or bowl was not fully within the image, the mesh could not fit the food completely; (ii) the mesh was not always adjusted to completely and closely fit the food image; (iii) when the shape of the food was irregular, the wire mesh could not precisely fit the food image; (iv) the size of the plate or bowl was occasionally mis-specified; and (v) some foods in FNDDS did not have density, thereby introducing inaccuracies in conversions of weight to volume and vice versa. Enhanced training will minimize some of these errors, but further technological development is needed to address issue (iii) and improved food analytic data are needed to address issue (v).
The reliability ICC for the three serving containers were higher for the plates than for the bowls for both the dietitians and the engineers, and somewhat lower for the smaller than the larger bowls (Table 4). The likely explanation is it was more difficult to insert the wire meshes below the line of vision into the bottom of the opaque bowls, and the curved nature of the bowls, thereby leading to more error.
The engineers’ use of the wire meshes resulted in consistently higher reliability and validity ICC and substantially lower median relative error percentages than the dietitians. Furthermore, the engineers’ validity coefficients (ICC across the engineers and true value) were almost as large as their reliability coefficients (Table 3), suggesting high accuracy in use of the wire mesh method is possible. The median relative error percentage was not as low as that reported in a previous paper from their group (2·8 %)( Reference Jia, Chen and Yue 8 ), suggesting these engineering students could improve their technique, especially for the smaller portions of food ‘left’ (14·1 %). The substantially lower median reliabilities and validities and the higher median error for dietitians indicates that the engineers knew better how to correct for problems/limitations in the wire mesh procedure. Despite their substantial prior experience in using the meshes, the dietitians could benefit from more thorough training including trial-by-trial feedback on their performance.
Desirable training in the use of the meshes for credentialed dietitians (i.e. who know the intricacies of 24 h recall methods) without previous experience with the passive method would likely include: a video demonstration of the use of the multiple flex points per wire mesh to deform or reform the wire mesh; application of the different wire meshes to diverse images of foods (e.g. mounds, pie, irregular pieces of meat, soup in a bowl); demonstration of common errors in using the wire mesh (e.g. wire mesh boundary not tightly conforming to the food image boundary, tubular wire mesh not distending to conform to the curved nature of a bowl); practice in using the wire mesh with diverse foods; and feedback on the practice volume estimations. At the end of the training, trainees should be tested on images and allowed to retake the test as needed to pass. The number of images and the criterion for acceptable accuracy need further research to accurately determine performance in real-world circumstances.
A limitation of the current study is that all eleven meshes were not adequately tested. Additional research will be needed employing a number of foods for which each of the underused meshes is appropriate to estimate the same values. The dietitians and engineers were allowed to select the mesh they thought most appropriate to each food, with substantial differences in which wire meshes were used per food. Part of the error may reflect differences in appropriateness of each wire mesh for each food. More thorough analysis needs to be done on errors that the dietitians made, but were not by the engineers, to identify ways to enhance future dietitian performance.
Conclusion
The wire mesh procedure for estimating portion size in food images is an important step forward in quantifying a variable which has been subject to substantial self-report error. The engineers who helped create the procedure had higher reliability and validity than the dietitians who had substantial prior experience in using the procedure, but no direct feedback on the accuracy of their estimates, suggesting more intensive analysis is needed to identify where the biggest errors occurred and training procedures are needed that can overcome them. Additional development with the meshes and training in use of the meshes are needed to advance this method of dietary assessment.
Acknowledgements
Financial support: This research was funded by a grant from the National Institutes of Health, National Cancer Institute (number 5 R21 CA172864) and institutional support from the US Department of Agriculture, Agricultural Research Service (Cooperative Agreement 58-3092-5-001). The funders had no role in the design, analysis or writing of this article. Conflict of interest: The authors have no disclosures to report. Authorship: A.B. conceptualized the study, was the project manager, conducted data collection and use of the wire mesh, and wrote a preliminary draft of the manuscript. H.D. participated in data collection and use of the wire mesh. C.R. created the portion images. R.D. conducted the statistical analyses. J.B. was the project coordinator. Y.L. and G.L. helped create the wire meshes and participated in use of the wire meshes on the images. W.J. helped create the wire meshes, managed the engineer use of wire meshes and conducted statistical analyses. M.S. was principal investigator for creation of the eButton and conceived of the wire meshes. T.B. was principal investigator for the overall project, helped conceptualize this study and wrote the successive drafts of the manuscript. All authors reviewed, critiqued and approved this manuscript. Ethics of human subject participation: Not applicable.