


Introduction
Population metrics provide a guiding tool for conservation action and decision-making (Mace et al., Reference Mace, Collar, Gaston, Hilton-Taylor, Akçakaya and Leader-Williams2008), which is particularly important within the context of accelerating declines in global biodiversity (IPBES, 2019). Such knowledge can be used to identify species and areas of conservation concern, monitor and mitigate potential environmental threats and direct limited resources towards achieving conservation goals. Reliable population estimates help to ensure decisions by policymakers, wildlife managers and conservation organizations are made based on the best available information.
Genetic analyses of faecal and hair samples allow for non-invasive individual recognition of animals (Mowry et al., Reference Mowry, Gompper, Beringer and Eggert2011). Although such analyses could be combined with sign surveys to develop reliable density estimates (Hájková et al., Reference Hájková, Zemanová, Roche and Hájek2009), the relatively high cost presents a barrier, and the genetic markers currently used for many otter species are not species-specific (Ponsonby et al., Reference Ponsonby, Madisha, Schwaibold and Dalton2019). In addition, this method requires fresh samples to prevent DNA degradation, which can be difficult to obtain for elusive species (Majelantle et al., Reference Majelantle, McIntyre and Ganswindt2020). Radio tracking is another innovative method for reliably estimating population parameters (Millspaugh & Marzluff, Reference Millspaugh and Marzluff2001; Gettelman et al., Reference Gettelman, Nielsen, Scimeca and Schauber2022), but it is invasive and often not practical because of the high cost and capture effort required for elusive animals. An alternative non-invasive method is the use of remote camera traps. Estimating population sizes from camera-trap images initially required individual animals to be recognizable through natural markings (e.g. unique patterns of stripes or spots) or invasive marking/tagging techniques (Hiby et al., Reference Hiby, Lovell, Patil, Kumar, Gopalaswamy and Karanth2009; ENETWILD Consortium et al., Reference Podgórski, Acevedo, Apollonio, Berezowska-Cnota and Bevilacqua2020). However, improvements in statistical models have revolutionized camera-trap monitoring of unmarked animals, offering a relatively non-invasive and economically viable alternative to traditional methods of estimating population numbers (Gilbert et al., Reference Gilbert, Clare, Stenglein and Zuckerberg2020; Palencia et al., Reference Palencia, Rowcliffe, Vicente and Acevedo2021). In addition, camera traps can be used to record animal behaviour with minimal disturbance (Rowcliffe et al., Reference Rowcliffe, Kays, Kranstauber, Carbone and Jansen2014; Wearn & Glover-Kapfer, Reference Wearn and Glover-Kapfer2017). This is particularly valuable for the study of unmarked, rare, elusive and nocturnal animals, such as many otter species (Duplaix & Savage, Reference Duplaix and Savage2018; Gil-Sánchez & Antorán-Pilar, Reference Gil-Sánchez and Antorán-Pilar2020).
Otters are challenging to observe directly, resulting in the widespread use of field signs to indirectly estimate their abundance, behaviour, activity patterns and habitat preferences (Kruuk & Conroy, Reference Kruuk and Conroy1987; Stander, Reference Stander1998; Sadlier et al., Reference Sadlier, Webbon, Baker and Harris2004). Although useful in confirming animal presence, there is no correlation between otter signs and population size or activity (Kruuk et al., Reference Kruuk, Conroy, Glimmerveen and Ouwerkerk1986; Kruuk & Conroy, Reference Kruuk and Conroy1987; Gallant et al., Reference Gallant, Vasseur and Bérubé2007; Yoxon & Yoxon, Reference Yoxon and Yoxon2014). Spraint surveys are commonly used to assess populations, yet sprainting often takes place in the water, or spraints may be washed away by rainfall or rising tides. Seasonal and regional differences in sprainting behaviour could further obscure the relationship between otter signs and population numbers (Kruuk et al., Reference Kruuk, Conroy, Glimmerveen and Ouwerkerk1986; Kruuk, Reference Kruuk2006). Density estimates based on sign indices should thus be interpreted with caution unless validated through other measures (e.g. direct observation, camera trapping, radio tracking or use of non-invasive genetic sampling).
The African clawless otter Aonyx capensis is widely distributed, from Senegal to Ethiopia and southwards to South Africa (Nel & Somers, Reference Nel and Somers2007). It is found in diverse habitats, from marine areas to deserts, provided that permanent fresh water is available (Nel & Somers, Reference Nel and Somers2007). Despite the species’ widespread distribution, population counts are mostly restricted to South Africa, making these studies central to global conservation assessments. The species was recently reassessed as Near Threatened on the IUCN Red List, partly in response to reported declines of otter signs in the Drakensberg, South Africa (Perrin & Carugati, Reference Perrin and Carugati2006; Kubheka et al., Reference Kubheka, Rowe-Rowe, Alletson and Perrin2012), together with expected declines caused by anthropogenic changes (Jacques et al., Reference Jacques, Reed-Smith and Somers2021).
Current estimates of African clawless otter populations are based on a small number of studies. By measuring radioisotopes in spraints from isotopically labelled free-roaming otters (Arden-Clarke, Reference Arden-Clarke1986) and/or sign abundance combined with direct observations (Verwoerd, Reference Verwoerd1987), densities of coastal populations in the Eastern and Western Cape of South Africa were estimated to be 1 otter/1.9–2.0 km. Density estimates in fresh water are more varied, varying from 1 otter/8–10 km (Zimbabwe; Butler & Du Toit, Reference Butler and Du Toit1994) to 1 otter/3–4 km (Drakensberg; Rowe-Rowe, Reference Rowe-Rowe1992) and 1 otter/1.25–2.50 km (Drakensberg; Perrin & Carugati, Reference Perrin and Carugati2006). Notably, most of these inferences on population density are based on abundance indices (sign counts), and no studies have yet utilized radio tracking or non-invasive genetic sampling to estimate population numbers. Majelantle et al. (Reference Majelantle, Ganswindt, Jordaan, Slip, Harcourt and McIntyre2021) estimated African clawless otter densities by applying random encounter models to camera-trap data collected from three study sites. Density estimates varied between 0.73 ± SD 0.24 and 8.30 ± SD 2.40 otters/km2, the latter at an artificially stocked fly-fishing estate.
Converting animal encounter rates from camera traps into density estimates requires the use of statistical models, depending on the information available. Capture–mark–recapture approaches, frequently used for monitoring carnivore populations, require individually recognizable animals. African clawless otters lack natural markings and would have to be captured and marked to apply this method. In contrast, random encounter models and camera-trap distance sampling do not require individual identification. Random encounter models (developed by Rowcliffe et al., Reference Rowcliffe, Field, Turvey and Carbone2008) estimate population density based on the rate of contact between animals and camera traps, applying a modified version of ideal gas theory. This model requires knowledge of animal movement data and makes a number of assumptions: (1) random placement of camera traps, (2) animal movements are independent of/not affected by cameras, (3) encounters are independent events, and (4) population closure (Rowcliffe et al., Reference Rowcliffe, Field, Turvey and Carbone2008, Reference Rowcliffe, Kays, Carbone and Jansen2013). A key requirement of the approach is the random placement of camera traps to ensure the sample taken is representative of the study area and that camera placement does not bias outcomes (i.e. cameras are not located in places that animals preferentially use or avoid; Rowcliffe et al., Reference Rowcliffe, Kays, Carbone and Jansen2013). In addition, surveys should last a minimum of 500 trap-days and at least 10 independent encounters should ideally be obtained for each random encounter survey (Rowcliffe et al., Reference Rowcliffe, Field, Turvey and Carbone2008). This model has been validated against density estimates derived using other methods (Manzo et al., Reference Manzo, Bartolommei, Rowcliffe and Cozzolino2012; Zero et al., Reference Zero, Sundaresan, O'Brien and Kinnaird2013; Anile et al., Reference Anile, Ragni, Randi, Mattucci and Rovero2014; Caravaggi et al., Reference Caravaggi, Zaccaroni, Riga, Schai-Braun, Dick, Montgomery and Reid2016; Pfeffer et al., Reference Pfeffer, Spitzer, Allen, Hofmeester, Ericsson and Widemo2018; Palencia et al., Reference Palencia, Rowcliffe, Vicente and Acevedo2021). Where animal movement information is not available, and it is thus not possible to apply random encounter models, distance sampling offers an alternative to density estimation, provided that distances to animal encounters can be measured. Howe et al. (Reference Howe, Buckland, Després-Einspenner and Kühl2017) extended the use of distance sampling to camera-trap data based on the rationale that infrared sensors are more likely to detect animals at close proximity and thus a detection probability can be fitted to the distance from an observed animal to the camera. Camera-trap distance sampling follows the same assumptions as random encounter models, with one addition: snapshot moments (i.e. predetermined moments at which an animal could be detected) are selected independently of animal locations (Howe et al., Reference Howe, Buckland, Després-Einspenner and Kühl2017). This method has been shown to produce similar results to distance sampling using line transects (Corlatti et al., Reference Corlatti, Sivieri, Sudolska, Giacomelli and Pedrotti2020) and has also been validated against other methods (Cappelle et al., Reference Cappelle, Després-Einspenner, Howe, Boesch and Kühl2019, Reference Cappelle, Howe, Boesch and Kühl2021; Harris et al., Reference Harris, Butler, Stewart, Rominger and Ruhl2020; Palencia et al., Reference Palencia, Rowcliffe, Vicente and Acevedo2021).
We aimed to estimate and compare densities of African clawless otters at six study areas in southern Africa using random encounter models and camera-trap distance sampling as a corroborative methodology. This will serve as an empirical comparison for the recently developed camera-trap distance sampling method and, to the best of our knowledge, is its first application to a semi-aquatic species. In addition to calculating density estimates, we aimed to determine and compare activity patterns between study areas.
Study areas
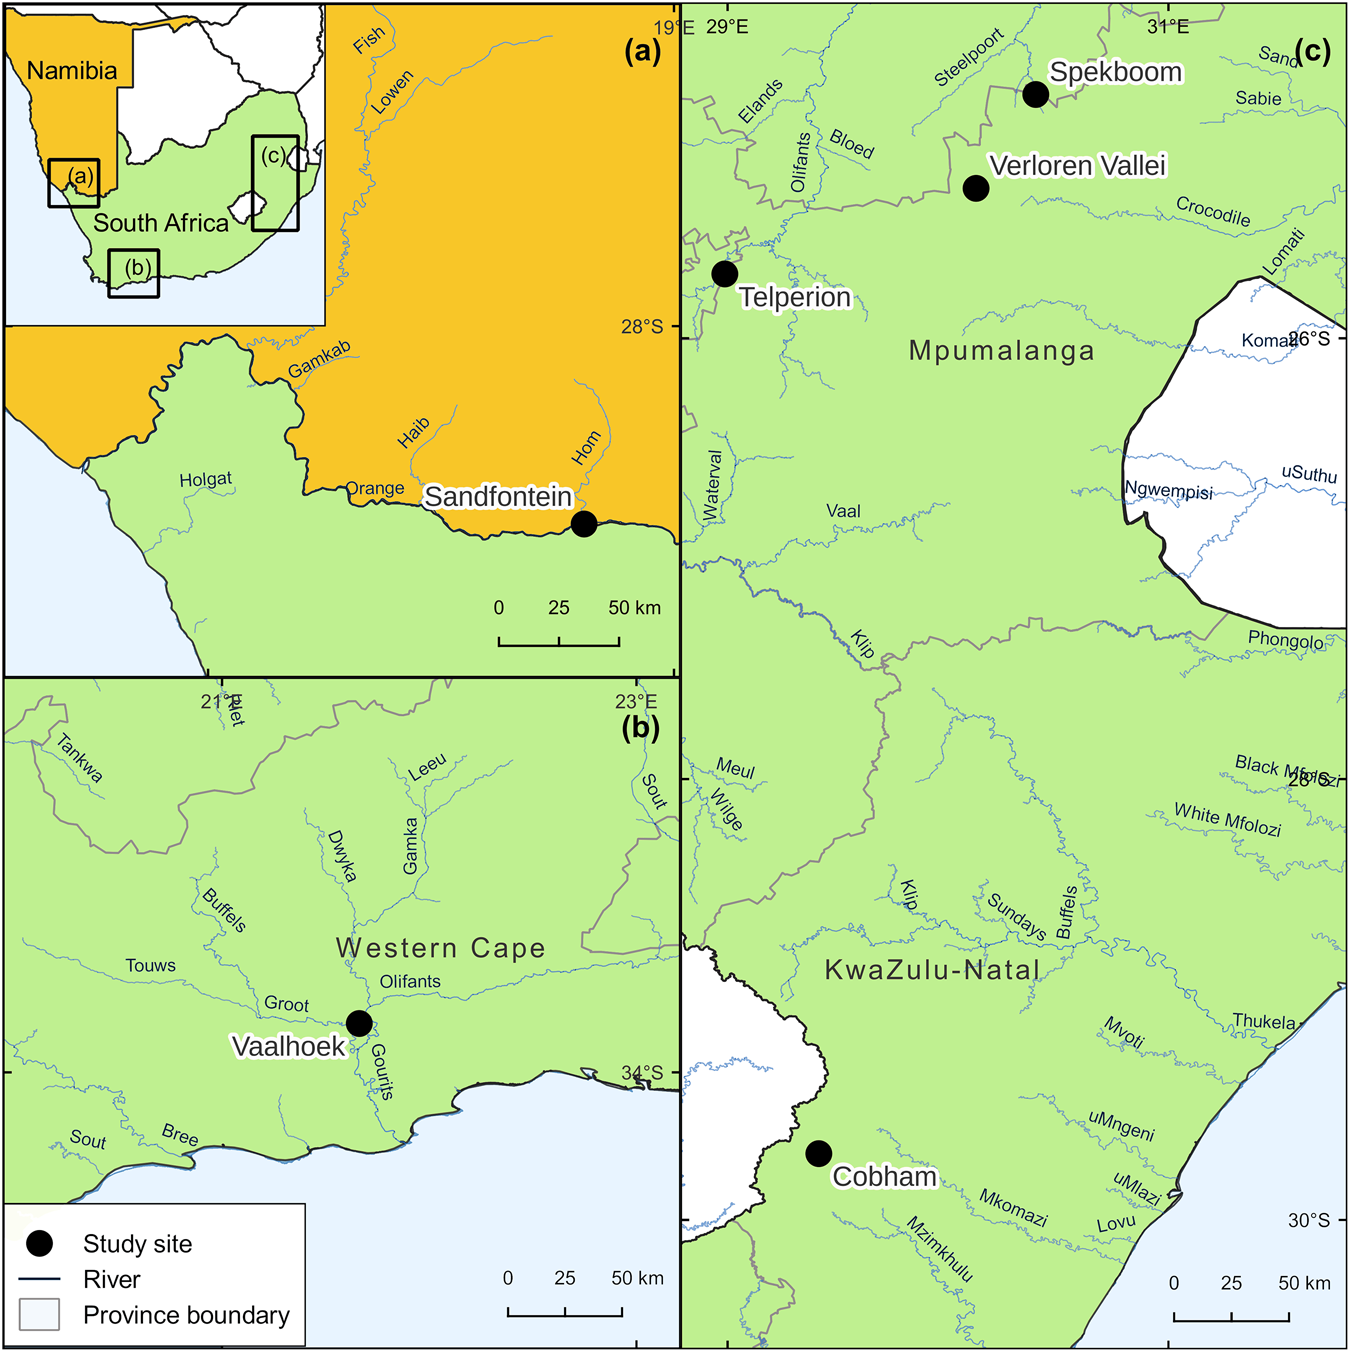
We collected data in five study areas in South Africa and one in Namibia (Fig. 1). We selected these sites to cover a variety of freshwater and surrounding terrestrial habitat types (Table 1) in ecologically conserved areas with little direct anthropogenic disturbance. Three study sites are in Mpumalanga Province, South Africa: Telperion Nature Reserve (73.5 km2), where we placed camera traps along the Wilge River; Verloren Vallei Nature Reserve (60 km2), where camera traps were placed along drainage lines and streams from the Lunsklip River; and Rietvaley Farm (Spekboom; 50.6 km2), with camera traps placed along the Spekboom River. The 520 km2 Cobham Nature Reserve is located in the southern Maloti-Drakensberg, KwaZulu-Natal Province, South Africa; we positioned camera traps here along the Pholela River. In Vaalhoek Nature Reserve (12 km2) in the Gamkaberg, Western Cape, South Africa, we placed camera traps along the Gourits River. In the 213 km2 Sandfontein Nature Reserve in Karas, Namibia, camera traps were positioned along the Orange River. The camera-trap data collected at Verloren Vallei Nature Reserve and Cobham Nature Reserve were previously reported by Majelantle et al. (Reference Majelantle, Ganswindt, Jordaan, Slip, Harcourt and McIntyre2021). Here, we re-analysed this dataset together with the data collected from the additional four study areas.
Locations of study areas in southern Africa where we conducted camera-trap surveys of African clawless otters Aonyx capensis: (a) Sandfontein Nature Reserve; (b) Vaalhoek Nature Reserve; and (c) Spekboom river site (Rietvaley Farm), Verloren Vallei Nature Reserve, Telperion Nature Reserve and Cobham Nature Reserve.

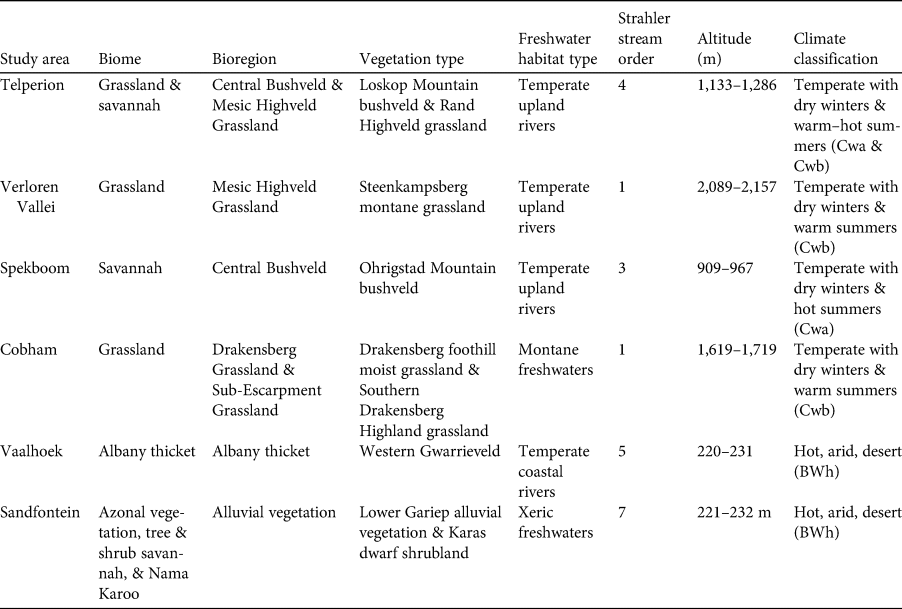
The biomes, bioregions, vegetation types (Atlas of Namibia Project, 2002; SANBI, 2018), freshwater habitats (WWF & TNC, 2008), Strahler stream orders (DWS, 2020), altitudes and Köppen–Geiger climate classifications (Beck et al., Reference Beck, Zimmermann, McVicar, Vergopolan, Berg and Wood2018) at the study sites in southern Africa (Fig. 1), 50 m from the edge of the water on both sides of each river (i.e. a 100 m zone).

Methods
Camera-trap deployments
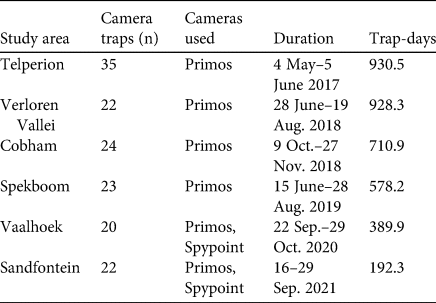
We set up camera traps at Spekboom (n = 23), Verloren Vallei (n = 22), Telperion (n = 35), Cobham (n = 24), Vaalhoek (n = 20) and Sandfontein (n = 22) during 2017–2021 over a period of 3,730 trap-days. We deployed Primos ProofCam3 (Primos Hunting, USA) and Spypoint Solar Dark (GG Telecom, Canada) camera traps (Table 2). The semi-aquatic habitat of African clawless otters does not allow for randomized placement of camera traps and we therefore adopted a supervised systematic design whereby cameras were placed systematically at set distance intervals inside riparian habitats at points that we considered accessible to otters (i.e. within 15 m of stream edges). We placed camera traps at distances of 200–300 m from one another, with the exact distance determined largely by environmental constraints. We avoided placing cameras near otter latrines or signs to reduce sampling bias. We mounted camera traps to trees or wooden stakes at heights of 20–100 cm and set them to record image bursts of 3–4 images, with a 3 s delay between triggers. We marked out distances from each camera trap at 1 m intervals within the field of view, up to a maximum distance of 15 m from camera traps, to provide in situ reference images for calibration of the detection distances of each recorded animal.
Synopsis of camera deployments for the study areas in southern Africa.

Camera-trap data analyses
We collected data by manually processing images, noting all otter detections. We then obtained density estimates by applying two different modelling techniques: random encounter models and camera-trap distance sampling (Rowcliffe et al., Reference Rowcliffe, Field, Turvey and Carbone2008; Howe et al., Reference Howe, Buckland, Després-Einspenner and Kühl2017).
Random encounter models
Random encounter models calculate density (D) based on the number of independent detections of the target species, animal speed, survey effort and area of camera detection viewshed (Rowcliffe et al., Reference Rowcliffe, Field, Turvey and Carbone2008) using Equation 1:

where y is the number of independent encounters of the target animal, t the number of trap-days (number of camera traps × number of days), V the day range (distance travelled by the target animal per day), r the detection distance and θ the effective detection angle (2ai, where ai is the angle between the midline of the camera's field of view and the detected animal, which is doubled for the full effective detection angle), with r and θ together denoting the camera trap's effective detection zone.
Typically, threshold time intervals are used to define independent encounters, the duration of which is based on the movement patterns of the target species. Threshold time intervals are generally not necessary for top carnivores that move quickly with directional movement (Wearn & Glover-Kapfer, Reference Wearn and Glover-Kapfer2017). However, based on our knowledge of African clawless otter movement, we adopted a threshold time interval of 30 min between detections to guard against overestimating densities when using the random encounter model (Majelantle et al., Reference Majelantle, Ganswindt, Jordaan, Slip, Harcourt and McIntyre2021). We calculated trap-days (t) by summing the individual time durations that camera traps were active for all camera traps. We estimated the day range of otters (V = 8.278 km/day) using published VHF telemetry and movement data (Somers & Nel, Reference Somers and Nel2004b; Majelantle et al., Reference Majelantle, Ganswindt, Jordaan, Slip, Harcourt and McIntyre2021). The estimation of r and θ followed the methodology of Rowcliffe et al. (Reference Rowcliffe, Carbone, Jansen, Kays and Kranstauber2011), which incorporates species- and survey-specific dimensions of the camera detection viewshed. We estimated both of these variables based on the locations of African clawless otters in each encounter, using the first image capture of each otter encounter. We estimated the detection distance (r) by comparing the distance from the camera traps at which otters appeared in the images to the reference distances established during calibration. We estimated the angle of detection (ai = θ/2) by superimposing detection images with overlays appropriate to the specific camera field of view. This approach seeks to measure the zone of detection for the specific target population, which is considered good practice when applying random encounter models (Palencia Mayordomo, Reference Palencia Mayordomo2021). We estimated the angle of detection in degrees and then converted this to radians. To this end, we estimated the field of view to be 35° for the Primos camera traps, derived from ex situ field trials conducted previously (McIntyre et al., Reference McIntyre, Majelantle, Slip and Harcourt2020), and 42° for the Spypoint camera traps, based on manufacturer guidelines and performance reviews (Trailcampro, Reference Trailcampro2020). We conducted all statistical analyses applying random encounter models using the remBoot package (Caravaggi, Reference Caravaggi2017, Reference Caravaggi2022) in R 4.3.1 with the RStudio interface (R Core Team, 2023). After calculating density estimates we used non-parametric bootstrapping with 10,000 iterations (Rowcliffe et al., Reference Rowcliffe, Field, Turvey and Carbone2008) to calculate measures of variance, including standard error, standard deviation and 95% confidence limits.
Distance sampling
Camera-trap distance sampling applies the well-established point transect method to camera traps. This method accounts for imperfect detection by modelling detection probability as a function of the distance between cameras and detected animals using Equation 2 (Howe et al., Reference Howe, Buckland, Després-Einspenner and Kühl2017, Reference Howe, Buckland, Després-Einspenner and Kühl2019).

where t denotes the duration of predetermined snapshot moments (e.g. 2 s), nk the number of observations of target animals from each camera station (point k), θ the horizontal angle of view, w the truncation distance (after which distances are discarded), Tk the time of deployment (number of trap-days), and $\hat{P}$ k the estimated probability of obtaining an image of an animal (this is estimated using ri, the radial distance to the midpoint of each animal from the camera).
Camera-trap distance sampling requires temporal availability to be incorporated within Tk to avoid negative bias (Howe et al., Reference Howe, Buckland, Després-Einspenner and Kühl2017). Therefore, we used animal activity to estimate the proportion of time when otters were available for detection (Table 3), and adjusted Tk using the outputs of fitted circular kernel models. Following Howe et al. (Reference Howe, Buckland, Després-Einspenner and Kühl2017) we selected a short interval between snapshot moments (t = 1 s) to obtain an adequate sample size given the fast-moving and elusive nature of the African clawless otter. We measured distances (ri) between the camera and each detected animal at each snapshot moment using the distance reference images. Animal reactivity (i.e. attraction or avoidance) to camera traps is likely to result in violation of distance sampling assumptions and could bias density estimates (Buckland et al., Reference Buckland, Rexstad, Marques and Oedekoven2015; Howe et al., Reference Howe, Buckland, Després-Einspenner and Kühl2017; Cappelle et al., Reference Cappelle, Després-Einspenner, Howe, Boesch and Kühl2019, Reference Cappelle, Howe, Boesch and Kühl2021; Bessone et al., Reference Bessone, Kühl, Hohmann, Herbinger, N'Goran and Asanzi2020). To reduce this bias, we excluded all distance observations with obvious signs of animal reactivity (e.g. inspection and sniffing of cameras). We overcame bias associated with overdispersion and invalid goodness-of-fit tests (Howe et al., Reference Howe, Buckland, Després-Einspenner and Kühl2017, Reference Howe, Buckland, Després-Einspenner and Kühl2019) by using non-parametric bootstrapping, by resampling points with replacements (Buckland et al., Reference Buckland, Anderson, Burnham and Laake1993; Howe et al., Reference Howe, Buckland, Després-Einspenner and Kühl2017) and by adopting the two-step model selection procedure outlined in Howe et al. (Reference Howe, Buckland, Després-Einspenner and Kühl2019). We determined truncation distances (w) by visually inspecting the distribution of radial detection distances for each study area and truncating where there was a paucity of data. As data of the focal species were sparse, we made conservative truncation decisions to achieve reasonable model fits. We considered eight different candidate models (uniform with 1–3 cosine adjustments, half normal with 0–2 cosine adjustments, and hazard rate with 0–1 simple polynomial adjustments), fitting the selected model to truncated radial distances whilst correcting for temporal availability. We estimated variance by using analytical/empirical design-based variance estimators (Fewster et al., Reference Fewster, Buckland, Burnham, Borchers, Jupp, Laake and Thomas2009; Buckland et al., Reference Buckland, Rexstad, Marques and Oedekoven2015) and 999 non-parametric bootstraps (Buckland et al., Reference Buckland, Anderson, Burnham and Laake1993; Howe et al., Reference Howe, Buckland, Després-Einspenner and Kühl2017). We conducted statistical analyses using the Distance (Miller et al., Reference Miller, Rexstad, Thomas, Marshall and Laake2019) and activity (Rowcliffe, Reference Rowcliffe2022) packages in R.
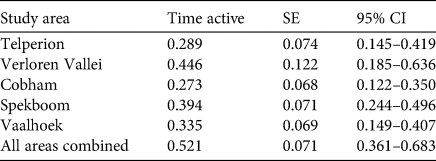
Estimates of African clawless otter Aonyx capensis activity levels at the study areas in southern Africa (Fig. 3). The table shows the proportion of each day during which African clawless otters are active (time active; derived from encounters at each study area), the standard error (SE) and 95% confidence interval (CI).

Metric conversions
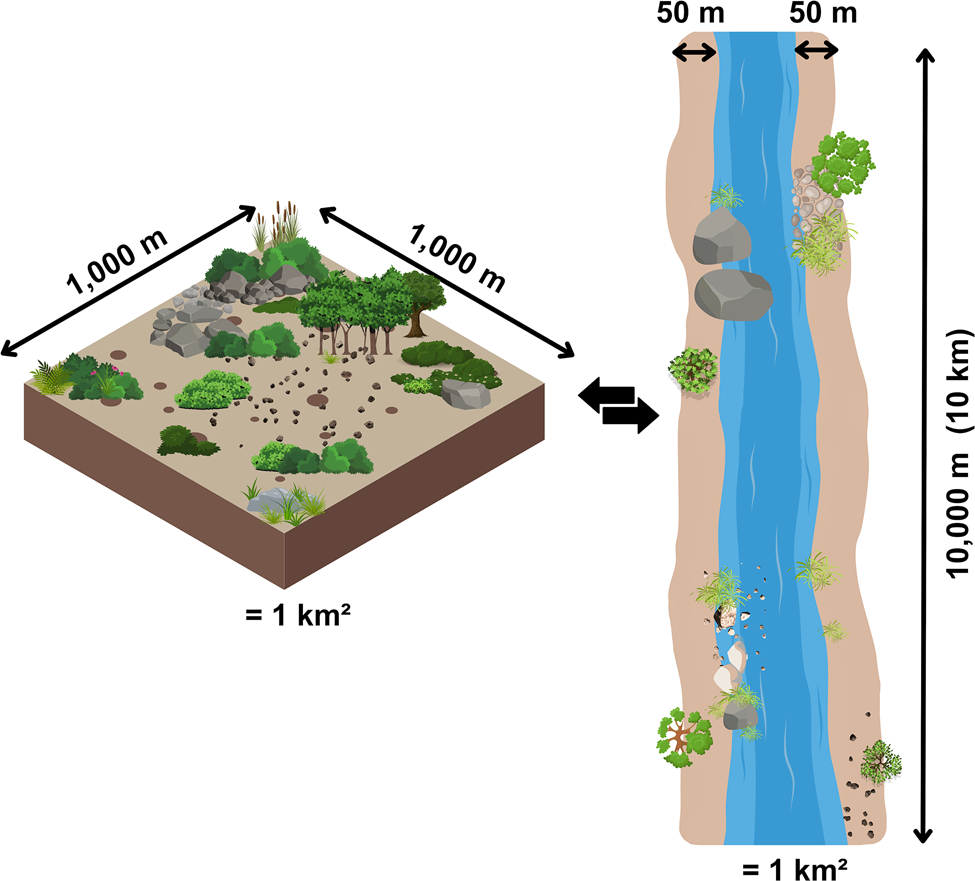
Resulting density estimates obtained from random encounter and camera-trap distance sampling models (otters/km2) cannot easily be compared with previously reported sign-based density estimates (otters/length of river) given the differences in reporting units. We therefore converted our random encounter model and camera-trap distance sampling estimates to numbers of otters/length of river for comparison. African clawless otters are thought to mostly restrict their terrestrial movements to within 50 m of freshwater bodies (Van Niekerk et al., Reference Van Niekerk, Somers and Nel1998). We therefore assumed our estimates applied to an area extending 50 m from the edge of the water on both sides of each river (i.e. zone of 100 m width) and converted our estimates of otters/km2 to otters/km of river by dividing them by 10 to accommodate a width of 100 m (100 m × 10 km = 1 km2; Fig. 2).
Conceptual figure (not to scale) illustrating the conversion of population density estimates in otters/km2 to otters/km length of river.

Animal activity
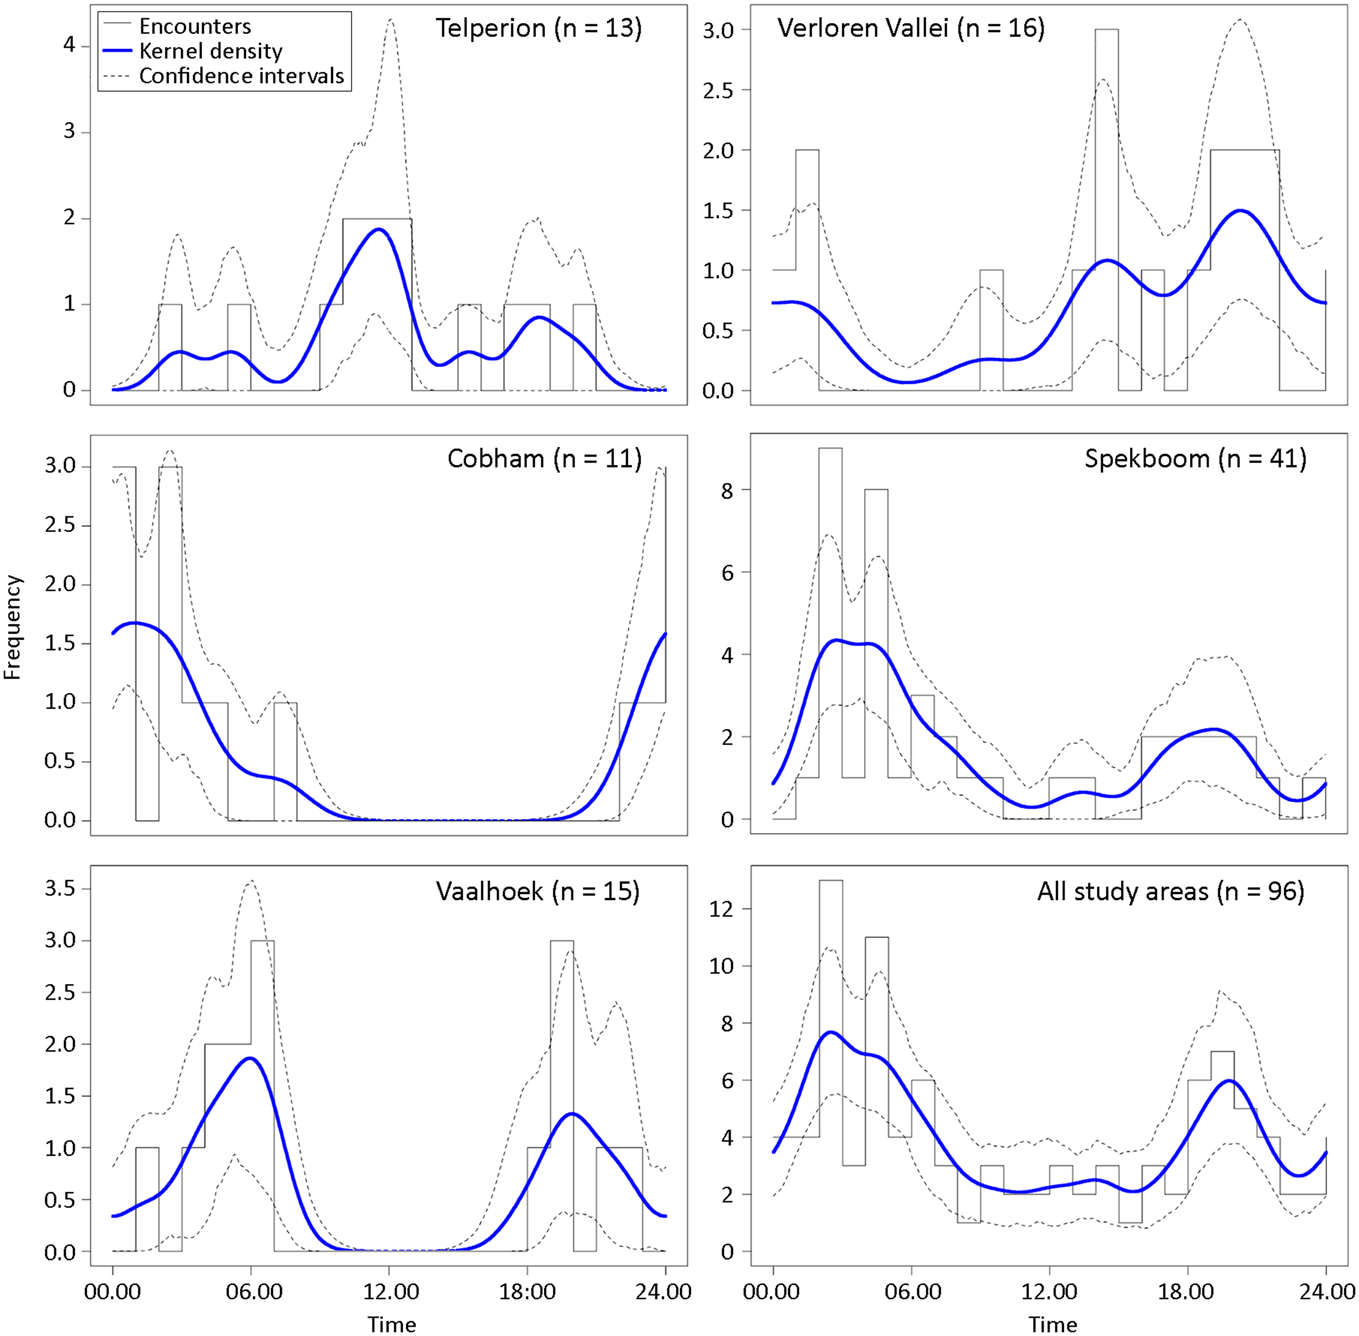
Following Rowcliffe et al. (Reference Rowcliffe, Kays, Kranstauber, Carbone and Jansen2014) we estimated animal activity levels by fitting circular kernel models to independent detections for each study area separately and combined (Fig. 3) using the R package activity. Although independent encounters are important for estimating animal abundance, applying the same time threshold used to define independent records to activity patterns has been criticized for introducing bias, inappropriately discarding data and potentially leading to misclassifications of activity patterns (Peral et al., Reference Peral, Landman and Kerley2022). To establish activity patterns, we therefore recorded all detections ≥ 1 min apart (Peral et al., Reference Peral, Landman and Kerley2022). We restricted all analyses of activity patterns to datasets with ≥ 10 detections of activity (Fisher, Reference Fisher1995). We adopted the same thresholds as Majelantle et al. (Reference Majelantle, Ganswindt, Jordaan, Slip, Harcourt and McIntyre2021) in classifying otter behaviour as nocturnal, mostly nocturnal, diurnal, mostly diurnal or cathemeral. We designated detections that took place within 1 h before and after sunrise and sunset as crepuscular (Gomez et al., Reference Gomez, Wallace, Ayala and Tejada2005). Using the overlap package (Ridout & Linkie, Reference Ridout and Linkie2009; Meredith et al., Reference Meredith, Ridout and Campbell2024) in R we calculated the activity overlap coefficient (Δ) between study areas. As we had < 50 detections at each study area, we adopted Δ1 in our calculations (Meredith et al., Reference Meredith, Ridout and Campbell2024). We then used non-parametric bootstrapping to determine if differences in activity patterns between study areas were significant.
Camera trap-derived daily activity patterns of African clawless otters at each study area in southern Africa separately and combined (Table 3).

Relative abundance indices
The survey in Sandfontein Nature Reserve in Namibia was severely disrupted by camera theft, reducing the total survey effort to 192 trap-days and six independent encounters, which is less than the minimum of 500 trap-days and 10 encounters recommended by Rowcliffe et al. (Reference Rowcliffe, Field, Turvey and Carbone2008). Therefore, we did not obtain sufficient encounters to calculate density estimates for Sandfontein Nature Reserve, nor did we attempt to estimate activity patterns. Instead, we used the data from this site to calculate a relative abundance index by dividing the number of encounters by survey effort and multiplying by 100 to determine the number of encounters per 100 trap-days of survey effort (Wearn & Glover-Kapfer, Reference Wearn and Glover-Kapfer2017). We also calculated relative abundance indices for the other study areas for comparison.
Results
Random encounter model density estimates
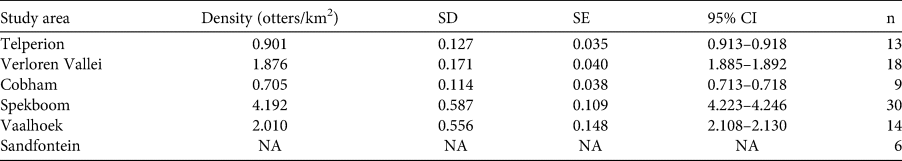
Survey effort used for calculating density estimates from random encounter models varied from 390 trap-days (Vaalhoek Nature Reserve) to 931 trap-days (Telperion Nature Reserve). Spekboom River had the highest density of African clawless otters, which was six-fold higher than the lowest density estimate at Cobham Nature Reserve (Table 4). The survey in Vaalhoek Nature Reserve suffered from significant animal interference, which reduced total survey effort and probably influenced the estimated densities for this area.
Density estimates of African clawless otters in southern Africa calculated using random encounter models. The table shows the mean estimates, standard deviation (SD), standard error (SE), 95% confidence interval (CI) and the number of independent encounters (n).

Distance sampling density estimates
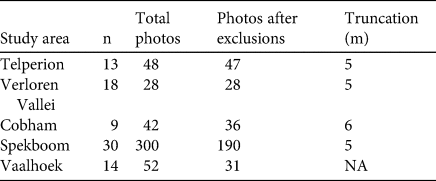
A summary of the number of independent encounters and distance observations is provided in Table 5, together with the truncation decisions for each study area. Otters displayed obvious attraction to cameras at two study areas: Spekboom River and Vaalhoek Nature Reserve. We therefore excluded these distance observations prior to detection fitting. We selected the uniform key function with one cosine adjustment as the best model for Telperion Nature Reserve, Cobham Nature Reserve and Spekboom River, and the half normal function with no cosine adjustments for Verloren Vallei Nature Reserve (Supplementary Material). We could not obtain a sufficient model fit for Vaalhoek Nature Reserve, and it was thus not possible to calculate a camera-trap distance sampling density estimate for this study area. The density estimates using camera-trap distance sampling are detailed in Table 6. The highest density of African clawless otters was estimated for Spekboom River, and the lowest for Cobham Nature Reserve.
Survey-specific information used in the calculation of camera-trap distance sampling estimates of African clawless otter population densities in southern Africa. For each study area, the table shows the number of independent encounters (n), number of distance observations before exclusions and truncations (total photos), number of distance observations after excluding camera reactivity and truncations (photos after exclusions) and the truncation distance beyond which detections were discarded.

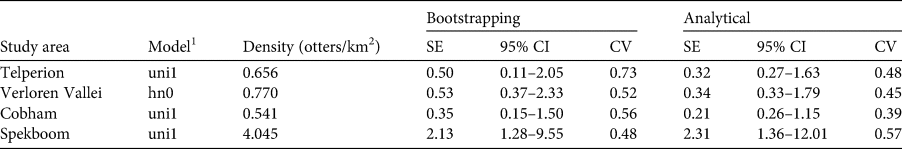
Distance sampling mean density estimates and measures of variances of African clawless otter population densities for each study area in southern Africa. Measures of uncertainty are presented using two approaches: 999 non-parametric bootstraps, resampling with replacement, and the default analytical variance function in the Distance package in R, based on Fewster et al. (Reference Fewster, Buckland, Burnham, Borchers, Jupp, Laake and Thomas2009). For each approach, the table shows the standard error (SE), 95% confidence interval (CI) and coefficient of variation (CV).

1 uni1, uniform function with one cosine adjustment; hn0, half normal function with zero adjustments.
Animal activity
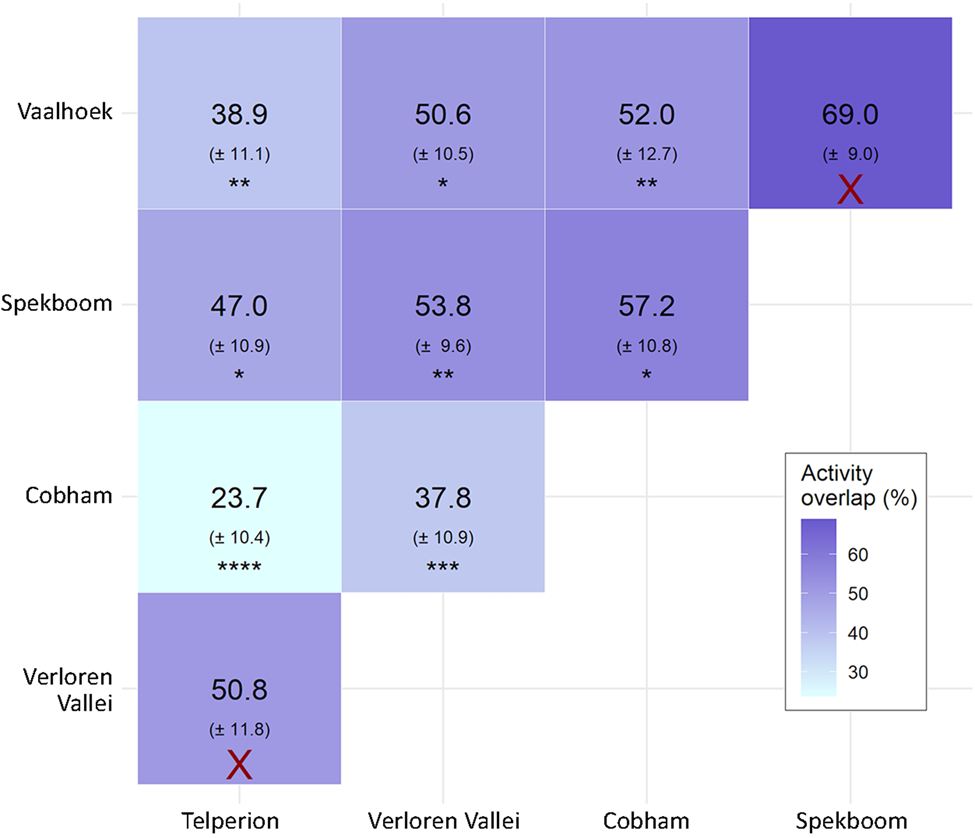
African clawless otter activity varied between study areas in terms of both diel activity patterns (Fig. 3) and total percentage of each day that otters were active and therefore available for detection (Table 3). Verloren Vallei Nature Reserve had the highest (45% of each day) and Cobham Nature Reserve the lowest activity levels (27% of each day). We captured 91% of otter activity at Cobham Nature Reserve at night, suggesting that this population is nocturnal. We recorded 75% of otter activity at Verloren Vallei Nature Reserve at night, and we therefore classified this population as mostly nocturnal. We classified all remaining otter populations as cathemeral, with 66%, 60% and 31% of otter activity recorded at night at Spekboom River, Vaalhoek Nature Reserve and Telperion Nature Reserve, respectively (Supplementary Material). Of all activity detections (≥ 1 min apart) across all study areas, 65% occurred at night. There were significant overlaps in activity patterns between eight of the 10 study area combinations compared (Fig. 4). The greatest difference in activity patterns was between Cobham Nature Reserve and Telperion Nature Reserve (76.3 ± 10.4% difference in activity), and the highest significant overlap was between Cobham Nature Reserve and Spekboom River (57.2 ± SE 10.8% similarity in activity patterns).
African clawless otter activity overlaps between study areas in southern Africa and standard errors in parentheses, expressed as percentage values. X, no evidence for significant differences (P > 0.05); *P ≤ 0.05; **P ≤ 0.01; ***P ≤ 0.001; ****P ≤ 0.0001.

Relative abundance indices
Relative abundance indices ranged from 1.27 encounters per 100 trap-days in Cobham Nature Reserve to 5.19 in Spekboom River, with intermediate values of 1.40 in Telperion Nature Reserve, 1.94 in Verloren Vallei Nature Reserve, 3.12 in Sandfontein Nature Reserve and 3.59 in Vaalhoek Nature Reserve.
Discussion
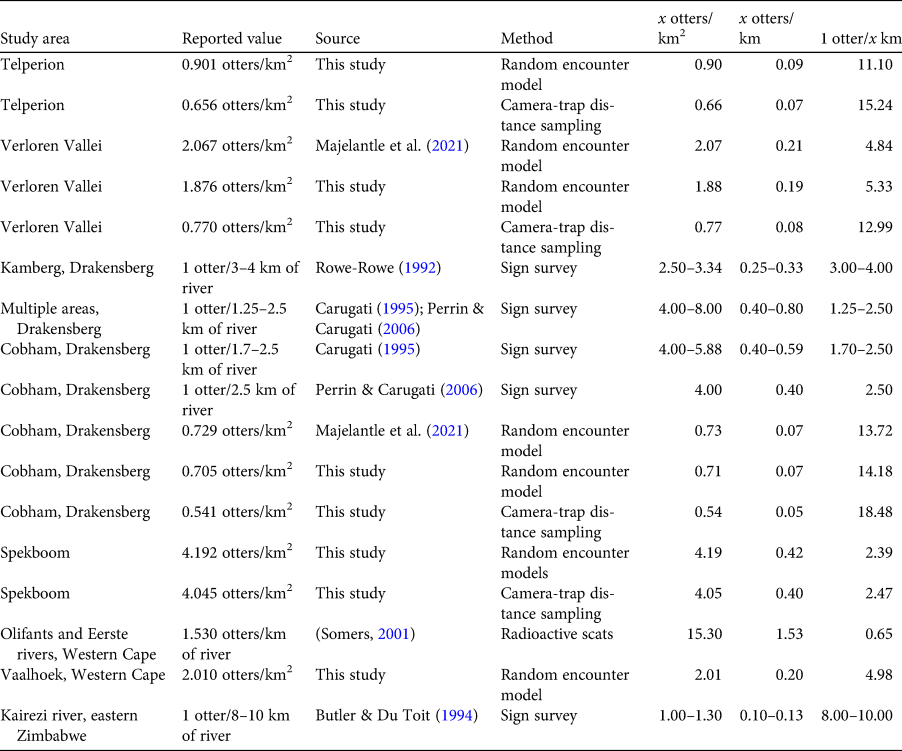
Our results obtained from both the random encounter models and camera-trap distance sampling indicate significant variance in the population densities of African clawless otters between five natural areas in southern Africa. These estimates are summarized in Table 7, together with previous estimates and metric conversions for ease of comparison. Metric conversions (from otters/km2 to otters/km of river) are affected by the distance considered likely to be used by otters on either side of water bodies. Our assumption that otters predominantly make use of areas up to 50 m away from rivers (based on van Niekerk et al., Reference Van Niekerk, Somers and Nel1998) may be an overestimate, and more conservative assumptions would result in lower converted values than what we report here. Nevertheless, our findings suggest that previous sign-based surveys overestimated otter numbers and that smaller populations of African clawless otters are persisting in such areas. For example, previous density estimates from Drakensberg based on sign surveys vary from 1 otter/3–4 km (Rowe-Rowe, Reference Rowe-Rowe1992) to 1 otter/1.25–2.50 km (Perrin & Carugati, Reference Perrin and Carugati2006; Rowe-Rowe, Reference Rowe-Rowe2016), whereas previous Cobham Nature Reserve (southern Drakensberg) density estimates based on sign are 1 otter/1.7–2.5 km (Carugati, Reference Carugati1995; Perrin & Carugati, Reference Perrin and Carugati2006). The metrics reported in Majelantle et al. (Reference Majelantle, Ganswindt, Jordaan, Slip, Harcourt and McIntyre2021) convert to 1 otter/13.7 km of river for Cobham Nature Reserve, and our densities based on random encounter models are consistent with these values and convert to estimates of 1 otter/14.2 km (0.8 ± SD 0.1/km2). The mean camera-trap distance sampling density estimate at Cobham Nature Reserve (0.54/km2) equates to an estimate of 1 otter/18.5 km.
Comparison of our reported density estimates of African clawless otters with previous freshwater estimates in natural areas in southern Africa. We used a 100 m wide zone to convert between otters/km2 and otters/km of river (Fig. 2).

The variability in population density estimates between sites highlights a need for much broader spatial coverage of assessments and cautions against deriving total population estimates from studies conducted in relatively few areas. There are no previous density estimates from Telperion Nature Reserve, Vaalhoek Nature Reserve or Spekboom River, and our estimates serve as baselines for future studies of possible changes in the abundance and distribution of otters.
Camera-trap distance sampling models are prone to underestimating density values (Corlatti et al., Reference Corlatti, Sivieri, Sudolska, Giacomelli and Pedrotti2020; Palencia et al., Reference Palencia, Rowcliffe, Vicente and Acevedo2021). In our study the camera-trap distance sampling results were also lower than those from the random encounter models, with wider confidence intervals around estimated densities for all study areas and lower overall density estimates in all sampled populations. The tendency to obtain lower camera-trap distance sampling density estimates can be partially explained by delays between trigger events of camera traps, resulting in camera traps not always recording complete trajectories of animals moving through the field of view of the camera. In our study we set camera traps to have trigger delays of 3 s, which was the minimum delay possible for one of the camera trap models used (Primos). This does not affect the density estimates obtained using random encounter models in the same way as it does for camera-trap distance sampling, as only the first image within the sequence is used for the encounter rate in random encounter models and animal speed was determined independently using published movement data. However, in camera-trap distance sampling distances are recorded at times that align with predetermined snapshot moments, and gaps in the sequence of fixed images, caused by trigger delay or camera malfunction, can therefore lead to underestimates of the total number of animal observations. For this reason, Howe et al. (Reference Howe, Buckland, Després-Einspenner and Kühl2017) recommend that cameras should have the potential to be triggered again immediately or after minimal delay. Furthermore, Buckland et al. (Reference Buckland, Rexstad, Marques and Oedekoven2015) recommend a minimum of 10–20 replicate points (i.e. independent encounters) and at least 75–100 distance observations for point transect sampling, with a lesser threshold of 60–80 observations for line transects. Four of the five study areas violated the recommended number of distance observations (minimum = 28; maximum = 300), which further explains the wide confidence intervals around the camera-trap distance sampling estimates reported here.
Insufficient observations were considered less likely to have influenced our estimates based on random encounter models. Rowcliffe et al. (Reference Rowcliffe, Field, Turvey and Carbone2008) suggest that a minimum of 500 trap-days should be obtained for each random encounter survey. All of our surveys exceeded this recommendation, except for that at Vaalhoek Nature Reserve. Here, interference by other animals such as cattle Bos taurus and chacma baboon Papio ursinus resulted in substantial disturbance to camera traps and only 390 effective trap-days. As such, our estimated population densities for this site are probably underestimates. Our results may also have been influenced by violations of model assumptions. For example, we placed camera traps at areas reasonably accessible to otters and thus potentially violated the assumption of random camera placements relative to animals (Cusack et al., Reference Cusack, Swanson, Coulson, Packer, Carbone and Dickman2015; Howe et al., Reference Howe, Buckland, Després-Einspenner and Kühl2017). However, we placed camera traps independently of otter signs, thereby following the random ideal as closely as possible, and any bias is therefore likely to be minimal. Furthermore, we cannot be certain that the populations surveyed were closed without obtaining home range data at each study area (Rowcliffe et al., Reference Rowcliffe, Field, Turvey and Carbone2008). Although comparatively little is known of sociality in African clawless otters, their typical solitary or paired occurrence and occasional associations in small family groups (Somers & Nel, Reference Somers and Nel2013) suggest that immigration or emigration of individuals would have been unlikely during the survey periods reported here. In addition, it is possible that the 200–300 m distance intervals between cameras violated the assumption of independent observations. However, we are of the opinion that the ≥ 30 min time interval derived from recent telemetry data collected in freshwater habitats (Majelantle et al., Reference Majelantle, Ganswindt, Jordaan, Slip, Harcourt and McIntyre2021) adequately mitigates potential bias. Nevertheless, we advocate for further research using telemetry in the future, particularly with a view towards establishing home ranges in different study areas, which could be used to guide survey design. Lastly, detection probabilities of camera traps are not perfect and probably result in further underestimation of true population densities (McIntyre et al., Reference McIntyre, Majelantle, Slip and Harcourt2020). Although such potential model violations were considered unlikely to have substantially influenced our density estimates, future assessments will benefit from combining additional approaches to density estimation. For example, pairing camera trap-based assessments with mark–recapture model outputs based on genetic analyses of faecal and hair samples (Hájková et al., Reference Hájková, Zemanová, Roche and Hájek2009; Mowry et al., Reference Mowry, Gompper, Beringer and Eggert2011) or using radio tracking (e.g. McIntyre & Roux, Reference McIntyre and Roux2024) could potentially be used to validate estimates.
Activity levels (Table 3) were examined as part of the camera-trap distance sampling density calculation. These results and the variance in diel patterns (Fig. 3) between study areas raise questions regarding the drivers of the observed activity patterns. African clawless otters are considered crepuscular (mostly active at dawn and dusk) in freshwater areas (Somers & Nel, Reference Somers and Nel2004b) and more nocturnal in coastal regions (Arden-Clarke, Reference Arden-Clarke1986). In contrast, our results indicate that African clawless otters are either cathemeral (Spekboom River, Vaalhoek Nature Reserve and Telperion Nature Reserve), mostly nocturnal (Verloren Vallei Nature Reserve) or nocturnal (Cobham Nature Reserve). Crepuscular activity was only recorded in three of the study areas: Spekboom River (24%), Vaalhoek Nature Reserve (40%) and Telperion Nature Reserve (8%). Verloren Vallei Nature Reserve had the highest overall activity levels (47% of each day), and Cobham Nature Reserve the lowest (27% of each day). The variance in activity levels and patterns suggests that African clawless otters exhibit substantial behavioural plasticity, adapting their activity levels and patterns to their local environment. Probable influences include prey availability, anti-predator behaviour and the potential impacts of human activities (Majelantle et al., Reference Majelantle, Ganswindt, Jordaan, Slip, Harcourt and McIntyre2021). Dietary studies have furthermore illustrated such plasticity and suggest African clawless otters are able to exploit spatio-temporal variation in the availability of prey types (Jordaan et al., Reference Jordaan, Somers, Hall and McIntyre2019).
The low number of activity detections (n = 11–41) may have influenced the reliability of our kernel estimates (Rowcliffe et al., Reference Rowcliffe, Kays, Kranstauber, Carbone and Jansen2014; Wearn & Glover-Kapfer, Reference Wearn and Glover-Kapfer2017). Ridout & Linkie (Reference Ridout and Linkie2009) suggest that 25 detections could be sufficient to gain meaningful insights into activity patterns, whereas Rowcliffe et al. (Reference Rowcliffe, Kays, Kranstauber, Carbone and Jansen2014) recommend c. 100 detections to obtain reasonable precision. Other studies have used as few as four (Fancourt et al., Reference Fancourt, Hawkins, Cameron, Jones and Nicol2015), 10 (Majelantle et al., Reference Majelantle, Ganswindt, Jordaan, Slip, Harcourt and McIntyre2021), 14 (Delibes-Mateos et al., Reference Delibes-Mateos, Díaz-Ruiz, Caro and Ferreras2014), 15 (Wearn et al., Reference Wearn, Bell, Bolitho, Durrant, Haysom and Nijhawan2022) or 18 (Gerber et al., Reference Gerber, Karpanty and Randrianantenaina2012) detections to estimate activity patterns. Although a larger number of detections is desirable, it is often difficult to achieve such detection numbers for elusive species. However, to avoid discarding important behavioural data, we recommend adopting the approach of Peral et al. (Reference Peral, Landman and Kerley2022) and retaining all detections of study animals separated by more than 1 min intervals.
It was not possible to estimate density at Sandfontein Nature Reserve because of camera theft, which significantly reduced the total survey effort. Instead, we report a relative abundance of 3.1 encounters per 100 trap-days for this area. This constitutes the first estimate of African clawless otter population abundance within the Desert/Nama Karoo biomes and only the second within Namibia; the first being by Abiatar et al. (Reference Abiatar, Eiseb, Uiseb and Mcintyre2024) who recently reported a relative abundance index for African clawless otters in northern Namibia of only 0.3 based on an extensive camera trapping survey of 967 camera days. Relative abundance indices from the remaining study areas follow the general trends reflected in our density estimates.
The variance in density estimates and activity patterns reported here is probably influenced by variability in natural environments, including prey type, availability and abundance (Nel & Somers, Reference Nel and Somers2007; Jordaan et al., Reference Jordaan, McIntyre, Somers and Bester2015, Reference Jordaan, Somers, Hall and McIntyre2019), presence of adequate cover for dens and holts (Perrin & Carugati, Reference Perrin and Carugati2000; Somers & Nel, Reference Somers and Nel2004a), inter-specific competition (Somers & Purves, Reference Somers and Purves1996) and possible risk of predation (Kruuk & Goudswaard, Reference Kruuk and Goudswaard1990; Somers, Reference Somers2000). This natural variation, independent of anthropogenic influence, has implications for estimates of total African clawless otter population sizes that have previously assumed constant population densities across freshwater systems (Somers & Nel, Reference Somers and Nel2013) and suggests a need for obtaining population density estimates across habitats to inform habitat distribution models for the species. Furthermore, climate change is likely to result in range contractions of African clawless otters across their distribution and loss of protection as suitable ranges within protected areas contract (Cianfrani et al., Reference Cianfrani, Broennimann, Loy and Guisan2018). Understanding how population densities are associated with habitats and environmental conditions is therefore likely to become increasingly important to inform conservation planning. Future research on population estimates and conservation assessments of this Near Threatened (Jacques et al., Reference Jacques, Reed-Smith and Somers2021) species should consider broader spatial coverage and investigate environmental drivers of population density and activity patterns. In addition, future research should prioritize the use of radio tracking and non-invasive genetic sampling to provide greater insights into the activity patterns, home ranges and spatial distributions and densities of African clawless otters, which could greatly advance the field, particularly if paired with additional methods such as camera trapping.
Author contributions
Conceptualization and study design: CBL, TM; fieldwork and logistical support: all authors; data analysis: CBL; writing and revision: all authors.
Acknowledgements
We thank the anonymous reviewers and Martin Fisher for their insightful comments; Arantxa Blecher, Tenzin Philips, Jancke Loggenberg, Marie de Vos, Ayesha Bobat, Aaliyah Motala, Yasoda Veerasamy, Francois Winterbach, Tracy Basch, Tristan Russell, Juan Scheun, Jamey Gulson and Stephanie Nicolaides for assistance with deployment and retrieval of camera traps; and Dirk Winterbach (Rietvaley Game Ranch), Erika Kotze, Dirk Kotze, Sean Gilbertson (Sandfontein Lodge) and Duncan MacFadyen from Oppenheimer Generations Research and Conservation for their welcome and for granting permission to access their properties. Financial support was provided by the South African Department of Science and Innovation through the National Research Foundation (Grant number 116332) and the IUCN Species Survival Commission Otter Specialist Group.
Conflicts of interest
None.
Ethical standards
This research abided by the Oryx guidelines on ethical standards. Any images of people captured without their consent were immediately treated as sensitive and either removed or provided to the police where camera theft occurred. To ensure that our research was conducted in a socially responsible manner that did not violate privacy or cause unnecessary harm, we collaborated with reserve owners and informed employees and guests about camera-trapping operations, engaged with guests regarding our work, deleted innocuous images taken of people where consent had not been obtained and carefully vetted images before sharing them with law enforcement. Notably, all images provided to the police were knowingly taken by the suspects themselves, minimizing privacy concerns or harm. Data were collected under ethical clearance received from the University of Pretoria Animal Use and Care Committee (Project number EC012-18), the University of KwaZulu-Natal Animal Research Ethics Committee (Project number AREC/033/018) and the University of South Africa, College of Agriculture and Environmental Sciences Animal Research Ethics Committee (2019/CAES_AREC/110). Research permits were provided by Cape Nature, Ezemvelo KwaZulu-Natal Wildlife and Mpumalanga Tourism and Parks Agency to conduct research in protected areas. The Namibian National Commission on Research, Science and Technology (NCRST) provided authorization for the field research along the Orange River, Namibia (Authorization No. AN20200701).
Data availability
Data and code are available from the corresponding author upon reasonable request.


 Open access