

Public health efforts to combat vitamin A (VA) deficiency have been in place for decades( 1 , Reference Palmer and West 2 ). Initially geared towards the prevention of childhood blindness, programmes to improve the VA status of children of pre-school age through supplementation, food fortification or other dietary strategies were limited to areas of endemic xerophthalmia. However, based on findings of several large community trials, by the early 1990s, a scientific consensus had been reached that supplementation or fortification with VA could reduce under-5s mortality by approximately 25–35% in undernourished populations( Reference Beaton, Martorell and Aronson 3 – Reference Tonascia 5 ). Subsequent global advocacy and investment led to the wide-scale acceptance of preventive VA supplementation to improve child survival( 6 ). Semi-annual supplementation of children 6–59 months of age with 210 μmol (200 000 IU) of VA (half for infants 6–11 months of age) and, to a lesser extent, food fortification are presently carried out in more than eighty-five countries. In areas where VA supplementation programmes have achieved high coverage for several years, questions are being raised about how best to assess impact and for how long universal VA supplementation should continue.
Periodic, high-potency VA supplementation is based on the kinetics of VA metabolism in the body. The vast majority of the body's supply of VA is stored as retinyl esters in the liver( Reference Olson 7 ). Peripheral tissue requirements are met by hepatic release of VA in a 1:1 ratio with its carrier, retinol-binding protein, complexed with transthyretin. Serum concentrations of retinol remain stable (i.e. homeostatically controlled) across a wide range of adequate VA intake( Reference Underwood 8 ); however, nutrient-poor diets and recurrent infections common among young children may lead to depletion of VA stores in the liver and peripheral tissues. As the concentration of VA per gram of liver falls below approximately 0·70 μmol, there appears to be a parallel decline in serum retinol (SROL) concentration( Reference Olson 7 ). A low SROL concentration can therefore serve as a marker of inadequate status, with concentrations of 0·70 μmol/l and 0·35 μmol/l being accepted cut-offs for moderate and severe deficiency, respectively( Reference de Pee and Dary 9 , Reference Sommer and Davidson 10 ). At the population level, measurement of SROL concentrations is currently recommended by the WHO and UNICEF for assessing the population's VA status( 11 , 12 ).
Reliance on SROL as an indicator of VA status, however, does have limitations. Most notably, it necessitates blood collection in the field, cold-chain and light-protected transport of samples, and a laboratory with the technical capacity to conduct HPLC quantification of SROL concentration. While SROL distributions are widely interpretable with respect to population VA status, concentrations may be negatively influenced by the body's acute-phase response to infection( Reference Stephensen and Gildengorin 13 , Reference Thurnham, Mburu and Mwaniki 14 ) or a protein–energy malnourished state( Reference Smith, Suskind and Thanangkul 15 ), which may lead to misclassification of individuals with adequate VA stores. Suggested methods for addressing this issue include limiting analyses to children who are apparently healthy at the time of blood collection, or statistically adjusting SROL concentrations using concurrent serum estimates of acute-phase proteins( Reference Thurnham, McCabe and Northrop-Clewes 16 ). However, modelled estimates of SROL concentrations or exclusion of children with an acute infection can obscure or distort actual distributions of status. Regardless of its shortcomings, SROL is presently the longest running, most informative indicator of VA deficiency at the population level.
The purpose of the present review is to provide guidance on the use and interpretation of SROL distributions as an indicator of population VA status, level of deficiency, trend, programme impact and readiness to maintain, change or phase out deficiency control interventions.
Methods
We searched the peer-reviewed and grey literature for studies that had measured SROL concentrations in populations of young children. These included national or regional nutrition surveys, validity studies, efficacy and effectiveness trials and pre-/post-evaluations of VA supplementation and/or food fortification programmes. Experimental or observational studies with SROL measures from at least two time points were considered eligible. We also included cross-sectional studies if: (i) SROL measures were available from at least two repeated cross-sectional surveys in the same population; and (ii) the authors reported the timing of the survey relative to supplementation. Where possible, we estimated the ‘protective period’ of VA interventions, i.e. for how long high-dose supplements or VA-fortified foods maintained SROL concentrations above the WHO cut-off of 0·70 μmol/l( Reference West and Sommer 17 ).
In order to illustrate the dynamics of SROL distributions, we extracted sample sizes, means and standard deviations for SROL concentrations reported by each of the identified studies using the STATA statistical software package version 10·1 (StataCorp, College Station, TX, USA). We then simulated normal random samples with equivalent sample sizes, means and standard deviations to those reported in the literature. In some instances, simulations yielded up to fifteen negative values, suggesting that the underlying distributions had actually been skewed to the right, i.e. that more children had low SROL concentrations. Where our simulations had yielded negative SROL concentrations, these values were recoded to missing. To graphically depict SROL density distributions (in Figs 1 to 6 and 8), we employed non-parametric kernel density estimation methods with a Gaussian kernel function( Reference Wand and Jones 18 ).
Results
We identified five controlled trials that measured the effect of high-dose VA supplementation on SROL concentrations in children 6–59 months of age (Table 1). The first two studies, conducted 40 years ago by Pereira and Begum, were quasi-experimental; children were allocated by baseline SROL stratum to achieve comparability of VA status across treatment groups( Reference Pereira and Begum 19 , Reference Pereira and Begum 20 ). In the first study, a 349 μmol (333 333 IU) dose raised SROL concentrations for approximately 10 weeks relative to a placebo, reaching a maximal difference of 0·30 μmol/l, although this effect was only statistically significant for the first 4 weeks. Supplemented children were protected from a low SROL concentration for roughly 14 weeks. In a subsequent study, the authors controlled for dietary VA intake by maintaining children on diets providing either 10 μg retinol activity equivalents (RAE)/d or 75 μg RAE/d. For those on the 10 μg RAE/d diet, a 175 μmol supplement significantly increased SROL concentrations relative to a placebo( Reference Pereira and Begum 20 ). This dose maintained concentrations above 0·70 μmol/l for only 8 weeks, and levels began to converge with the placebo distribution by 10 weeks post-dosing. There was no benefit of supplementation over the placebo among children consuming a diet of 75 μg RAE/d. Controlled supplementation studies of deficient children in Thailand and Indonesia also found no significant effect of high-dose VA supplementation (105–314 μmol) on SROL( 21 , 22 ). However, first follow-up visits in both studies were scheduled at 10–12 weeks, by which time the earlier work by Pereira and Begum had demonstrated a convergence with the SROL distribution in the placebo group. The last controlled trial conducted to date, published by Humphrey et al. in 1994, demonstrated significantly higher SROL concentrations (+0·10 μmol/l) in the experimental group (210 μmol dose) v. the control (105 μmol dose) at 12 weeks post-dosing( Reference Humphrey and Natadisastra 23 ). In this case, the mean SROL concentration among experimental children had already declined to <0·70 μmol/l by 12 weeks, suggesting that any protection of supplementation against hyporetinolaemia had largely subsided.
Controlled trials of high-potency vitamin A supplementation among children of pre-school age
| Serum retinol (μmol/l) | ||||||||||||
| First author & | Dosages (μmol)* | Sample size | E | C | ||||||||
| reference | Country & year | Study design | Age | E | C | Contact† | E | C | Mean | sd | Mean | sd |
| Pereira( Reference Pereira and Begum 19 ) | India 1969 | Controlled, quasi-experimental; weekly | 2–5 years | 349 | 0 | Initial | 14 | 16 | 0·92 | 0·28 | 0·88 | 0·24 |
| follow-up to 6 months | 4 week | 14 | 16 | 0·90 | 0·18 | 0·77 | 0·19 | |||||
| 10 week | 14 | 16 | 0·86 | 0·33 | 0·75 | 0·17 | ||||||
| 25 week | 14 | 16 | 0·50 | 0·20 | 0·41 | 0·12 | ||||||
| Pereira( Reference Pereira and Begum 20 ) | India 1971 | Controlled, quasi-experimental, factorial; | 2–6 years | 175 | 0 | Diet provided 75 μg RAE/d | ||||||
| bi-weekly follow-up to 4·5 months | Initial | 12 | 12 | 0·44 | 0·13 | 0·44 | 0·11 | |||||
| 4 week | 12 | 12 | 0·79 | 0·21 | 0·47 | 0·10 | ||||||
| 8 week | 12 | 12 | 0·72 | 0·20 | 0·54 | 0·14 | ||||||
| 18 week | 12 | 12 | 0·42 | 0·11 | 0·37 | 0·08 | ||||||
| Diet provided 900 μg RAE/d | ||||||||||||
| Initial | 11 | 11 | 0·43 | 0·09 | 0·46 | 0·11 | ||||||
| 4 week | 11 | 11 | 0·75 | 0·15 | 0·81 | 0·26 | ||||||
| 8 week | 11 | 11 | 0·72 | 0·23 | 0·73 | 0·20 | ||||||
| 18 week | 11 | 11 | 0·85 | 0·26 | 0·69 | 0·20 | ||||||
| Dhanamitta( 21 ) | Thailand 1980 | Controlled experiment; follow-up to | Pre-school | 105 or 210‡ | 0 | Initial | 78 | 78 | 0·49 | 0·53 | ||
| 5·5 months | 10 week | 54 | 54 | 0·77 | 0·63 | |||||||
| 22 week | 39 | 39 | 0·67 | 0·60 | ||||||||
| Kusin( 22 ) | Indonesia 1980 | Controlled, experimental; follow-up | 1–5 years | 314 | 0 | Initial | 134 | 134 | 0·56 | 0·21 | 0·56 | 0·21 |
| to 6 months | 12 week | 99 | 85 | 0·63 | 0·28 | 0·63 | 0·21 | |||||
| 24 week | 134 | 134 | 0·56 | 0·21 | 0·60 | 0·28 | ||||||
| Humphrey( Reference Humphrey and Natadisastra 23 ) | Indonesia 1994 | Controlled, experimental | 1–5 years | 210 | 105 | Initial | 170 | 174 | 0·54 | 0·26 | 0·55 | 0·31 |
| 12 week | 126 | 123 | 0·63 | 0·26 | 0·53 | 0·20 | ||||||
| 24 week | 134 | 137 | 0·89 | 0·35 | 0·81 | 0·32 | ||||||
E, experimental group; C, control or placebo group; RAE, retinol activity equivalents.
*All supplements were in the form of retinyl palmitate.
†Provided in terms of weeks post-dosing.
‡105 μmol for <24 months and 210 μmol for ≥24 months of age.
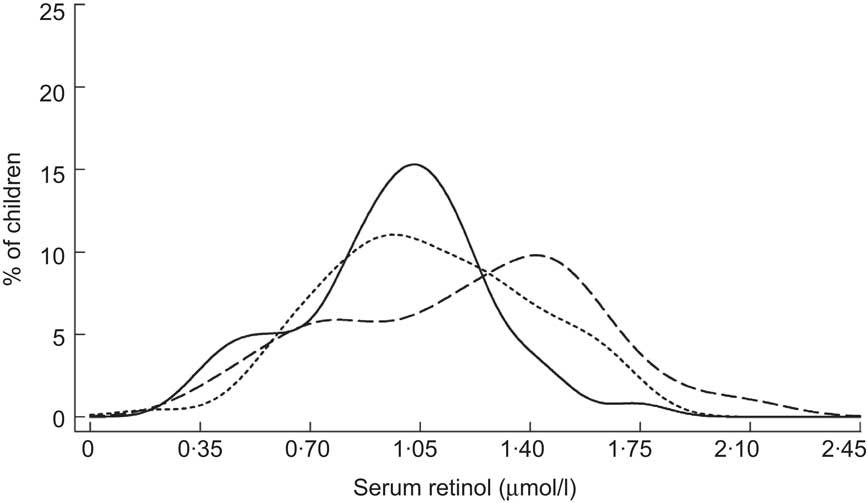
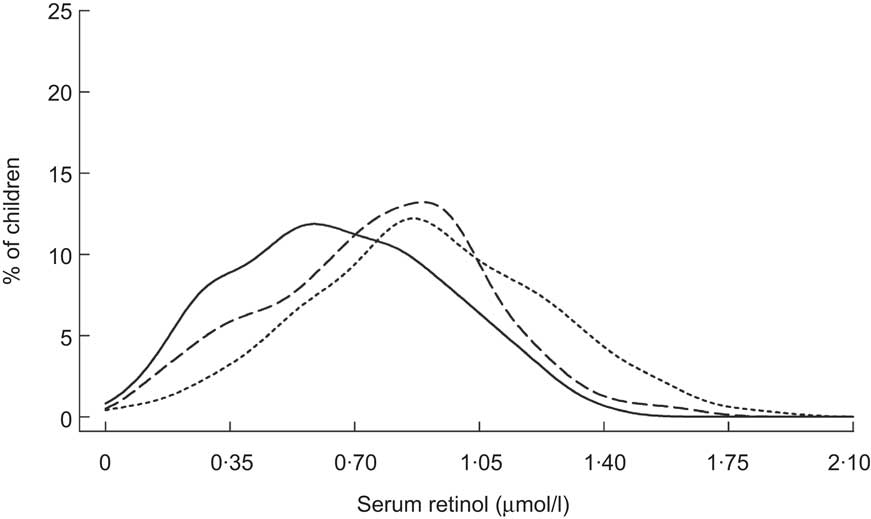
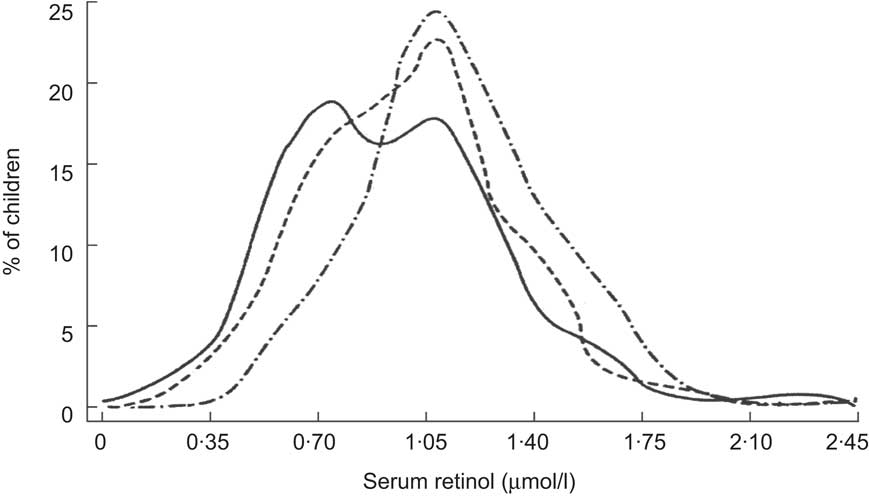
Table 2 describes nine prospective cohorts and three cross-sectional surveys of children who received high-potency VA supplementation in accordance with the semi-annual WHO recommendation( 24 ), with follow-up ranging from 2 weeks to 12 months post-dosing. Data from Brazil, reported by Flores and colleagues, indicated a substantial rightward shift in the SROL distribution among children with low apparent liver stores at baseline, assessed by the relative dose response (RDR) test( Reference Flores, Azevedo and Campos 25 ): the median (range) SROL concentration increased from 0·86 (0·26–1·91) μmol/l to 1·48 (0·82–2·81) μmol/l at 5 weeks post-supplementation. However, the effect of VA supplementation on SROL was negligible among children with adequate baseline liver stores (Fig. 1). A separate pre-/post-evaluation of VA supplementation by Araujo et al., targeted to under-privileged Brazilian children, was consistent with the above dynamic, reporting a decrease in the proportion of deficient children at 1 month following supplementation( Reference Araujo, Araujo and Machado 26 ). In Indonesia, Humphrey and colleagues also showed a more pronounced effect of high-dose VA supplementation among children with deficient baseline status, indicated by clinical signs of xerophthalmia( Reference Humphrey and West 27 ) (Fig. 2). SROL reverted to baseline levels more rapidly in the xerophthalmic group as well, presumably due to their continued exposure to an inadequate diet and possible increased occurrence of infections. In both groups, the proportion of children with low serum levels had begun to increase by the 4-month follow-up contact (not shown). The immediate impact of high-dose VA supplementation among Indonesian children was less obvious in a study by Tanumihardjo and colleagues, designed to test the combined effect of VA supplementation and deworming( Reference Tanumihardjo and Permaesih 28 ). The authors reported no significant changes in mean SROL concentrations with any of three treatment combinations (deworming + VA supplementation; deworming 1 week prior to VA supplementation; VA supplementation alone), although the proportions of children with low SROL at 1 month following dosing was reduced by approximately 15 % in all three groups( Reference Tanumihardjo and Permaesih 28 ).
Prospective cohort studies and repeated cross-sectional surveys of high-potency vitamin A supplementationFootnote * among children of pre-school age
| First author & | Serum retinol (μmol/l) | |||||||
| reference | Country & year | Study design | Age | Contact† | Sample size | Mean | sd‡ | %<0·70 |
| Flores( Reference Flores, Azevedo and Campos 25 ) | Brazil 1985 | Prospective cohort | 2–6 years | Positive relative dose response | ||||
| Initial | 98 | 0·82 | 0·24 | – | ||||
| ∼5 week | 98 | 1·54 | 0·34 | – | ||||
| Negative relative dose response | ||||||||
| Initial | 145 | 1·55 | 0·39 | – | ||||
| ∼5 week | 145 | 1·68 | 0·32 | – | ||||
| Araujo( Reference Araujo, Araujo and Machado 26 ) | Brazil 1987 | Prospective cohort, within context of pre/post | Pre-school | Initial | 92 | – | – | 16·3 |
| evaluation | 1 month¶ | 92 | – | – | 4·3 | |||
| Humphrey( Reference Humphrey and West 27 ) | Indonesia 1993 | Prospective cohort, within context of randomized trial | 3–5 years | Xerophthalmic | ||||
| Initial | 27 | 0·57 | 0·20 | 77·8 | ||||
| 2 month | 26 | 1·45 | 0·28 | 0·0 | ||||
| 4 month | 26 | 1·04 | 0·34 | 19·2 | ||||
| 6 month | 26 | 0·98 | 0·28 | 7·7 | ||||
| 12 month | 25 | 0·74 | 0·20 | 44·0 | ||||
| Non-xerophthalmic | ||||||||
| Initial | 26 | 0·78 | 0·19 | 26·9 | ||||
| 2 month | 25 | 1·51 | 0·58 | 8·0 | ||||
| 4 month | 25 | 1·10 | 0·36 | 12·0 | ||||
| 6 month | 25 | 1·03 | 0·30 | 8·0 | ||||
| 12 month | 21 | 0·83 | 0·20 | 23·8 | ||||
| Tanumihardjo( Reference Tanumihardjo and Permaesih 28 ) | Indonesia 1993 | Prospective cohort of children positive for Ascaris lumbricoides | 0·6–6·6 years∥ | Deworming + supplementation | ||||
| Initial | 52 | 0·80 | 0·26 | 38·0 | ||||
| 4 week | 52 | 0·82 | 0·23 | 29·0 | ||||
| Deworming 1 week prior to supplementation | ||||||||
| Initial | 54 | 0·70 | 0·26 | 59·0 | ||||
| 3 week | 54 | 0·72 | 0·19 | 48·0 | ||||
| Supplementation alone | ||||||||
| Initial | 49 | 0·74 | 0·21 | 49·0 | ||||
| 4 week | 49 | 0·72 | 0·19 | 47·0 | ||||
| Tanumihardjo( Reference Tanumihardjo and Permaesih 29 ) | Indonesia 1993 | Prospective cohort of children positive for | 0·6–6·6 years∥ | 1 month | 51 | 0·81 | 0·26 | 37·0 |
| Ascaris lumbricoides and/or Trichuris trichiura | 2 month | 51 | 0·77 | 0·20 | – | |||
| Robles-Sardin( Reference Robles-Sardin, Astiazaran-Garcia and Davalos-Navarro 31 ) | Mexico 1994 | Prospective cohort; follow-up to 3 months | 6–36 months | Initial | 60 | 0·70 | 0·18–1·90** | 48·2 |
| 2 week | 56 | 0·97 | 0·49–2·35 | 7·1 | ||||
| 3 month | 34 | 0·83 | 0·66–1·15 | 5·9 | ||||
| Perlas( Reference Perlas, Florentino and Fuertes 32 ) | Philippines 1995 | Prospective cohort; follow-up to 6 months | 1–5 years | Initial | 105 | 0·95 | 0·32 | 17·1 |
| 1 month | 105 | 1·23 | 0·42 | 5·1 | ||||
| 2 month | 88 | 1·12 | 0·39 | 10·1 | ||||
| 4 month | 81 | 1·09 | 0·35 | 13·7 | ||||
| 6 month | 67 | 1·12 | 0·32 | 6·0 | ||||
| Pedro( Reference Pedro, Madriaga and Barba 35 ) | Philippines 1998 | Cross-sectional survey; data aggregated by | 6–59 months | No capsule | 1837 | 0·77 | – | 41·6 |
| time since dosing§ | 1–2 month | 3916 | 0·84 | – | 32·7 | |||
| 3–4 month | 3695 | 0·81 | – | 35·9 | ||||
| 5–6 month | 2010 | 0·74 | – | 41·0 | ||||
| Pangaribuan( Reference Pangaribuan, Erhardt and Scherbaum 33 ) | Indonesia 2000 | Prospective cohort; follow-up to 2 months | 1–5 years | Received vitamin A capsule | ||||
| Initial | 117 | 0·85 | – | 18·8 | ||||
| 2 months | 117 | 0·89 | – | 14·5 | ||||
| Did not receive vitamin A capsule | ||||||||
| Initial | 72 | 0·81 | – | 31·9 | ||||
| 2 months | 72 | 0·78 | – | 37·5 | ||||
| Gorstein( Reference Gorstein, Bhaskaram and Khanum 34 ) | India 2000 | Prospective cohort; follow-up to 4 months | 1–4 years | Initial | 314 | 0·62 | 0·32 | 63·8 |
| 4 week | 314 | 0·73 | 0·23 | 46·1 | ||||
| 16 week | 311 | 0·50 | 0·19 | 86·4 | ||||
| National Food & Nutrition | Zambia 2003 | Repeated, cross-sectional surveys | 6–59 months | ∼5 week | 317 | 0·72 | 0·26 | 53·4 |
| Commission( 30 ) | ∼18 week | 342 | 0·71 | 0·25 | 54·7 | |||
* All supplements were in the form of retinyl palmitate and dosing was based on WHO/UNICEF recommendations unless otherwise specified.
† Follow-up timing is provided in terms of weeks or months post-dosing.
‡ Unless otherwise indicated.
§ Survey data were collected over an 8-month period from May–December 1998, with vitamin A supplementation campaigns conducted in April and November.
∥ All subjects received 210 μmol dose.
¶ Initial measure was prior to programme implementation; follow-up measure was 30 d following most recent supplement receipt.
** Range.
Distribution of serum retinol concentrations at initial contact (——) and 5 weeks (– – –) following supplementation with 210 μmol (200 000 IU) retinyl palmitate among Brazilian children (aged 2–6 years) with low liver vitamin A stores (a) or adequate liver vitamin A stores (b) by relative dose response( Reference Flores, Azevedo and Campos 25 )
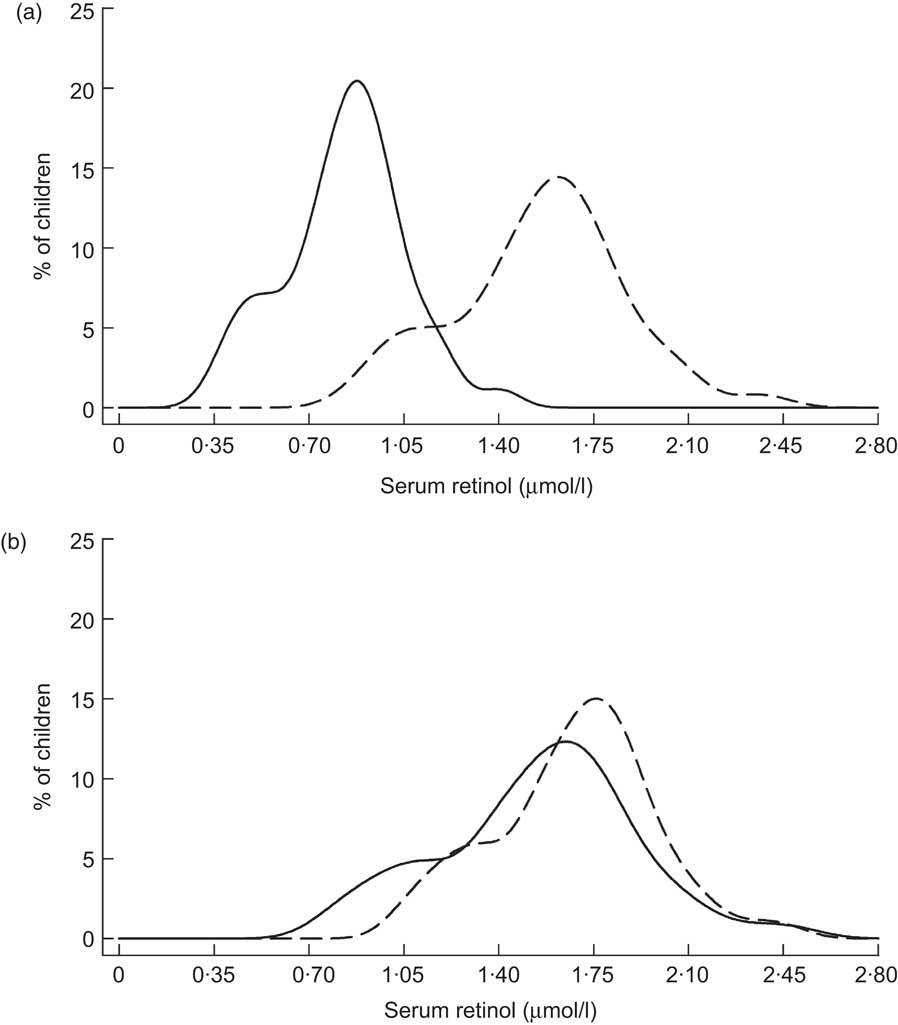
Distribution of serum retinol concentrations at initial contact (——), 2 months (– – –) and 6 months (- - -) following supplementation with 210 μmol (200 000 IU) retinyl palmitate among Indonesian children (aged 3–5 years) exhibiting clinical signs of xerophthalmia (a) or not exhibiting eye signs (b)( Reference Humphrey and West 27 )
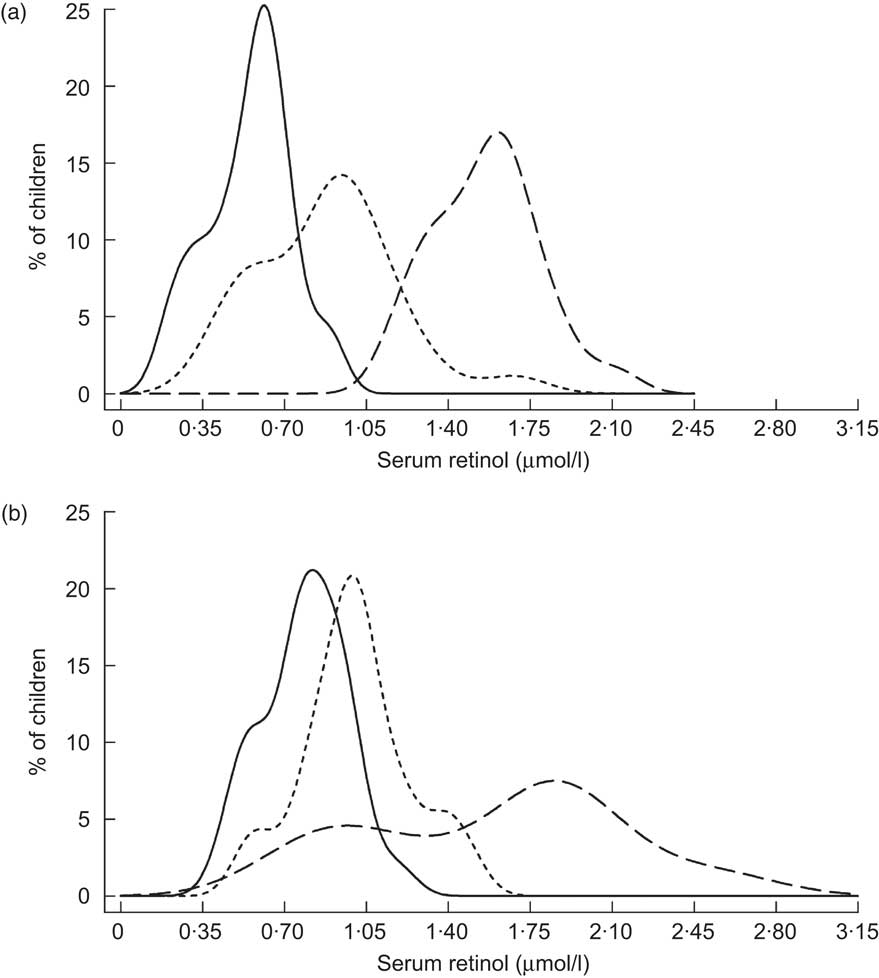
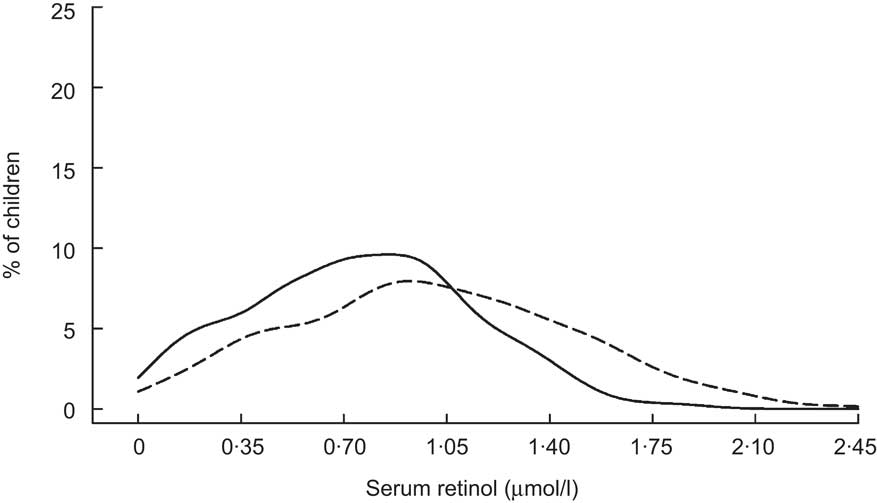
The remaining studies in Table 2 were conducted within the context of VA supplementation programmes in Indonesia, Mexico, the Philippines, India and Zambia. Two of these, from Indonesia( Reference Tanumihardjo and Permaesih 29 ) and Zambia( 30 ), did not have baseline data on SROL. Among Indonesian children, SROL concentrations were roughly equivalent when measured at 1 and 2 months following that country's supplementation campaign, suggesting that there was no effect by that time( Reference Tanumihardjo and Permaesih 29 ). Repeated, cross-sectional surveys from Zambia also showed little difference in plasma retinol when measured at approximately 5 and 18 weeks following high-potency VA receipt( 30 ). Information on apparent liver stores of VA was also available from modified RDR testing in the Indonesian study. Interestingly, although ∼40 % of children had low SROL at both contacts, none tested positive for low liver stores( Reference Tanumihardjo and Permaesih 29 ). Of the remaining five studies listed in Table 2, all showed an initial rightward shift in the SROL distribution and a roughly 25 % (mean, weighted by study size) decrease in the proportion of deficient children (SROL < 0·70 μmol/l) in the first 2 months post-dosing( Reference Robles-Sardin, Astiazaran-Garcia and Davalos-Navarro 31 – Reference Pedro, Madriaga and Barba 35 ). SROL concentrations measured at later time points in Mexico, the Philippines (Fig. 3) and India (Fig. 4) were consistent with a return toward baseline status by the second contact, 2 to 3 months following VA supplement receipt( Reference Robles-Sardin, Astiazaran-Garcia and Davalos-Navarro 31 , Reference Perlas, Florentino and Fuertes 32 , Reference Gorstein, Bhaskaram and Khanum 34 , Reference Pedro, Madriaga and Barba 35 ).
Distribution of serum retinol concentrations at initial contact (——), 1 month (– – –) and 4 months (- - -) following a mass vitamin A supplementation campaign among Filipino children (aged 1–5 years)( Reference Perlas, Florentino and Fuertes 32 )
Distribution of serum retinol concentrations at initial contact (——), 1 month (– – –) and 4 months (- - -) following a mass vitamin A supplementation campaign among Indian children in Orissa State (aged 1–4 years)( Reference Gorstein, Bhaskaram and Khanum 34 )
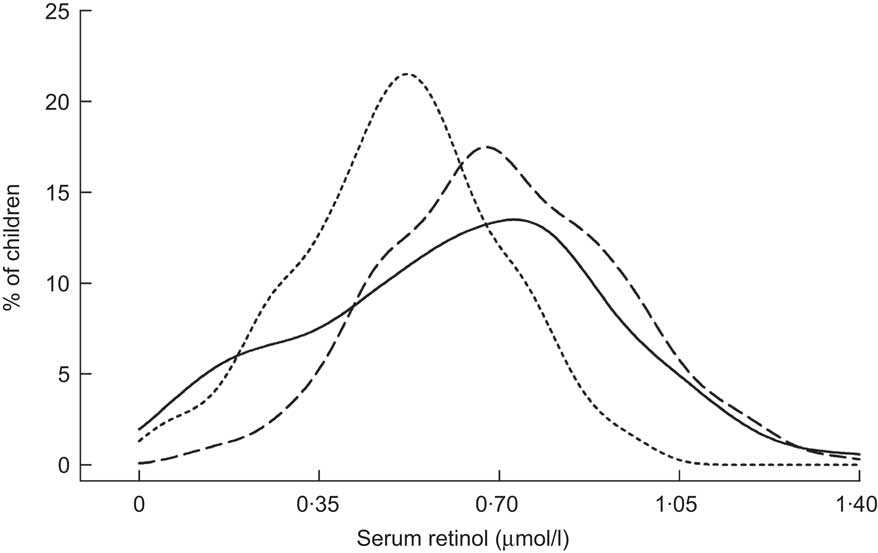
Table 3 summarizes reports on the response of SROL concentrations to consumption of VA-fortified food products. An early evaluation of three deficiency-control strategies in the Philippines revealed a significant rightward shift in the SROL distribution among children aged 1–16 years whose households were supplied with fortified packets of monosodium glutamate (MSG; Fig. 5)( Reference Solon, Fernandez and Latham 36 ), particularly among children with low baseline SROL levels (not displayed). Although there was no unintervened comparison group, the SROL distribution remained relatively stable and comparable among children who received a 6-monthly VA supplement and among those whose families received a public health/horticultural intervention over the same 2-year period( Reference Solon, Fernandez and Latham 36 ). Provision of VA-fortified MSG through purchase at ordinary retail outlets also shifted the SROL distribution of children (0–5 years) to the right, as illustrated in Fig. 6 ( Reference Murdiana and Azis 37 ). In this case, the mean SROL concentration of children residing in villages whose markets carried VA-fortified MSG increased compared with their baseline (+0·25 μmol/l), whereas mean SROL declined over the same period among children in control villages (−0·02 μmol/l; P < 0·05).
Controlled trials of vitamin A-fortified foods among children of pre-school age
| Serum retinol (μmol/l) | |||||||||||||
| First author & | Sample size | E | C1 | C2 | |||||||||
| reference | Food vehicle | Intervention | Age | Contact | E | C1* | C2† | Mean | sd | Mean | sd | Mean | sd |
| Solon( Reference Solon, Fernandez and Latham 36 ) | MSG: 4500 μg retinyl palmitate/ | HH received fortified MSG 2 | 1–6 years; | Initial | 387 | 391 | 343 | 0·74 | 0·43 | 0·67 | 0·42 | 0·69 | 0·40 |
| packet | packets/d on weekly basis v. public health/horticulture intervention (C1) or VA capsule (C2) comparison groups | 7–16 years‡ | 2 year | 387 | 391 | 343 | 1·00§ | 0·52 | 0·57 | 0·42 | 0·69 | 0·47 | |
| Muhilal( Reference Murdiana and Azis 37 ) | MSG: 810 μg retinyl palmitate/ | Villages randomly assigned | 0–5 years | Initial | 205 | 240 | – | 0·67 | 0·33 | 0·78 | 0·35 | – | – |
| packet | to market fortified (E) v. | 6 month | 258 | 289 | – | 0·78 | 0·32 | 0·71 | 0·30 | – | – | ||
| unfortified (C) MSG via ordinary channels | 12 month | 217 | 290 | – | 0·92§,∥ | 0·33 | 0·72 | 0·33 | – | – | |||
| Solon( Reference Solon, Solon and Mehansho 38 ) | Margarine: 54 μg RE β-carotene, | HH randomly assigned to | 3–6 years | Initial | 296 | 285 | – | 0·92 | 0·32 | 0·93 | 0·34 | – | – |
| 754 μg retinyl palmitate, 6 mg thiamin & 100 μg cholecalciferol/30 g serving | receive 250 g fortified (E) or unfortified (C) margarine weekly for each resident child | 6 month | 296 | 285 | – | 1·01§,∥ | 0·35 | 0·88 | 0·22 | – | – | ||
| Candelaria( Reference Candelaria, Magsadia and Velasco 41 ) | Coconut oil: 175 μg retinyl | HH randomly assigned to | 4–7 years | Initial | 268 | 145 | 128 | 1·01 | 0·28 | 1·08 | 0·32 | 1·16 | 0·28 |
| palmitate/15 g serving | receive 200 g fortified (E) or unfortified (C1) or no oil (C2) weekly | 6 month | 268 | 145 | 128 | 1·29§ | 0·25 | 1·33 | 0·28 | 1·46 | 0·28 | ||
| Zimmerman( Reference Zimmermann, Wegmueller and Zeder 39 ) | Salt: 60 μg retinyl palmitate, 25 μg | HH randomly assigned to | 6–14 years | Initial | 74 | 83 | – | 0·93 | 0·17 | 0·91 | 0·14 | – | – |
| potassium iodate & 2 mg ferric | receive 2 kg triple-fortified | 5 month | 74 | 83 | – | 1·14 | 0·13 | 0·94 | 0·15 | – | – | ||
| pyrophosphate/g | salt (E) or iodized salt (C) monthly | 10 month | 72 | 83 | – | 1·18§,∥ | 0·12 | 0·91 | 0·15 | – | – | ||
| Solon( Reference Solon, Klemm and Sanchez 40 ) | Wheat flour bun: 133 μg retinyl | Children in 4 rural schools | 6–13 years | Initial | 396 | 439 | – | 1·17 | 0·33 | 1·18 | 0·30 | – | – |
| palmitate/60 g serving | randomly assigned to receive fortified (E) or unfortified (C) wheat bun 5 d/week | 30 week | 396 | 439 | – | 1·32§ | 0·37 | 1·31 | 0·40 | – | – | ||
| Nesamvuni( Reference Nesamvuni, Vorster and Margetts 42 ) | Maize meal flour: fortified with | HH randomly assigned to | 1–3 years | Initial | 16 | 20 | – | 1·19 | 0·48 | 1·28 | 0·38 | – | – |
| 510 μg retinyl palmitate, 0·61 mg thiamin, 0·62 mg riboflavin and 0·56 mg pyridoxine/150 g serving | receive 25–50 kg fortified (E) or unfortified (C) maize meal flour monthly | 12 month | 16 | 20 | – | 1·30 | 0·35 | 1·31 | 0·47 | – | – | ||
E, experimental group; C, control or placebo group; MSG, monosodium glutamate; HH, household.
*Control or comparison group.
†Where applicable.
‡Children 1–6 years comprised 2/3 of study sample and children 7–16 years comprised 1/3 of sample.
§Significant increase in serum retinol concentration from initial to follow-up (P < 0·05).
∥Significant increase in serum retinol concentration compared with control (P < 0·05).
Distribution of serum retinol concentrations at initial contact (——) and 6 months (– – –) following introduction of vitamin A-fortified monosodium glutamate among Filipino children (aged 1–16 years)( Reference Solon, Fernandez and Latham 36 )
Distribution of serum retinol concentrations at initial contact (——), 5 months (– – –) and 11 months (- - -) following introduction of vitamin A-fortified monosodium glutamate among Indonesian children (aged 0–5 years)( Reference Murdiana and Azis 37 )
Sustained increases in SROL concentrations have also been reported among young children participating in trials in which margarine( Reference Solon, Solon and Mehansho 38 ), salt( Reference Zimmermann, Wegmueller and Zeder 39 ), a wheat flour bun( Reference Solon, Klemm and Sanchez 40 ), coconut oil( Reference Candelaria, Magsadia and Velasco 41 ) and maize meal( Reference Nesamvuni, Vorster and Margetts 42 ) were fortified with VA. However, only the margarine and VA-fortified salt interventions significantly improved SROL over controls. Children enrolled in these two trials had lower baseline SROL levels( Reference Solon, Solon and Mehansho 38 , Reference Zimmermann, Wegmueller and Zeder 39 ) than those enrolled in the trials of VA-fortified wheat flour bun, coconut oil and maize meal( Reference Solon, Klemm and Sanchez 40 – Reference Nesamvuni, Vorster and Margetts 42 ), suggesting that homeostatic control mechanisms operating in adequately VA-nourished children may have attenuated any effect. This is supported by subgroup analyses from the Filipino wheat flour trial( Reference Solon, Klemm and Sanchez 40 ), which showed a greater, albeit non-significant, change in SROL (0·13 μmol/l relative to controls) among children with deficient baseline VA status (<0·70 μmol/l) than among those with adequate VA status at baseline (0·02 μmol/l relative to controls). Following the 30-week intervention, researchers also assessed apparent VA liver stores using the modified RDR test in a 20 % subsample of children with the lowest baseline SROL( Reference Solon, Klemm and Sanchez 40 ). Prevalence of low liver stores in the VA-fortified group was roughly half that of the control group (15 % v. 28 %).
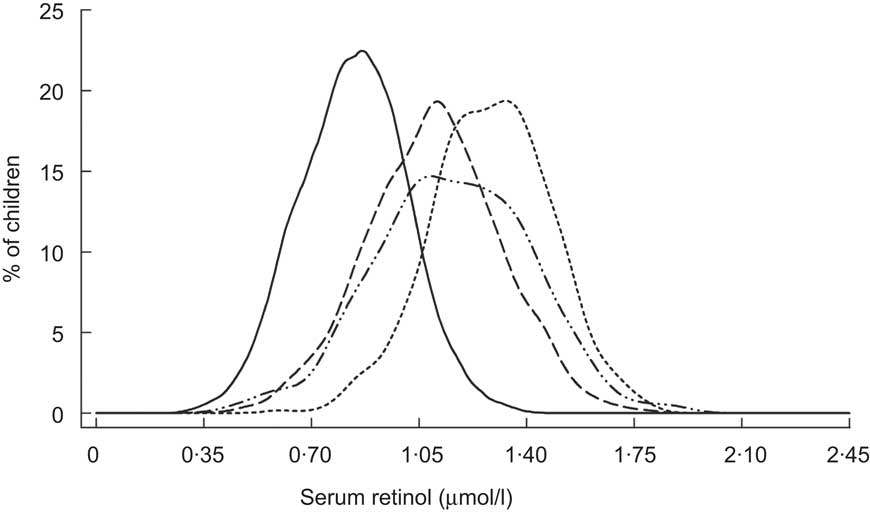
Lastly, the impact of VA-fortified sugar intake on SROL distributions of children has long been documented in Central America. Sugar fortification was first introduced in Guatemala in the 1970s. Over the first 2 years of implementation, Arroyave and colleagues tracked changes in VA status of the population via semi-annual, cross-sectional biochemical surveys( Reference Arroyave, Aguilar and Flores 43 , Reference Arroyave, Mejia and Aguilar 44 ). The progressive and iconic shift to the right in the population's SROL distribution over time is reproduced in Fig. 7. Improvements in VA status have also been evident from shifts in the SROL distribution among young children in Nicaragua, where sugar fortification was initiated in 1999 (Fig. 8)( 45 ). Subsequent cross-sectional surveys indicate that this shift has been sustained over a period of several years( Reference Gurdián, Kontorovsky and Alvarado 46 ).
Distribution of serum retinol concentrations at baseline (October–November 1975; ——), 6 months (April–May 1976; – – –) and 12 months (October–November 1976; –·–·–) following implementation of a vitamin A sugar fortification programme among Guatemalan children( Reference Arroyave, Aguilar and Flores 43 ). Reproduced with permission from the Pan American Health Organization (PAHO), Washington, DC. To obtain PAHO publications, visit their website at http://publications.paho.org or write to PAHO Sales and Distribution Center, PO Box 27, Annapolis, MD 20701-0027. Fax: (301) 206-9789; Email: sales@paho.org
Distribution of serum retinol concentrations prior to (1993; ——) and at 1 year (2000; – – –), 4 years (2003; - - -) and 5 years (2004; – ·· –) following implementation of a vitamin A sugar fortification programme among Nicaraguan children (aged 1–5 years)( 45 , Reference Gurdián, Kontorovsky and Alvarado 46 )
Interpretation and discussion
Repeated measures of a population's SROL distribution provide an effective tool for tracking the adequacy of dietary VA intakes over time. High-potency VA supplementation is intended to boost liver stores, enabling the gradual release and delivery of VA to tissues in children with dietary VA deficits. However, semi-annual supplementation does not resolve underlying dietary inadequacies. Thus we see only a transient shift in the SROL distribution. Overall, experimental data suggest that high-potency VA supplements protect children aged 6–59 months from hyporetinolaemia for approximately 8 to 10 weeks( Reference Pereira and Begum 19 – Reference Humphrey and Natadisastra 23 ). The duration of protection may be shorter among children with low baseline SROL concentrations( Reference Humphrey and West 27 ) or those consuming a VA-poor diet( Reference Pereira and Begum 20 ), while a larger supplement dosage may sustain SROL concentrations >0·70 μmol/l for a longer period of time( Reference Humphrey and Natadisastra 23 ). While seasonal changes in diet, infection and acute malnutrition likely confound observational data, the studies described in Table 2 are consistent with an immediate albeit transient impact. Unlike high-potency supplementation, improvements in dietary VA intake can shift a population's SROL distribution. The large-scale trials of MSG + VA fortification in the Philippines and Indonesia( Reference Solon, Fernandez and Latham 36 , Reference Murdiana and Azis 37 ), and evaluations of sugar + VA fortification programs in Central America( Reference Arroyave, Mejia and Aguilar 44 – Reference Gurdián, Kontorovsky and Alvarado 46 ), exemplify the responsiveness of SROL concentrations to increased preformed VA in the diet, in these instances from fortified food products.
Monitoring the impact of vitamin A supplementation programmes
High-potency supplementation cannot be expected to markedly and sustainably improve dietary VA adequacy. Thus, SROL is not an informative indicator of VA supplementation programme performance or public health impact (i.e. reduction in risks of xerophthalmia and mortality). However, the public health efficacy of high-potency VA supplementation is well established. More than two decades of research have illustrated reductions in mortality( Reference Beaton, Martorell and Aronson 3 ), xerophthalmia( Reference Djunaedi, Sommer and Pandji 47 , Reference Katz, West and Khatry 48 ), nutritional blindness( Reference Sommer and West 49 ) and anaemia( Reference West, Gernand and Sommer 50 ). The question then arises how best to measure this impact.
Evaluations of VA supplementation programmes would ideally be able to estimate changes in xerophthalmia or mortality attributable to VA capsule receipt. However, virtually all programme ‘monitoring and evaluation’ capabilities are constrained in their ability to validly attribute mortality or other health changes to VA supplementation. This would require a randomized or, at least, pseudo-experimental design combined with rigorous population research methods. Programmes may be able to monitor trends in vital events or xerophthalmia in order to evaluate the plausibility of association between extent of coverage and difference in outcomes( Reference Habicht, Victora and Vaughan 51 ). Vital events registries could provide such data, but are nearly always lacking in settings requiring VA supplementation to reduce blindness and mortality. Further assessment of xerophthalmia requires large sample sizes, trained clinicians and/or reliable local terms for night blindness( Reference Sommer 52 ). Data from sequential population surveys provide another means of comparing concurrent trends in supplementation and child mortality, taking care to account for other contributing factors. At the least resolute level, changes in the under-5 s mortality rate may be compared with trends in reported VA supplementation coverage( 53 ). However, the under-5 s mortality rate is a composite national indicator that includes (i) deaths among infants less than 6 months of age; and (ii) offers no opportunity to partition and attribute effects to a single intervention.
In view of these constraints, programme managers are advised to rely on the well-documented evidence of supplementation's prophylactic efficacy. Population-based trials carried out among more than 165 000 children in Southern Asia and Sub-Saharan Africa have, as a group, demonstrated a mean reduction of 23 % to 34 % in mortality among young children( Reference Beaton, Martorell and Aronson 3 – Reference Tonascia 5 ), as well as significant decreases in xerophthalmia( Reference Djunaedi, Sommer and Pandji 47 , Reference Katz, West and Khatry 48 ). The following points should be kept in mind when using, for example, the mean reduction of 23 % provided by Beaton and colleagues: (i) this estimate is based on all enrolled children 6–59 months of age, not restricted to deficient children( Reference Beaton, Martorell and Aronson 3 ); (ii) the estimate applied to all included trial populations, irrespective of background child mortality rates within the approximate range of 10 to 120 deaths per 1000 child-years( Reference Beaton, Martorell and Aronson 3 ); (iii) supplementation coverage within the study populations was in the range of 80 to 90 %( Reference Palmer and West 2 ); and (iv) age-appropriate doses of 105 μmol (100 000 IU) or 210 μmol (200 000 IU) were delivered every 4 to 6 months, consistent with the present WHO/UNICEF recommendations( 24 ). Each of these conditions is achievable by programmes in the field.
Within inferential limits imposed by non-experimental design, findings from programme monitoring have been consistent with those from randomized, controlled trials. For example, data from Nepal's 2001 Demographic and Health Survey were used to model the impact of that country's VA programme as it was being expanded into all districts( Reference Thapa, Choe and Retherford 54 ). In this case, 100 % supplementation coverage was associated with a 53 % reduction in child mortality, a magnitude of impact that could have also reflected benefits of co-delivery of other high-impact health interventions at the time of supplementation. Scale up of VA supplementation in Yemen was linked with a significant reduction in case fatality among children hospitalized with severe dehydrating diarrhoea( Reference Banajeh 55 ). Data from survey and surveillance based evaluations in Bangladesh have attested to an effectiveness of VA supplementation programmes in preventing xerophthalmia( Reference Cohen, Rahman and Mitra 56 , Reference Bloem, Hye and Wijnroks 57 ).
In summary, twice-yearly supplementation programmes can expect to reduce mortality and xerophthalmia in VA-deficient populations which suffer from major childhood infectious diseases including diarrhoea, measles, likely malaria and other severe febrile illnesses. Trials designed to assess efficacy of VA in reducing xerophthalmia and mortality provide a useful upper limit of expected impact. Programme effectiveness can, therefore, best be estimated by combining estimates of efficacy with coverage. For example, given a conservative estimated reduction in pre-school child mortality of 23 % from trials reaching ∼85 % coverage( Reference Beaton, Martorell and Aronson 3 ), a VA supplementation programme reaching 75 % of its targeted 6–59-month-old population would, under an assumption of equal risk irrespective of coverage, be expected to reduce mortality by ∼20 %. The assumption may be incorrect, with highest-risk children often being most difficult to reach( Reference Tarwotjo, Sommer and West 58 ), suggesting that decrements below ∼85 % have proportionately less impact while higher coverage proportionately more. Optimizing and accurately monitoring coverage is therefore critical, with coverage serving as an indicator of both output and public health impact.
Monitoring the impact of vitamin A food fortification
In contrast to supplementation, regular consumption of VA-fortified food products can ensure stable and adequate dietary nutrient intakes. If fortified food products are consumed in sufficient quantity by those at risk of deficiency, VA status can be replenished and maintained, evident in a sustained shift in SROL distributions towards adequacy seen in Figs 6 to 8.
To date, food fortification is a primary strategy to control VA deficiency in a limited number of countries. In areas with wide-scale fortification, a shift in the SROL distribution over time can be a sensitive and reliable indicator of changed VA status in a population( Reference Wasantwisut 59 ). Data from national surveys in the Central American region from the 1960s to the 1990s confirm a considerable reduction in the prevalence of VA deficiency (SROL < 0·70 μmol/l) that has been largely attributed to sugar fortification( Reference Mora, Dary and Chinchilla 60 ). One fortification trial that was designed and powered to detect an impact on mortality reported 11 % and 45 % reductions in infant and child mortality, respectively( Reference Permeisih and Idjradinata 61 ). The results suggest that meeting the recommended dietary allowance for VA through food fortification is as, or more, effective than semi-annual supplementation. Fortification trials have also reported significant decreases in xerophthalmia among young children( Reference Solon, Fernandez and Latham 36 , Reference Solon, Solon and Mehansho 38 , Reference Permeisih and Idjradinata 61 ).
Assessing the population need for programmes
SROL distributions from representative cross-sectional surveys can reflect levels of dietary adequacy of bioavailable VA, and thus inform decisions regarding the need for continued VA programming. For example, consider a country where semi-annual supplementation coverage consistently exceeds 85 %; yet representative survey data indicate that >20 % of children 6–59 months of age have low SROL concentrations (<0·70 μmol/l), surpassing the recommended threshold for an important VA deficiency public health problem( 11 ). This should not be interpreted as programme failure, given the inability of high-potency VA to raise and sustain a SROL distribution. Rather, it underscores a persistent inadequacy of dietary VA among young children, made worse, perhaps, by frequent infections that can lower VA status and a need to continue universal VA supplementation (with other public health initiatives) to protect young children from deficiency-related mortality while taking more urgent steps to improve dietary VA intake and breast-feeding rates. Zambia's experience provides a practical example. In 1998, Zambia adopted a policy of mandatory sugar fortification with VA to complement its supplementation programme which, with its routinely high coverage, could be relied on to be reducing xerophthalmia and mortality, but not sustainably raising SROL. Still, surveys in 2003 revealed a prevalence of hyporetinolaemia of >50 %( 30 ). The findings suggested the country needed to: (i) maintain universal supplementation at high coverage; (ii) continue with aggressive public health measures to control infection and improve overall nutritional status; (iii) re-assess effectiveness and improve coverage of VA-fortified sugar; (iv) consider fortification of other food vehicles; and (v) improve bioavailable intake of VA, as possible, from other dietary sources.
A number of countries previously categorized by the WHO as ‘at-risk’ of VA deficiency have made progress in scaling up food fortification, improving economic development, raising dietary adequacy or achieving other public health gains to improve VA status( 6 ). Under these circumstances, a shift in the SROL distribution obtained from repeated, cross-sectional surveys can serve as an indicator of the population's adequacy in VA intake and status. Once SROL distributions shift and stabilize to the right, yielding a consistently low prevalence of hyporetinolaemia, countries may consider phasing out universal VA supplementation. As a provisional recommendation, we propose that ≤5 % of children of pre-school age be stably classified as VA deficient (SROL < 0·70 μmol/l) before scaling back of universal VA supplementation be considered. This cut-off is equivalent to one-third the recommended prevalence threshold for defining VA deficiency as a public health problem but still about twice the prevalence of such low values that are often expected in industrialized countries( Reference Ballew, Bowman and Sowell 62 , Reference Thane, Bates and Prentice 63 ). To ensure confidence in an estimate, samples sizes should be sufficient to detect a prevalence ≤5 % with a 95 % CI that excludes the 15 % cut-off in populations previously considered to be at high risk of VA deficiency. The stability of acceptable population status would need to be evident in at least two consecutive cross-sectional surveys approximately 12 months apart to minimize seasonal differences on diet or infection. Even with this criterion met, high-risk populations would require continued monitoring, particularly during periods of economic stress( Reference West and Mehra 64 ).
Data from Nicaragua provide an example of how these guidelines might be applied (Fig. 8). After several years of sugar VA fortification, by 2003, only 0·2 % of children 12–59 months of age had deficient SROL concentrations( Reference Gurdián, Kontorovsky and Alvarado 46 ). Although the proportion of VA-deficient children increased slightly to 3·1 % in 2004, it remained below the proposed cut-off. These distributions suggest that the present Nicaraguan diet that includes VA-fortified sugar can provide sufficient dietary VA to protect against deficiency. However, previous experience in Central America suggests that children less than 2 years of age may not consume adequate amounts of fortified sugar( Reference Mora, Dary and Chinchilla 60 ). They may therefore remain a high-risk group for VA deficiency and its health consequences, even where food fortification is generally effective for the broader population. Assessments including a sufficient number of children in both younger (<2 years) and older (2–5 years) age groups could be used to inform a transition from universal to targeted supplementation in Nicaragua.
Conclusions
VA supplementation programmes have been widely adopted in developing countries as a means to control deficiency, prevent nutritional blindness and reduce child mortality( Reference Palmer and West 2 ). We have attempted to address unresolved questions regarding the use of SROL distributions, specifically the shift in distributions over time, in evaluating the impact of those programmes and in guiding decisions to scale back universal supplementation. While there is a need for additional trials to measure prophylactic efficacy, the available literature suggests that high-potency VA supplementation improves the population SROL distribution among children 6–59 months of age for a short period of time (usually <2 months) before it returns to pre-supplementation levels. A SROL distribution, therefore, may not be adequately reflective of a VA supplementation programme's public health impact. Supplementation coverage, coupled with reliance on demonstrated field trial impact, remains the most appropriate indicator for this purpose. Regular and adequate consumption of VA-fortified foods among high-risk groups, such as children less than 2 years of age, or overall gains in development can produce a sustained rightward shift in the SROL distribution, providing an indication of adequate dietary VA intake and status in a population. Consecutive cross-sectional surveys, conducted a year apart, that demonstrate a stable and low prevalence (≤5 %) of hyporetinolaemia are proposed as sufficient evidence to consider a measured scaling back of universal VA supplementation to younger children and/or geographically targeted programmes, while remaining vigilant and responsive to recurrent nutritional stress. We propose this criterion for shifting a VA programme strategy be considered by UN agencies responsible for guiding global policy.
Acknowledgements
Source of funding: This work was supported in part by the Bill and Melinda Gates Foundation, Seattle, WA, with additional support by the UNICEF Nutrition Section, New York, NY. Conflicts of interest: The authors report no conflicts of interest. Authors’ contribution: K.P.W. conceived of the idea for this review. A.C.P. conducted the literature search, technical review and drafted the manuscript. K.P.W., N.D. and W.S. contributed to the manuscript. All authors have read and approved the final manuscript and are responsible for the final content.


