





In Australia, 25 % of children and adolescents and 67 % of adults are living with overweight or obesity(1). This burden is experienced disproportionately in lower socio-economic groups, those living in rural and remote areas, and by First Nations Australians(1). Evidence suggests that this may be partially explained by excessive sugar intake, particularly if consumed in liquid form(Reference Malik and Hu2). Indeed, the most recent Australian National Nutrition Survey showed that Australians consumed an average of 60 g of free sugars per d (equivalent to fourteen teaspoons of white sugar) in 2011–2012, which albeit high represented a reduction in dietary energy from free sugars from 12·5 % in 1995 to 10·9 % of energy in 2011–2012(3).
Excessive intake of free sugars has been associated not only with overweight/obesity in children and adults(Reference Vartanian, Schwartz and Brownell4–Reference Malik, Pan and Willett6) but also cardiometabolic diseases(Reference Malik, Popkin and Bray7,Reference Malik, Popkin and Bray7,Reference Xi, Huang and Reilly8) and dental caries(Reference Moynihan and Kelly9). Furthermore, randomised trials showed reduced intake of dietary sugars was associated with an about 0·8 kg decrease in body weight, but isoenergetic exchange of dietary sugars with other carbohydrates showed no change in body weight(Reference Te Morenga, Mallard and Mann10). However, trials in children, which involved recommendations to reduce intake of sugar-sweetened foods and beverages, had low participant compliance to dietary advice and showed no overall change in body weight(Reference Te Morenga, Mallard and Mann10).
Sugars are carbohydrates that occur naturally in foods like milk and whole fruits but also appear in a processed form throughout the food supply. Existing Australian Dietary Guidelines recommend avoiding ‘added’ sugars, whereas more recent WHO guidance recommends limiting consumption of ‘free’ sugars, which include both ‘added’ sugars and sugars naturally present in honey, syrups, fruit juices and fruit juice concentrates, recognising the equally harmful impacts of these sugars on the body(11,12) . Current intake guidelines from WHO suggest that free sugars should account for <10 % of total energy intake (approx. 53 g/13 teaspoons) to prevent unhealthy weight gain and dental caries(12). Australian adults consume, on average, fourteen teaspoons of free sugars daily, with adolescents and young adults consuming far more(13). More than half (52 %) of free sugars in the Australian diet derive from beverages, particularly soft drinks, sports and energy drinks (19 %), fruit and vegetable juices (13 %) and cordials/syrups (4·9 %)(13).
Given their substantial contribution to excess sugars consumption and otherwise limited nutritional value, governments around the world are taking policy action to reduce intake of sugar-sweetened beverages (SSB). At a global level, WHO recommends effective taxation of SSB among its ‘best-buy’ policies to address non-communicable diseases(14). Despite widespread support from public health and consumer groups(15), there has been limited political appetite for a similar levy on SSB in Australia. Instead, national action has been limited to a voluntary ‘Health Food Partnership’ (HFP) established by the Australian Federal Government in 2015, which included targets for sugar reduction to be achieved by 2025(16).
Outside of government initiatives, the Australian Beverages Council (ABC), the peak industry group representing makers of non-alcoholic beverages, has announced their own voluntary ‘Sugar Reduction Pledge’(17). Although announced in 2018, it purported to apply retroactively from 2015. Signatories of the ABC pledge committed to reducing sugar content across their non-alcoholic beverage portfolios by 20 % between 2015 and 2025, measured through sales-weighted average reductions in total grams of sugar per 100 ml across their portfolios. To date, four companies have become signatories: Asahi Lifestyle Beverages, Coca-Cola South Pacific, Coca-Cola Amatil and PepsiCo, which together account for over 80 % of the volume of sales of non-alcoholic beverages in Australia. Reductions can be achieved by a variety of actions including reformulating existing products, introduction of low- or no-sugar varieties, increasing sales of low- or no-sugar varieties and introducing smaller pack sizes. The ABC appointed consulting firm KPMG as an independent aggregator of industry self-reported data on progress. However, a peer-reviewed evaluation of progress towards the pledge is lacking.
To inform ongoing discussion about the need for stronger policy and/or regulatory action, the primary aim of this study is to investigate changes in the sugar content of non-alcoholic beverages available for purchase in Australia between 2015 and 2019. As secondary aims, we also analyse changes in the presence of sugar substitutes, also called non-nutritive sweeteners (NNS), in these products over the same period, and examine results separately for the four signatory companies to the ABC pledge.
Methods
Data source
The George Institute’s FoodSwitch programme captures images of packaged foods and beverages using a smartphone application(Reference Dunford, Trevena and Goodsell18,Reference Dunford, Webster and Metzler19) . Using this process, the FoodSwitch Monitoring Datasets are generated annually based on systematic data collection from four large Australian supermarket stores (Aldi, Coles, Independent Grocers of Australia and Woolworths) in the Sydney metropolitan area. Data collection takes place over a 4-month period each year. Trained data collectors take images of products in-store, capturing information including product barcode, product name, package size, ingredients list, manufacturer and brand names, and nutrition information on the front and back of pack. The database represents >90 % of the Australian packaged food and beverage market(Reference Dunford, Trevena and Goodsell18). The 2015, 2016, 2017, 2018 and 2019 FoodSwitch Monitoring Datasets were used in this study.
Beverages included in this analysis
Using the categorisation system developed by the Global Food Monitoring Group, foods and beverages in the FoodSwitch programme are classified into a hierarchical tree to allow for comparison of nutritionally similar foods(Reference Dunford, Webster and Metzler19). Products are categorised into major, minor and further subcategories. Our analysis included packaged non-alcoholic beverage products from the following categories: cordials/syrups, electrolyte/sports drinks, energy drinks, fruit and vegetable juices, soft drinks (including iced teas), waters, breakfast beverages, milks, and milk-based protein drinks. We included coffee products that were ready-to-drink (e.g. iced coffee milks) but excluded plain coffee and coffee products that required further preparation. We also excluded other beverage powders and mixes that can be made up in a variety of preparations (e.g. hot chocolates), and all yogurts and probiotic drinks. A detailed description of the included categories and their definitions is provided in Supplemental Table S1.
For each beverage, we extracted the following information: product name, manufacturer’s name, total sugar content in grams per 100 ml, full ingredients list and category. Where a beverage appeared in more than one package size (i.e. a 375 ml can and 600 ml bottle of the same drink), each package size was counted once (i.e. a 375 ml can and 600 ml bottle were counted as two products).
Definition of sugar-sweetened beverages
To generate deeper insight into the extent that reformulation contributed to potential changes in sugar content (as opposed to introducing low- or no-sugar alternatives), we conducted additional analysis of changes in the sugar content of SSB specifically. For this purpose, SSB were defined as drinks containing added sugar ingredients. The full list of search terms used for added sugars is provided in Supplemental Table S2. For the purposes of this analysis, fruit juice concentrate or equivalents were not considered as added sugars when present in beverages, in keeping with the current law in Australia on making a ‘no added sugar’ claim(20). However, sensitivity analyses performed considering fruit juice concentrate and equivalent as added sugars had no material impact of the findings of this study and are available upon request.
Presence of non-nutritive sweeteners
To complement our analysis of changes in sugar content, we also analysed changes in the presence of NNS in beverages. As NNS are added in very small quantities and this amount is not required to be disclosed on the nutrition information panel, this was defined as a binary variable as presence or absence of NNS. Products were classified as containing NNS based on keyword searches within the ingredient list for each product. A detailed list of NNS terms was compiled based on reviewing food labelling and additive regulations relating to sweeteners in Australia. Search terms for NNS are provided in Supplemental Table S3. Search terms are those that are listed as intense sweeteners under Food Standards Australia New Zealand nomenclature.
Data analysis
First, to demonstrate trends in the availability of beverages in the Australian food supply, we calculated the number of products in each beverage category between 2015 and 2019. Second, to investigate changes in total sugar content, we calculated absolute and percentage change in total sugar content per 100 ml in all beverages between 2015 and 2019. In addition, we calculated the changes in sugar content between 2015 and 2018 to understand how much change had occurred prior to the announcement of the ABC pledge. Third, to estimate to whether changes in sugar content were explained by reformulation of existing beverages or addition of sugar-free beverages, we calculated absolute and percentage change in total sugar content per 100 ml for SSB. Fourth, to investigate whether sugar reductions were compensated by increases in NNS, we calculated the proportion of beverages containing at least one NNS. All analyses were stratified by categories of beverages as appropriate.
We carried out subgroup analysis for signatories of the ABC voluntary pledge, compared with those manufacturers who did not sign the pledge. For this subgroup analysis, only categories of beverages that were produced by signatories of the pledge were included. All analyses were carried out using R version 4.0.3.
Results
A total of 1499, 1503, 1502, 1655 and 1605 beverage products were included for 2015, 2016, 2017, 2018 and 2019, respectively (Supplemental Table S4).
All beverages
Overall, total sugar content decreased by 1·3 g/100 ml (equivalent to 17·1 %) from 7·5 g/100 ml in 2015 to 6·2 g/100 ml in 2019 (Table 1). However, there was substantial variation between categories, from no change for breakfast beverages to a 2·2 g/100 ml reduction in soft drinks (Fig. 1). For soft drinks and milk-based protein drinks, an almost 30 % reduction was achieved by 2019 (Fig. 2). For ready-to-drink coffees, there was an increase in sugar content from 6·5 to 7·0 g/100 ml.
Mean sugar content of beverages, stratified by category, available for purchase in Australia between 2015 and 2019

Values represent mean of total sugar in g/100 ml (SD).
Percentage change in mean sugar content (total sugar in g/100 ml) for all beverages available for purchase in Australia in 2015–2019 and 2015–2018

Percentage change in mean sugar content (total sugar in g/100 ml) for sugar-sweetened beverages available for purchase in Australia in 2015–2019

When comparing changes in sugar content from 2015 to 2018 with that from 2015 to 2019, a 20 % reduction in sugar content had already been achieved or surpassed by 2018 for waters, soft drinks, milk-based protein drinks and electrolyte drinks (Fig. 2). Whilst there was a trend towards decreasing total sugar content between 2018 and 2019 for categories such as ready-to-drink coffees and cordials/syrups, for other categories there was minimal progress (e.g. fruit and vegetable juices and milks) or even an increase in sugar content (e.g. energy drinks) between 2018 and 2019 (Fig. 2).
Sugar-sweetened beverages
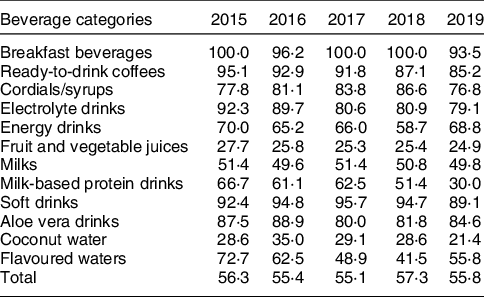
About 56 % of beverages across all categories in 2019 contained added sugars as ingredients, and this percentage was relatively stable from 2015 onwards (Table 2). In 2019, the categories with the highest proportion of beverages containing added sugar were breakfast beverages (94 %), soft drinks (89 %), ready-to-drink coffees (85 %) and aloe vera drinks (85 %). Fruit and vegetable juices contained the lowest proportion of products containing added sugar (25 %). Categories with the largest reduction in the proportion of products between 2015 and 2019 containing added sugar ingredients were flavoured waters (from 73 % to 56 %), electrolyte drinks (from 92 % to 80 %) and ready-to-drink coffees (from 95 % to 85 %). No categories showed an increase in the proportion of products containing added sugar ingredients between 2015 and 2019.
Percentage of beverages that were sugar-sweetened, stratified by category, available for purchase in Australia between 2015 and 2019
Overall, there was a 9·8 % reduction in the mean sugar content of SSB from 8·1 g/100 ml in 2015 to 7·3 g/100 ml in 2019 (Table 3). The largest reductions in sugar content were observed for soft drinks (from 9·2 g to 6·9 g/100 ml) and milk-based protein drinks (from 5·6 g to 4·6 g/100 ml). There was an increase in sugar content for ready-to-drink coffees from 6·7 g to 7·8 g/100 ml. Sugar content remained relatively stable for the remaining categories.
Mean sugar content of sugar-sweetened beverages (total sugar in g/100 ml), stratified by category, available for purchase in Australia between 2015 and 2019

Values represent mean of total sugar in g/100 ml (SD).
Non-nutritive sweeteners
Between 2015 and 2019, there was a 3 % overall increase in the percentage of beverages with at least one NNS from 41·2 % to 44·3 % (Supplemental Table S5). This increase was particularly marked for waters (from 3·4 % to 13·2 %) and electrolyte drinks (from 11·5 % to 32·6 %). There was a small reduction in the percentage of beverages with at least one NNS for breakfast beverages, ready-to-drink coffee and cordials/syrups.
Pledge signatories v. non-signatories
Between 2015 and 2019, the absolute reduction in sugar content for all beverages was larger for non-signatories than signatories of the industry pledge (19 % v. 16 %, respectively; Fig. 3(a)). For all beverage categories except energy drinks, there was an absolute reduction in sugar content for non-signatories of the pledge. For pledge signatories, there was an absolute reduction in sugar content for soft drinks, milks and electrolyte drinks, and an increase in sugar content for waters, fruit and vegetable juices and energy drinks. When considering only SSB, the absolute reduction in sugar content was still greater for non-signatories than signatories of the pledge (11 % v. 4 %, respectively) (Fig. 3(b)). The largest reductions were observed for electrolyte and soft drinks.
Percentage change in mean sugar content (total sugar in g/100 ml) for pledge signatories v. non-signatories between 2015 and 2019 for all beverages (a) and sugar-sweetened beverages (b)

Between 2015 and 2018, when the pledge was signed, both signatories and non-signatories had already reduced total sugar content across all categories of beverages, albeit to variable extents (Supplemental Fig. S2A). Overall, the decrease in sugar content was more marked for non-signatories than signatories of the pledge (16 % v. 13 %, respectively). The reduction in sugar content was also greater among non-signatories than signatories of the pledge for SSB (11 % v. 2 %, respectively; Supplemental Fig. S2B).
Discussion
Overall, the sugar content of beverages available for purchase in Australia decreased by 1·3/100 ml (or 17 %) between 2015 and 2019. However, there was substantial heterogeneity across beverage categories, with large decreases observed in soft drinks and milk-based protein drinks, compensated by minimal change or even increases in other categories, such as fruit and vegetable juices, energy drinks, and ready-to-drink coffees. SSB have accounted for about 56 % of all beverages available for purchase since 2015. The reduction in sugar content among SSB was about 10 % (0·8 g/100 ml) and mainly driven by lowering the sugar content of soft drinks, milks and milk-based protein drinks. Taken together, these findings suggest the overall reduction in sugar content for all beverages was due to a combination of new low- or no-sugar products on the market and reformulation of some categories of SSB. Between 2015 and 2019, there was a 3 % increase in the proportion of beverages containing at least one NNS, more notably for waters, soft drinks and electrolyte/sports drinks. The decrease in sugar content for all beverages and SSB separately was, in general, larger for non-signatories than for signatories of the voluntary industry pledge from 2018, thus suggesting the pledge had little or no impact on lowering sugar content of beverages available for purchase in Australia.
The larger reduction in sugar observed for beverages overall (17 %) v. SSB alone (10 %) suggests at least some of the overall reduction is due to the appearance of new products with low or no sugar, rather than efforts to lower the sugar content of existing products. This is important because consumers may be reluctant to replace their usual beverage choices with low- or no-sugar substitutes, thus limiting the potential impact on population sugar intake(Reference Fichera, Mora and Lopez-Valcarcel21). In addition, SSB account for over half of all beverages available for purchase in Australia every year since 2015. Mean sugar content of SSB has declined only by 10 % between 2015 and 2019, suggesting only modest reformulation has occurred. However, the almost 25 % lowering in sugar content for SSB in the soft drinks category demonstrates reformulation is feasible and should be applied to other beverage categories. Our findings suggest that reformulation was achieved, at least in part, by adding NNS, as shown by the rise in the percentage of beverages containing NNS. Although NNS have minimal or no calories and are used in minute quantities, their long-term health effects remain controversial(Reference Mooradian, Smith and Tokuda22), with emerging evidence suggesting they may have detrimental consequences at least for some individuals(Reference Suez, Cohen and Valdés-Mas23). Therefore, while it is undoubtedly in the interest of public health to reduce intake of added sugars, their replacement by NNS should be cautious and complemented by policies that promote replacement of SSB by healthier alternatives, such as plain water or tea. A detailed analysis of the changes in NNS across the entire food and drink supply and its implications in Australia is available elsewhere(Reference Dunford, Coyle and Louie24).
We found no evidence that the ABC’s voluntary sugar reduction pledge had led to a significant change in the sugar content of beverages available for purchase in Australia. Trends in sugar content for all drinks and SSB were broadly more favourable for manufacturers that did not sign the pledge than pledge signatories. This may be due to self-selection as the pledge was voluntary and, thus, companies with fewer SSB on their portfolio may have been more likely to sign the pledge than others. Furthermore, the decision by ABC to make the pledge apply retroactively from 2015 appeared to be an attempt to accrue credit from pre-existing reductions in sugar content in some cases, with our results showing that between 2015 and 2018, a substantial reduction in the mean sugar content of products available from pledge signatories had already occurred. It is, thus, germane to ask whether industry should have established a more ambitious lower target (i.e. a larger percentage reduction), or have used 2018 as a baseline rather than 2015. Our study casts doubt on signatories’ commitment to reduce the sugar content of their beverages and invest in reformulation of their SSB. In addition, the effectiveness of the pledge is limited as signatories only account for about 10 % of the beverages available for purchase in Australia, even if they may represent a larger proportion of sales. Indeed, Australia’s two largest non-alcoholic beverage bottlers, Coca-Cola Europacific Partners Australia and Asahi Holdings Australia Pty limited, are pledge signatories and represent 56·3 % of the market share for soft drinks and 85·7 % for bottled water(25). Nonetheless, our findings suggest that voluntary sugar reduction initiatives will not drive consistent improvement across the entire beverage supply and are likely to have suboptimal public health impacts due to inherent conflicts between the public health objectives of such initiatives and the beverage industry’s profit imperative(Reference Knai, Petticrew and Douglas26). Food companies are often less committed to engage with sugar reduction programmes in the absence of a level playing field created by mandatory legislation, complete with sanctions or some form of financial incentive or penalty for lack of progress towards sugar reduction targets(Reference Bandy, Scarborough and Harrington27). Commercial conflicts of interest are also likely to impair the achievement of the recently adopted government-endorsed voluntary targets for sugar reduction included in Australia’s Healthy Food Partnership initiative(16).
By 2021, the Obesity Evidence Hub estimated that about fifty countries worldwide had implemented some form of tax on SSB despite wide variation in type and design of tax across countries (e.g. tiered v. uniform tax, eligible drinks, sugar limits, etc.)(28). The benefits such taxes are fourfold: they introduce a price signal to consumers that a product is unhealthy; they create disincentives to purchase higher priced products; they provide profit incentives for manufacturers to systematically reformulate to reduce sugar content; and they generate revenue that governments can reinvest in public health and healthcare interventions(Reference Wright, Smith and Hellowell29). Examples from across the world illustrate how those benefits can be achieved. In Mexico, a fixed tax of 1 peso (£0·03; €0·04; $0·04) per litre (approximately 10 % increase in price) was applied to all non-alcoholic drinks with added sugar starting in 2014. Two years after implementation of the tax, household purchases of taxed beverages decreased by an average of 7·6 %, with larger reductions in purchases documented in urban areas, in households with children and adolescents, in low socio-economic households, and among high SSB purchasing households(Reference Colchero, Molina and Guerrero-López30,Reference Ng, Rivera and Popkin31) . In Portugal, the government introduced a consumption tax levied on SSB in 2017, which was divided into two tiers: drinks with sugar contents below 80 g/l of final product (charged at €8·22/100 l) are the lower tier and those above 80 g/l of final product (charged at €16·46/100 l) are the upper tier. During the first year of implementation, this tax collected about 80 million Euros, and all revenue was invested towards the Portuguese National Health Service funding. Although sales of SSB decreased by only about 7 %, reformulation processes led to an 11 % reduction of total energy intake through consumption of SSB at population level(Reference Goiana-da-Silva, Nunes and Miraldo32). In response to these results, the Portuguese government redesigned the taxation to further encourage reformulation, but its evaluation is yet to be published(Reference Goiana-da-Silva, Cruz-e-Silva and Gregório33). In the UK, the Soft Drinks Industry Levy (SDIL) was implemented in 2018(Reference Bandy, Scarborough and Harrington34). This two-tiered levy subjects high-sugar products to a higher tax than lower sugar products and led to a 10 % decrease in sugar consumption from soft drinks per household per week, despite no change in the volume of drinks purchased overall, thus demonstrating the potential to reduce the harmful effects of sugar intake without damaging industry profits(Reference Pell, Mytton and Penney35). The findings from individual countries have been recently confirmed by a systematic review and meta-analysis, which showed that the overall tax pass-through rate was 82 % and the demand for SSB was highly sensitive to tax-induced price increases, with a mean reduction in SSB sales of 15 %(Reference Andreyeva, Marple and Marinello36). It did not find evidence of substitution to untaxed beverages or material changes in SSB consumption. Importantly, it demonstrated that tiered taxes resulted in reformulation and reduced sugar content of taxed beverages, whilst local-level taxes incentivised cross-border shopping, which are useful lessons for countries considering the pros and cons of different taxation models.
The mounting evidence supporting effective taxes on SSB elsewhere warrants consideration of the policy’s merits in Australia. Modelling by the Australian Medical Association in 2021 suggested a tax on selected SSB would reduce sugar consumption from soft drinks by 12–18 % and raise annual government revenue of $749 to $814 million(37). This builds on prior research suggesting a 12·6 % decline in daily consumption of SSB could result in a decline in obesity of 2·7 % in men and 1·2 % in women over the lifetime(Reference Veerman, Sacks and Antonopoulos38). It has also been estimated that a 20 % tax could save 1606 lives in 25 years, and over AUD$400 million in annual healthcare costs, almost 50 % of which would accrue in the most disadvantaged groups(Reference Lal, Mantilla-Herrera and Veerman39). Furthermore, national surveys showed that 77 % of Australians supported a tax on sugary drinks if the proceeds were used to fund obesity prevention(Reference Falbe, Thompson and Becker40).
Despite its myriad benefits, a tax on SSB is not a silver bullet that will address the excessive sugar intake and obesity epidemic in the Australian population(Reference von Philipsborn, Stratil and Burns41). Complementary policy-related measures that have been proposed include introducing package size limits(Reference Crino, Herrera and Ananthapavan42), improving information on added sugars on food labels, introducing mandatory targets or compositional limits on sugar content in SSB(43), and restricting sale of SSB in some settings, such as schools, hospitals and workplaces(Reference Epel, Hartman and Jacobs44). Although a comprehensive suite of measures will likely be required to bolster ongoing progress in reducing sugar consumption in Australia, a tax on SSB would be a key step forward considering the compelling effectiveness of SSB taxes worldwide, which underpins the recommendation as one of the WHO ‘best-buy’ policies.
Limitations
This study has some limitations. It lacked sales data and the ABC’s pledge was a commitment to reducing by 20 % sales-weighted sugar content, meaning our findings cannot directly assess achievement of the pledge overall. This means that even if there was a reduction in sugar content for some SSB, the intake of sugar accounted for by those drinks may have increased if consumption increased. Therefore, caution is needed when making inferences from our findings to impact on population sugar intake. Statistical tests were not performed as the FoodSwitch database represents more than 90 % of the beverage market in Australia, and hence statistical tests to account for sampling error would not likely have material impact on the interpretation of the study findings. As FoodSwitch data are captured at the same time each year, it is possible that seasonal products were missed. However, due to the transient nature of seasonal products in-store, it is unlikely that the inclusion/exclusion of these products would have changed the overall findings in the present study.
Conclusions
Overall, there has been a 17 % reduction in sugar content of beverages available for purchase in Australia between 2015 and 2019, which resulted from a combination of new low- or no-sugar products and reformulation of pre-existing beverages. However, there is much progress to be made to curb the excessive consumption of sugar among the Australian population. The limited progress made by voluntary initiatives provides impetus for further consideration of mandatory legislative measures including a tax on SSB.
Acknowledgements
Acknowledgements: None. Financial support: This study was not funded. AJ was supported by an Australian National Health and Medical Research Council Investigator Grant 1196831. Authorship: All authors designed the study. E.D. extracted the data. A.C.P.G. analysed the data and drafted the manuscript. All authors edited and reviewed the manuscript. Ethics of human subject participation: This study did not involve human participants. Ethical review was not waived according to Imperial College London Ethics Board.
Conflicts of interest:
There are no conflicts of interest.
Supplementary material
For supplementary material accompanying this paper visit https://doi.org/10.1017/S1368980022002300


 Open access

