


1 Introduction
Reliable and accurate constitutive modelling of granular flows is vital in both industrial and natural settings. Large-scale flows in nature, such as debris flows, snow avalanches and pyroclastic flows, are often sudden and destructive. Understanding and modelling their characteristics is therefore of great importance. Conversely, control of granular flows is sought after in industrial settings, such as the mining and pharmaceutical industries, as it allows for efficient and safe handling of granular materials. In all of these applications much of the flow behaviour can be described by the so-called ‘liquid phase’ (Forterre & Pouliquen Reference Forterre and Pouliquen2008). This regime occurs when grains move quickly enough that their contacts with neighbours are not enduring and slowly enough that they do not separate into a granular gas. Recently, continuum mechanics has been used to create a particularly effective model for these flows. By taking the ratio of the typical times of microscopic and macroscopic rearrangements of grains, a non-dimensional inertial number
 $I$
is formed that intuitively maps the transition through the liquid regime. The significance of this number was demonstrated by GDR MiDi (2004) who found that the ratio
$I$
is formed that intuitively maps the transition through the liquid regime. The significance of this number was demonstrated by GDR MiDi (2004) who found that the ratio
 $\unicode[STIX]{x1D707}$
of the shear stress
$\unicode[STIX]{x1D707}$
of the shear stress
 $\unicode[STIX]{x1D70F}$
and pressure
$\unicode[STIX]{x1D70F}$
and pressure
 $p$
collapsed onto a single
$p$
collapsed onto a single
 $\unicode[STIX]{x1D707}(I)$
curve for flows in a range of geometries. This
$\unicode[STIX]{x1D707}(I)$
curve for flows in a range of geometries. This
 $\unicode[STIX]{x1D707}(I)$
-rheology was developed further by Jop, Forterre & Pouliquen (Reference Jop, Forterre and Pouliquen2005) who derived a functional form based on inclined plane flow experiments.
$\unicode[STIX]{x1D707}(I)$
-rheology was developed further by Jop, Forterre & Pouliquen (Reference Jop, Forterre and Pouliquen2005) who derived a functional form based on inclined plane flow experiments.
Jop, Forterre & Pouliquen (Reference Jop, Forterre and Pouliquen2006) generalised the
 $\unicode[STIX]{x1D707}(I)$
-rheology into a full tensor constitutive law which links the deviatoric stress to the strain rate via an effective viscosity. This formulation is particularly nice, as the mass and momentum balance equations have essentially the same structure as the Navier–Stokes equations, with the only change being that the viscosity is pressure and strain-rate dependent. Many existing numerical methods for fluid flow have since been adapted to allow for the computation of granular flows with this non-Newtonian viscosity. The collapse of a column of grains (Lagrée, Staron & Popinet Reference Lagrée, Staron and Popinet2011) and the flow between confining sidewalls (Jop et al.
Reference Jop, Forterre and Pouliquen2006; Baker, Barker & Gray Reference Baker, Barker and Gray2016) are two noteworthy examples. However, the success of these computations is interesting given that Barker et al. (Reference Barker, Schaeffer, Bohorquez and Gray2015) showed that the governing equations are ill posed when the inertial number is too high or too low. When a system is ill posed, perturbations to the flow fields grow exponentially with growth rates tending to infinity as the wavelength is reduced. This means that numerical solutions will depend on the resolution of the grid being used and so cannot be taken as being physically realistic. Existing computations of the flow between sidewalls do not suffer from this issue as the flow has been assumed to be steady and the transient terms in the governing equations have been omitted in the numerical method. However, the highly transient granular column collapse simulations of Lagrée et al. (Reference Lagrée, Staron and Popinet2011) naturally include inertial numbers in the ill-posed regions of parameter space, as static material with
$\unicode[STIX]{x1D707}(I)$
-rheology into a full tensor constitutive law which links the deviatoric stress to the strain rate via an effective viscosity. This formulation is particularly nice, as the mass and momentum balance equations have essentially the same structure as the Navier–Stokes equations, with the only change being that the viscosity is pressure and strain-rate dependent. Many existing numerical methods for fluid flow have since been adapted to allow for the computation of granular flows with this non-Newtonian viscosity. The collapse of a column of grains (Lagrée, Staron & Popinet Reference Lagrée, Staron and Popinet2011) and the flow between confining sidewalls (Jop et al.
Reference Jop, Forterre and Pouliquen2006; Baker, Barker & Gray Reference Baker, Barker and Gray2016) are two noteworthy examples. However, the success of these computations is interesting given that Barker et al. (Reference Barker, Schaeffer, Bohorquez and Gray2015) showed that the governing equations are ill posed when the inertial number is too high or too low. When a system is ill posed, perturbations to the flow fields grow exponentially with growth rates tending to infinity as the wavelength is reduced. This means that numerical solutions will depend on the resolution of the grid being used and so cannot be taken as being physically realistic. Existing computations of the flow between sidewalls do not suffer from this issue as the flow has been assumed to be steady and the transient terms in the governing equations have been omitted in the numerical method. However, the highly transient granular column collapse simulations of Lagrée et al. (Reference Lagrée, Staron and Popinet2011) naturally include inertial numbers in the ill-posed regions of parameter space, as static material with
 $I=0$
is present. The lack of blow up due to the ill posedness is thought to be due to the finite time and resolution used, combined with a truncation of the granular viscosity. This truncation means that the equations revert back to the Newtonian Navier–Stokes equations, which are well posed, when the granular viscosity is too high or too low.
$I=0$
is present. The lack of blow up due to the ill posedness is thought to be due to the finite time and resolution used, combined with a truncation of the granular viscosity. This truncation means that the equations revert back to the Newtonian Navier–Stokes equations, which are well posed, when the granular viscosity is too high or too low.
It is also possible that the inclusion of additional physical effects such as compressibility (Boyer, Guazzelli & Pouliquen Reference Boyer, Guazzelli and Pouliquen2011; Barker et al.
Reference Barker, Schaeffer, Shearer and Gray2017), non-locality (Pouliquen & Forterre Reference Pouliquen and Forterre2009; Kamrin & Koval Reference Kamrin and Koval2012; Bouzid et al.
Reference Bouzid, Trulsson, Claudin, Clément and Andreotti2013) and frictional hysteresis (Edwards & Gray Reference Edwards and Gray2015; Edwards et al.
Reference Edwards, Viroulet, Kokelaar and Gray2017) may lead to well-posed systems of equations that provide a better match with certain experimental results. In particular, Trulsson et al. (Reference Trulsson, Bouzid, Claudin and Andreotti2013) showed that acoustic waves could be transmitted through shear flows when compressibility was taken into account and Pouliquen & Forterre (Reference Pouliquen and Forterre2009) and Kamrin & Henann (Reference Kamrin and Henann2015) were able to model the point of transition between static and moving material on a frictional inclined plane. However, these effects introduce additional complexity into the governing equations and require new numerical schemes to be developed in order to solve them. It is therefore the aim of this paper to assess whether it is possible to regularise the incompressible
 $\unicode[STIX]{x1D707}(I)$
-rheology in such a way that maintains the existing structure and methods, but avoids the ill posedness.
$\unicode[STIX]{x1D707}(I)$
-rheology in such a way that maintains the existing structure and methods, but avoids the ill posedness.
By applying the analysis of Barker et al. (Reference Barker, Schaeffer, Bohorquez and Gray2015) to general functional forms of the
 $\unicode[STIX]{x1D707}(I)$
curve it is found that it is possible to extend the range of well-posed inertial numbers, when compared to the form chosen by Jop et al. (Reference Jop, Forterre and Pouliquen2005). For flows with low inertial numbers the analysis demonstrates that values of
$\unicode[STIX]{x1D707}(I)$
curve it is found that it is possible to extend the range of well-posed inertial numbers, when compared to the form chosen by Jop et al. (Reference Jop, Forterre and Pouliquen2005). For flows with low inertial numbers the analysis demonstrates that values of
 $\unicode[STIX]{x1D707}$
must be smaller in order to remain well posed whereas for high inertial numbers the values of
$\unicode[STIX]{x1D707}$
must be smaller in order to remain well posed whereas for high inertial numbers the values of
 $\unicode[STIX]{x1D707}$
must be larger than in the rheology of Jop et al. (Reference Jop, Forterre and Pouliquen2005). Interestingly, these trends have been observed experimentally by Holyoake & McElwaine (Reference Holyoake and McElwaine2012) for high-speed flows and by Kamrin & Koval (Reference Kamrin and Koval2014) for slowly sheared flows. The analysis also highlights certain properties that the
$\unicode[STIX]{x1D707}$
must be larger than in the rheology of Jop et al. (Reference Jop, Forterre and Pouliquen2005). Interestingly, these trends have been observed experimentally by Holyoake & McElwaine (Reference Holyoake and McElwaine2012) for high-speed flows and by Kamrin & Koval (Reference Kamrin and Koval2014) for slowly sheared flows. The analysis also highlights certain properties that the
 $\unicode[STIX]{x1D707}(I)$
curve must possess in order to be well posed. Firstly, it is noted that only monotonically increasing functions are allowed and that in the limit
$\unicode[STIX]{x1D707}(I)$
curve must possess in order to be well posed. Firstly, it is noted that only monotonically increasing functions are allowed and that in the limit
 $I\rightarrow 0$
it is found that
$I\rightarrow 0$
it is found that
 $\unicode[STIX]{x1D707}$
must tend to zero. In the opposite limit, when
$\unicode[STIX]{x1D707}$
must tend to zero. In the opposite limit, when
 $I\rightarrow \infty$
, the analysis reveals that well-posed curves are not possible and instead there is a maximum well-posed value of the inertial number. Inspired by these findings, a new
$I\rightarrow \infty$
, the analysis reveals that well-posed curves are not possible and instead there is a maximum well-posed value of the inertial number. Inspired by these findings, a new
 $\unicode[STIX]{x1D707}(I)$
curve is proposed in this paper. The formulation consists of a piecewise function for
$\unicode[STIX]{x1D707}(I)$
curve is proposed in this paper. The formulation consists of a piecewise function for
 $\unicode[STIX]{x1D707}(I)$
with an expression that decays logarithmically as
$\unicode[STIX]{x1D707}(I)$
with an expression that decays logarithmically as
 $I\rightarrow 0$
for small inertial numbers. When the inertial number is in the intermediate range, where the
$I\rightarrow 0$
for small inertial numbers. When the inertial number is in the intermediate range, where the
 $\unicode[STIX]{x1D707}(I)$
curve of Jop et al. (Reference Jop, Forterre and Pouliquen2005) is well posed, the function approximates their expression, but when the inertial number is very large, the curve approaches the form suggested by Holyoake & McElwaine (Reference Holyoake and McElwaine2012) in which quadratic
$\unicode[STIX]{x1D707}(I)$
curve of Jop et al. (Reference Jop, Forterre and Pouliquen2005) is well posed, the function approximates their expression, but when the inertial number is very large, the curve approaches the form suggested by Holyoake & McElwaine (Reference Holyoake and McElwaine2012) in which quadratic
 $I^{2}$
dependence dominates. The rheology resulting from this new form of
$I^{2}$
dependence dominates. The rheology resulting from this new form of
 $\unicode[STIX]{x1D707}(I)$
is found to lead to well-posed equations for all inertial numbers below a maximum value.
$\unicode[STIX]{x1D707}(I)$
is found to lead to well-posed equations for all inertial numbers below a maximum value.
To verify the well posedness of the resultant equations, and confirm their physical basis, a range of transient flow simulations are performed. Decelerating inclined plane flows are chosen to study the low inertial number limit. By instantaneously changing the slope angle from one at which steady flow is observed down to an angle where static layers are predicted, the transition from flowing to stationary material is modelled. It is found that the rheology of Jop et al. (Reference Jop, Forterre and Pouliquen2006) exhibits grid-dependent results, as predicted by the ill posedness analysis, but that the regularised rheology is immune to these effects and matches well with the results of Parez, Aharonov & Toussaint (Reference Parez, Aharonov and Toussaint2016) who studied a similar system. Large inertial numbers are studied with simulations at high inclination angles. As was demonstrated previously by Barker et al. (Reference Barker, Schaeffer, Bohorquez and Gray2015), the unregularised rheology exhibits blow up as the steady-state inertial number is in the ill-posed range. With the newly proposed rheology an identical simulation instead converges towards a constant inertial number that is predicted by the theory.
Further justification of the proposed rheology comes from simulations of granular rollwaves, which are achieved here for the first time in two dimensions. Rollwaves are long surface waves which form on inclined plane flows when the Froude number is above a critical value. Previously Forterre & Pouliquen (Reference Forterre and Pouliquen2003) performed experiments to quantify the dispersion relation of these waves and Forterre (Reference Forterre2006) showed that a linear stability analysis of the
 $\unicode[STIX]{x1D707}(I)$
-rheology gave a good match with the experiments for slope angles in the well-posed range. Here it is shown that implementation of the regularised rheology, in an adaptation of the code of Lagrée et al. (Reference Lagrée, Staron and Popinet2011), allows for the two-dimensional flow fields and free-surface shapes to be computed. The waves are found to have a range of inertial numbers with some regions of the flow being in the previously ill-posed regime. As the dispersion relation and surface shape are found to be in good agreement with the depth-averaged
$\unicode[STIX]{x1D707}(I)$
-rheology gave a good match with the experiments for slope angles in the well-posed range. Here it is shown that implementation of the regularised rheology, in an adaptation of the code of Lagrée et al. (Reference Lagrée, Staron and Popinet2011), allows for the two-dimensional flow fields and free-surface shapes to be computed. The waves are found to have a range of inertial numbers with some regions of the flow being in the previously ill-posed regime. As the dispersion relation and surface shape are found to be in good agreement with the depth-averaged
 $\unicode[STIX]{x1D707}(I)$
-rheology of Gray & Edwards (Reference Gray and Edwards2014) as well as experimental measurements, the well posedness and physical basis of the proposed rheology are confirmed.
$\unicode[STIX]{x1D707}(I)$
-rheology of Gray & Edwards (Reference Gray and Edwards2014) as well as experimental measurements, the well posedness and physical basis of the proposed rheology are confirmed.
Previous methods of regularising the
 $\unicode[STIX]{x1D707}(I)$
-rheology have focused on removing the two natural singularities from the governing equations. Both the inertial number and granular viscosity may be singular or undefined when the pressure and strain rate vanish. Approaching either of these limits is an issue for numerical schemes as the viscosity will be either very large or very small. Lagrée et al. (Reference Lagrée, Staron and Popinet2011) chose to truncate the viscosity so that the equations reverted to the Newtonian Navier–Stokes equations when the granular viscosity was too large or too small. Similarly, Chauchat & Médale (Reference Chauchat and Médale2014) investigated alternative formulations for the granular viscosity which avoided the singularities by shifting the strain rate by a small value. The regularisation method presented in this paper is not concerned with removing the natural singularities from the granular viscosity, but is instead an attempt at removing the unbounded growth of noise from the computations. The regularisation techniques of Lagrée et al. (Reference Lagrée, Staron and Popinet2011) and Chauchat & Médale (Reference Chauchat and Médale2014) may therefore be complementary to the method presented here although this requires further investigation.
$\unicode[STIX]{x1D707}(I)$
-rheology have focused on removing the two natural singularities from the governing equations. Both the inertial number and granular viscosity may be singular or undefined when the pressure and strain rate vanish. Approaching either of these limits is an issue for numerical schemes as the viscosity will be either very large or very small. Lagrée et al. (Reference Lagrée, Staron and Popinet2011) chose to truncate the viscosity so that the equations reverted to the Newtonian Navier–Stokes equations when the granular viscosity was too large or too small. Similarly, Chauchat & Médale (Reference Chauchat and Médale2014) investigated alternative formulations for the granular viscosity which avoided the singularities by shifting the strain rate by a small value. The regularisation method presented in this paper is not concerned with removing the natural singularities from the granular viscosity, but is instead an attempt at removing the unbounded growth of noise from the computations. The regularisation techniques of Lagrée et al. (Reference Lagrée, Staron and Popinet2011) and Chauchat & Médale (Reference Chauchat and Médale2014) may therefore be complementary to the method presented here although this requires further investigation.
2 The
 $\unicode[STIX]{x1D707}(I)$
-rheology
$\unicode[STIX]{x1D707}(I)$
-rheology

Granular material consisting of a collection of spherical grains of diameter
 $d$
and intrinsic density
$d$
and intrinsic density
 $\unicode[STIX]{x1D70C}_{\ast }$
is modelled as a continuum occupying the spatial domain
$\unicode[STIX]{x1D70C}_{\ast }$
is modelled as a continuum occupying the spatial domain
 $\boldsymbol{x}=(x,y,z)$
. The flow of this material is described by a velocity vector
$\boldsymbol{x}=(x,y,z)$
. The flow of this material is described by a velocity vector
 $\boldsymbol{u}=(u,v,w)$
that varies in space and time
$\boldsymbol{u}=(u,v,w)$
that varies in space and time
 $t$
. By assuming that the solids volume fraction
$t$
. By assuming that the solids volume fraction
 $\unicode[STIX]{x1D719}$
is a constant, the mass conservation equation reduces to the incompressibility condition
$\unicode[STIX]{x1D719}$
is a constant, the mass conservation equation reduces to the incompressibility condition
 $$\begin{eqnarray}\unicode[STIX]{x1D735}\boldsymbol{\cdot }\boldsymbol{u}=0.\end{eqnarray}$$
The momentum balance equations are then
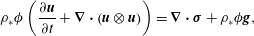 $$\begin{eqnarray}\unicode[STIX]{x1D70C}_{\ast }\unicode[STIX]{x1D719}\left(\frac{\unicode[STIX]{x2202}\boldsymbol{u}}{\unicode[STIX]{x2202}t}+\unicode[STIX]{x1D735}\boldsymbol{\cdot }\left(\boldsymbol{u}\otimes \boldsymbol{u}\right)\right)=\unicode[STIX]{x1D735}\boldsymbol{\cdot }\unicode[STIX]{x1D748}+\unicode[STIX]{x1D70C}_{\ast }\unicode[STIX]{x1D719}\boldsymbol{g},\end{eqnarray}$$
where
 $\boldsymbol{g}$
is the gravitational acceleration vector. The Cauchy stress tensor
$\boldsymbol{g}$
is the gravitational acceleration vector. The Cauchy stress tensor
 $\unicode[STIX]{x1D748}$
is decomposed into the deviatoric stress tensor
$\unicode[STIX]{x1D748}$
is decomposed into the deviatoric stress tensor
 $\unicode[STIX]{x1D749}$
and scalar pressure
$\unicode[STIX]{x1D749}$
and scalar pressure
 $p$
as
$p$
as
 $$\begin{eqnarray}\unicode[STIX]{x1D748}=-p\mathbf{1}+\unicode[STIX]{x1D749},\end{eqnarray}$$
where
 $\mathbf{1}$
is the identity matrix. GDR MiDi (2004) found that during deformation the shear stress
$\mathbf{1}$
is the identity matrix. GDR MiDi (2004) found that during deformation the shear stress
 $\Vert \unicode[STIX]{x1D749}\Vert$
scales with the pressure
$\Vert \unicode[STIX]{x1D749}\Vert$
scales with the pressure
 $p$
via the internal friction coefficient
$p$
via the internal friction coefficient
 $\unicode[STIX]{x1D707}$
as
$\unicode[STIX]{x1D707}$
as
 $$\begin{eqnarray}\Vert \unicode[STIX]{x1D749}\Vert =\unicode[STIX]{x1D707}p.\end{eqnarray}$$
The shear stress magnitude is
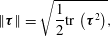 $$\begin{eqnarray}\Vert \unicode[STIX]{x1D749}\Vert =\sqrt{\frac{1}{2}\text{tr}\,\left(\unicode[STIX]{x1D749}^{2}\right)},\end{eqnarray}$$
with identical notation for the second invariant of a tensor being used throughout this paper. Assuming that the shear stresses and strain rates align, implies that the deviatoric stress tensor is
 $$\begin{eqnarray}\unicode[STIX]{x1D749}=\unicode[STIX]{x1D707}p\frac{\unicode[STIX]{x1D63F}}{\Vert \unicode[STIX]{x1D63F}\Vert },\end{eqnarray}$$
where the strain-rate tensor
 $\unicode[STIX]{x1D63F}$
is defined as
$\unicode[STIX]{x1D63F}$
is defined as
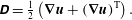 $$\begin{eqnarray}\unicode[STIX]{x1D63F}={\textstyle \frac{1}{2}}\left(\unicode[STIX]{x1D735}\boldsymbol{u}+(\unicode[STIX]{x1D735}\boldsymbol{u})^{\text{T}}\right).\end{eqnarray}$$
The
 $\unicode[STIX]{x1D707}(I)$
-rheology stems from the finding of GDR MiDi (2004) that
$\unicode[STIX]{x1D707}(I)$
-rheology stems from the finding of GDR MiDi (2004) that
 $\unicode[STIX]{x1D707}$
depends on the normalised strain rate
$\unicode[STIX]{x1D707}$
depends on the normalised strain rate
 $$\begin{eqnarray}I=\frac{2d\Vert \unicode[STIX]{x1D63F}\Vert }{\sqrt{p/\unicode[STIX]{x1D70C}_{\ast }}},\end{eqnarray}$$
known as the inertial number. Combining equations (2.3)–(2.8) allows the mass and momentum balance equations to be written as
 $$\begin{eqnarray}\displaystyle & \displaystyle \unicode[STIX]{x1D735}\boldsymbol{\cdot }\boldsymbol{u}=0, & \displaystyle\end{eqnarray}$$
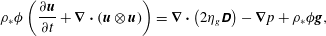 $$\begin{eqnarray}\displaystyle & \displaystyle \unicode[STIX]{x1D70C}_{\ast }\unicode[STIX]{x1D719}\left(\frac{\unicode[STIX]{x2202}\boldsymbol{u}}{\unicode[STIX]{x2202}t}+\unicode[STIX]{x1D735}\boldsymbol{\cdot }\left(\boldsymbol{u}\otimes \boldsymbol{u}\right)\right)=\unicode[STIX]{x1D735}\boldsymbol{\cdot }\left(2\unicode[STIX]{x1D702}_{g}\unicode[STIX]{x1D63F}\right)-\unicode[STIX]{x1D735}p+\unicode[STIX]{x1D70C}_{\ast }\unicode[STIX]{x1D719}\boldsymbol{g}, & \displaystyle\end{eqnarray}$$
where similarity with the Navier–Stokes equations is made clear through definition of the granular viscosity
 $$\begin{eqnarray}\unicode[STIX]{x1D702}_{g}=\frac{\unicode[STIX]{x1D707}(I)p}{2\Vert \unicode[STIX]{x1D63F}\Vert }.\end{eqnarray}$$
Equations (2.8)–(2.11) form a closed system once the functional form of
 $\unicode[STIX]{x1D707}(I)$
is defined.
$\unicode[STIX]{x1D707}(I)$
is defined.
The established method of determining the functional dependence of the
 $\unicode[STIX]{x1D707}(I)$
curve relies on a number of steps that have evolved over a period of time. The initial breakthrough came from Pouliquen (Reference Pouliquen1999) who discovered an empirical relationship between the Froude number
$\unicode[STIX]{x1D707}(I)$
curve relies on a number of steps that have evolved over a period of time. The initial breakthrough came from Pouliquen (Reference Pouliquen1999) who discovered an empirical relationship between the Froude number
 $Fr$
of a steady uniform flow, the flow depth
$Fr$
of a steady uniform flow, the flow depth
 $h$
and the depth of deposit
$h$
and the depth of deposit
 $h_{stop}$
left on a rough inclined chute when the supply was shut off, i.e.
$h_{stop}$
left on a rough inclined chute when the supply was shut off, i.e.
 $Fr=\unicode[STIX]{x1D6FD}h/h_{stop}(\unicode[STIX]{x1D701})$
, where
$Fr=\unicode[STIX]{x1D6FD}h/h_{stop}(\unicode[STIX]{x1D701})$
, where
 $\unicode[STIX]{x1D701}$
is the angle of inclination and
$\unicode[STIX]{x1D701}$
is the angle of inclination and
 $\unicode[STIX]{x1D6FD}$
is a constant. The deposit thickness
$\unicode[STIX]{x1D6FD}$
is a constant. The deposit thickness
 $h_{stop}$
tends to infinity at an angle
$h_{stop}$
tends to infinity at an angle
 $\unicode[STIX]{x1D701}_{s}$
and is equal to zero at
$\unicode[STIX]{x1D701}_{s}$
and is equal to zero at
 $\unicode[STIX]{x1D701}_{d}$
. Originally Pouliquen (Reference Pouliquen1999) used an exponential function to parameterise
$\unicode[STIX]{x1D701}_{d}$
. Originally Pouliquen (Reference Pouliquen1999) used an exponential function to parameterise
 $h_{stop}$
, but a reciprocal form is now commonly used (Pouliquen & Forterre Reference Pouliquen and Forterre2002). Since
$h_{stop}$
, but a reciprocal form is now commonly used (Pouliquen & Forterre Reference Pouliquen and Forterre2002). Since
 $\unicode[STIX]{x1D707}=\tan \unicode[STIX]{x1D701}$
during steady uniform flow, Pouliquen (Reference Pouliquen1999) was able to combine these measurements to infer the effective basal friction
$\unicode[STIX]{x1D707}=\tan \unicode[STIX]{x1D701}$
during steady uniform flow, Pouliquen (Reference Pouliquen1999) was able to combine these measurements to infer the effective basal friction
 $\unicode[STIX]{x1D707}=\unicode[STIX]{x1D707}(Fr/h)$
for depth-averaged avalanche models. The final step was made by Jop et al. (Reference Jop, Forterre and Pouliquen2005) who depth averaged the Bagnold velocity profile for steady uniform flow (Silbert et al.
Reference Silbert, Ertas, Grest, Halsey, Levine and Plimpton2001; GDR MiDi 2004) to show that
$\unicode[STIX]{x1D707}=\unicode[STIX]{x1D707}(Fr/h)$
for depth-averaged avalanche models. The final step was made by Jop et al. (Reference Jop, Forterre and Pouliquen2005) who depth averaged the Bagnold velocity profile for steady uniform flow (Silbert et al.
Reference Silbert, Ertas, Grest, Halsey, Levine and Plimpton2001; GDR MiDi 2004) to show that
 $Fr/h$
was linearly related to the inertial number
$Fr/h$
was linearly related to the inertial number
 $I$
. Substituting this into Pouliquen & Forterre’s (Reference Pouliquen and Forterre2002) reciprocal form of the friction law implies that
$I$
. Substituting this into Pouliquen & Forterre’s (Reference Pouliquen and Forterre2002) reciprocal form of the friction law implies that
 $$\begin{eqnarray}\unicode[STIX]{x1D707}_{J}(I)=\unicode[STIX]{x1D707}_{s}+\frac{\unicode[STIX]{x1D707}_{d}-\unicode[STIX]{x1D707}_{s}}{I_{0}/I+1},\end{eqnarray}$$
where
 $I_{0}$
is a constant, the static friction coefficient
$I_{0}$
is a constant, the static friction coefficient
 $\unicode[STIX]{x1D707}_{s}=\tan \unicode[STIX]{x1D701}_{s}$
and the dynamic friction
$\unicode[STIX]{x1D707}_{s}=\tan \unicode[STIX]{x1D701}_{s}$
and the dynamic friction
 $\unicode[STIX]{x1D707}_{d}=\tan \unicode[STIX]{x1D701}_{d}$
. The subscript ‘J’ indicates that this form was first introduced by Jop et al. (Reference Jop, Forterre and Pouliquen2005). A summary of the entire argument, including corrections to the form of the Froude number to account for inclined coordinates, is given in Gray & Edwards (Reference Gray and Edwards2014).
$\unicode[STIX]{x1D707}_{d}=\tan \unicode[STIX]{x1D701}_{d}$
. The subscript ‘J’ indicates that this form was first introduced by Jop et al. (Reference Jop, Forterre and Pouliquen2005). A summary of the entire argument, including corrections to the form of the Froude number to account for inclined coordinates, is given in Gray & Edwards (Reference Gray and Edwards2014).
3 Generalised ill-posedness analysis of the
$\unicode[STIX]{x1D707}(I)$
-rheology

Ill-posed equations amplify small perturbations at an unbounded rate when the wavelength of the perturbations is infinitesimally small. To test if the
 $\unicode[STIX]{x1D707}(I)$
-rheology leads to such behaviour, the system of equations (2.9)–(2.10) is first linearised about a base state
$\unicode[STIX]{x1D707}(I)$
-rheology leads to such behaviour, the system of equations (2.9)–(2.10) is first linearised about a base state
 $(\boldsymbol{u}^{0},p^{0})$
and the perturbations
$(\boldsymbol{u}^{0},p^{0})$
and the perturbations
 $(\hat{\boldsymbol{u}},\hat{p})$
are taken to be initially small in amplitude. For very small perturbation wavelengths, gradients of the base-state fields are negligible at the scale over which the perturbations vary. This consideration localises the analysis and simplifies the treatment as some terms, for example the convective terms
$(\hat{\boldsymbol{u}},\hat{p})$
are taken to be initially small in amplitude. For very small perturbation wavelengths, gradients of the base-state fields are negligible at the scale over which the perturbations vary. This consideration localises the analysis and simplifies the treatment as some terms, for example the convective terms
 $\unicode[STIX]{x1D735}\boldsymbol{\cdot }\left(\boldsymbol{u}\otimes \boldsymbol{u}\right)$
, may be neglected to leading order in the infinitesimal wavelength limit. As in Barker et al. (Reference Barker, Schaeffer, Bohorquez and Gray2015) this reduces the equations (2.9)–(2.10) to
$\unicode[STIX]{x1D735}\boldsymbol{\cdot }\left(\boldsymbol{u}\otimes \boldsymbol{u}\right)$
, may be neglected to leading order in the infinitesimal wavelength limit. As in Barker et al. (Reference Barker, Schaeffer, Bohorquez and Gray2015) this reduces the equations (2.9)–(2.10) to
 $$\begin{eqnarray}\displaystyle & \displaystyle \unicode[STIX]{x1D735}\boldsymbol{\cdot }\hat{\boldsymbol{u}}=0, & \displaystyle\end{eqnarray}$$
 $$\begin{eqnarray}\displaystyle & \displaystyle \unicode[STIX]{x1D70C}_{\ast }\unicode[STIX]{x1D719}\frac{\unicode[STIX]{x2202}\hat{\boldsymbol{u}}}{\unicode[STIX]{x2202}t}=\unicode[STIX]{x1D702}_{g}^{0}\left[\unicode[STIX]{x1D6FB}^{2}\hat{\boldsymbol{u}}-r\unicode[STIX]{x1D63C}\unicode[STIX]{x1D735}(\unicode[STIX]{x1D63C}\unicode[STIX]{x1D735})^{\text{T}}\hat{\boldsymbol{u}}\right]+\left[q\unicode[STIX]{x1D63C}\unicode[STIX]{x1D735}-\unicode[STIX]{x1D735}\right]\hat{p}, & \displaystyle\end{eqnarray}$$
where
 $\unicode[STIX]{x1D63C}=\unicode[STIX]{x1D63F}^{0}/\Vert \unicode[STIX]{x1D63F}^{0}\Vert$
is the normalised base-state strain-rate tensor,
$\unicode[STIX]{x1D63C}=\unicode[STIX]{x1D63F}^{0}/\Vert \unicode[STIX]{x1D63F}^{0}\Vert$
is the normalised base-state strain-rate tensor,
 $\unicode[STIX]{x1D702}_{g}^{0}$
is the viscosity (2.11) evaluated with the base-state fields and
$\unicode[STIX]{x1D702}_{g}^{0}$
is the viscosity (2.11) evaluated with the base-state fields and
 $$\begin{eqnarray}r=1-I\unicode[STIX]{x1D707}^{\prime }/\unicode[STIX]{x1D707},\quad q=\unicode[STIX]{x1D707}-I\unicode[STIX]{x1D707}^{\prime }/2,\end{eqnarray}$$
with
 $$\begin{eqnarray}\unicode[STIX]{x1D707}^{\prime }=\frac{\text{d}\unicode[STIX]{x1D707}}{\text{d}I},\end{eqnarray}$$
are defined for brevity. This set of equations has normal mode solutions
 $$\begin{eqnarray}\displaystyle & \displaystyle \left[\begin{array}{@{}c@{}}\hat{\boldsymbol{u}}\\ \hat{p}\end{array}\right]=\exp \left(\text{i}\unicode[STIX]{x1D743}\boldsymbol{\cdot }\boldsymbol{x}+\unicode[STIX]{x1D706}t\right)\left[\begin{array}{@{}c@{}}\tilde{\boldsymbol{u}}\\ \tilde{p}\end{array}\right], & \displaystyle\end{eqnarray}$$
where
 $\unicode[STIX]{x1D743}$
is the wavevector,
$\unicode[STIX]{x1D743}$
is the wavevector,
 $\unicode[STIX]{x1D706}$
is the growth rate and
$\unicode[STIX]{x1D706}$
is the growth rate and
 $\tilde{\boldsymbol{u}}$
and
$\tilde{\boldsymbol{u}}$
and
 $\tilde{p}$
are constants.
$\tilde{p}$
are constants.
Substitution of (3.5) into the linearised governing equations (3.1)–(3.2) leads to an eigenvalue problem for the growth rate and velocity perturbation. Due to the incompressibility condition the perpendicular wavevector
 $\unicode[STIX]{x1D743}^{\bot }$
is an eigenvector of the velocity in two dimensions so the problem can be solved exactly to give
$\unicode[STIX]{x1D743}^{\bot }$
is an eigenvector of the velocity in two dimensions so the problem can be solved exactly to give
 $$\begin{eqnarray}\unicode[STIX]{x1D706}=\frac{\unicode[STIX]{x1D702}_{g}^{0}}{\unicode[STIX]{x1D70C}_{\ast }\unicode[STIX]{x1D719}}\left(\frac{q|\unicode[STIX]{x1D743}|^{2}(\unicode[STIX]{x1D743}\boldsymbol{\cdot }\unicode[STIX]{x1D63C}\unicode[STIX]{x1D743})-|\unicode[STIX]{x1D743}|^{4}+r(\unicode[STIX]{x1D743}^{\bot }\boldsymbol{\cdot }\unicode[STIX]{x1D63C}\unicode[STIX]{x1D743})^{2}}{|\unicode[STIX]{x1D743}|^{2}-q(\unicode[STIX]{x1D743}\boldsymbol{\cdot }\unicode[STIX]{x1D63C}\unicode[STIX]{x1D743})}\right).\end{eqnarray}$$
This expression for the growth rate is second order in wavenumber
 $|\unicode[STIX]{x1D743}|$
as the terms in the numerator are all of order
$|\unicode[STIX]{x1D743}|$
as the terms in the numerator are all of order
 $|\unicode[STIX]{x1D743}|^{4}$
whereas the terms in the denominator are of order
$|\unicode[STIX]{x1D743}|^{4}$
whereas the terms in the denominator are of order
 $|\unicode[STIX]{x1D743}|^{2}$
. Therefore if
$|\unicode[STIX]{x1D743}|^{2}$
. Therefore if
 $\unicode[STIX]{x1D706}$
is positive the equations are ill posed since the growth rate tends to infinity quadratically in the high wavenumber limit. If the sign of the expression is negative then the equations are well posed as all perturbations will decay. Due to the symmetry of the strain-rate tensor (2.7), and thus
$\unicode[STIX]{x1D706}$
is positive the equations are ill posed since the growth rate tends to infinity quadratically in the high wavenumber limit. If the sign of the expression is negative then the equations are well posed as all perturbations will decay. Due to the symmetry of the strain-rate tensor (2.7), and thus
 $\unicode[STIX]{x1D63C}$
, it is possible to rotate the coordinates used to evaluate (3.6), leaving its value unchanged. By choosing a convenient axis Barker et al. (Reference Barker, Schaeffer, Bohorquez and Gray2015) derived the condition that
$\unicode[STIX]{x1D63C}$
, it is possible to rotate the coordinates used to evaluate (3.6), leaving its value unchanged. By choosing a convenient axis Barker et al. (Reference Barker, Schaeffer, Bohorquez and Gray2015) derived the condition that
 $$\begin{eqnarray}\displaystyle & \displaystyle C>0:\text{ill posed} & \displaystyle\end{eqnarray}$$
 $$\begin{eqnarray}\displaystyle & \displaystyle C\leqslant 0:\text{well posed}, & \displaystyle\end{eqnarray}$$
where
 $$\begin{eqnarray}C=4\left(\frac{I\unicode[STIX]{x1D707}^{\prime }}{\unicode[STIX]{x1D707}}\right)^{2}-4\left(\frac{I\unicode[STIX]{x1D707}^{\prime }}{\unicode[STIX]{x1D707}}\right)+\unicode[STIX]{x1D707}^{2}\left(1-\frac{I\unicode[STIX]{x1D707}^{\prime }}{2\unicode[STIX]{x1D707}}\right)^{2}.\end{eqnarray}$$
It is noted that in order to derive the principal linearised momentum balance (3.2), and thus the condition above, only the second-order spatial gradients of the velocity perturbation and first-order gradients of the pressure perturbation have been included as they will dominate in the high wavenumber limit. However when
 $C=0$
these terms cancel and so do not contribute to the growth rate. In this special case, the first-order spatial gradients of the velocity will dominate instead. Since the terms containing these gradients are all complex valued, due to the form of the perturbations (3.5),
$C=0$
these terms cancel and so do not contribute to the growth rate. In this special case, the first-order spatial gradients of the velocity will dominate instead. Since the terms containing these gradients are all complex valued, due to the form of the perturbations (3.5),
 $C=0$
corresponds to well-posed equations i.e. the real part of the growth rate remains bounded in the high wavenumber limit.
$C=0$
corresponds to well-posed equations i.e. the real part of the growth rate remains bounded in the high wavenumber limit.
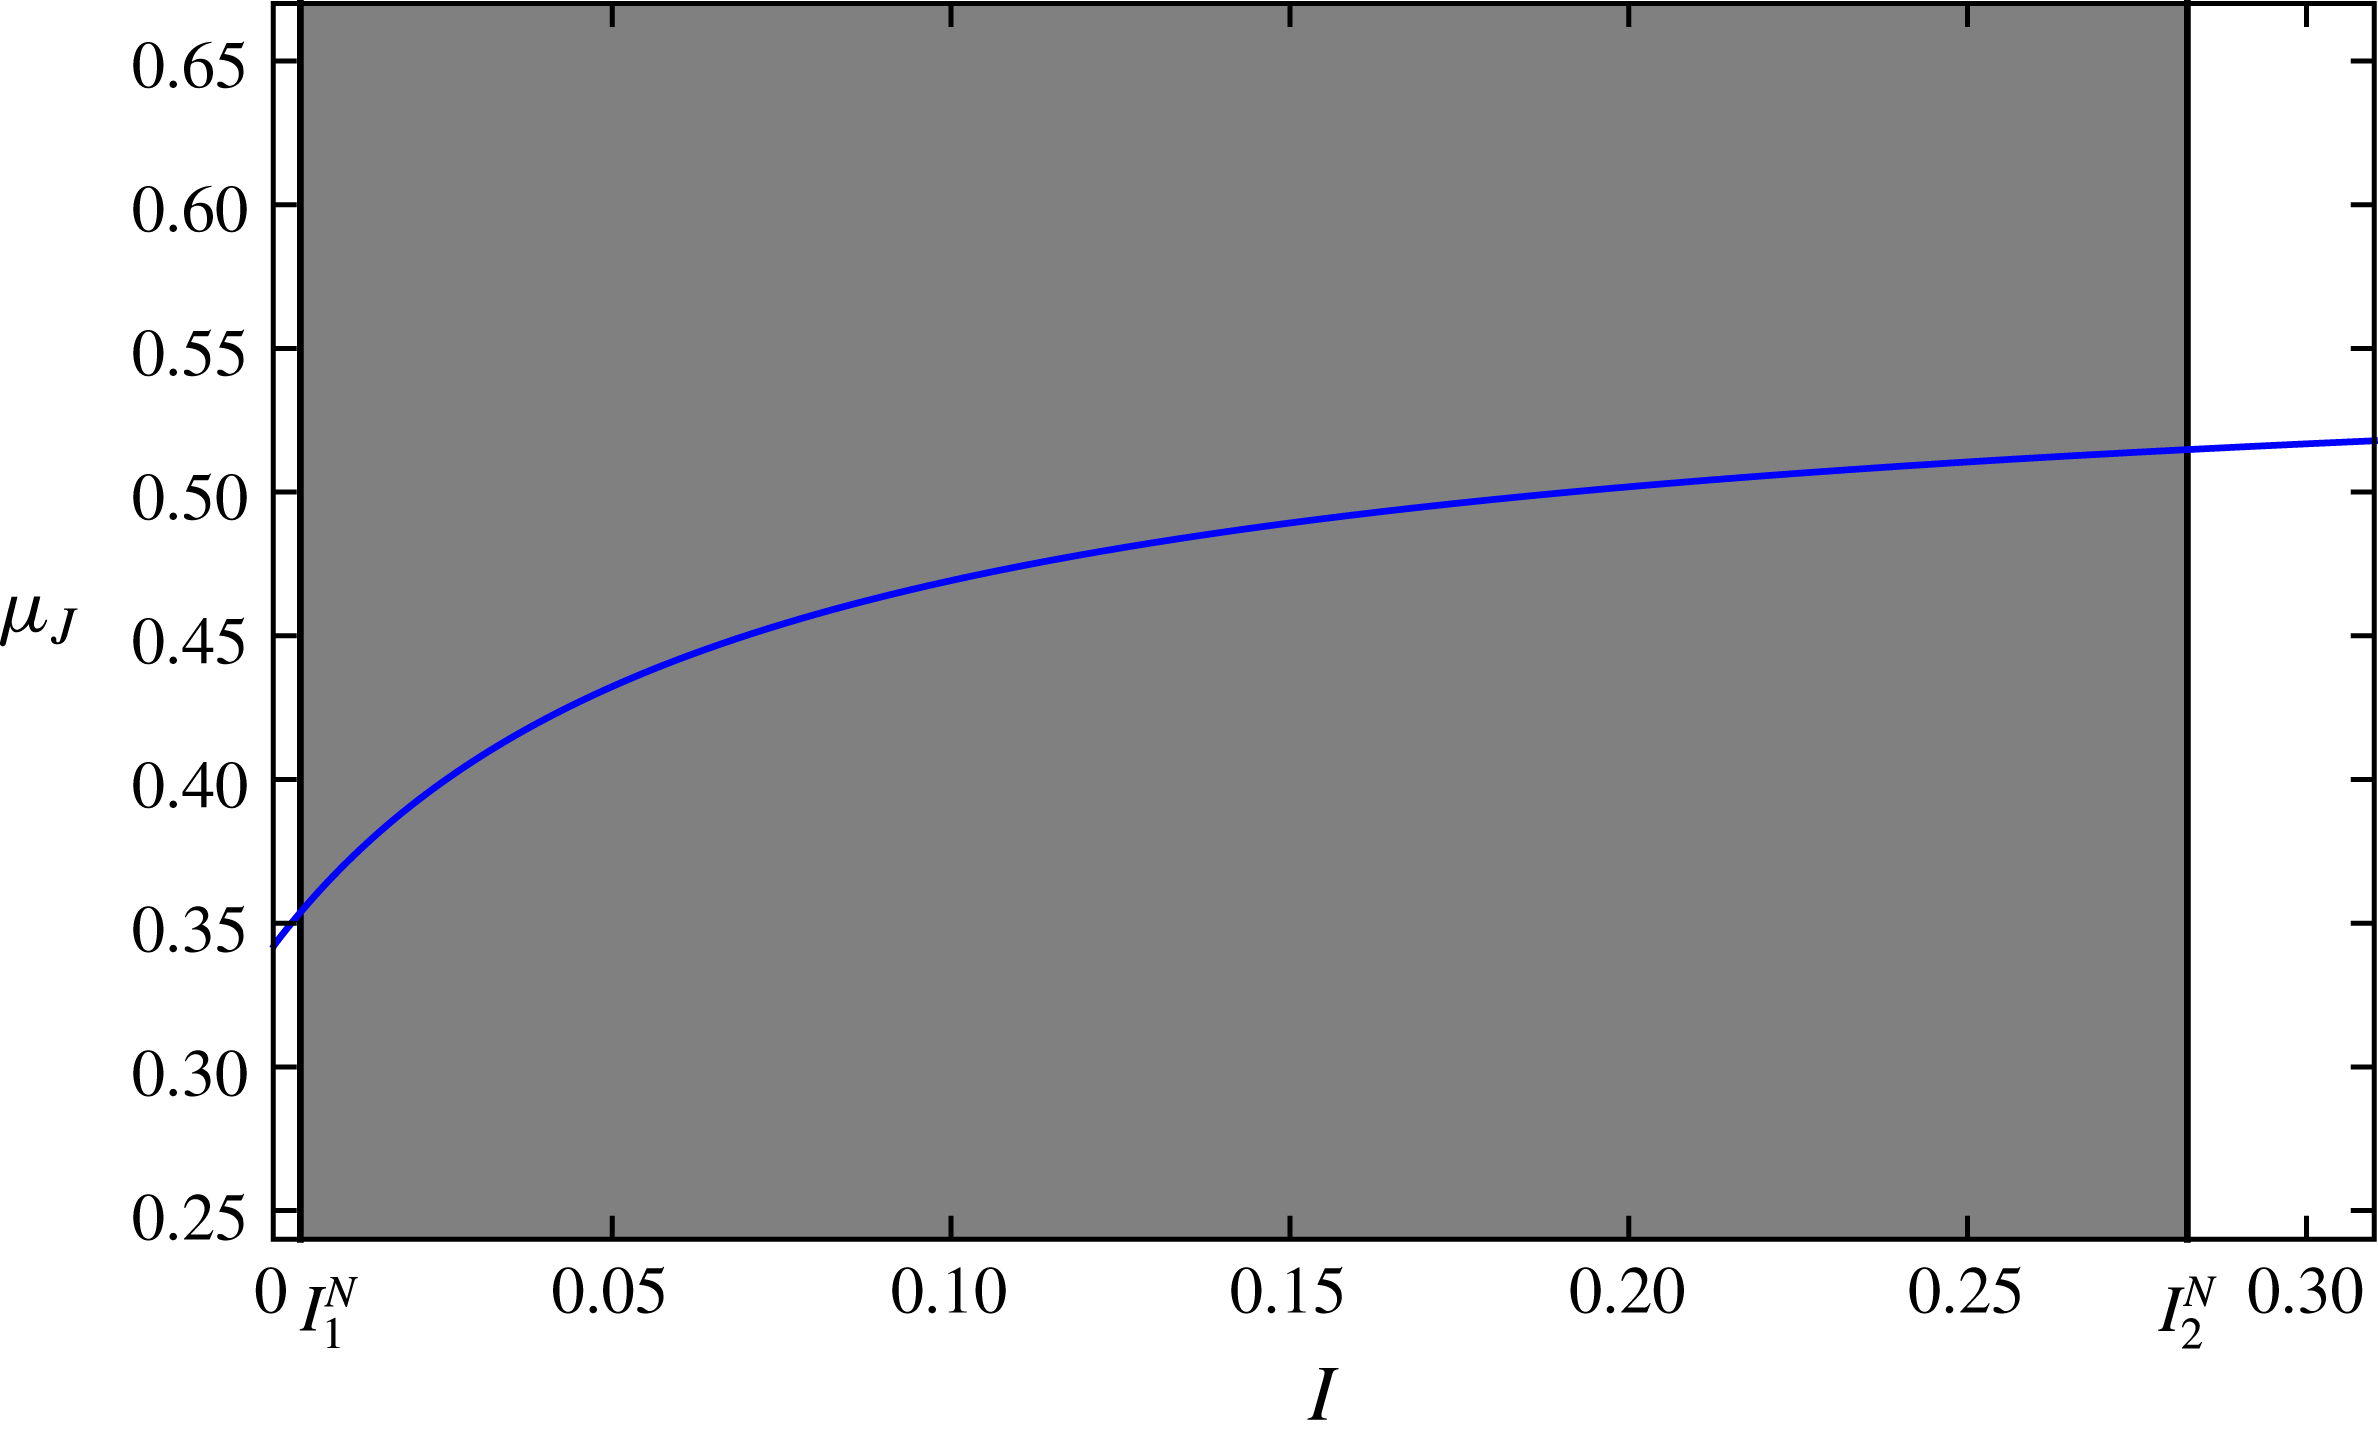
A stability diagram for the
 $\unicode[STIX]{x1D707}(I)$
-rheology of Jop et al. (Reference Jop, Forterre and Pouliquen2005) with the friction coefficient values in blue for the parameters in table 1. The grey region is the range of inertial numbers for which the equations are well posed whereas inertial numbers in the white regions mean that the equations are ill posed. Vertical lines denote the neutral stability inertial numbers
$\unicode[STIX]{x1D707}(I)$
-rheology of Jop et al. (Reference Jop, Forterre and Pouliquen2005) with the friction coefficient values in blue for the parameters in table 1. The grey region is the range of inertial numbers for which the equations are well posed whereas inertial numbers in the white regions mean that the equations are ill posed. Vertical lines denote the neutral stability inertial numbers
 $I_{1,2}^{N}$
.
$I_{1,2}^{N}$
.
Parameter values measured for the spherical glass ballotini used for the experiments in this paper. Unless specified otherwise these values are used throughout the paper.
Substituting the functional form (2.12) of the
 $\unicode[STIX]{x1D707}(I)$
-rheology proposed by Jop et al. (Reference Jop, Forterre and Pouliquen2005) into the function (3.9) reveals that the equations are ill posed when the inertial number is too high or too low. For the range
$\unicode[STIX]{x1D707}(I)$
-rheology proposed by Jop et al. (Reference Jop, Forterre and Pouliquen2005) into the function (3.9) reveals that the equations are ill posed when the inertial number is too high or too low. For the range
 $I_{1}^{N}\leqslant I\leqslant I_{2}^{N}$
the equations are well posed, provided that the difference between friction constants
$I_{1}^{N}\leqslant I\leqslant I_{2}^{N}$
the equations are well posed, provided that the difference between friction constants
 $\unicode[STIX]{x0394}\unicode[STIX]{x1D707}=\unicode[STIX]{x1D707}_{d}-\unicode[STIX]{x1D707}_{s}$
is sufficiently large. Here the values
$\unicode[STIX]{x0394}\unicode[STIX]{x1D707}=\unicode[STIX]{x1D707}_{d}-\unicode[STIX]{x1D707}_{s}$
is sufficiently large. Here the values
 $I_{1,2}^{N}$
are defined as the neutral inertial numbers such that
$I_{1,2}^{N}$
are defined as the neutral inertial numbers such that
 $C(I_{1,2}^{N})=0$
and are specific to the chosen
$C(I_{1,2}^{N})=0$
and are specific to the chosen
 $\unicode[STIX]{x1D707}(I)$
curve. Figure 1 shows the range of well-posed inertial numbers along with the
$\unicode[STIX]{x1D707}(I)$
curve. Figure 1 shows the range of well-posed inertial numbers along with the
 $\unicode[STIX]{x1D707}(I)$
curve of Jop et al. (Reference Jop, Forterre and Pouliquen2005). As discussed in § 1 additional physical effects become important in the high and low inertial number limits. It is therefore interesting that the limited range of well-posed inertial numbers is coincidental with the range of regimes expected to be physically realistic. When
$\unicode[STIX]{x1D707}(I)$
curve of Jop et al. (Reference Jop, Forterre and Pouliquen2005). As discussed in § 1 additional physical effects become important in the high and low inertial number limits. It is therefore interesting that the limited range of well-posed inertial numbers is coincidental with the range of regimes expected to be physically realistic. When
 $\unicode[STIX]{x0394}\unicode[STIX]{x1D707}=0$
the friction coefficient is a constant and so the result of Schaeffer (Reference Schaeffer1987), that the Drucker–Prager equations are always ill posed, is also recovered.
$\unicode[STIX]{x0394}\unicode[STIX]{x1D707}=0$
the friction coefficient is a constant and so the result of Schaeffer (Reference Schaeffer1987), that the Drucker–Prager equations are always ill posed, is also recovered.
Many flows of practical interest have regions for which the inertial number lies in the ill-posed ranges. Purely static material when
 $I=0$
and regions of large deformation are most likely to be ill posed. As shown in Barker et al. (Reference Barker, Schaeffer, Bohorquez and Gray2015), steady uniform flow on an inclined frictional plane has a constant inertial number
$I=0$
and regions of large deformation are most likely to be ill posed. As shown in Barker et al. (Reference Barker, Schaeffer, Bohorquez and Gray2015), steady uniform flow on an inclined frictional plane has a constant inertial number
 $I_{\unicode[STIX]{x1D701}}$
that is dependent on the inclination angle
$I_{\unicode[STIX]{x1D701}}$
that is dependent on the inclination angle
 $\unicode[STIX]{x1D701}$
. For slope angles that give inertial numbers in the well-posed range, numerical computations converge on the exact Bagnold solution of velocity and pressure. Barker et al. (Reference Barker, Schaeffer, Bohorquez and Gray2015) also demonstrated that for angles in the ill-posed ranges there is no convergence towards the steady state and instead pressure and velocity perturbations appear spontaneously and dominate the numerical solution. When the numerical grid is refined, the perturbations form more quickly and have a shorter wavelength which is the hallmark of ill posedness.
$\unicode[STIX]{x1D701}$
. For slope angles that give inertial numbers in the well-posed range, numerical computations converge on the exact Bagnold solution of velocity and pressure. Barker et al. (Reference Barker, Schaeffer, Bohorquez and Gray2015) also demonstrated that for angles in the ill-posed ranges there is no convergence towards the steady state and instead pressure and velocity perturbations appear spontaneously and dominate the numerical solution. When the numerical grid is refined, the perturbations form more quickly and have a shorter wavelength which is the hallmark of ill posedness.
Flows of higher complexity may have some regions in the well-posed and others in the ill-posed regimes. For example, Lagrée et al. (Reference Lagrée, Staron and Popinet2011) simulated the collapse of a column of grains which has a central core that is approximately static and thin layers close to the surface where the strain rate and thus the inertial number are very high. It is thought that the success of their computation is due to the finite spatial resolution used and a short computation time. Furthermore, the granular viscosity was truncated such that it saturated to constant values when the expression (2.11) was too high or too low. It is conceivable that in the regions of the flow with ill-posed inertial numbers, the code reverted to solving the classical Navier–Stokes equations with a constant Newtonian viscosity, which are well posed. Unfortunately this form of regularisation is not guaranteed to avoid ill posedness as the magnitude of the viscosity is not a direct indication of the inertial number and therefore is not able to determine if a region is ill posed or well posed.
4 Theoretical well-posed
$\unicode[STIX]{x1D707}(I)$
curves

The condition for ill posedness (3.7) depends on the value and gradient of
 $\unicode[STIX]{x1D707}(I)$
. By changing the shape of the
$\unicode[STIX]{x1D707}(I)$
. By changing the shape of the
 $\unicode[STIX]{x1D707}(I)$
curve it is therefore possible to change the functional dependence of
$\unicode[STIX]{x1D707}(I)$
curve it is therefore possible to change the functional dependence of
 $C(I)$
and alter the range of well-posed inertial numbers. As the
$C(I)$
and alter the range of well-posed inertial numbers. As the
 $\unicode[STIX]{x1D707}(I)$
curve of Jop et al. (Reference Jop, Forterre and Pouliquen2005) has experimental validation in the intermediate inertial number region, which has been found to be well posed, the analysis here will focus on the high and low inertial number limits.
$\unicode[STIX]{x1D707}(I)$
curve of Jop et al. (Reference Jop, Forterre and Pouliquen2005) has experimental validation in the intermediate inertial number region, which has been found to be well posed, the analysis here will focus on the high and low inertial number limits.
The structure of
 $C(I)$
determines some important features that
$C(I)$
determines some important features that
 $\unicode[STIX]{x1D707}(I)$
curves must have in order to remain well posed. Firstly, well-posed behaviour relies on the only negative term in (3.9) being sufficiently large. Since this term scales with the gradient of
$\unicode[STIX]{x1D707}(I)$
curves must have in order to remain well posed. Firstly, well-posed behaviour relies on the only negative term in (3.9) being sufficiently large. Since this term scales with the gradient of
 $\unicode[STIX]{x1D707}$
, only monotonically increasing (
$\unicode[STIX]{x1D707}$
, only monotonically increasing (
 $\unicode[STIX]{x1D707}^{\prime }>0$
) functions are possible. Secondly, small inertial numbers are considered using the Taylor series
$\unicode[STIX]{x1D707}^{\prime }>0$
) functions are possible. Secondly, small inertial numbers are considered using the Taylor series
 $\unicode[STIX]{x1D707}(I)=A_{0}+A_{1}I+A_{2}I^{2}+\cdots \,$
with
$\unicode[STIX]{x1D707}(I)=A_{0}+A_{1}I+A_{2}I^{2}+\cdots \,$
with
 $A_{0}\neq 0$
to reveal that
$A_{0}\neq 0$
to reveal that
 $$\begin{eqnarray}\lim _{I\rightarrow 0}C(I)\rightarrow A_{0}^{2}.\end{eqnarray}$$
Well posedness is then only possible for
 $\unicode[STIX]{x1D707}=0$
at
$\unicode[STIX]{x1D707}=0$
at
 $I=0$
, however this contradicts the form of the series as
$I=0$
, however this contradicts the form of the series as
 $A_{0}=0$
. Taking instead
$A_{0}=0$
. Taking instead
 $\unicode[STIX]{x1D707}(I)=\sum _{k=n}^{\infty }A_{k}I^{k}$
, the limit (4.1) gives
$\unicode[STIX]{x1D707}(I)=\sum _{k=n}^{\infty }A_{k}I^{k}$
, the limit (4.1) gives
 $C\rightarrow 4n(n-1)$
so
$C\rightarrow 4n(n-1)$
so
 $\unicode[STIX]{x1D707}(I)=A_{1}I$
is the only well-posed curve in the low inertial number limit. Interestingly this linear expression for
$\unicode[STIX]{x1D707}(I)=A_{1}I$
is the only well-posed curve in the low inertial number limit. Interestingly this linear expression for
 $\unicode[STIX]{x1D707}(I)$
removes the singularity in the granular viscosity (2.11) at
$\unicode[STIX]{x1D707}(I)$
removes the singularity in the granular viscosity (2.11) at
 $\Vert \unicode[STIX]{x1D63F}\Vert =0$
and gives instead
$\Vert \unicode[STIX]{x1D63F}\Vert =0$
and gives instead
 $\unicode[STIX]{x1D702}_{g}=A_{1}d\sqrt{\unicode[STIX]{x1D70C}_{\ast }p}$
. Finally, in the high inertial number limit, the increasing nature of
$\unicode[STIX]{x1D702}_{g}=A_{1}d\sqrt{\unicode[STIX]{x1D70C}_{\ast }p}$
. Finally, in the high inertial number limit, the increasing nature of
 $\unicode[STIX]{x1D707}(I)$
ensures that there exists a finite value of
$\unicode[STIX]{x1D707}(I)$
ensures that there exists a finite value of
 $I$
above which the condition for ill posedness (3.7) is always satisfied. Either
$I$
above which the condition for ill posedness (3.7) is always satisfied. Either
 $C$
will be unbounded and scale with
$C$
will be unbounded and scale with
 $\unicode[STIX]{x1D707}^{2}$
or, for the special case that
$\unicode[STIX]{x1D707}^{2}$
or, for the special case that
 $I\unicode[STIX]{x1D707}^{\prime }/(2\unicode[STIX]{x1D707})=1$
, the limit will give
$I\unicode[STIX]{x1D707}^{\prime }/(2\unicode[STIX]{x1D707})=1$
, the limit will give
 $C=8$
. It is therefore the case that any
$C=8$
. It is therefore the case that any
 $\unicode[STIX]{x1D707}(I)$
curve is guaranteed to lead to ill-posed equations for very large inertial numbers.
$\unicode[STIX]{x1D707}(I)$
curve is guaranteed to lead to ill-posed equations for very large inertial numbers.
Given these limitations it is also useful to consider the regions for which well-posed rheologies can be constructed. This is done by solving for the neutral stability curves
 $C=0$
and considering the sign of
$C=0$
and considering the sign of
 $C$
in the enclosed regions. Setting
$C$
in the enclosed regions. Setting
 $C=0$
in (3.9) gives the ordinary differential equation
$C=0$
in (3.9) gives the ordinary differential equation
 $$\begin{eqnarray}\frac{\text{d}\unicode[STIX]{x1D707}}{\text{d}I}=\frac{1}{I}\frac{\unicode[STIX]{x1D707}}{16+\unicode[STIX]{x1D707}^{2}}\left(8+2\unicode[STIX]{x1D707}^{2}\pm 4\sqrt{4-2\unicode[STIX]{x1D707}^{2}}\right),\end{eqnarray}$$
which is a separable equation with two solutions. It is most convenient to write the solutions as inverse functions for the neutral stability inertial number
 $I^{N}=I^{N}(\unicode[STIX]{x1D707})$
. The two branches then give
$I^{N}=I^{N}(\unicode[STIX]{x1D707})$
. The two branches then give
 $$\begin{eqnarray}I_{\pm }^{N}=A_{\pm }\exp \left[f_{\pm }(\unicode[STIX]{x1D707})\right],\end{eqnarray}$$
where
 $A_{\pm }$
are constants and
$A_{\pm }$
are constants and
 $$\begin{eqnarray}\displaystyle & \displaystyle f_{+}=\frac{\sqrt{4-2\unicode[STIX]{x1D707}^{2}}}{2\unicode[STIX]{x1D707}^{2}}+\ln (\unicode[STIX]{x1D707})-\frac{1}{2}\ln \left(\sqrt{4-2\unicode[STIX]{x1D707}^{2}}+2\right)-\frac{1}{\unicode[STIX]{x1D707}^{2}}, & \displaystyle\end{eqnarray}$$
 $$\begin{eqnarray}\displaystyle & \displaystyle f_{-}=-\frac{\sqrt{4-2\unicode[STIX]{x1D707}^{2}}}{2\unicode[STIX]{x1D707}^{2}}+\frac{1}{2}\ln \left(\sqrt{4-2\unicode[STIX]{x1D707}^{2}}+2\right)-\frac{1}{\unicode[STIX]{x1D707}^{2}}. & \displaystyle\end{eqnarray}$$
The constants
 $A_{\pm }$
can be found by choosing an inertial number and corresponding friction coefficient and substituting them into (4.3). Here it is assumed that the Jop et al. (Reference Jop, Forterre and Pouliquen2005) rheology is correct in the well-posed range so the point
$A_{\pm }$
can be found by choosing an inertial number and corresponding friction coefficient and substituting them into (4.3). Here it is assumed that the Jop et al. (Reference Jop, Forterre and Pouliquen2005) rheology is correct in the well-posed range so the point
 $I_{1}^{N}$
is used to study the low inertial number range and
$I_{1}^{N}$
is used to study the low inertial number range and
 $I_{2}^{N}$
is used for high inertial numbers. Interestingly
$I_{2}^{N}$
is used for high inertial numbers. Interestingly
 $f_{\pm }$
become complex for
$f_{\pm }$
become complex for
 $\unicode[STIX]{x1D707}>\sqrt{2}$
so
$\unicode[STIX]{x1D707}>\sqrt{2}$
so
 $\unicode[STIX]{x1D707}=\sqrt{2}$
is the largest possible friction coefficient and
$\unicode[STIX]{x1D707}=\sqrt{2}$
is the largest possible friction coefficient and
 $I_{max}=\sqrt{2}I_{2}^{N}\exp (-f_{-}(\unicode[STIX]{x1D707}(I_{2}^{N}))-1/2)$
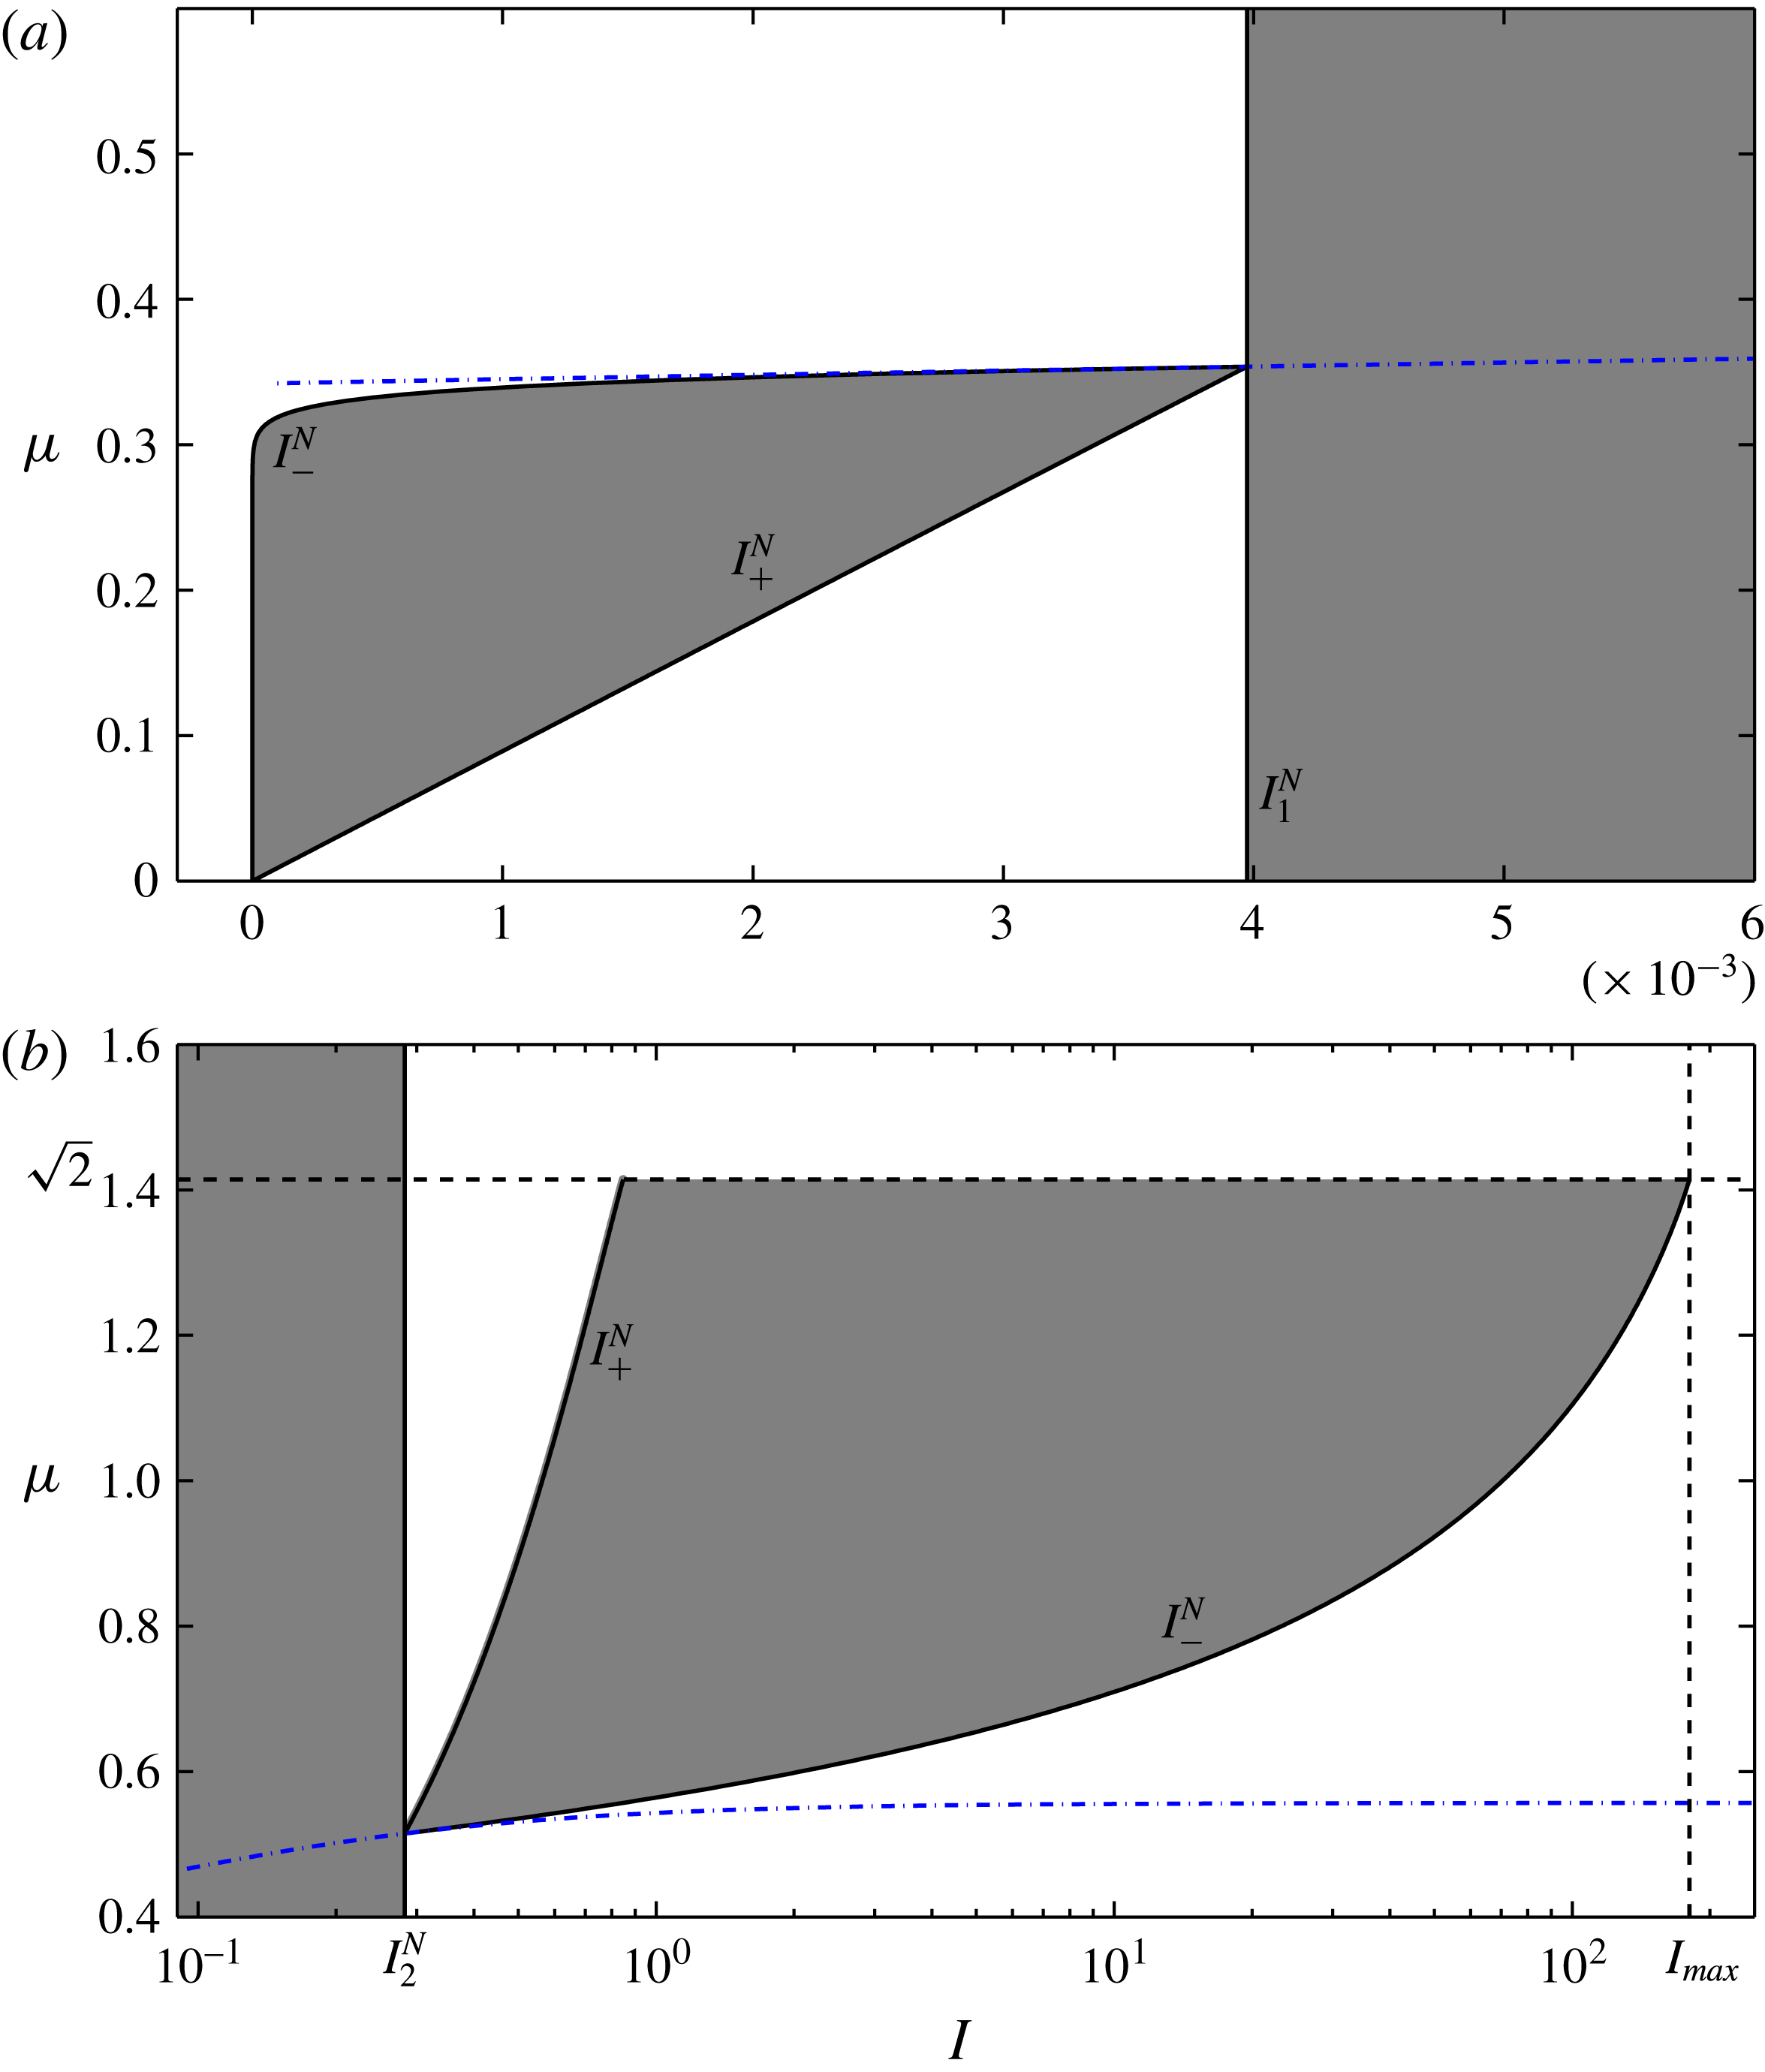
is the largest possible inertial number. As shown in figure 2, well-posed regions exist for both the low and high inertial number limits. For small inertial numbers it is found that lower values of
$I_{max}=\sqrt{2}I_{2}^{N}\exp (-f_{-}(\unicode[STIX]{x1D707}(I_{2}^{N}))-1/2)$
is the largest possible inertial number. As shown in figure 2, well-posed regions exist for both the low and high inertial number limits. For small inertial numbers it is found that lower values of
 $\unicode[STIX]{x1D707}$
are required than those predicted by the rheology of Jop et al. (Reference Jop, Forterre and Pouliquen2005) and that
$\unicode[STIX]{x1D707}$
are required than those predicted by the rheology of Jop et al. (Reference Jop, Forterre and Pouliquen2005) and that
 $\unicode[STIX]{x1D707}=0$
when
$\unicode[STIX]{x1D707}=0$
when
 $I=0$
, as was highlighted by analysis of (3.9). Conversely, larger values are required for well-posed curves in the high inertial number limit. It should be noted that not every curve passing through the grey regions in the figure is guaranteed to remain well posed. As has been discussed, there are additional restrictions on the choice of rheology, such as the condition that the
$I=0$
, as was highlighted by analysis of (3.9). Conversely, larger values are required for well-posed curves in the high inertial number limit. It should be noted that not every curve passing through the grey regions in the figure is guaranteed to remain well posed. As has been discussed, there are additional restrictions on the choice of rheology, such as the condition that the
 $\unicode[STIX]{x1D707}(I)$
curve should be monotonically increasing.
$\unicode[STIX]{x1D707}(I)$
curve should be monotonically increasing.
Stability diagrams for low (a) and high (b) inertial number ranges. The curves
 $I_{+}^{N}$
and
$I_{+}^{N}$
and
 $I_{-}^{N}$
from (4.3) separate the grey regions for which well-posed
$I_{-}^{N}$
from (4.3) separate the grey regions for which well-posed
 $\unicode[STIX]{x1D707}(I)$
curves exist and the white regions where all curves give ill-posed equations. Blue dot-dashed lines are the
$\unicode[STIX]{x1D707}(I)$
curves exist and the white regions where all curves give ill-posed equations. Blue dot-dashed lines are the
 $\unicode[STIX]{x1D707}(I)$
curve of Jop et al. (Reference Jop, Forterre and Pouliquen2005). The semi-logarithmic plot (b) of the high inertial number range shows dashed lines at which the solutions become complex. These correspond to the maximum values of the friction coefficient
$\unicode[STIX]{x1D707}(I)$
curve of Jop et al. (Reference Jop, Forterre and Pouliquen2005). The semi-logarithmic plot (b) of the high inertial number range shows dashed lines at which the solutions become complex. These correspond to the maximum values of the friction coefficient
 $\unicode[STIX]{x1D707}=\sqrt{2}$
and inertial number
$\unicode[STIX]{x1D707}=\sqrt{2}$
and inertial number
 $I=I_{max}$
.
$I=I_{max}$
.
5 The low inertial number limit
5.1 Choice of
$\unicode[STIX]{x1D707}(I)$
curve for low-
$I$


The regions for which well-posed
 $\unicode[STIX]{x1D707}(I)$
curves exist are not unexpected, there are examples in the literature of alternative forms for the curve which have similar features. Kamrin & Koval (Reference Kamrin and Koval2014) performed discrete element method (DEM) simulations for slowly sheared flows and found that a good fit to the local terms in their equations was
$\unicode[STIX]{x1D707}(I)$
curves exist are not unexpected, there are examples in the literature of alternative forms for the curve which have similar features. Kamrin & Koval (Reference Kamrin and Koval2014) performed discrete element method (DEM) simulations for slowly sheared flows and found that a good fit to the local terms in their equations was
 $$\begin{eqnarray}\unicode[STIX]{x1D707}_{K}(I)=\unicode[STIX]{x1D707}_{s}+bI+(\unicode[STIX]{x1D707}_{0}-\unicode[STIX]{x1D707}_{s})\exp (-I/c_{K}),\end{eqnarray}$$
where
 $c_{K}$
is a material parameter,
$c_{K}$
is a material parameter,
 $b=\unicode[STIX]{x0394}\unicode[STIX]{x1D707}/I_{0}$
and
$b=\unicode[STIX]{x0394}\unicode[STIX]{x1D707}/I_{0}$
and
 $\unicode[STIX]{x1D707}_{0}$
is the value of the friction coefficient when
$\unicode[STIX]{x1D707}_{0}$
is the value of the friction coefficient when
 $I=0$
. Their addition of a decaying exponential term to a linearised form of the Jop et al. (Reference Jop, Forterre and Pouliquen2005) curve (2.12) means that when
$I=0$
. Their addition of a decaying exponential term to a linearised form of the Jop et al. (Reference Jop, Forterre and Pouliquen2005) curve (2.12) means that when
 $I$
is small the gradient is larger and the value of
$I$
is small the gradient is larger and the value of
 $\unicode[STIX]{x1D707}$
is lower. Substitution of (5.1) into (3.9) reveals that this rheology expands the range of well-posed inertial numbers, but still becomes ill posed when
$\unicode[STIX]{x1D707}$
is lower. Substitution of (5.1) into (3.9) reveals that this rheology expands the range of well-posed inertial numbers, but still becomes ill posed when
 $I$
is very small. This is partly due to the fact that
$I$
is very small. This is partly due to the fact that
 $\unicode[STIX]{x1D707}_{K}\rightarrow \unicode[STIX]{x1D707}_{0}$
in the limit
$\unicode[STIX]{x1D707}_{K}\rightarrow \unicode[STIX]{x1D707}_{0}$
in the limit
 $I\rightarrow 0$
where instead, as discussed in § 4, the friction coefficient must tend to zero in the low inertial number limit to ensure well posedness.
$I\rightarrow 0$
where instead, as discussed in § 4, the friction coefficient must tend to zero in the low inertial number limit to ensure well posedness.
A well-posed
 $\unicode[STIX]{x1D707}(I)$
curve can be constructed that is inspired by the neutral stability curves. As shown in figure 2(a), the
$\unicode[STIX]{x1D707}(I)$
curve can be constructed that is inspired by the neutral stability curves. As shown in figure 2(a), the
 $I_{-}^{N}$
curve is as close as possible to the rheology of Jop et al. (Reference Jop, Forterre and Pouliquen2005). In the limit
$I_{-}^{N}$
curve is as close as possible to the rheology of Jop et al. (Reference Jop, Forterre and Pouliquen2005). In the limit
 $\unicode[STIX]{x1D707}\rightarrow 0$
the neutral stability inertial number (4.3) tends to
$\unicode[STIX]{x1D707}\rightarrow 0$
the neutral stability inertial number (4.3) tends to
 $A_{-}\exp (-2/\unicode[STIX]{x1D707}^{2})$
. Unlike the general forms of the neutral stability curves, this expression can be inverted to give a
$A_{-}\exp (-2/\unicode[STIX]{x1D707}^{2})$
. Unlike the general forms of the neutral stability curves, this expression can be inverted to give a
 $\unicode[STIX]{x1D707}(I)$
curve. As this curve is derived from the neutral stability line, it will have
$\unicode[STIX]{x1D707}(I)$
curve. As this curve is derived from the neutral stability line, it will have
 $C=0$
in the low inertial number limit by definition. By scaling the function it is possible to ensure that
$C=0$
in the low inertial number limit by definition. By scaling the function it is possible to ensure that
 $C<0$
instead. Swapping the factor of 2 for a constant
$C<0$
instead. Swapping the factor of 2 for a constant
 $\unicode[STIX]{x1D6FC}\lesssim 2$
the form
$\unicode[STIX]{x1D6FC}\lesssim 2$
the form
 $$\begin{eqnarray}\unicode[STIX]{x1D707}(I)=\left\{\begin{array}{@{}lr@{}}\sqrt{\displaystyle \frac{\unicode[STIX]{x1D6FC}}{ ln\displaystyle \left(\frac{A_{-}}{I}\right)}} & I\leqslant I_{1}^{N}\\ \unicode[STIX]{x1D707}_{J}(I) & I>I_{1}^{N},\end{array}\right.\end{eqnarray}$$
is found to give well posedness. The coefficient
 $A_{-}$
is then chosen to ensure a match between the two branches at
$A_{-}$
is then chosen to ensure a match between the two branches at
 $I=I_{1}^{N}$
i.e.
$I=I_{1}^{N}$
i.e.
 $$\begin{eqnarray}A_{-}=I_{1}^{N}\exp \left(\frac{\unicode[STIX]{x1D6FC}}{\unicode[STIX]{x1D707}_{J}\left(I_{1}^{N}\right)^{2}}\right).\end{eqnarray}$$
The strength of (5.2) is that the equations are guaranteed to remain well posed for
 $0<I<I_{2}^{N}$
provided that
$0<I<I_{2}^{N}$
provided that
 $\unicode[STIX]{x1D6FC}$
(the only additional fitting parameter) is close to, and less than, 2. Furthermore, the formulation is applicable to any intermediate rheology by simply swapping
$\unicode[STIX]{x1D6FC}$
(the only additional fitting parameter) is close to, and less than, 2. Furthermore, the formulation is applicable to any intermediate rheology by simply swapping
 $\unicode[STIX]{x1D707}_{J}$
(and the related
$\unicode[STIX]{x1D707}_{J}$
(and the related
 $I_{1}^{N}$
) in (5.2) and (5.3). For example the local terms suggested by Kamrin & Koval (Reference Kamrin and Koval2014) can be incorporated by substituting (5.1) for
$I_{1}^{N}$
) in (5.2) and (5.3). For example the local terms suggested by Kamrin & Koval (Reference Kamrin and Koval2014) can be incorporated by substituting (5.1) for
 $\unicode[STIX]{x1D707}_{J}$
. This would therefore mean that solutions of the resultant equations would provide a better fit to the DEM data for the range of inertial numbers that Kamrin & Koval (Reference Kamrin and Koval2014) found a local response, and a disagreement with the
$\unicode[STIX]{x1D707}_{J}$
. This would therefore mean that solutions of the resultant equations would provide a better fit to the DEM data for the range of inertial numbers that Kamrin & Koval (Reference Kamrin and Koval2014) found a local response, and a disagreement with the
 $\unicode[STIX]{x1D707}(I)$
curve of Jop et al. (Reference Jop, Forterre and Pouliquen2005). Similarly, other future work could be incorporated in an analogous way.
$\unicode[STIX]{x1D707}(I)$
curve of Jop et al. (Reference Jop, Forterre and Pouliquen2005). Similarly, other future work could be incorporated in an analogous way.
5.2 Decelerating chute flows
One issue that has plagued the continuum modelling of granular flow for a substantial time is the treatment of static material. For the rheology of Jop et al. (Reference Jop, Forterre and Pouliquen2005) the material is defined to be static at
 $\unicode[STIX]{x1D707}=\unicode[STIX]{x1D707}_{s}$
and for
$\unicode[STIX]{x1D707}=\unicode[STIX]{x1D707}_{s}$
and for
 $\unicode[STIX]{x1D707}<\unicode[STIX]{x1D707}_{s}$
inversion of
$\unicode[STIX]{x1D707}<\unicode[STIX]{x1D707}_{s}$
inversion of
 $\unicode[STIX]{x1D707}_{J}(I)$
gives negative inertial numbers. The regularised rheology (5.2) does not share these features and instead forces
$\unicode[STIX]{x1D707}_{J}(I)$
gives negative inertial numbers. The regularised rheology (5.2) does not share these features and instead forces
 $I$
to be strictly positive. Due to the definition (2.11) of the granular viscosity, the unregularised
$I$
to be strictly positive. Due to the definition (2.11) of the granular viscosity, the unregularised
 $\unicode[STIX]{x1D707}(I)$
curve has a singular viscosity in the limit
$\unicode[STIX]{x1D707}(I)$
curve has a singular viscosity in the limit
 $I\rightarrow 0$
. Numerically this singular behaviour allows computations to mimic static material by predicting velocities that are very small when
$I\rightarrow 0$
. Numerically this singular behaviour allows computations to mimic static material by predicting velocities that are very small when
 $I$
is low. Unfortunately the rheology of Jop et al. (Reference Jop, Forterre and Pouliquen2005) is ill posed in these regimes. It is therefore important to demonstrate the effects of this ill posedness and confirm that it is not present in calculations performed with the regularised rheology.
$I$
is low. Unfortunately the rheology of Jop et al. (Reference Jop, Forterre and Pouliquen2005) is ill posed in these regimes. It is therefore important to demonstrate the effects of this ill posedness and confirm that it is not present in calculations performed with the regularised rheology.
Here computations of inclined plane flow are presented, where initially the material is at steady state with inclination angle
 $\unicode[STIX]{x1D701}_{0}$
where
$\unicode[STIX]{x1D701}_{0}$
where
 $\unicode[STIX]{x1D701}_{s}<\unicode[STIX]{x1D701}_{0}<\unicode[STIX]{x1D701}_{d}$
. For slopes inclined at angle
$\unicode[STIX]{x1D701}_{s}<\unicode[STIX]{x1D701}_{0}<\unicode[STIX]{x1D701}_{d}$
. For slopes inclined at angle
 $\unicode[STIX]{x1D701}$
with no slip
$\unicode[STIX]{x1D701}$
with no slip
 $u=0$
at the base
$u=0$
at the base
 $z=0$
of the flow and a vanishing stress at the surface
$z=0$
of the flow and a vanishing stress at the surface
 $z=h_{0}$
, the
$z=h_{0}$
, the
 $z$
component of the momentum balance equation (2.10) gives a hydrostatic pressure
$z$
component of the momentum balance equation (2.10) gives a hydrostatic pressure
 $$\begin{eqnarray}p(z)=\unicode[STIX]{x1D70C}_{\ast }\unicode[STIX]{x1D719}g(h_{0}-z)\cos \unicode[STIX]{x1D701},\end{eqnarray}$$
and the downslope
 $x$
component gives
$x$
component gives
 $\unicode[STIX]{x1D707}=\tan \unicode[STIX]{x1D701}$
. As
$\unicode[STIX]{x1D707}=\tan \unicode[STIX]{x1D701}$
. As
 $\unicode[STIX]{x1D707}$
is a constant, the inertial number must also be a constant
$\unicode[STIX]{x1D707}$
is a constant, the inertial number must also be a constant
 $I_{\unicode[STIX]{x1D701}}=\unicode[STIX]{x1D707}^{-1}(\tan \unicode[STIX]{x1D701})$
. From the definition of the inertial number (2.8) and the definition of the strain-rate tensor (2.7), the velocity is found to be
$I_{\unicode[STIX]{x1D701}}=\unicode[STIX]{x1D707}^{-1}(\tan \unicode[STIX]{x1D701})$
. From the definition of the inertial number (2.8) and the definition of the strain-rate tensor (2.7), the velocity is found to be
 $$\begin{eqnarray}u(z)=\frac{2I_{\unicode[STIX]{x1D701}}}{3d}\sqrt{\unicode[STIX]{x1D719}g\cos \unicode[STIX]{x1D701}}\left(h_{0}^{3/2}-(h_{0}-z)^{3/2}\right),\end{eqnarray}$$
which is known as Bagnold’s velocity profile (see e.g. GDR MiDi 2004; Gray & Edwards Reference Gray and Edwards2014). The simulation is therefore initialised with this exact solution with
 $\unicode[STIX]{x1D701}=\unicode[STIX]{x1D701}_{0}$
.
$\unicode[STIX]{x1D701}=\unicode[STIX]{x1D701}_{0}$
.
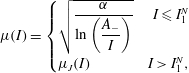
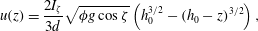
Downslope averages of the velocity (a) and the inertial number (b) at evenly spaced times in
 $0<t<0.2~\text{s}$
. Here the computation is initialised with the Bagnold solution (5.4) and (5.5) with
$0<t<0.2~\text{s}$
. Here the computation is initialised with the Bagnold solution (5.4) and (5.5) with
 $\unicode[STIX]{x1D701}_{0}=24^{\circ }$
and the fields are computed with the Jop et al. (Reference Jop, Forterre and Pouliquen2005) rheology (2.12). The slope angle during the computation is
$\unicode[STIX]{x1D701}_{0}=24^{\circ }$
and the fields are computed with the Jop et al. (Reference Jop, Forterre and Pouliquen2005) rheology (2.12). The slope angle during the computation is
 $\unicode[STIX]{x1D701}=10^{\circ }$
and the numerical grid is
$\unicode[STIX]{x1D701}=10^{\circ }$
and the numerical grid is
 $256\times 256$
cells with a time step
$256\times 256$
cells with a time step
 $1\times 10^{-6}~\text{s}$
.
$1\times 10^{-6}~\text{s}$
.
By instantaneously changing the inclination angle to
 $\unicode[STIX]{x1D701}<\unicode[STIX]{x1D701}_{s}$
at
$\unicode[STIX]{x1D701}<\unicode[STIX]{x1D701}_{s}$
at
 $t=0$
the granular flow will decelerate and the behaviour as
$t=0$
the granular flow will decelerate and the behaviour as
 $I\rightarrow 0$
can be studied. This set-up was explored previously by Parez et al. (Reference Parez, Aharonov and Toussaint2016) who compared DEM data with an approximate transient solution derived from a linearised
$I\rightarrow 0$
can be studied. This set-up was explored previously by Parez et al. (Reference Parez, Aharonov and Toussaint2016) who compared DEM data with an approximate transient solution derived from a linearised
 $\unicode[STIX]{x1D707}(I)$
-rheology. Here the numerical scheme developed in Barker et al. (Reference Barker, Schaeffer, Bohorquez and Gray2015), which allows for the transient computation of two-dimensional chute flows with a deformable surface, is adopted. These and all other simulations in this paper use the same method which is coded in the Gerris library (Popinet Reference Popinet2003). The scheme uses the finite volume method to compute the flow fields and the volume of fluid method to track the free surface. Different functional forms for the viscosity can be chosen that depend on the flow properties which in turn allows different
$\unicode[STIX]{x1D707}(I)$
-rheology. Here the numerical scheme developed in Barker et al. (Reference Barker, Schaeffer, Bohorquez and Gray2015), which allows for the transient computation of two-dimensional chute flows with a deformable surface, is adopted. These and all other simulations in this paper use the same method which is coded in the Gerris library (Popinet Reference Popinet2003). The scheme uses the finite volume method to compute the flow fields and the volume of fluid method to track the free surface. Different functional forms for the viscosity can be chosen that depend on the flow properties which in turn allows different
 $\unicode[STIX]{x1D707}(I)$
curves to be tested with all other aspects of the computation remaining identical. For the case of decelerating chute flow, the velocity fields, computed with the rheology of Jop et al. (Reference Jop, Forterre and Pouliquen2005), are shown in figure 3(a) and are found to be qualitatively similar to the approximate solution and DEM simulations of Parez et al. (Reference Parez, Aharonov and Toussaint2016). However plots of the inertial number, as shown in figure 3(b), reveal the spontaneous formation of perturbations.
$\unicode[STIX]{x1D707}(I)$
curves to be tested with all other aspects of the computation remaining identical. For the case of decelerating chute flow, the velocity fields, computed with the rheology of Jop et al. (Reference Jop, Forterre and Pouliquen2005), are shown in figure 3(a) and are found to be qualitatively similar to the approximate solution and DEM simulations of Parez et al. (Reference Parez, Aharonov and Toussaint2016). However plots of the inertial number, as shown in figure 3(b), reveal the spontaneous formation of perturbations.
Snapshots of the inertial number at
 $t=0.2~\text{s}$
across the domain occupied by granular material. The top panel (a) is from the computation detailed in figure 3 whereas the middle panel (b) is for the same parameters but with
$t=0.2~\text{s}$
across the domain occupied by granular material. The top panel (a) is from the computation detailed in figure 3 whereas the middle panel (b) is for the same parameters but with
 $512\times 512$
computational cells; (c) is with the regularised rheology (5.2).
$512\times 512$
computational cells; (c) is with the regularised rheology (5.2).

Figure 4 demonstrates how these perturbations are indicative of the ill posedness of the governing equations. Despite sharing qualitative similarity with shear bands (Goddard Reference Goddard2002) and force chains (Majmudar & Behringer Reference Majmudar and Behringer2005), which are observed in slowly sheared flows, the simulations demonstrate that the magnitude and typical length scale of the localised strain-rate regions are dependent on the spatial resolution used. Furthermore, the magnitude of the inertial number perturbations are found to increase as the typical wavelength of the patterns decreases. Unlike in the simulations presented in Barker et al. (Reference Barker, Schaeffer, Bohorquez and Gray2015), that were performed at a large angle that gave a constant ill-posed inertial number across the domain, the computations presented here demonstrate that only the region of the flow for which
 $C>0$
(when
$C>0$
(when
 $I<I_{1}^{N}$
in these simulations) exhibits signs of ill posedness.
$I<I_{1}^{N}$
in these simulations) exhibits signs of ill posedness.
Downslope averages of the velocity (a) and the inertial number (b) at evenly spaced times in
 $0<t<0.2~\text{s}$
. Here the computations are initialised with the Bagnold solution (5.4) and (5.5) with
$0<t<0.2~\text{s}$
. Here the computations are initialised with the Bagnold solution (5.4) and (5.5) with
 $\unicode[STIX]{x1D701}_{0}=24^{\circ }$
and the subsequent numerical solutions are computed with the regularised rheology (5.2). The inclination angle is set to
$\unicode[STIX]{x1D701}_{0}=24^{\circ }$
and the subsequent numerical solutions are computed with the regularised rheology (5.2). The inclination angle is set to
 $\unicode[STIX]{x1D701}=10^{\circ }$
and regularisation parameter
$\unicode[STIX]{x1D701}=10^{\circ }$
and regularisation parameter
 $\unicode[STIX]{x1D6FC}=1.9$
. Lines show the numerical solution with
$\unicode[STIX]{x1D6FC}=1.9$
. Lines show the numerical solution with
 $512\times 512$
computational cells and the points are with
$512\times 512$
computational cells and the points are with
 $256\times 256$
cells. The time step is
$256\times 256$
cells. The time step is
 $1\times 10^{-6}~\text{s}$
.
$1\times 10^{-6}~\text{s}$
.
In order to validate the well posedness of the regularised rheology, the proposed
 $\unicode[STIX]{x1D707}(I)$
curve (5.2) is implemented in the numerical procedure. The results of an otherwise identical computation to that shown in figure 3 are shown in figures 4(c) and 5. It is noted that the velocity fields are qualitatively very close and so the match with the work of Parez et al. (Reference Parez, Aharonov and Toussaint2016) is maintained. However, the computed inertial numbers highlight the crucial difference between the computations. The initial conditions ensure that the values of
$\unicode[STIX]{x1D707}(I)$
curve (5.2) is implemented in the numerical procedure. The results of an otherwise identical computation to that shown in figure 3 are shown in figures 4(c) and 5. It is noted that the velocity fields are qualitatively very close and so the match with the work of Parez et al. (Reference Parez, Aharonov and Toussaint2016) is maintained. However, the computed inertial numbers highlight the crucial difference between the computations. The initial conditions ensure that the values of
 $I$
in the two simulations are identical, but as time progresses the difference between them grows. The calculation using the unregularised rheology of Jop et al. (Reference Jop, Forterre and Pouliquen2005) quickly reaches low values of
$I$
in the two simulations are identical, but as time progresses the difference between them grows. The calculation using the unregularised rheology of Jop et al. (Reference Jop, Forterre and Pouliquen2005) quickly reaches low values of
 $I$
, but then reverts to higher non-uniform values. Conversely, in the simulation presented in figures 4(c) and 5, using the regularised model, the inertial numbers decrease monotonically and vary smoothly across the domain. By studying again two different spatial resolutions it is found that computations with the regularised model are independent of the grid scale. There is some mismatch close to the bottom boundary, but this is thought to be due to the sensitivity of
$I$
, but then reverts to higher non-uniform values. Conversely, in the simulation presented in figures 4(c) and 5, using the regularised model, the inertial numbers decrease monotonically and vary smoothly across the domain. By studying again two different spatial resolutions it is found that computations with the regularised model are independent of the grid scale. There is some mismatch close to the bottom boundary, but this is thought to be due to the sensitivity of
 $I$
on the no-slip condition applied here. These simulations therefore provide strong support for the well posedness of the regularised rheology in the low inertial number limit. However, certain physical effects, such as shear banding (Goddard Reference Goddard2002), frictional hysteresis (Edwards et al.
Reference Edwards, Viroulet, Kokelaar and Gray2017) and non-local behaviour (Kamrin & Koval Reference Kamrin and Koval2014), are not observed in these flows. This suggests that more complicated models, than the incompressible
$I$
on the no-slip condition applied here. These simulations therefore provide strong support for the well posedness of the regularised rheology in the low inertial number limit. However, certain physical effects, such as shear banding (Goddard Reference Goddard2002), frictional hysteresis (Edwards et al.
Reference Edwards, Viroulet, Kokelaar and Gray2017) and non-local behaviour (Kamrin & Koval Reference Kamrin and Koval2014), are not observed in these flows. This suggests that more complicated models, than the incompressible
 $\unicode[STIX]{x1D707}(I)$
-rheology, are required to capture the true physics of flows at very low inertial numbers.
$\unicode[STIX]{x1D707}(I)$
-rheology, are required to capture the true physics of flows at very low inertial numbers.
6 The high inertial number limit
6.1 Steady chute flow experiments
Holyoake & McElwaine (Reference Holyoake and McElwaine2012) performed experiments on high-speed chute flows where
 $I$
is large and found that the form
$I$
is large and found that the form
 $$\begin{eqnarray}\unicode[STIX]{x1D707}_{H}(I,h_{0})=\frac{\unicode[STIX]{x1D707}_{s}I_{0}+\unicode[STIX]{x1D707}_{d}I+cI^{2}\left(\displaystyle \frac{h_{0}}{d}\right)^{-1/3}}{I_{0}+I},\end{eqnarray}$$
where
 $h_{0}$
is the flow thickness and
$h_{0}$
is the flow thickness and
 $c$
is a constant, was a better fit to their data than the curve of Jop et al. (Reference Jop, Forterre and Pouliquen2005). Due to the
$c$
is a constant, was a better fit to their data than the curve of Jop et al. (Reference Jop, Forterre and Pouliquen2005). Due to the
 $I^{2}$
term in the numerator, this expression gives a greater value for
$I^{2}$
term in the numerator, this expression gives a greater value for
 $\unicode[STIX]{x1D707}$
when the inertial number is large, but approximates (2.12) otherwise. The analysis in § 4 suggests that this type of curve is preferable in the high-
$\unicode[STIX]{x1D707}$
when the inertial number is large, but approximates (2.12) otherwise. The analysis in § 4 suggests that this type of curve is preferable in the high-
 $I$
limit and may lead to a greater range of well-posed values. However, the explicit inclusion of the flow thickness in this rheology changes the structure of the governing equations due to the dependence on a geometry specific non-local variable.
$I$
limit and may lead to a greater range of well-posed values. However, the explicit inclusion of the flow thickness in this rheology changes the structure of the governing equations due to the dependence on a geometry specific non-local variable.
Here, new chute flow experiments are performed that allow for the shape of the
 $\unicode[STIX]{x1D707}(I)$
curve to be inferred and are used to ascertain if a constant can be used instead of
$\unicode[STIX]{x1D707}(I)$
curve to be inferred and are used to ascertain if a constant can be used instead of
 $h_{0}$
in (6.1). The set-up consists of an approximately 3 m long chute with two vertical glass sidewalls separated by approximately 0.08 m. The base of the chute consists of a flat metal plate onto which large spherical particles with a mean diameter of approximately
$h_{0}$
in (6.1). The set-up consists of an approximately 3 m long chute with two vertical glass sidewalls separated by approximately 0.08 m. The base of the chute consists of a flat metal plate onto which large spherical particles with a mean diameter of approximately
 $1\times 10^{-3}~\text{m}$
are attached with double-sided adhesive tape. Particles with measured properties listed in table 1 are introduced at a constant rate at the top of the chute from a vertical hopper with an adjustable height, rectangular gate. By changing the inclination angle
$1\times 10^{-3}~\text{m}$
are attached with double-sided adhesive tape. Particles with measured properties listed in table 1 are introduced at a constant rate at the top of the chute from a vertical hopper with an adjustable height, rectangular gate. By changing the inclination angle
 $\unicode[STIX]{x1D701}$
, the inertial number
$\unicode[STIX]{x1D701}$
, the inertial number
 $I_{\unicode[STIX]{x1D701}}$
is also varied as in the Bagnold solution, (5.4) and (5.5). The inertial number is found experimentally through measurement of the flow thickness and velocity. Particle image velocimetry is used here to measure the velocity of particles at the surface of the flows
$I_{\unicode[STIX]{x1D701}}$
is also varied as in the Bagnold solution, (5.4) and (5.5). The inertial number is found experimentally through measurement of the flow thickness and velocity. Particle image velocimetry is used here to measure the velocity of particles at the surface of the flows
 $u_{s}=u(h_{0})$
by comparing successive images from a high-speed camera (Thielicke & Stamhuis Reference Thielicke and Stamhuis2014). At the same time, a laser profilometer is used to measure the thickness
$u_{s}=u(h_{0})$
by comparing successive images from a high-speed camera (Thielicke & Stamhuis Reference Thielicke and Stamhuis2014). At the same time, a laser profilometer is used to measure the thickness
 $h_{0}$
of the flow, as in Baker et al. (Reference Baker, Barker and Gray2016). The inertial number is then inferred from these measurements through the expression
$h_{0}$
of the flow, as in Baker et al. (Reference Baker, Barker and Gray2016). The inertial number is then inferred from these measurements through the expression
 $$\begin{eqnarray}I_{\unicode[STIX]{x1D701}}=\frac{3du_{s}}{2h_{0}^{3/2}\sqrt{\unicode[STIX]{x1D719}g\cos \unicode[STIX]{x1D701}}},\end{eqnarray}$$
which comes from rearranging (5.5) and setting
 $z=h_{0}$
. The steady nature of the flows is confirmed by performing the measurements at two different downstream locations and ensuring that the thickness and velocities are consistent over multiple runs.
$z=h_{0}$
. The steady nature of the flows is confirmed by performing the measurements at two different downstream locations and ensuring that the thickness and velocities are consistent over multiple runs.
Experimentally measured inertial numbers (points) for steady chute flows with the theoretical
 $\unicode[STIX]{x1D707}(I)$
curves of Jop et al. (Reference Jop, Forterre and Pouliquen2005) shown in blue dot-dash and of Holyoake & McElwaine (Reference Holyoake and McElwaine2012) in black. Inset is the slope angle
$\unicode[STIX]{x1D707}(I)$
curves of Jop et al. (Reference Jop, Forterre and Pouliquen2005) shown in blue dot-dash and of Holyoake & McElwaine (Reference Holyoake and McElwaine2012) in black. Inset is the slope angle
 $\unicode[STIX]{x1D701}$
and the inertial numbers inferred from (6.2). The vertical dashed line marks the points above which the rheology of Jop et al. (Reference Jop, Forterre and Pouliquen2005) is ill posed and the vertical red line is the angle
$\unicode[STIX]{x1D701}$
and the inertial numbers inferred from (6.2). The vertical dashed line marks the points above which the rheology of Jop et al. (Reference Jop, Forterre and Pouliquen2005) is ill posed and the vertical red line is the angle
 $\unicode[STIX]{x1D701}_{d}$
above which steady flows are not observed. Note that the equations are evaluated with the experimentally measured values in table 1 and the rheology (6.1) is best fit with
$\unicode[STIX]{x1D701}_{d}$
above which steady flows are not observed. Note that the equations are evaluated with the experimentally measured values in table 1 and the rheology (6.1) is best fit with
 $ch_{0}/d=\unicode[STIX]{x1D707}_{\infty }=0.05$
.
$ch_{0}/d=\unicode[STIX]{x1D707}_{\infty }=0.05$
.
As shown in figure 6, the results of the chute flow experiments that determine the inertial number as a function of the inclination angle demonstrate a divergence from the rheology of Jop et al. (Reference Jop, Forterre and Pouliquen2005) when the inertial number
 $I>I_{2}^{N}$
. This is interesting as it suggests that the range of
$I>I_{2}^{N}$
. This is interesting as it suggests that the range of
 $I$
for which the equations are ill posed corresponds to the range where matching with experiments also breaks down. The figure also shows the curve of Holyoake & McElwaine (Reference Holyoake and McElwaine2012) with
$I$
for which the equations are ill posed corresponds to the range where matching with experiments also breaks down. The figure also shows the curve of Holyoake & McElwaine (Reference Holyoake and McElwaine2012) with
 $ch_{0}/d\equiv \unicode[STIX]{x1D707}_{\infty }$
assumed to be a fitting constant. This study supports the analysis of § 4 as the value of
$ch_{0}/d\equiv \unicode[STIX]{x1D707}_{\infty }$
assumed to be a fitting constant. This study supports the analysis of § 4 as the value of
 $\unicode[STIX]{x1D707}$
predicted by (2.12) is too low for large inertial numbers and that a form for which
$\unicode[STIX]{x1D707}$
predicted by (2.12) is too low for large inertial numbers and that a form for which
 $\unicode[STIX]{x1D707}$
increases more rapidly with increasing
$\unicode[STIX]{x1D707}$
increases more rapidly with increasing
 $I$
, such as the
$I$
, such as the
 $I^{2}$
term added in (6.1), is more physically realistic. Therefore a combination of the rheology developed here with the extension introduced for low inertial number flows in § 5 is proposed. Taking
$I^{2}$
term added in (6.1), is more physically realistic. Therefore a combination of the rheology developed here with the extension introduced for low inertial number flows in § 5 is proposed. Taking
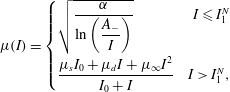 $$\begin{eqnarray}\unicode[STIX]{x1D707}(I)=\left\{\begin{array}{@{}lr@{}}\sqrt{\displaystyle \frac{\unicode[STIX]{x1D6FC}}{\displaystyle ln\left(\frac{A_{-}}{I}\right)}} & I\leqslant I_{1}^{N}\\ \displaystyle \frac{\unicode[STIX]{x1D707}_{s}I_{0}+\unicode[STIX]{x1D707}_{d}I+\unicode[STIX]{x1D707}_{\infty }I^{2}}{I_{0}+I} & I>I_{1}^{N},\end{array}\right.\end{eqnarray}$$
where
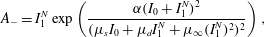 $$\begin{eqnarray}A_{-}=I_{1}^{N}\exp \left(\frac{\unicode[STIX]{x1D6FC}(I_{0}+I_{1}^{N})^{2}}{(\unicode[STIX]{x1D707}_{s}I_{0}+\unicode[STIX]{x1D707}_{d}I_{1}^{N}+\unicode[STIX]{x1D707}_{\infty }(I_{1}^{N})^{2})^{2}}\right),\end{eqnarray}$$
ensures well posedness for low-
 $I$
and allows the corrections in the high-
$I$
and allows the corrections in the high-
 $I$
limit to be incorporated. This function and the related range of well-posed inertial numbers is shown in figure 7.
$I$
limit to be incorporated. This function and the related range of well-posed inertial numbers is shown in figure 7.
The regularised
 $\unicode[STIX]{x1D707}(I)$
curve (6.3) in black compared with the curve (2.12) of Jop et al. (Reference Jop, Forterre and Pouliquen2005) plotted as the blue dot-dashed curve. The vertical dashed lines are the neutral inertial numbers for
$\unicode[STIX]{x1D707}(I)$
curve (6.3) in black compared with the curve (2.12) of Jop et al. (Reference Jop, Forterre and Pouliquen2005) plotted as the blue dot-dashed curve. The vertical dashed lines are the neutral inertial numbers for
 $\unicode[STIX]{x1D707}_{J}$
and the vertical solid line is the maximum well-posed inertial number for the regularised curve.
$\unicode[STIX]{x1D707}_{J}$
and the vertical solid line is the maximum well-posed inertial number for the regularised curve.
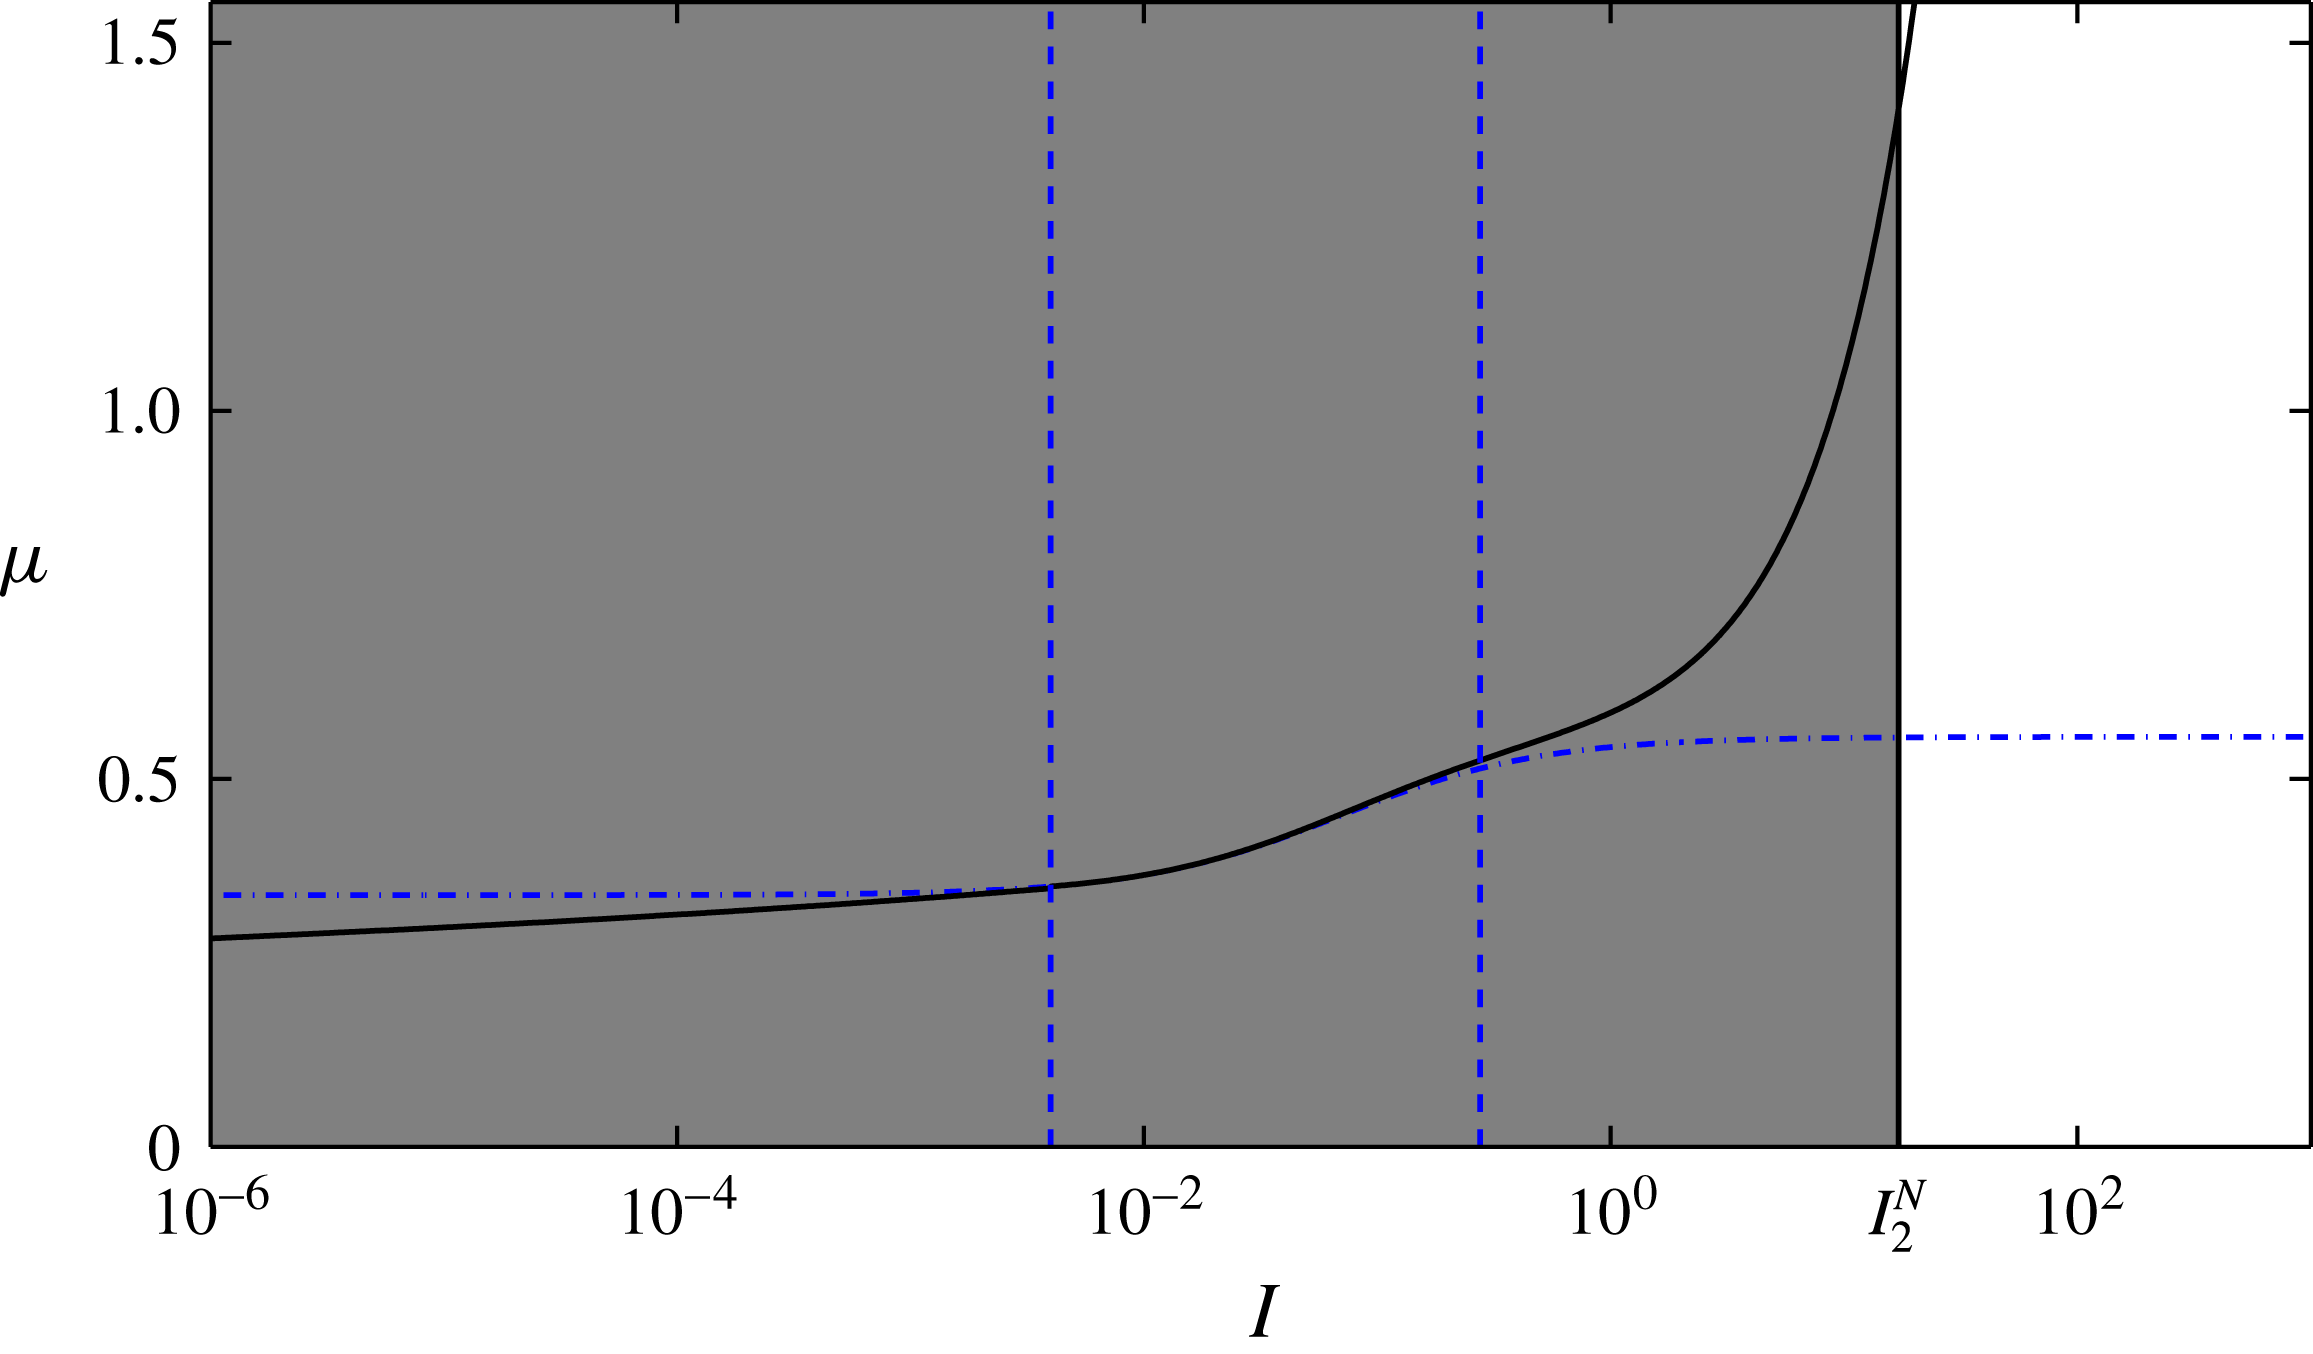
Another significant consequence of the addition of the term proportional to
 $I^{2}$
in the numerator of the
$I^{2}$
in the numerator of the
 $\unicode[STIX]{x1D707}(I)$
-expression (6.3) in the high inertial number limit is the link with kinetic theories. Instead of
$\unicode[STIX]{x1D707}(I)$
-expression (6.3) in the high inertial number limit is the link with kinetic theories. Instead of
 $\unicode[STIX]{x1D707}\rightarrow \unicode[STIX]{x1D707}_{d}$
, which was the case with the rheology of Jop et al. (Reference Jop, Forterre and Pouliquen2005), it is now the case that
$\unicode[STIX]{x1D707}\rightarrow \unicode[STIX]{x1D707}_{d}$
, which was the case with the rheology of Jop et al. (Reference Jop, Forterre and Pouliquen2005), it is now the case that
 $\unicode[STIX]{x1D707}\rightarrow \unicode[STIX]{x1D707}_{\infty }I$
. This behaviour means that for rapidly sheared flows, the dissipation is not rate independent and instead has a granular viscosity
$\unicode[STIX]{x1D707}\rightarrow \unicode[STIX]{x1D707}_{\infty }I$
. This behaviour means that for rapidly sheared flows, the dissipation is not rate independent and instead has a granular viscosity
 $\unicode[STIX]{x1D702}_{g}\rightarrow \unicode[STIX]{x1D707}_{\infty }d\sqrt{\unicode[STIX]{x1D70C}_{\ast }p}$
. The kinetic theories of Jenkins & Savage (Reference Jenkins and Savage1983), Lun (Reference Lun1991) and Armanini et al. (Reference Armanini, Larcher, Nucci and Dumbser2014) all share this structure for the collisional dissipation whilst allowing the term equivalent to
$\unicode[STIX]{x1D702}_{g}\rightarrow \unicode[STIX]{x1D707}_{\infty }d\sqrt{\unicode[STIX]{x1D70C}_{\ast }p}$
. The kinetic theories of Jenkins & Savage (Reference Jenkins and Savage1983), Lun (Reference Lun1991) and Armanini et al. (Reference Armanini, Larcher, Nucci and Dumbser2014) all share this structure for the collisional dissipation whilst allowing the term equivalent to
 $\unicode[STIX]{x1D707}_{\infty }$
to depend on the mean and maximum volume fraction and the restitution coefficient of the grains, which here are assumed to be constants. This analogy means that our proposed rheology is able to smoothly transition between theories that have been shown to work well in the intermediate and large shearing regimes, namely the
$\unicode[STIX]{x1D707}_{\infty }$
to depend on the mean and maximum volume fraction and the restitution coefficient of the grains, which here are assumed to be constants. This analogy means that our proposed rheology is able to smoothly transition between theories that have been shown to work well in the intermediate and large shearing regimes, namely the
 $\unicode[STIX]{x1D707}(I)$
-rheology and kinetic theory. With this viewpoint, the role of
$\unicode[STIX]{x1D707}(I)$
-rheology and kinetic theory. With this viewpoint, the role of
 $\unicode[STIX]{x1D707}_{\infty }$
is distinguished from that of
$\unicode[STIX]{x1D707}_{\infty }$
is distinguished from that of
 $\unicode[STIX]{x1D707}_{s}$
and
$\unicode[STIX]{x1D707}_{s}$
and
 $\unicode[STIX]{x1D707}_{d}$
as it characterises dissipation due to binary inelastic collisions rather than shearing friction, which dominates in the intermediate inertial number range.
$\unicode[STIX]{x1D707}_{d}$
as it characterises dissipation due to binary inelastic collisions rather than shearing friction, which dominates in the intermediate inertial number range.
6.2 High inclination angle simulations
Inertial numbers in computations of high-speed chute flows at
 $\unicode[STIX]{x1D701}=28.5^{\circ }$
. Panels (a,b) show the results with the unregularised rheology (2.12) at
$\unicode[STIX]{x1D701}=28.5^{\circ }$
. Panels (a,b) show the results with the unregularised rheology (2.12) at
 $t=1.13~\text{s}$
, just before fatal blow up, whereas (c,d) are with the regularised model (6.3) much later at
$t=1.13~\text{s}$
, just before fatal blow up, whereas (c,d) are with the regularised model (6.3) much later at
 $t=5~\text{s}$
. Panels (a,c) show the inertial numbers across the domain below the constant free surface
$t=5~\text{s}$
. Panels (a,c) show the inertial numbers across the domain below the constant free surface
 $h_{0}=7\times 10^{-4}~\text{m}$
and panels (b,d) are the related downslope averages of the inertial number on a semi-logarithmic scale. The vertical solid lines indicate the theoretical steady-state inertial number
$h_{0}=7\times 10^{-4}~\text{m}$
and panels (b,d) are the related downslope averages of the inertial number on a semi-logarithmic scale. The vertical solid lines indicate the theoretical steady-state inertial number
 $I_{\unicode[STIX]{x1D701}}$
for the regularised rheology whereas the vertical dashed lines are the initial conditions and correspond to the theoretical value for the unregularised model.
$I_{\unicode[STIX]{x1D701}}$
for the regularised rheology whereas the vertical dashed lines are the initial conditions and correspond to the theoretical value for the unregularised model.
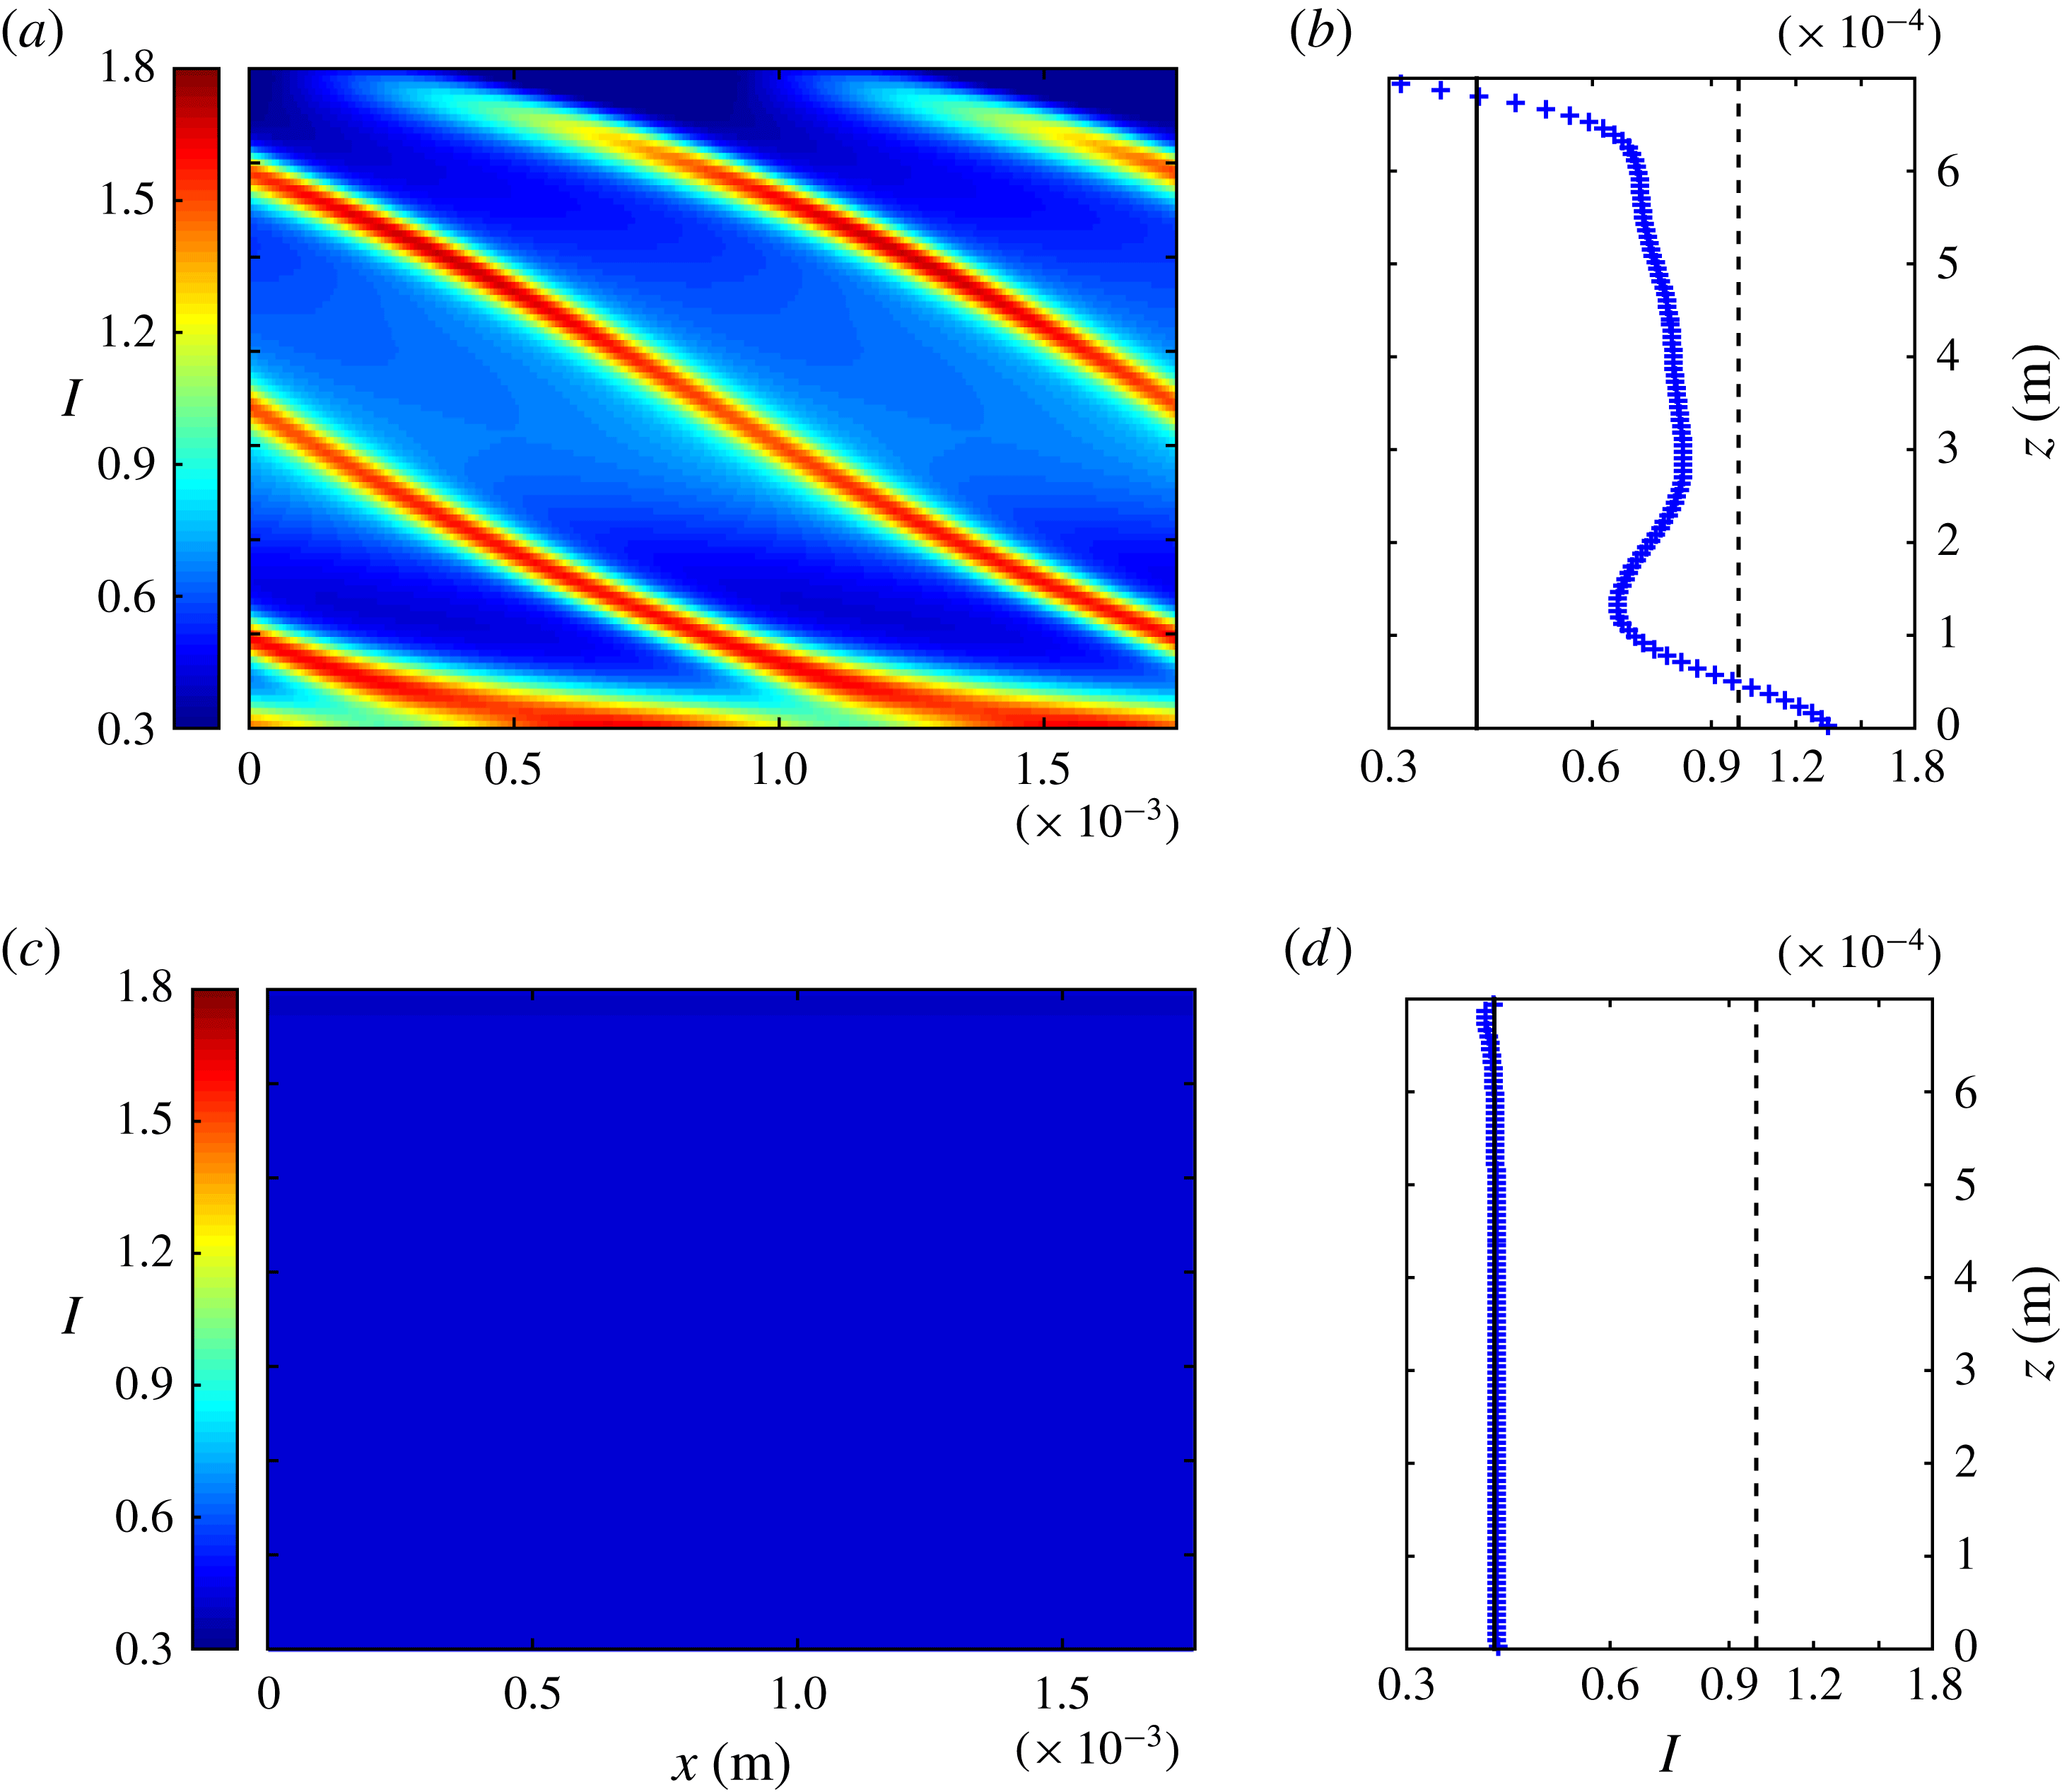
As demonstrated in Barker et al. (Reference Barker, Schaeffer, Bohorquez and Gray2015), above a certain inclination angle the equations with the unregularised rheology (2.12) are ill posed and numerical simulations exhibit grid-dependent oblique pressure waves that grow exponentially. As a test of the regularised rheology (6.3) similar computations are carried out here. For steady uniform flow, each
 $\unicode[STIX]{x1D707}(I)$
curve sets a different steady-state inertial number
$\unicode[STIX]{x1D707}(I)$
curve sets a different steady-state inertial number
 $I_{\unicode[STIX]{x1D701}}$
(as shown in figure 6) with the regularised model predicting a lower value. Figure 8 shows the results of two calculations, one with and one without the regularisation. Initialising both simulations with the larger inertial number predicted by the rheology of Jop et al. (Reference Jop, Forterre and Pouliquen2005) allows for direct comparison. As expected, the unregularised model exhibits catastrophic internal waves as seen in Barker et al. (Reference Barker, Schaeffer, Bohorquez and Gray2015) whereas the flow with the regularised rheology decelerates and the inertial number converges uniformly on the lower inertial number predicted by inverting the newly proposed
$I_{\unicode[STIX]{x1D701}}$
(as shown in figure 6) with the regularised model predicting a lower value. Figure 8 shows the results of two calculations, one with and one without the regularisation. Initialising both simulations with the larger inertial number predicted by the rheology of Jop et al. (Reference Jop, Forterre and Pouliquen2005) allows for direct comparison. As expected, the unregularised model exhibits catastrophic internal waves as seen in Barker et al. (Reference Barker, Schaeffer, Bohorquez and Gray2015) whereas the flow with the regularised rheology decelerates and the inertial number converges uniformly on the lower inertial number predicted by inverting the newly proposed
 $\unicode[STIX]{x1D707}(I)$
curve (6.3). This test therefore demonstrates the well posedness of the regularised model for these high-speed flows.
$\unicode[STIX]{x1D707}(I)$
curve (6.3). This test therefore demonstrates the well posedness of the regularised model for these high-speed flows.
7 Granular rollwaves
Whilst the proposed rheology (6.3) has been shown to extend the range of well-posed inertial numbers, and has experimental justification, it is important to show that implementation of the resultant equations numerically results in a physically realistic system capable of capturing the often subtle phenomenology of real granular flows. For granular chute flows of thickness
 $h_{0}$
the Froude number
$h_{0}$
the Froude number
 $$\begin{eqnarray}\mathit{Fr}=\frac{\bar{u}}{\sqrt{gh_{0}\cos \unicode[STIX]{x1D701}}}=\frac{2h_{0}}{5d}I_{\unicode[STIX]{x1D701}}\sqrt{\unicode[STIX]{x1D719}},\end{eqnarray}$$
where
 $\bar{u}$
is the depth-integrated downslope velocity, is found to control the stability of the steady solution (5.4) and (5.5). For sufficiently large Froude numbers
$\bar{u}$
is the depth-integrated downslope velocity, is found to control the stability of the steady solution (5.4) and (5.5). For sufficiently large Froude numbers
 $\mathit{Fr}>\mathit{Fr}_{c}$
, where
$\mathit{Fr}>\mathit{Fr}_{c}$
, where
 $\mathit{Fr}_{c}$
is the critical Froude number, free-surface waves form, which are known as granular rollwaves (Gray & Edwards Reference Gray and Edwards2014) or Kapitza waves (Forterre Reference Forterre2006). After a period of transient growth, that may involve complex coarsening (Razis et al.
Reference Razis, Edwards, Gray and van der Weele2014), these perturbations reach a steady state consisting of travelling waves of constant shape and wave speed.
$\mathit{Fr}_{c}$
is the critical Froude number, free-surface waves form, which are known as granular rollwaves (Gray & Edwards Reference Gray and Edwards2014) or Kapitza waves (Forterre Reference Forterre2006). After a period of transient growth, that may involve complex coarsening (Razis et al.
Reference Razis, Edwards, Gray and van der Weele2014), these perturbations reach a steady state consisting of travelling waves of constant shape and wave speed.
These waves were studied experimentally by Forterre & Pouliquen (Reference Forterre and Pouliquen2003) who found that when a flow is subjected to perturbations of a particular frequency
 $\unicode[STIX]{x1D714}$
, there is a cutoff frequency
$\unicode[STIX]{x1D714}$
, there is a cutoff frequency
 $\unicode[STIX]{x1D714}_{c}$
such that for
$\unicode[STIX]{x1D714}_{c}$
such that for
 $\unicode[STIX]{x1D714}<\unicode[STIX]{x1D714}_{c}$
the waves grow in amplitude whereas for
$\unicode[STIX]{x1D714}<\unicode[STIX]{x1D714}_{c}$
the waves grow in amplitude whereas for
 $\unicode[STIX]{x1D714}>\unicode[STIX]{x1D714}_{c}$
the waves decay. This long wavelength instability was analysed further by Forterre (Reference Forterre2006) who performed a linear stability analysis, to isolate the critical Froude number, and solved the resulting equations numerically to recover the dispersion relation and
$\unicode[STIX]{x1D714}>\unicode[STIX]{x1D714}_{c}$
the waves decay. This long wavelength instability was analysed further by Forterre (Reference Forterre2006) who performed a linear stability analysis, to isolate the critical Froude number, and solved the resulting equations numerically to recover the dispersion relation and
 $\unicode[STIX]{x1D714}_{c}$
. The linearised equations studied by Forterre (Reference Forterre2006) differ from those in § 3, that were used to derive the conditions for well posedness, as the perturbations that cause rollwaves have a finite wavenumber so neglect of the base-state gradients is not possible. A much simpler formulation, that allows the dispersion relation to be derived exactly rather than numerically, comes from assuming that the flow thickness
$\unicode[STIX]{x1D714}_{c}$
. The linearised equations studied by Forterre (Reference Forterre2006) differ from those in § 3, that were used to derive the conditions for well posedness, as the perturbations that cause rollwaves have a finite wavenumber so neglect of the base-state gradients is not possible. A much simpler formulation, that allows the dispersion relation to be derived exactly rather than numerically, comes from assuming that the flow thickness
 $h$
is much smaller than the wavelength of the waves. Gray & Edwards (Reference Gray and Edwards2014) used this approximation to derive a depth-averaged
$h$
is much smaller than the wavelength of the waves. Gray & Edwards (Reference Gray and Edwards2014) used this approximation to derive a depth-averaged
 $\unicode[STIX]{x1D707}(I)$
-rheology and related equations for the mass and momentum balance. Their formulation gives
$\unicode[STIX]{x1D707}(I)$
-rheology and related equations for the mass and momentum balance. Their formulation gives
 $\mathit{Fr}_{c}=2/3$
and allows for an exact dispersion relation to be derived that captures the variation of the growth rate as the frequency is varied.
$\mathit{Fr}_{c}=2/3$
and allows for an exact dispersion relation to be derived that captures the variation of the growth rate as the frequency is varied.
The downslope
 $u$
(a) and vertical
$u$
(a) and vertical
 $w$
(b) velocities and the inertial number (c) at
$w$
(b) velocities and the inertial number (c) at
 $t=5~\text{s}$
for rollwaves generated from the initial perturbation (7.2) with
$t=5~\text{s}$
for rollwaves generated from the initial perturbation (7.2) with
 $h_{0}=4~\text{mm}$
,
$h_{0}=4~\text{mm}$
,
 $a_{0}=0.2~\text{mm}$
and
$a_{0}=0.2~\text{mm}$
and
 $\unicode[STIX]{x1D701}=28.5^{\circ }$
. The domain length and initial wavelength are set to
$\unicode[STIX]{x1D701}=28.5^{\circ }$
. The domain length and initial wavelength are set to
 $L_{x}=8~\text{cm}$
. The free surface
$L_{x}=8~\text{cm}$
. The free surface
 $h$
is drawn in black and only the values for the granular media are shown. An animation of the inertial number is also provided in the supplementary movie available at https://doi.org/10.1017/jfm.2017.428.
$h$
is drawn in black and only the values for the granular media are shown. An animation of the inertial number is also provided in the supplementary movie available at https://doi.org/10.1017/jfm.2017.428.
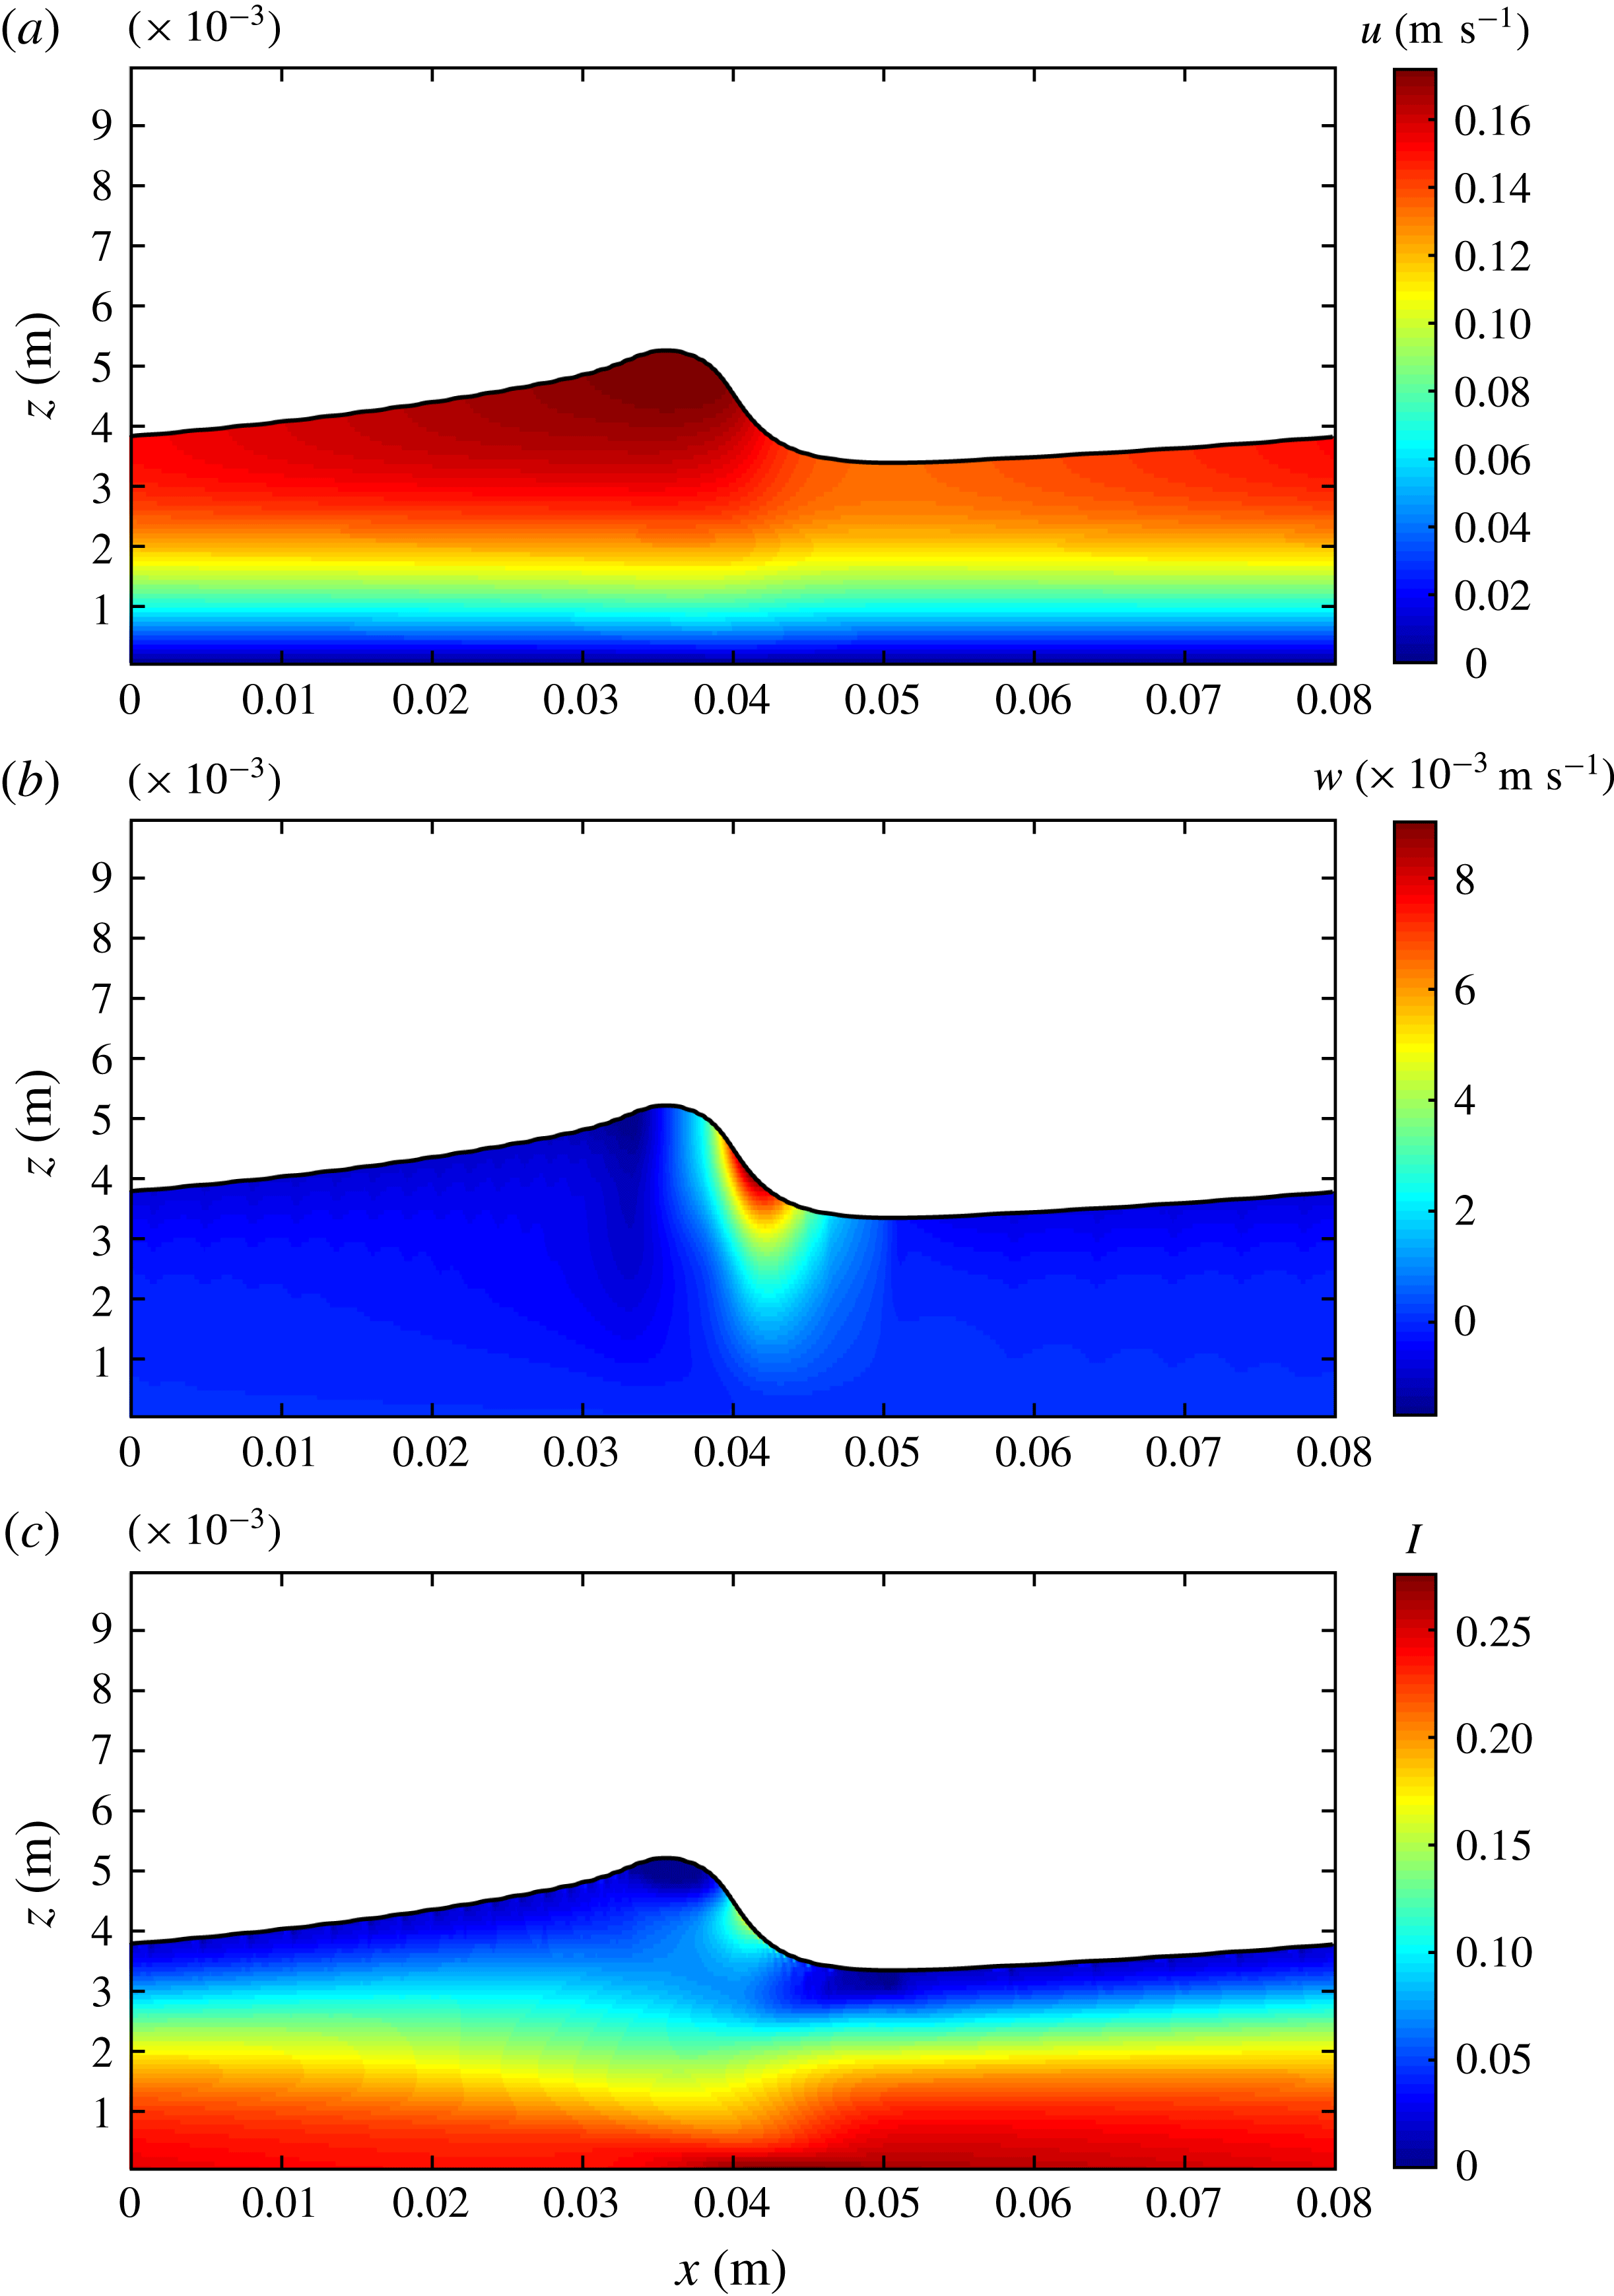
Here two-dimensional simulations of granular rollwaves are presented, for the first time, in order to validate the regularisation method and resultant numerical scheme. These are achieved by adapting the method used by Lagrée et al. (Reference Lagrée, Staron and Popinet2011) to study the collapse of a column of grains and by Barker et al. (Reference Barker, Schaeffer, Bohorquez and Gray2015) for chute flows. This numerical scheme is well suited to the study of granular rollwaves as it allows for the computation of the two velocity components, the pressure and the free-surface shape. Boundary conditions consist of the no-slip velocity at the base of the flow (
 $u=0$
at
$u=0$
at
 $z=0$
) and a vanishing pressure at the top of the domain (
$z=0$
) and a vanishing pressure at the top of the domain (
 $p=0$
at
$p=0$
at
 $z=2h_{0}$
). The downslope edges
$z=2h_{0}$
). The downslope edges
 $(x=0,\,L_{x})$
of the domain are wrapped to create spatial periodicity and the granular material is initialised with
$(x=0,\,L_{x})$
of the domain are wrapped to create spatial periodicity and the granular material is initialised with
 $$\begin{eqnarray}h(x,t=0)=h_{0}+a_{0}\sin (2\unicode[STIX]{x03C0}x/L_{x}),\end{eqnarray}$$
which corresponds to a half-filled domain with average flow depth
 $h_{0}$
, perturbed away from uniform thickness by a sine curve of amplitude
$h_{0}$
, perturbed away from uniform thickness by a sine curve of amplitude
 $a_{0}$
and wavelength
$a_{0}$
and wavelength
 $L_{x}$
. The pressure and velocity start from the steady solutions (5.4) and (5.5), respectively, evaluated with the initial height (7.2) instead of the constant height
$L_{x}$
. The pressure and velocity start from the steady solutions (5.4) and (5.5), respectively, evaluated with the initial height (7.2) instead of the constant height
 $h_{0}$
. It is found that the numerical scheme is stable for long times with the Neumann condition
$h_{0}$
. It is found that the numerical scheme is stable for long times with the Neumann condition
 $\unicode[STIX]{x2202}_{z}u=0$
at the top of the domain. This ensures a low velocity for the passive Newtonian fluid, that is used to track the free-surface shape, above the granular material. The results of a calculation with this set-up, making use of the regularised rheology (6.3), are shown in figures 9 and 10.
$\unicode[STIX]{x2202}_{z}u=0$
at the top of the domain. This ensures a low velocity for the passive Newtonian fluid, that is used to track the free-surface shape, above the granular material. The results of a calculation with this set-up, making use of the regularised rheology (6.3), are shown in figures 9 and 10.
The streamlines (blue) and free-surface height
 $h$
(black) for the flow fields detailed in figure 9. Here the downslope velocity has been shifted by the computed wave speed
$h$
(black) for the flow fields detailed in figure 9. Here the downslope velocity has been shifted by the computed wave speed
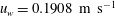 $u_{w}=0.1908~\text{m}~\text{s}^{-1}$
so that the streamlines shown coincide with the particle paths. Arrows have been added to indicate the direction of travel for particles in the flow relative to the propagating front.
$u_{w}=0.1908~\text{m}~\text{s}^{-1}$
so that the streamlines shown coincide with the particle paths. Arrows have been added to indicate the direction of travel for particles in the flow relative to the propagating front.
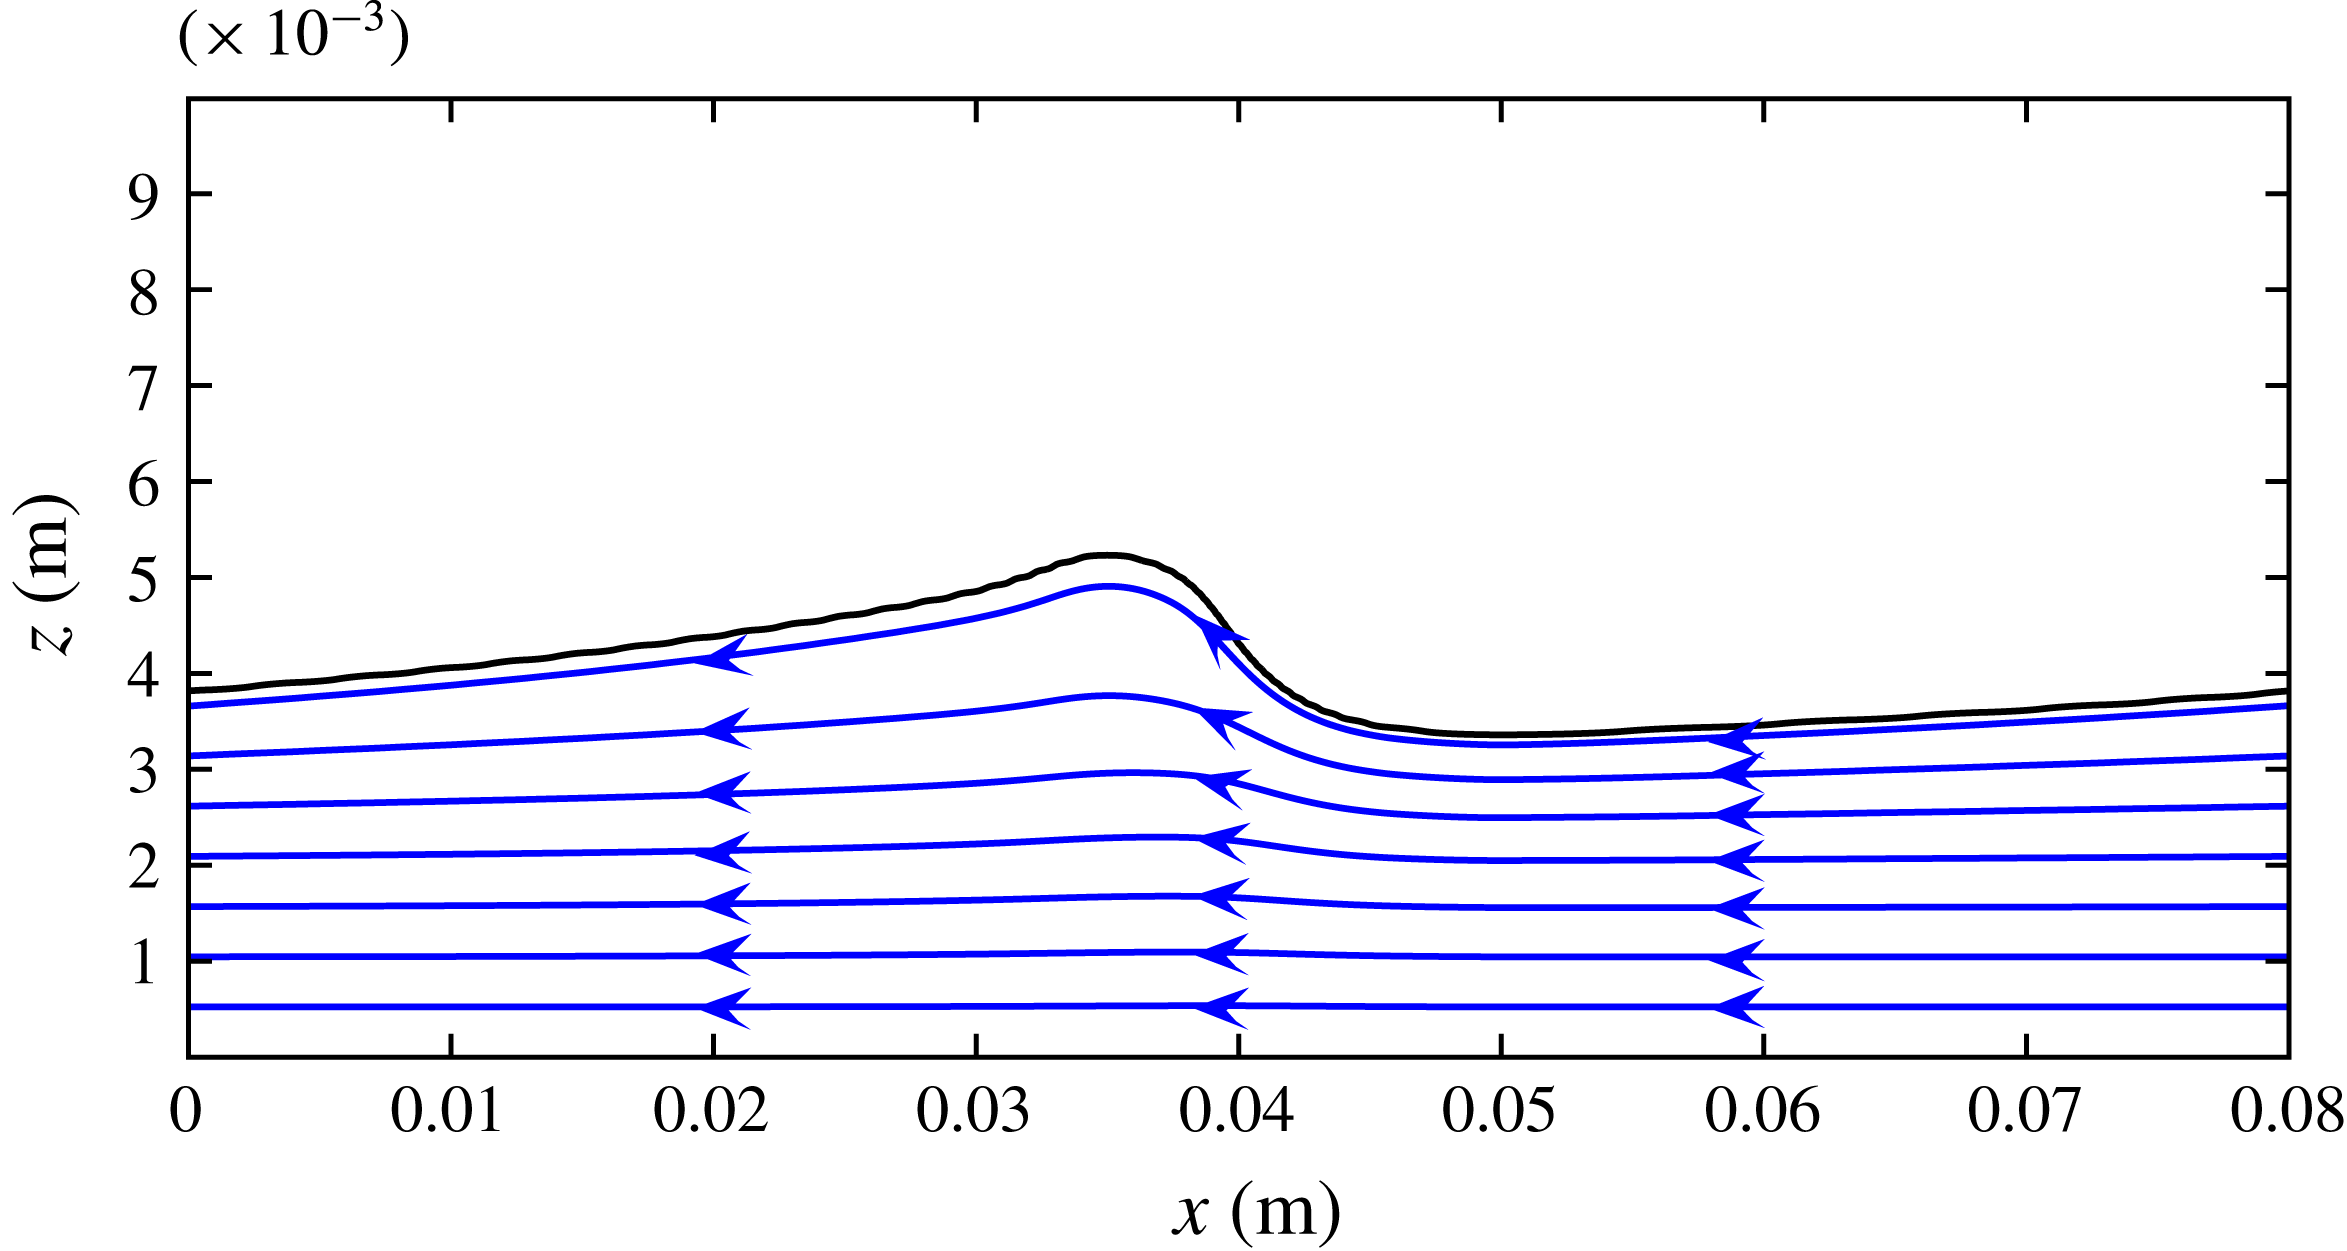
As shown in figure 9(a), the downslope velocity field is monotonically increasing in a manner similar to the Bagnold solution (5.5). The corresponding pressure field is also very close to the exact solution for the steady, uniform system (5.4) evaluated with the computed free-surface height
 $h(x,t)$
instead of the constant
$h(x,t)$
instead of the constant
 $h_{0}$
. The vertical velocity, shown in figure 9(b), is close to zero for the majority of the flow, as is the case in the uniform thickness flow, but has a region of positive values localised around the wave peak and a region of negative values forming a tail behind. The region of upwelling at the peak of the wave also corresponds to a local maxima in the inertial number surrounded by low values. This variation is shown in figure 9(c) and demonstrates how the rollwave solution has a large range of inertial numbers, greater than the well-posed range for the unregularised rheology.
$h_{0}$
. The vertical velocity, shown in figure 9(b), is close to zero for the majority of the flow, as is the case in the uniform thickness flow, but has a region of positive values localised around the wave peak and a region of negative values forming a tail behind. The region of upwelling at the peak of the wave also corresponds to a local maxima in the inertial number surrounded by low values. This variation is shown in figure 9(c) and demonstrates how the rollwave solution has a large range of inertial numbers, greater than the well-posed range for the unregularised rheology.
By tracking the
 $x$
position of the peak as the computation progresses, the wave speed
$x$
position of the peak as the computation progresses, the wave speed
 $u_{w}$
can be calculated. It is found that the wave speed is close to a constant throughout the simulation and is always greater than the maximum downslope velocity. By transforming into a frame moving with speed
$u_{w}$
can be calculated. It is found that the wave speed is close to a constant throughout the simulation and is always greater than the maximum downslope velocity. By transforming into a frame moving with speed
 $u_{w}$
a shifted downslope velocity field
$u_{w}$
a shifted downslope velocity field
 $U=u-u_{w}$
is defined. A plot of the streamlines for
$U=u-u_{w}$
is defined. A plot of the streamlines for
 $(U,w)$
is shown in figure 10. As the particle paths are equivalent to the streamlines in this coordinate system, this plot highlights that the waves move faster than the particles.
$(U,w)$
is shown in figure 10. As the particle paths are equivalent to the streamlines in this coordinate system, this plot highlights that the waves move faster than the particles.
A schematic diagram of the experimental set-up for measuring the rollwave height (a) with the glass slide used to split the flow and for measurements with the high-speed camera drawn in red. (b) Comparison of space–time plots for the blue numerically computed free surface and black experimental points. Inset are the raw height data acquired in the experiment. Simulation data are taken from the interval
 $8.5~\text{s}<9.1~\text{s}$
in figure 12(a). The error bar is reflective of the mean standard deviation in the data used to acquire each experimental point.
$8.5~\text{s}<9.1~\text{s}$
in figure 12(a). The error bar is reflective of the mean standard deviation in the data used to acquire each experimental point.
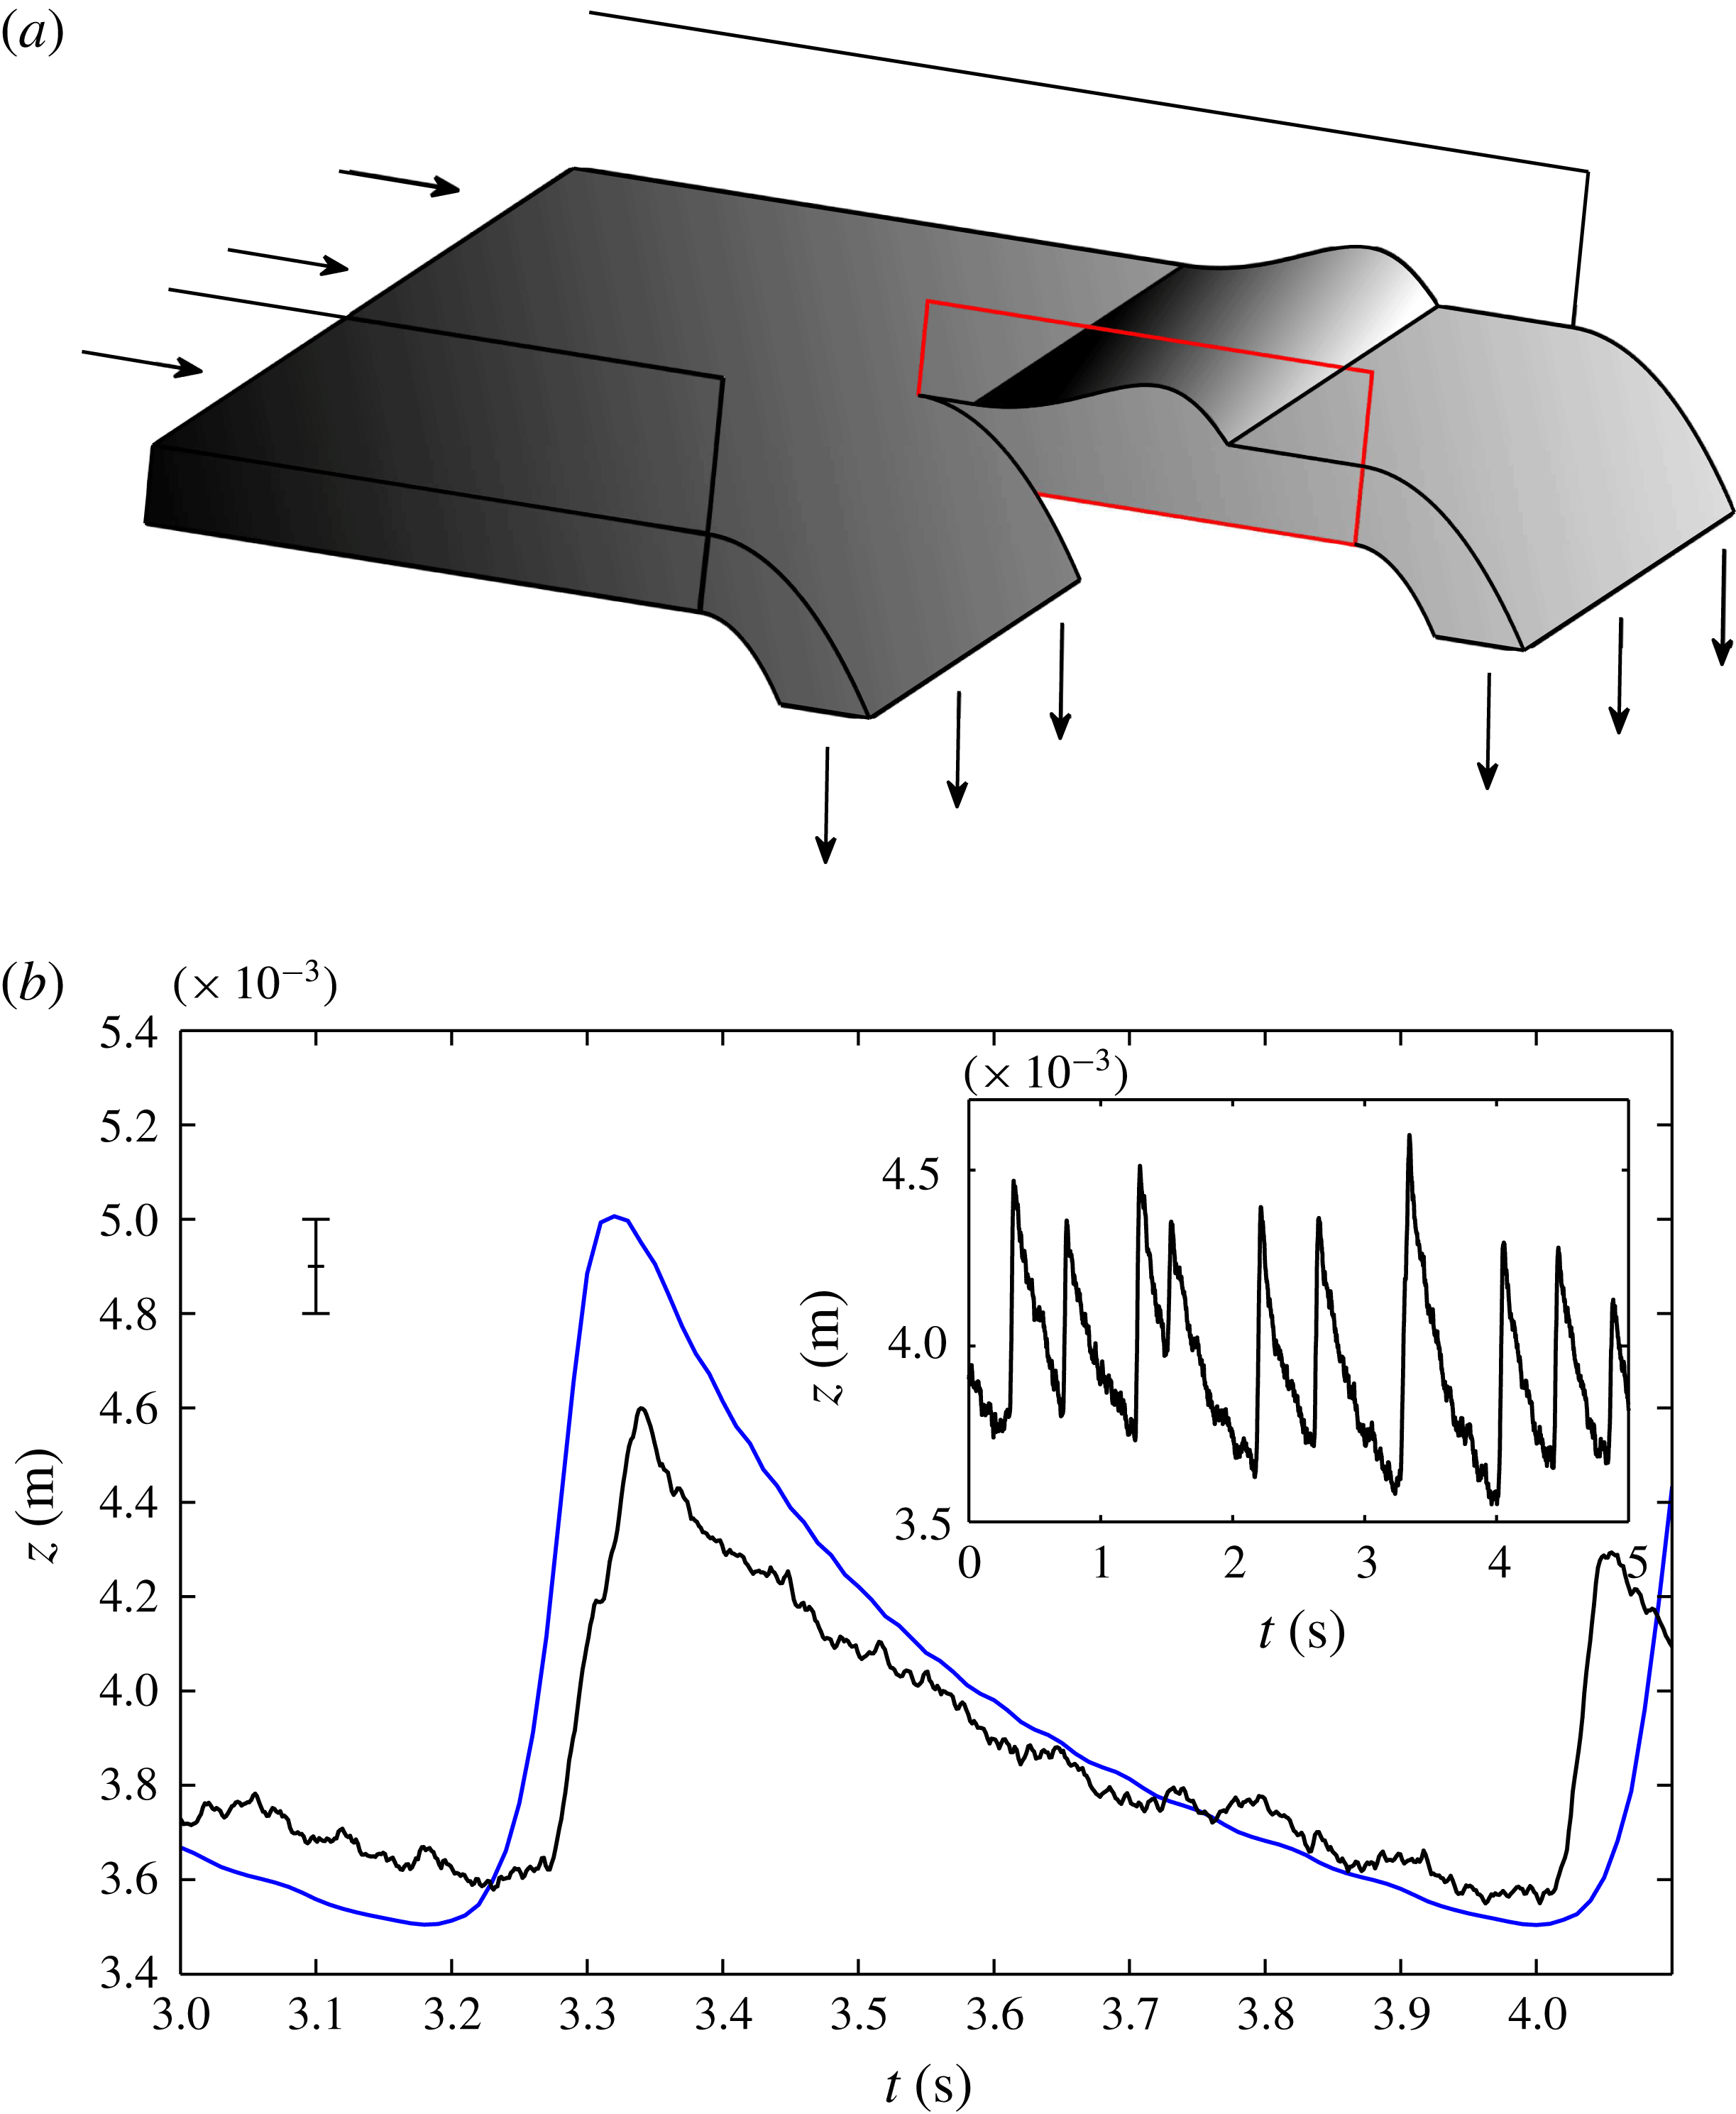
In order to provide a qualitative comparison to physical rollwaves, a chute flow experiment was performed. Using the same chute and particles as in § 6.1, the Froude number was changed by controlling the flux at the inflow. A steady flux was achieved that was sufficient to give a thickness and surface velocity with
 $\mathit{Fr}>\mathit{Fr}_{c}$
. For this configuration rollwaves formed spontaneously and grew in height as they travelled down the chute. Close to the bottom of the chute (
$\mathit{Fr}>\mathit{Fr}_{c}$
. For this configuration rollwaves formed spontaneously and grew in height as they travelled down the chute. Close to the bottom of the chute (
 $\simeq 3~\text{m}$
from the inflow) the free-surface height was measured using a thin glass slide attached to a section of chute base and a high-speed camera (see figure 11
a). The glass slide split the flow in half along the cross-slope mid-point such that half of the material fell into a bin and the other half continued along an identical base. This was done in order to avoid any effects caused by the sidewalls of the main chute. The camera recorded a thin vertical strip just after the split had occurred and by post-processing the resultant images, the flow height was inferred. This method has a very good temporal accuracy due to the high frame rate of the camera and the spatial accuracy was estimated to be approximately
$\simeq 3~\text{m}$
from the inflow) the free-surface height was measured using a thin glass slide attached to a section of chute base and a high-speed camera (see figure 11
a). The glass slide split the flow in half along the cross-slope mid-point such that half of the material fell into a bin and the other half continued along an identical base. This was done in order to avoid any effects caused by the sidewalls of the main chute. The camera recorded a thin vertical strip just after the split had occurred and by post-processing the resultant images, the flow height was inferred. This method has a very good temporal accuracy due to the high frame rate of the camera and the spatial accuracy was estimated to be approximately
 $1\times 10^{-4}~\text{m}$
from the standard deviation of the data. Figure 11(b) shows the results of this experiment and provides a comparison with a numerical simulation similar to that detailed in figures 9 and 10. Here the length of the domain (12 cm) in the new calculation (see figure 12) has been chosen to approximately match with the wavelength of the waves in the experiment. The shape of the numerically computed wave is close to those seen experimentally and the magnitude is comparable, but approximately 0.5 mm larger. This slight mismatch is thought to be due to the finite length of the chute used and, as detailed in Razis et al. (Reference Razis, Edwards, Gray and van der Weele2014) and seen in the inset of figure 11, the real waves interact and compete in order to coarsen to the final steady travelling wave whereas the numerical method used here isolates the behaviour of a single wave in an infinite periodic box.
$1\times 10^{-4}~\text{m}$
from the standard deviation of the data. Figure 11(b) shows the results of this experiment and provides a comparison with a numerical simulation similar to that detailed in figures 9 and 10. Here the length of the domain (12 cm) in the new calculation (see figure 12) has been chosen to approximately match with the wavelength of the waves in the experiment. The shape of the numerically computed wave is close to those seen experimentally and the magnitude is comparable, but approximately 0.5 mm larger. This slight mismatch is thought to be due to the finite length of the chute used and, as detailed in Razis et al. (Reference Razis, Edwards, Gray and van der Weele2014) and seen in the inset of figure 11, the real waves interact and compete in order to coarsen to the final steady travelling wave whereas the numerical method used here isolates the behaviour of a single wave in an infinite periodic box.
The transient evolution of the free surface
 $h$
computed with the regularised two-dimensional
$h$
computed with the regularised two-dimensional
 $\unicode[STIX]{x1D707}(I)$
-rheology. Starting from (7.2) with
$\unicode[STIX]{x1D707}(I)$
-rheology. Starting from (7.2) with
 $h_{0}=4~\text{mm}$
,
$h_{0}=4~\text{mm}$
,
 $a_{0}=0.2~\text{mm}$
and
$a_{0}=0.2~\text{mm}$
and
 $L_{x}=12~\text{cm}$
,
$L_{x}=12~\text{cm}$
,
 $h$
is plotted at a fixed downslope coordinate
$h$
is plotted at a fixed downslope coordinate
 $x=1~\text{cm}$
(a). Also plotted is the maximum height across the domain (b).
$x=1~\text{cm}$
(a). Also plotted is the maximum height across the domain (b).

Due to a good qualitative match with experimental data, the regularisation method presented in this paper has been shown to give physically realistic results. Similar computations with the depth-averaged
 $\unicode[STIX]{x1D707}(I)$
-rheology of Gray & Edwards (Reference Gray and Edwards2014), such as the simulation of erosion–deposition waves by Edwards & Gray (Reference Edwards and Gray2015), also provide a close match with experiments. However, the waves computed with the depth-averaged rheology often have a flow front which is much steeper than those observed experimentally whereas the two-dimensional computations detailed here have a much rounder shape. It is therefore believed that the two-dimensional incompressible
$\unicode[STIX]{x1D707}(I)$
-rheology of Gray & Edwards (Reference Gray and Edwards2014), such as the simulation of erosion–deposition waves by Edwards & Gray (Reference Edwards and Gray2015), also provide a close match with experiments. However, the waves computed with the depth-averaged rheology often have a flow front which is much steeper than those observed experimentally whereas the two-dimensional computations detailed here have a much rounder shape. It is therefore believed that the two-dimensional incompressible
 $\unicode[STIX]{x1D707}(I)$
-rheology captures the key physical effects that set the free-surface shape. This is important as it suggests that the computation of other flows with complex free-surface shapes are also possible with the methods and model presented here. Furthermore, truly two-dimensional flows, such as the collapse of a column of grains, do not obviously allow for the same approximations which lead to the depth-averaged equations and so the full system is only option for the simulation of these flows.
$\unicode[STIX]{x1D707}(I)$
-rheology captures the key physical effects that set the free-surface shape. This is important as it suggests that the computation of other flows with complex free-surface shapes are also possible with the methods and model presented here. Furthermore, truly two-dimensional flows, such as the collapse of a column of grains, do not obviously allow for the same approximations which lead to the depth-averaged equations and so the full system is only option for the simulation of these flows.
Along with the free-surface shape, another important feature of the granular rollwaves is their dispersion relation. Here this relation between the wavelength and growth rate of the waves is investigated numerically using the regularised rheology in order to provide additional verification that the waves are indeed due to the rollwave instability detailed previously in the literature. Forterre (Reference Forterre2006) found the dispersion relation numerically using the linearised two-dimensional
 $\unicode[STIX]{x1D707}(I)$
equations and an exact expression was derived by Gray & Edwards (Reference Gray and Edwards2014) from the depth-averaged
$\unicode[STIX]{x1D707}(I)$
equations and an exact expression was derived by Gray & Edwards (Reference Gray and Edwards2014) from the depth-averaged
 $\unicode[STIX]{x1D707}(I)$
-rheology. Both of these approaches found the growth rate of perturbations as a function of the frequency of an applied inflow perturbation. However the numerical scheme detailed above allows for the transient behaviour of perturbations of a specific wavelength to be computed rather than at specific frequencies. It is therefore necessary to derive a temporal stability analysis here, rather than the spatial analyses of Forterre (Reference Forterre2006) and Gray & Edwards (Reference Gray and Edwards2014). By making use of the depth-averaged equations an exact functional form can be found.
$\unicode[STIX]{x1D707}(I)$
-rheology. Both of these approaches found the growth rate of perturbations as a function of the frequency of an applied inflow perturbation. However the numerical scheme detailed above allows for the transient behaviour of perturbations of a specific wavelength to be computed rather than at specific frequencies. It is therefore necessary to derive a temporal stability analysis here, rather than the spatial analyses of Forterre (Reference Forterre2006) and Gray & Edwards (Reference Gray and Edwards2014). By making use of the depth-averaged equations an exact functional form can be found.
For uni-directional flow down inclined planes the depth-averaged mass balance of Gray & Edwards (Reference Gray and Edwards2014) is
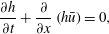 $$\begin{eqnarray}\frac{\unicode[STIX]{x2202}h}{\unicode[STIX]{x2202}t}+\frac{\unicode[STIX]{x2202}}{\unicode[STIX]{x2202}x}\left(h\bar{u}\right)=0,\end{eqnarray}$$
and the momentum balance gives
 $$\begin{eqnarray}h\left(\frac{\unicode[STIX]{x2202}\bar{u}}{\unicode[STIX]{x2202}t}+\bar{u}\frac{\unicode[STIX]{x2202}\bar{u}}{\unicode[STIX]{x2202}x}+g\cos \unicode[STIX]{x1D701}\frac{\unicode[STIX]{x2202}h}{\unicode[STIX]{x2202}x}\right)=hg\cos \unicode[STIX]{x1D701}\left(\tan \unicode[STIX]{x1D701}-\unicode[STIX]{x1D707}\right)+\frac{\unicode[STIX]{x2202}}{\unicode[STIX]{x2202}x}\left(\unicode[STIX]{x1D708}h^{3/2}\frac{\unicode[STIX]{x2202}\bar{u}}{\unicode[STIX]{x2202}x}\right),\end{eqnarray}$$
where
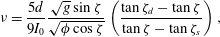 $$\begin{eqnarray}\unicode[STIX]{x1D708}=\frac{5d}{9I_{0}}\frac{\sqrt{g}\sin \unicode[STIX]{x1D701}}{\sqrt{\unicode[STIX]{x1D719}\cos \unicode[STIX]{x1D701}}}\left(\frac{\tan \unicode[STIX]{x1D701}_{d}-\tan \unicode[STIX]{x1D701}}{\tan \unicode[STIX]{x1D701}-\tan \unicode[STIX]{x1D701}_{s}}\right),\end{eqnarray}$$
and
 $\unicode[STIX]{x1D707}$
is the friction coefficient of Pouliquen & Forterre (Reference Pouliquen and Forterre2002). Scaling the flow depth
$\unicode[STIX]{x1D707}$
is the friction coefficient of Pouliquen & Forterre (Reference Pouliquen and Forterre2002). Scaling the flow depth
 $h$
and the downstream coordinate
$h$
and the downstream coordinate
 $x$
by the steady depth
$x$
by the steady depth
 $h_{0}$
, the velocity
$h_{0}$
, the velocity
 $\bar{u}$
by the depth-averaged Bagnold velocity
$\bar{u}$
by the depth-averaged Bagnold velocity
 $\bar{u}_{0}=(2I_{\unicode[STIX]{x1D701}}/5d)\sqrt{\unicode[STIX]{x1D719}g\cos \unicode[STIX]{x1D701}}h_{0}^{3/2}$
and the time by
$\bar{u}_{0}=(2I_{\unicode[STIX]{x1D701}}/5d)\sqrt{\unicode[STIX]{x1D719}g\cos \unicode[STIX]{x1D701}}h_{0}^{3/2}$
and the time by
 $h_{0}/\bar{u}_{0}$
allows for the definition of a Reynolds-like number
$h_{0}/\bar{u}_{0}$
allows for the definition of a Reynolds-like number
 $$\begin{eqnarray}R=\frac{\bar{u}_{0}\sqrt{h_{0}}}{\unicode[STIX]{x1D708}},\end{eqnarray}$$
and the base-state Froude number
 $F=\mathit{Fr}(h_{0})$
from (7.1). It is found that small perturbations
$F=\mathit{Fr}(h_{0})$
from (7.1). It is found that small perturbations
 $({\hat{h}},\hat{u} )$
away from the base-state fields
$({\hat{h}},\hat{u} )$
away from the base-state fields
 $(h_{0},\bar{u}_{0})$
satisfy the linearised equations
$(h_{0},\bar{u}_{0})$
satisfy the linearised equations
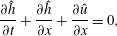 $$\begin{eqnarray}\frac{\unicode[STIX]{x2202}{\hat{h}}}{\unicode[STIX]{x2202}t}+\frac{\unicode[STIX]{x2202}{\hat{h}}}{\unicode[STIX]{x2202}x}+\frac{\unicode[STIX]{x2202}\hat{u} }{\unicode[STIX]{x2202}x}=0,\end{eqnarray}$$
 $$\begin{eqnarray}\displaystyle F^{2}\left(\frac{\unicode[STIX]{x2202}\hat{u} }{\unicode[STIX]{x2202}t}+\frac{\unicode[STIX]{x2202}\hat{u} }{\unicode[STIX]{x2202}x}\right)+\frac{\unicode[STIX]{x2202}{\hat{h}}}{\unicode[STIX]{x2202}x}=\unicode[STIX]{x1D6E4}\left(\frac{3}{2}{\hat{h}}-\hat{u} \right)+\frac{F^{2}}{R}\frac{\unicode[STIX]{x2202}^{2}\hat{u} }{\unicode[STIX]{x2202}x^{2}}, & & \displaystyle\end{eqnarray}$$
where the constants
 $$\begin{eqnarray}\displaystyle & \displaystyle \unicode[STIX]{x1D6E4}=\unicode[STIX]{x1D6FE}\frac{\tan \unicode[STIX]{x1D701}_{d}-\tan \unicode[STIX]{x1D701}_{s}}{(1+\unicode[STIX]{x1D6FE})^{2}},\quad \unicode[STIX]{x1D6FE}=\frac{2\sqrt{\unicode[STIX]{x1D719}}I_{0}h_{0}}{5Fd}. & \displaystyle\end{eqnarray}$$
The system (7.7)–(7.13) has solutions
 $$\begin{eqnarray}\left[\begin{array}{@{}c@{}}{\hat{h}}\\ \hat{u} \end{array}\right]=\exp \left(\text{i}\hat{k}x+\hat{\unicode[STIX]{x1D706}}t\right)\left[\begin{array}{@{}c@{}}\tilde{h}\\ \tilde{u} \end{array}\right],\end{eqnarray}$$
where
 $\hat{k}$
and
$\hat{k}$
and
 $\hat{\unicode[STIX]{x1D706}}$
are the non-dimensional wavenumber and growth rate respectively and
$\hat{\unicode[STIX]{x1D706}}$
are the non-dimensional wavenumber and growth rate respectively and
 $\tilde{h}$
and
$\tilde{h}$
and
 $\tilde{u}$
are constants. As shown in figure 12, the two-dimensional simulations exhibit this behaviour for early times as they grow exponentially. At later times nonlinearity is observed as the waves saturate to a constant height. The dispersion relation, that links the growth rate to wavenumber, is found by substitution of (7.10) into the leading-order momentum balance (7.8) which gives
$\tilde{u}$
are constants. As shown in figure 12, the two-dimensional simulations exhibit this behaviour for early times as they grow exponentially. At later times nonlinearity is observed as the waves saturate to a constant height. The dispersion relation, that links the growth rate to wavenumber, is found by substitution of (7.10) into the leading-order momentum balance (7.8) which gives
 $$\begin{eqnarray}-\text{i}R\hat{\unicode[STIX]{x1D706}}^{2}+\left(2R\hat{k}-\text{i}\hat{k}^{2}-\frac{\text{i}R\unicode[STIX]{x1D6E4}}{F^{2}}\right)\hat{\unicode[STIX]{x1D706}}+\hat{k}^{3}+\left(\text{i}R-\frac{\text{i}R}{F^{2}}\right)\hat{k}^{2}+\frac{5R\unicode[STIX]{x1D6E4}}{2F^{2}}\hat{k}=0.\end{eqnarray}$$
The dispersion relation (7.11) derived from the depth-averaged
 $\unicode[STIX]{x1D707}(I)$
equations plotted as solid lines. Points are the growth rates computed with (7.12) from simulations using the two-dimensional regularised
$\unicode[STIX]{x1D707}(I)$
equations plotted as solid lines. Points are the growth rates computed with (7.12) from simulations using the two-dimensional regularised
 $\unicode[STIX]{x1D707}(I)$
-rheology. Inset is the same curve and points plotted with the non-dimensional variables (7.13).
$\unicode[STIX]{x1D707}(I)$
-rheology. Inset is the same curve and points plotted with the non-dimensional variables (7.13).
The growth rate of the waves in the two-dimensional simulations can be estimated by assuming the form (7.10) is correct for early times. This gives
 $$\begin{eqnarray}\unicode[STIX]{x1D706}=\frac{1}{\max (h)-h_{0}}\frac{\unicode[STIX]{x2202}}{\unicode[STIX]{x2202}t}(\max (h)-h_{0}),\end{eqnarray}$$
as the perturbation magnitude is the difference between the transient flow depth
 $h$
and the steady uniform depth
$h$
and the steady uniform depth
 $h_{0}$
. Averaging over the period for which the growth is linear (e.g.
$h_{0}$
. Averaging over the period for which the growth is linear (e.g.
 $0.5~\text{s}<t<3~\text{s}$
in figure 12) gives the numerical points shown in figure 13. Here the wavenumber is changed by altering the domain length
$0.5~\text{s}<t<3~\text{s}$
in figure 12) gives the numerical points shown in figure 13. Here the wavenumber is changed by altering the domain length
 $L_{x}$
. As the perturbations are seeded with the initial height (7.2) it is possible to transform between the non-dimensional dispersion relation (7.11) and the equivalent dimensional form with
$L_{x}$
. As the perturbations are seeded with the initial height (7.2) it is possible to transform between the non-dimensional dispersion relation (7.11) and the equivalent dimensional form with
 $$\begin{eqnarray}\hat{\unicode[STIX]{x1D706}}=\frac{h_{0}}{\bar{u}_{0}}\unicode[STIX]{x1D706},\quad \hat{k}=\frac{2\unicode[STIX]{x03C0}h_{0}}{L_{x}}.\end{eqnarray}$$
The numerically estimated growth rates match the shape of the theoretical dispersion relation well and crucially match the cutoff frequency accurately. Discrepancies in the magnitude of the growth rates may be attributed to the fact that in order to seed the instability at a certain wavelength, the initial wave amplitude
 $a_{0}$
is required to be close to the final steady amplitude. This means that the simulation captures growth that is naturally far from linear. Unfortunately, making the amplitude smaller would cause complex coarsening dynamics to occur at early times (Razis et al.
Reference Razis, Edwards, Gray and van der Weele2014) which would also affect the calculation of the growth rate.
$a_{0}$
is required to be close to the final steady amplitude. This means that the simulation captures growth that is naturally far from linear. Unfortunately, making the amplitude smaller would cause complex coarsening dynamics to occur at early times (Razis et al.
Reference Razis, Edwards, Gray and van der Weele2014) which would also affect the calculation of the growth rate.
8 Conclusions and discussion
In this paper continuum equations have been developed that are an extension of the
 $\unicode[STIX]{x1D707}(I)$
-rheology of Jop et al. (Reference Jop, Forterre and Pouliquen2006). Unlike the previous formulation, in which the equations are ill posed for high and low inertial numbers, the equations proposed here are well posed for all inertial numbers below an extreme maximum value. This partial regularisation of the incompressible granular flow equations is achieved by changing the functional form of the
$\unicode[STIX]{x1D707}(I)$
-rheology of Jop et al. (Reference Jop, Forterre and Pouliquen2006). Unlike the previous formulation, in which the equations are ill posed for high and low inertial numbers, the equations proposed here are well posed for all inertial numbers below an extreme maximum value. This partial regularisation of the incompressible granular flow equations is achieved by changing the functional form of the
 $\unicode[STIX]{x1D707}(I)$
curve. In the low inertial number limit the functional form is derived directly from the well-posedness condition of Barker et al. (Reference Barker, Schaeffer, Bohorquez and Gray2015). This
$\unicode[STIX]{x1D707}(I)$
curve. In the low inertial number limit the functional form is derived directly from the well-posedness condition of Barker et al. (Reference Barker, Schaeffer, Bohorquez and Gray2015). This
 $\unicode[STIX]{x1D707}(I)$
curve decays logarithmically such that
$\unicode[STIX]{x1D707}(I)$
curve decays logarithmically such that
 $\unicode[STIX]{x1D707}\rightarrow 0$
(rather than
$\unicode[STIX]{x1D707}\rightarrow 0$
(rather than
 $\unicode[STIX]{x1D707}\rightarrow \unicode[STIX]{x1D707}_{s}$
) as
$\unicode[STIX]{x1D707}\rightarrow \unicode[STIX]{x1D707}_{s}$
) as
 $I\rightarrow 0$
. For decelerating planar flow, where moving material comes to rest, this curve is shown to give grid-independent, physically realistic numerical results. For large inertial numbers the proposed curve is justified by experimental measurements of chute flow, which suggest a quadratic dependence of
$I\rightarrow 0$
. For decelerating planar flow, where moving material comes to rest, this curve is shown to give grid-independent, physically realistic numerical results. For large inertial numbers the proposed curve is justified by experimental measurements of chute flow, which suggest a quadratic dependence of
 $\unicode[STIX]{x1D707}$
on
$\unicode[STIX]{x1D707}$
on
 $I$
. High inclination angle numerical simulations are presented which show that this curve predicts a uniform inertial number unlike the catastrophic pressure waves that form with the unregularised model. Due to these favourable mathematical properties and the good fit with experimental data, this form of regularisation is not simply a numerical trick, but represents a clear and physically motivated improvement to the previous theory.
$I$
. High inclination angle numerical simulations are presented which show that this curve predicts a uniform inertial number unlike the catastrophic pressure waves that form with the unregularised model. Due to these favourable mathematical properties and the good fit with experimental data, this form of regularisation is not simply a numerical trick, but represents a clear and physically motivated improvement to the previous theory.
As well as flows which converge on uniform thickness constant inertial number solutions, simulations of granular rollwaves are also detailed here. These waves are due to a flow instability which occurs when the Froude number is above a critical value and causes uniform thickness inclined flows to develop into travelling waves with a steep front and elongated tail. Numerical computations with the regularised rheology reveals that these waves have a range of inertial numbers with some regions in the previously ill-posed regime. As the results of these calculations are a close match with experimental measurements and the depth-averaged model of Gray & Edwards (Reference Gray and Edwards2014), the proposed equations are found to capture many of the important physical features of real world liquid-like granular flows. It is therefore hoped that in the future many other transient flows in complex geometries can be reliably and accurately studied with this regularised rheology.
Future studies must also focus on the underlying physical basis of the proposed extensions to the
 $\unicode[STIX]{x1D707}(I)$
curve. In the low inertial number limit, the lower values of
$\unicode[STIX]{x1D707}(I)$
curve. In the low inertial number limit, the lower values of
 $\unicode[STIX]{x1D707}$
are similar to those predicted by non-local models yet our curve is uniquely defined and not geometry dependent. Similarly in the large inertial number limit the trend that
$\unicode[STIX]{x1D707}$
are similar to those predicted by non-local models yet our curve is uniquely defined and not geometry dependent. Similarly in the large inertial number limit the trend that
 $\unicode[STIX]{x1D707}$
is linear in
$\unicode[STIX]{x1D707}$
is linear in
 $I$
is similar to kinetic theory, but there is no explicit dependence on the volume fraction or particle restitution coefficient. It is therefore of great interest if this theory is in some sense a reflection of the physics captured by those models in appropriate limits.
$I$
is similar to kinetic theory, but there is no explicit dependence on the volume fraction or particle restitution coefficient. It is therefore of great interest if this theory is in some sense a reflection of the physics captured by those models in appropriate limits.
Acknowledgements
This research was supported by EPSRC grants EP/I019189/1, EP/K00428X/1, EP/M022447/1 and Royal Society grant WM150058. J.M.N.T.G. is a Royal Society Wolfson Research Merit Award holder and an EPSRC Established Career Fellow. All research data supporting this publication are directly available within this publication.
Supplementary movie
Supplementary movie is available at https://doi.org/10.1017/jfm.2017.428.


 Open access