1.1 The Process of Urbanisation in the World
Urbanisation is the process of a population shift from rural areas to cities, often motivated by economic and social factors. In many countries, it is the national strategy for societal development and is a process of multi-layer structural change involving environment, economy, society, population, and change of system. Urbanisation is relevant to a range of disciplines, including engineering, geography, sociology, economics, urban planning, and public health. In many perceptions, the phenomenon has been closely linked to modernisation, industrialisation, and the sociological process of rationalisation. Urbanisation can be seen as a specific condition at a set time (e.g., the proportion of total population or area in cities or towns) or as an increase in that condition over time. So urbanisation can be quantified either in terms of, say, the level of urban development relative to the overall population or as the rate at which the urban proportion of the population is increasing. Urbanisation creates enormous social, economic, and environmental changes, which provide an opportunity for sustainability with the “potential to use resources more efficiently, to create more sustainable land use and to protect the biodiversity of natural ecosystems (Cohen, Reference Cohen2015).” It can also give rise to challenging pressures, within relatively small geographical areas, both by high demand for natural resources and by releasing back to the environment waste products that cannot be adequately treated (Jimenez, Reference Jimenez, Jimenez and Rose2008, Reference Jimenez, Feyen and Neville2009b).
Urbanisation is not merely a modern phenomenon, but a rapid and historic transformation of human social roots on a global scale, whereby predominantly rural culture is being rapidly replaced by predominantly urban culture. The first major change in settlement patterns was the accumulation of hunter-gatherers into villages many thousand years ago. Village culture is characterised by common bloodlines, intimate relationships, and communal behaviour, whereas urban culture is characterised by distant bloodlines, unfamiliar relations, and competitive behaviour. This unprecedented movement of people is forecast to continue and intensify during the next few decades, mushrooming cities to sizes unthinkable only a century ago.
Urbanisation has manifested differently in various civilisations. For instance, in the 16th century while London and Paris had between 10,000 and 15,000 people, at the same time the Tenochtitlan, the capital of the Aztec Empire in Mexico, before it was conquered by the Spanish and “modernised,” had 400,000 inhabitants. Paris and London were experiencing already pollution challenges and inequity in social development, while in Tenochtitlan pollution did not exist as everything was reclaimed, water was used wisely, and poverty and its associated problems were not existent (Jimenez, Reference Jimenez and Grabow2009a). This shows that cities in different models of social development can truly be different.
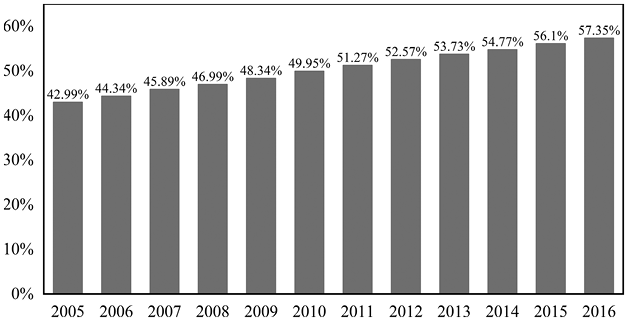
Indeed, in experiencing urbanisation, the developed and developing countries have different routes and modes of development. However, there is a tendency to follow in all of the economic factors defined by a limited number of social groups and countries. During the last century, global populations have urbanised rapidly: in 1900, 13% of people lived in urban environments; however, in 1950, 29% of people lived in urban environments (Dewan, Reference Dewan2013). Moreover, urbanisation is still increasing globally. The most urbanised region is Latin America with 81% of its population living in cities in 1987 (more than 260 million of people, Statistica, 2021). Asia is also a highly urbanised region. In China, for example, in the 21st century, urbanisation has entered a new developmental period, and the urbanisation rate (the percentage of urban population) increased from 12.5% in 1952 to 57.35% in 2016. Figure 1.1 represents the degree of urbanisation in China from 2005 to 2016 (National Bureau of Statistics, PRC, 2006–2017).

Figure 1.1 Degree of urbanisation in China from 2005 to 2016
Figure 1.1Long description
Urbanisation degree bar chart of China from 2005 to 2016. Each bar represents a specific year with corresponding percentage values indicating urbanisation levels. The percentages range from 42.99% in 2005 to 57.35% in 2016, illustrating a steady increase over the years.
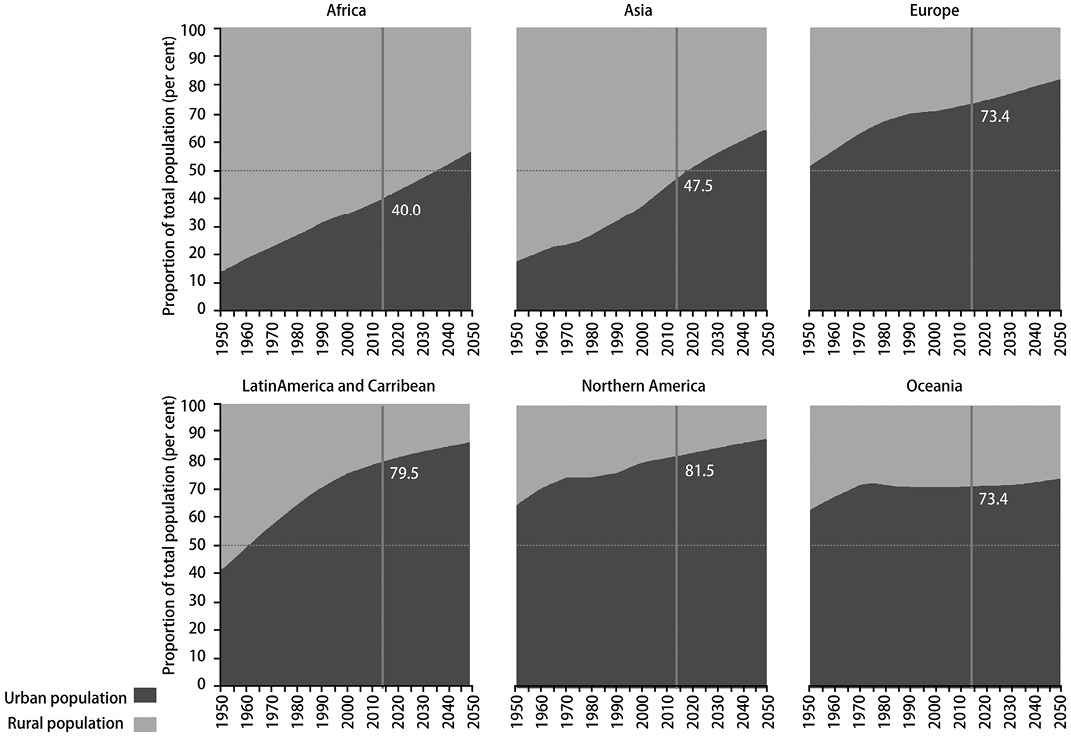
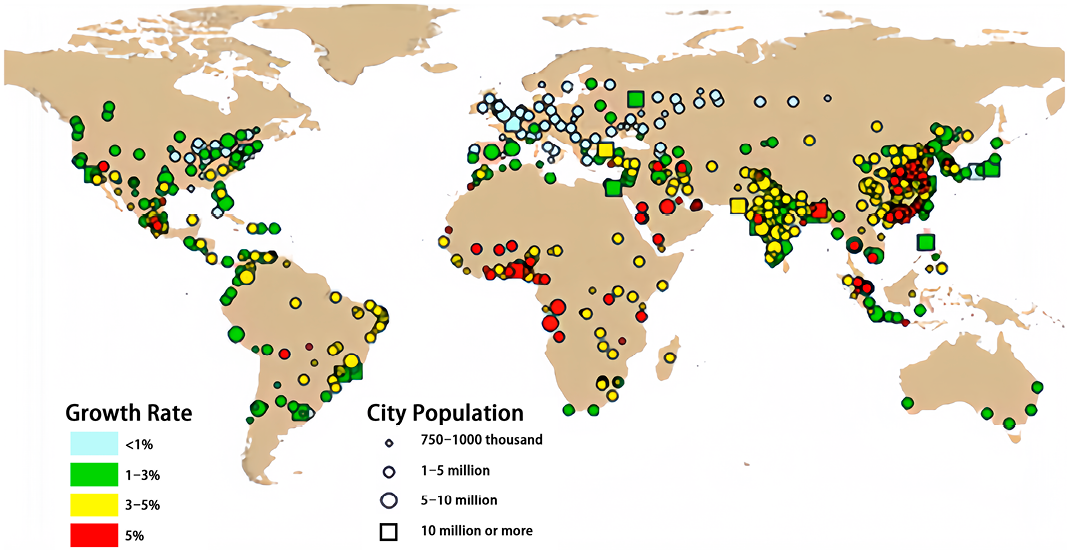
It is predicted that the urbanisation rate in China would continue to rise. The expectation is that, if unabated, urbanisation’s negative impacts on the natural ecosystems and the environment would become widespread and much more severe (Jia et al., Reference Jia, Yao and Yu2013; Dewan, Reference Dewan2013). Figure 1.2 (Department of Economic and Social Affairs of the United Nations Secretariat, 2014) and Figure 1.3 (Department of Economic and Social Affairs of the United Nations, 2018) show the percentage of world population from 1950 to 2050, by major cities, and the growth rates of urban agglomerations in 1990–2018, respectively.

Figure 1.2 Urban and rural population graph as proportion of total population by major areas, 1950–2050
Figure 1.2Long description
Urban and rural population graph as proportions of total population from 1950 to 2050 across Africa, Asia, Europe, Latin America and the Caribbean, Northern America, and Oceania. Each region is represented by a separate chart. Key percentages for 2020 are highlighted: Africa at 40.0%, Asia at 47.5%, Europe at 73.4%, Latin America and the Caribbean at 79.5%, Northern America at 81.5%, and Oceania at 73.4%.

Figure 1.3 Growth rates of urban agglomerations, 1990–2018
Figure 1.3Long description
Global map of urban agglomeration growth rates from 1990 to 2018. Circles indicate city populations, with sizes representing different population ranges: 750– 1,000, 1–5 million, 5–10 million, and 10 million or more. Growth rates are color coded: <1%, 1–3%, 3–5 %, and 5 %. The regions with the fastest growth of cities are mostly in South and Southeast Asia.
If properly managed, urbanisation can lead to social and economic progress. First, it can increase food production due to high demand. When more people move from rural to urban areas in search of better job opportunities, food production significantly increases to feed the population. Besides, cities are tremendously efficient in certain ways. For instance, imagine 50 families living in 50 separate houses spread out evenly over a large piece of land. If these families were to stay in housing (apartments, flats, condos etc.) within the same building or in a complex of buildings, it would require less effort and resources to supply social amenities such as water and energy. In addition, in urban areas, waste removal is efficient, and access to health, social services, cultural events, and education is easy. The same is true in the case of transportation. Cities tend to invest in mass transport making movement fluent and easy, which is not the case in rural areas, where transportation without private means is nearly impossible (Nowak, Reference Nowak1997).
1.2 Urban Water Challenges Worldwide
Urbanisation can lead to social and economic progress, but it also puts pressure on cities to provide infrastructure and social services. It thus brings negative impacts to natural ecosystems and the environment, especially urban hydrology, for which the negative effects include urban flooding, water shortage, water pollution, and other water-related ecological environment problems.
1.2.1 Urban Flooding
Over the past few years, many cities around the world have experienced disastrous floods, notably, at least five major floods ravaged Queensland and Victoria in Australia during 2010–2011 (DFO, 2012; Wilby and Keenan, Reference Wilby and Keenan2012). The Indian commercial capital, Mumbai, experienced an unprecedented flood in 2005 that resulted in the estimated damages of around US$2 billion and 500 fatalities (Gupta, Reference Gupta2007; Ranger et al., Reference Ranger, Hallegatte, Bhattacharya, Bachu, Priya, Dhore, Ra fique, Mathur, Naville, Henriet, Herweijer, Pohit and Corfee-Morlot2011). Floods in New Orleans, the United States, in 2005 engulfed 80% of the city and resulted in enormous damage (Bizimana and Schilling, Reference Bizimana and Schilling2010). In 2012, Beijing, China, suffered a severe flood that resulted in a damage of about US$2 billion and 79 fatalities. Recently, in 2017, Texas-Houston experienced an unprecedented flood that caused severe waterlogging for the whole city and serious economic losses.
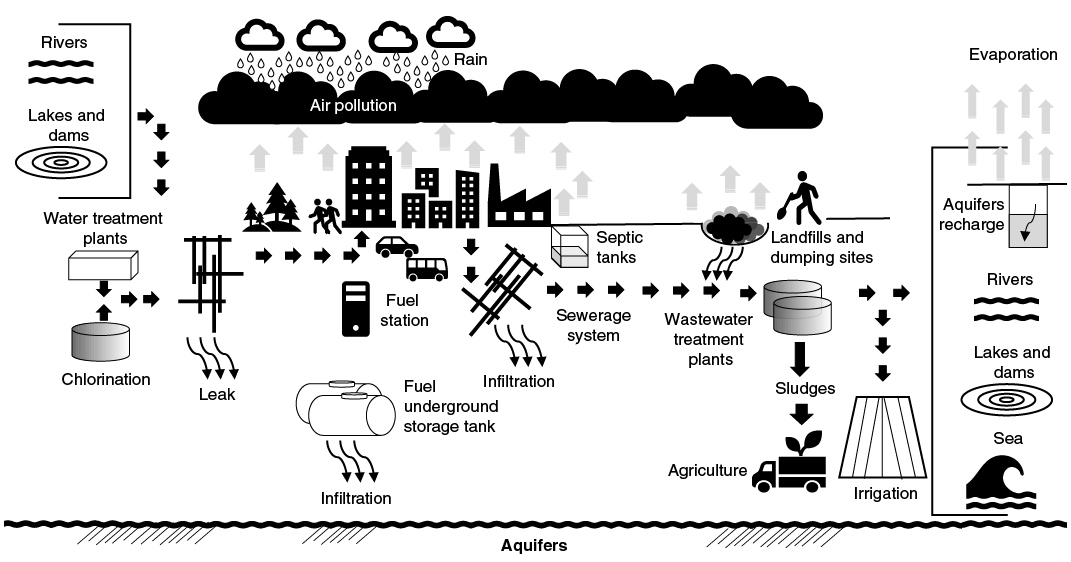
Excessive urban runoff caused by the dramatic increases of urbanisation, which is mainly caused by the increase of impervious areas (such as parking lots, buildings, and roads) (Marsalek et al., Reference Marsalek, Jimenez, Malmquist, Karamouz, Goldenfum and Chocat2007; Kundzewicz et al., Reference Kundzewicz, Hirabayashi and Kanae2010), is causing flooding in urban areas and urban water quality deterioration in receiving water bodies and even economic losses (such as agricultural losses, urban and rural resident property losses, and hydraulic infrastructure losses). Urbanisation has called for a new hydrological concept called the urban water cycle (Figure 1.4). Globally, floods account for more than 55% of all fatalities with nearly 2.5 billion people affected (EM-DAT, 2012) and more than 30% of global economic losses from natural disasters. In China, according to a survey of 351 cities in China by the Ministry of Housing and Urban-Rural Development in 2010, about 62% of cities had encountered flooding events from 2008 to 2010. Among these cities, nearly 63% encountered more than three flooding disasters. During the periods of flooding, the standing waters were appeared in low-lying areas. The depth of standing water exceeded 50 cm in more than 74.6% of the cities, and the duration of standing water exceeded 0.5 hours in 78.9% of the cities (Jia et al., Reference Jia, Yao and Yu2013).

Figure 1.4 The urban water cycle, from Marsalek, Reference Marsalek, Jimenez, Malmquist, Karamouz, Goldenfum and Chocat2007
Figure 1.4Long description
Diagram of the urban water cycle illustrating various stages and components. Key elements are: (a) water entries including rain falling onto urban areas, rivers, lakes, dams that are used as a supply for water; (b) water exits including the evaporation and any water body that is used as a discharging site such as rivers, lakes, dams and the sea, the recharge of aquifers with used water; (c) water processes such as water treatment plants for surface water and chlorination for aquifers water; and (d) sources of pollution such as air pollution dragged by rainfall, leaks from gas stations, septic tanks, sewage systems, effluent of wastewater treatment plants that is discharged into the environment, lixiviation from landfills, dumping sites, disposal of sludge coming from wastewater treatment plants, agriculture irrigation. Arrows indicate the flow of water through different processes and locations. It also highlights the de facto reuse of water.
Most of the available information on floods combines the effects of both urban and plain floods. Urban flooding has significant economic implications for affected neighbourhoods. In the United States, industry experts estimate that wet basements can lower property values by 10–25% and are cited among the top reasons for not purchasing a home (Center for Neighbourhood Technology, 2013). According to the US Federal Emergency Management Agency (FEMA), almost 40% of small businesses never reopen their doors following a flooding disaster.
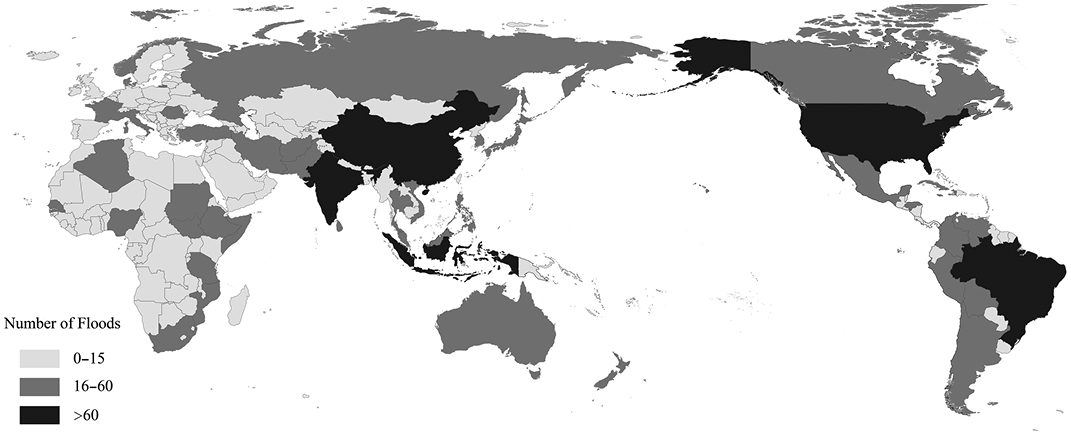
A flood in Bangkok, Thailand, lasted for 175 days, took 815 lives, and caused about US$45.7 billion in damage (World Bank, 2011). Moreover, as reported, an average of 500,000 people per year are affected by floods in West Africa alone (Douglas et al., Reference Douglas2009). Meanwhile, the projected average annual population to be affected by river floods is around 21 million people worldwide and is likely to rise to 54 million by 2030. Because of the increasing damages and unacceptably high numbers of injuries, floods have become the public concern worldwide. Aggravated urban water challenges and vulnerabilities to flood risk pose great problems for policymakers worldwide. Figure 1.5 shows the number of occurrences of flood disasters by country from 1974 to 2003 (Guhasapir, Reference Guhasapir, Hargitt and Hoyois2004).

Figure 1.5 Number of occurrences of flood disasters by country: 1974–2003
Figure 1.5Long description
Global map of the number of flood occurrences by country from 1974 to 2003. The map indicates flood frequency in countries, specifically those with high flood occurrences such as Asia, Africa, and the Americas. Regions experiencing 0–15 floods, 16–60 floods and over 60 floods have been prominently indicated with different shades.
The vulnerability of megacities to floods, particularly in developing nations, is exacerbated due to rapid urban expansion, increasing concentration of population and property, rampant poverty, physical location, and poor-quality housing (Kubal et al., Reference Kubal, Haase, Meyer and Scheuer2009; Suriya and Mudgal, Reference Suriya and Mudgal2012).
The degree of vulnerability to natural hazards is likely to increase exponentially (Sharma et al., Reference Sharma, Surjan, Shaw, Sharma, Surjan and Shaw2011). A recent study indicated that, due to weaknesses in the adopted disaster preparedness system, communities’ capacity to cope with extreme events is being reduced in many Asian megacities (Osti et al., Reference Osti, Hishinuma, Miyake and Inomata2011), and it is expected to worsen. Further, the dynamics of the socioeconomic system that results from global change, development practice, and political instability could lead to more frequent and disastrous floods if disasters risk management is not mainstreamed into the planning process of these megacities (Adger, Reference Adger2006).
Many of the largest cities are exposed to more than one type of flood hazard. For example, the largest megacity in the world, Tokyo, is susceptible to cyclones and floods. Of the natural hazards analysed, estimates show that at least 233 cities across the globe are at a high risk of flooding, potentially affecting 663 million people. Some recent catastrophes include the inundations of Nîmes and Vaison-la-Romaine, the flooding of New Orleans, the flooding of Beijing, and the flooding in Rockhampton. Flood flows in urban environments have been studied relatively recently despite many centuries of experiencing flood events (Brown et al., Reference Brown, Chanson, McIntosh and Madhani2011). Urban floods can exist even in elevated, mountainous areas, as was the case in Mexico City, with impacts not only on the infrastructure but also on the quality of the water that is used as supply (Jiménez Cisneros et al., Reference Jiménez Cisneros, Navarro González and Montes Rojas2017). Some recent research has even considered criteria for safe evacuation of individuals in flooded areas.
Floods are the most costly and debilitating natural hazards in the world. To save lives and property, flood management has been heavily dominated by engineering solutions. Although a degree of success has been reported, flood still remains an inordinate threat to people, and it is blamed for environmental degradation across the country (DFO, 2012).
1.2.2 Water Shortage
As previously mentioned, with the rapid development of urbanisation, the number of people living in the urban areas increased significantly and the water consumption rose sharply. Therefore, the groundwater has been over-mined, and the groundwater funnels increased. At the same time, the increased impervious area has cut off the water to replenish the groundwater and so on, causing the urban water shortage. For some countries, the percentage of people lacking adequate water supplies exceeds well over half of their total populations. As a result, many, especially the very young, die (Loucks and Jia, Reference Loucks and Jia2012). In addition, the supply shortage has resulted in conflicts between countries, created prolonged drought, closing of industrial units, shifting of local inhabitants and so on. In the past decade, progress has been made in providing more people with access to clean drinking water and basic sanitation (UNESCO, 2009). But a major effort is still required to extend these essential conditions to those still without them; the vast majority of them are poor and cannot pay the costs of these basic services.
How can one allocate water supplies optimally among all demands that impact the quality of, or even the existence of, life – both human and ecosystem life – in times of critical resource scarcity (UNDESA, 2014)? A general precise answer that fits all circumstances is never clear. By 2025, an estimated 3.4 billion people will be living in countries defined as water scarce. Many in those countries seem to be able to survive on as little as 3 L per day per person although WHO recommends a minimum of 100 L/person per day to have enough water to drink and provide the supply for other basic water needs. However, it takes about 3,000 L of water to produce a daily ration of food (Loucks and Jia, Reference Loucks and Jia2012), about 1,000 times what it is minimally need for dietary purposes. A substantial portion of our food comes from irrigated lands. On average over 70% of total freshwater use in the world is devoted to irrigation. Over the next 30 years, about 70% of grains used in cereal production are expected to come from irrigated land (UNESCO, 2009).
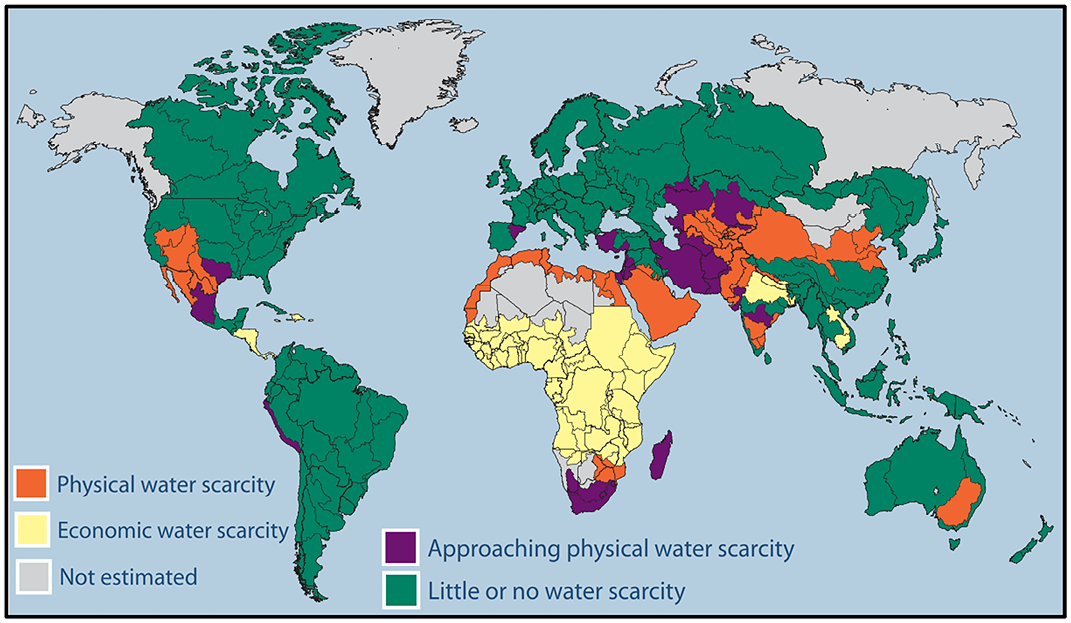
The physical evidence of increasing periods of water scarcity can be found almost everywhere in the world. Water scarcity (Figure 1.6) affects rich and poor countries alike; however, the lower income class, in both cases, is the one who suffers the most. Nearly three billion people live in water scarce conditions (over 40% of the world’s population), and this situation could worsen if current population growth trends continue, and if the melting of some of the major sources of water – the glaciers – continues too (Loucks and Jia, Reference Loucks and Jia2012). The manifestations of pervasive water poverty include millions of deaths every year due to malnourishment and water-related diseases, political conflict over scarce water resources, extinction of freshwater species, and degradation of aquatic ecosystems. Roughly half of all the world’s wetlands have already been lost and dams have seriously altered the flow of roughly 60% of the world’s major river basins (Davis, Reference Davis2007). The situation only worsens with time and urbanisation. In China, over 20% of the world’s population is found but there is only about 7% of the world’s freshwater runoff and approximately 400 of 600 cities are facing a water shortage challenge. China had a per capita water of 2079 m3, while the world average was 6225 m3. In addition, the economic losses caused by urban water shortage was 200 billion yuan/year (University of Seoul & Seoul Waterworks Authority, 2017), which is about 27 billion US$/year. Water pollution, over-exploitation of underground water, and low efficiency of water usage along with water shortages have continuously deepened the imbalance between water supply and demand in China (Loucks and Jia, Reference Loucks and Jia2012).

Figure 1.6 Global physical and economic water scarcity
Figure 1.6Long description
World map illustrating global physical and economic water scarcity. Dark regions indicate approaching physical water scarcity, while lighter areas denote physical water scarcity. Light regions signify economic water scarcity, and white represents regions where data is not estimated.
Water shortage has brought about many negative impacts on the environment, including lakes, rivers, wetlands, and other freshwater resources. The resulting water overuse that is related to water shortage, often located in the areas of irrigation agriculture, harms the environment in several ways including increased salinity, nutrient pollution, and the loss of floodplains and wetlands (United Nations Development Programme, 2006). Furthermore, water shortage makes flow management in the rehabilitation of urban streams problematic (Lawrence et al., Reference Lawrence, Pavia, Kaing, Bischel, Luthy and Resh2014). Through the last hundred years, more than half of the Earth’s wetlands have been destroyed and have disappeared (WWF, 2013). These wetlands are important not only because they are the habitats of numerous inhabitants such as mammals, birds, fish, amphibians, and invertebrates, but they support the growing of rice and other food crops as well as provide water filtration and protection from storms and flooding. Freshwater lakes such as the Aral Sea in central Asia have also suffered. Once the fourth largest freshwater lake, it has lost more than 58,000 km2 of area and vastly increased in salt concentration over the span of three decades (WWF, 2013). Subsidence, or the gradual sinking of landforms, is another result of water shortage. The US Geological Survey estimates that subsidence has affected more than 44,029 km2 in 45 US states, 80% of it due to groundwater usage. In some areas east of Houston, Texas, the land has dropped by more than 9 feet (2.74 metres) due to subsidence. Brownwood, a subdivision near Baytown, Texas, was abandoned due to frequent flooding caused by subsidence and has since become part of the Baytown Nature Center.
1.2.3 Water Pollution
In the urbanisation process, many types of open land (such as forest and agricultural land) as well as water bodies are transformed into impervious surfaces. This process alters the water balance by promoting polluted runoff at the expense of infiltration (Jia et al., Reference Jia, Yao and Yu2013). Usually, urban development negatively impacts water quality in three ways. First, many of the new materials and components used in land development contribute to higher pollutant loads during the episodes of rainfall and the subsequent runoff. Second, the natural filtering action of wild vegetation (trees, bushes, tall grasses, etc.) is replaced by concrete, asphalt, and rooftops, which offer little means for water quality improvement (Jia et al., Reference Jia, Yao and Yu2013). Larger impervious areas lead to higher levels of more diverse pollutants, diminished pollutant removal during overland flow, reduced infiltration, and greater runoff peak flows, which, in turn, can increase stream erosion. Most traditional pollutants found in urban runoff include suspended solids, nutrients, and heavy metals. Table 1.1 shows the typical pollutant concentrations in urban runoff for different land uses (Jia et al., Reference Jia, Yao and Yu2013).

Table 1.1Long description
Table showing typical pollutant concentrations in urban runoff for different land uses. Rows list pollutants and columns indicate median event mean concentrations for residential, mixed, and commercial land uses. Pollutants include chemical oxygen demand, total suspended solids, total Kjeldahl nitrogen, nitrate and nitrite, total phosphorus, total lead, and total zinc. Concentrations vary by land use type.
In urban areas, greater overland flows from impervious areas increase the erosion rates of nearby soils and the amount of dust on impervious surfaces. Loss of vegetation eliminates the possibility of attenuation of suspended solids and results in total suspended solids levels that range from tens to hundreds of milligrams per litre in urban runoff (Jia et al., Reference Jia, Yao and Yu2013). Fertilisers are applied to managed grass and other landscaped areas. If not managed properly, nutrients readily wash from these lawns. Nitrate deposition from automobile NOx emissions also becomes part of the runoff flows. In high-density residential areas, wastes from pets (if not cleaned up) and other urban animals are washed away by rainfall and add significant organic and pathogen loadings. Moreover, many toxic compounds also exist in urban runoff. Heavy metals, such as lead and zinc, are released from automobiles through brake and tire wear, as are corroded and weathered paints, coatings, decorative flashing, galvanised materials, and structural components (Councell et al., Reference Councell, Duckenfield, Landa and Callender2004; Li et al., Reference Li, Shen, Tian, Liu and Qiu2012). Motor oil, fuel, gear fluids, and coolants from vehicles are readily washed from impervious surfaces. Numerous toxic hydrocarbons and their oxidised products, which may persist in the environment, are also present in these fluids. Polycyclic aromatic hydrocarbons (PAHs) may be found in leaking fluids, incompletely combusted fuel in atmospheric deposits, and asphaltic products used in roofing and pavements. Various herbicides and insecticides are frequently used to control weeds and damage from insects in green urban areas. Again, without careful, controlled application, excess pesticides will leach from the application areas. Some of these pollutant sources are unavoidable with current practices, but the development focussed on the water runoff issues can reduce the impacts on the environment (Jia et al., Reference Jia, Yao and Yu2013). The impacts of cities and floods on water quality have been described by Jimenez and Rose (Reference Jimenez and Rose2009), just as, under the framework of climate change, the effects of extreme rain events and floods on water quality have been presented by Jiménez Cisneros et al. (Reference Jiménez Cisneros, Oki, Arnell, Benito, Cogley, Döll, Jiang, Mwakalila, Field, Barros, Dokken, Mach, Mastrandrea, Bilir, Chatterjee, Ebi, Estrada, Genova, Girma, Kissel, Levy, MacCracken, Mastrandrea and White2014).
The third way cities impact water quality is through the leakages of their many underground networks. These networks of course convey “potable” water, but there are other networks transporting sewage, and, in some cities, even oil and gasoline. Underground tanks used to store different kind of fluids are as well a source of pollution to aquifers that are used to fed cities. Pollution seepage to aquifers is increased during urban floods (Jimenez and Rose, Reference Jimenez and Rose2009).
1.2.4 Other Water-Related Ecological Environment Problems
1.2.4.1 Ecological Degradation
Urban development results in multiple stressors that can degrade aquatic ecosystems by altering the hydrology, habitat, and water quality of urban rivers (Figure 1.7) (Cappiella et al., Reference Cappiella, Stack, Fraley-McNeal, Lane and McMahon2012). Results of the previous investigation found that no single environmental factor was universally important in explaining why the health of rivers declines as levels of urban development increases. Changes in the condition of the aquatic biologic communities from urban development were related in varying degrees to alterations in hydrology, habitat, and water quality.
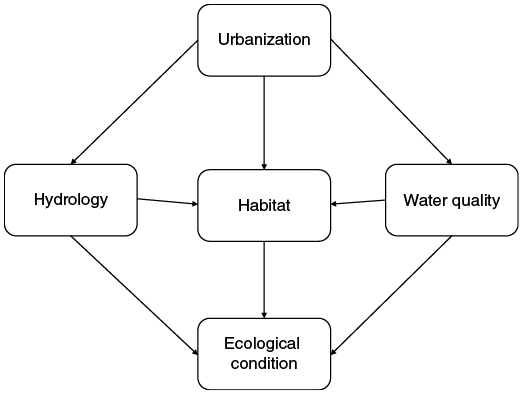
Figure 1.7 Stressors of aquatic ecosystem degradation by urbanisation
For the change in hydrology caused by urban development, it is obvious that urban development could typically increase the amount of water entering a stream after a storm and decrease the time that it takes for the water to travel over altered land surfaces before entering the stream. These factors can lead to stream flashiness and altered stream channels. Additionally, rapid runoff reduces the amount of water available to infiltrate the soil and recharge the aquifers, which often results in lower sustained stream flows (Jia et al., Reference Jia, Yao and Yu2013). Habitats can be severely degraded when urban development occurs along riverbanks, such as where a stream has been straightened by channelisation or where manmade structures have replaced natural riparian vegetation. Furthermore, urban development that occurs throughout a watershed can result in a degraded habitat within a stream channel through flow alteration and sediment erosion. Water quality deterioration is another important factor that contributes to ecological degradation. As described earlier, the concentration of contaminants, including nitrogen, chloride, insecticides, and PAHs, increased with urban development. The changed chemistry brings negative impacts to the aquatic biota, as most contaminants have toxic effects on biologic communities.
Under the impact of changes in hydrology, habitat, and water quality caused by urban development, ecological degradation is observed. Generally, it may result in a shift in the species composition of the algal, invertebrate, and fish communities. The most consistent change in any of the biological communities was the loss of sensitive invertebrate species and a shift to a community with a higher percentage of species more tolerant to physical and chemical stressors (Jia et al., Reference Jia, Yao and Yu2013).
A loss in the numbers of aquatic insect species that occurred in the orders Ephemeroptera (mayflies), Plecoptera (stoneflies), and Trichoptera (caddisflies) (EPT) was a common response in all study areas where urban development occurred in forested watersheds (Jia et al., Reference Jia, Yao and Yu2013). The number of EPT species is a biological-condition metric that is used in many biomonitoring programmes across the country because it is sensitive to stressors from environmental degradation (Wang and Kanehl, Reference Wang and Kanehl2003); reduction of more than 50% of EPT species was observed in some study areas as the percentage of urban development increased in the watersheds from low to high levels (Cappiella et al., Reference Cappiella, Stack, Fraley-McNeal, Lane and McMahon2012).
Studies have indicated that modifications in stream ecology occur when the proportion of impervious area is only a few percentage. Once the impervious portion reaches 10–30%, researchers see major declines in habitat and water-quality indicators (Wang et al., Reference Wang, Lyons, Kanehl and Bannerman2001). In addition to aquatic ecosystem degradation, terrestrial ecosystems are also affected by urbanisation. Converting “natural” land, such as forest, to residential or commercial use drastically changes its ecological characteristics. Vegetation is uprooted and replaced by impervious surfaces – rooftops, driveways, roadways, parking lots, and sidewalks. Even the remaining vegetated areas in residential developments tend to be smoothed, and small water storage depressions are eliminated. Diverse plant species are replaced with monoculture grasses that are regularly cut short and may be inundated with fertilisers and pesticides. In this way, the ecosystem service values decline. Ecological degradation in urban areas also aggravates the heat island effect of cities (Jia et al., Reference Jia, Yao and Yu2013).
1.2.4.2 Urban Heat Islands
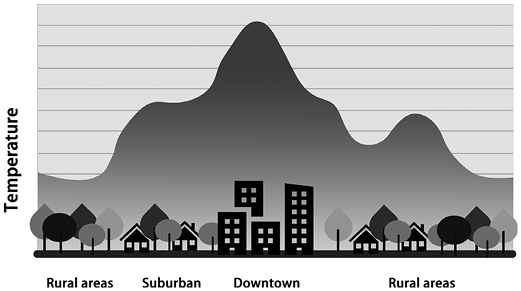
Urban heat island (UHIs) is another ecological environment problem caused by urbanisation. Urban heat island is an urban area or metropolitan area that is significantly warmer than its surrounding rural areas due to human activities. The temperature difference usually is larger at night than during the day, and is most apparent when winds are weak. Urban heat island is most noticeable during the summer and winter. This effect was first described for Mexico City (Jauregui, Reference Jauregui1997). The main cause of the UHI effect is from the modification of land surfaces (Solecki et al., Reference Solecki, Rosenzweig, Parshall, Pope, Clark, Cox and Wiencke2005). The UHIs are formed when industrial and urban areas replace and reduce the amount of land covered by vegetation or open soil (Huang and Lu, Reference Huang and Lu2015). In rural areas, the ground helps regulate temperatures by using a large part of the incoming solar energy to evaporate water in vegetation and soil (Joshi et al., Reference Joshi, Raval, Pathak, Prajapati, Patel, Singh and Kalubarme2015). This evaporation, in turn, has a cooling effect. However, in cities, where less vegetation and exposed soil exists, the majority of the Sun’s energy is absorbed by urban structures and asphalt (Ren et al., Reference Ren, Parker, Ren and Dunn2015). During the day, cities experience higher surface temperatures because urban surfaces produce less evaporative cooling. Additional city heat is given off by vehicles and factories, as well as industrial and domestic heating and cooling units. Together, these effects can raise city temperatures by or 1°C up to 10°C (Figure 1.8) (Jimenez, Reference Jimenez, Feyen and Neville2009b; Kershaw et al., Reference Kershaw, Sanderson, Coley and Eames2010). There are concerns raised about possible contribution from UHIs to global warming. Research in China (Huang and Lu, Reference Huang and Lu2015; Ren et al., Reference Ren, Parker, Ren and Dunn2015) and India (Joshi et al., Reference Joshi, Raval, Pathak, Prajapati, Patel, Singh and Kalubarme2015) indicates that UHI effect contributes to climate warming by about 30%.

Figure 1.8 The temperatures of rural, commercial, urban residential, and suburban residential areas
Aside from the effect on temperature, UHIs can produce secondary effects on local meteorology, including the altering of local wind patterns, the development of clouds and fog, the humidity, and the rates of precipitation. The extra heat provided by the UHI leads to greater upward motion, which can induce additional shower and thunderstorm activity. In addition, the UHI creates during the day a local low-pressure area where relatively moist air from its rural surroundings converges, possibly leading to more favourable conditions for cloud formation (Chiel et al., Reference Chiel, Heerwaarden and Vilà-Guerau de Arellano2008). Rainfall rates downwind of cities are increased between 48% and 116%. Partly, as a result of this warming, monthly rainfall is about 28% greater between 20 miles (32 km) to 40 miles (64 km) downwind of cities, compared with upwind. Some cities show a total precipitation increase of 51% (Goddard Space Flight Center, 2008). One of the main effects of the heat island phenomenon in cities is to form well-localised heavy rains in cities producing an amount of water that cannot be handled by urban sewers (Jiménez Cisneros et al., Reference Jiménez Cisneros, Oki, Arnell, Benito, Cogley, Döll, Jiang, Mwakalila, Field, Barros, Dokken, Mach, Mastrandrea, Bilir, Chatterjee, Ebi, Estrada, Genova, Girma, Kissel, Levy, MacCracken, Mastrandrea and White2014). Research has been done in a few areas suggesting that metropolitan areas are less susceptible to weak tornadoes due to the turbulent mixing caused by the warmth of the UHI.
UHIs also impair water quality. Hot pavement and rooftop surfaces transfer their excess heat to stormwater, which then drains into storm sewers and raises water temperatures as it is released into streams, rivers, ponds, and lakes. Additionally, increased urban water body temperatures lead to a decrease in diversity in the water (Chen et al., Reference Chen, Kusaka, Bornstein, Ching, Grimmond, Grossman-Clarke, Loridan, Manning, Martilli, Miao, Sailor, Salamanca, Taha, Tewari, Wang, Wyszogrodzki and Zhang2011). In August 2001, rains over Cedar Rapids, Iowa led to a 10.5°C (18.9°F) rise in the nearby stream within one hour, which led to a fish kill. Since the temperature of the rain was comparatively cool, it could be attributed to the hot pavement of the city. Similar events have been documented across the American Midwest, as well as Oregon and California (Paul and Gene, Reference Paul and Gene2011). Rapid temperature changes can be stressful to aquatic ecosystems. Permeable pavements may mitigate these effects by percolating water through the pavement into subsurface storage areas where it can be dissipated through absorption and evaporation (USEPA, 2013).