


Progress in the management of neuromuscular diseases has improved life expectancy; an increasing number of patients with Duchenne muscular dystrophy (DMD) are living to late adolescence and adulthood. Obesity affects more than half of 13-year-old boys with DMD(Reference Davidson and Truby1–Reference Willig, Carlier and Legrand3) and can worsen difficulties with locomotion(Reference Willig, Bach and Venance4). On the other hand, adolescents and adults with DMD frequently experience feeding difficulties and underweight(Reference Davidson and Truby1–Reference Griffiths and Edwards6). Underweight affects more than half of 18-year-old patients(Reference Davidson and Truby1–Reference Willig, Bach and Venance4), and can lead to pressure sores and to a higher risk of lung infections caused by weakness of the respiratory muscles and reduced immune function(Reference Aldrich7, Reference Gershwin, Borchers and Keen8).
To our knowledge, no study has used a longitudinal approach to assess the spontaneous evolution of weight status in DMD patients. Such an approach is also needed to answer important practical questions to improve the care of DMD patients. There are two important questions to ask: do factors in early adolescence predict later underweight or obesity in late adolescence and does weight in early adolescence predict later weight? We indeed do not understand whether all patients, including obese patients, become underweight in adulthood.
Patients and methods
Patient population
This retrospective multi-centre audit took place under the umbrella of the Nutrition Group of the French Association against Myopathy. For this purpose, three centres (Lille, Villeneuve d'Ascq and Trousseau Hospital in Paris) were selected because of a significant number of patients who fulfilled the following inclusion criteria: (1) proven DMD as shown by molecular biology tests or the absence of dystrophin on muscular biopsy, or typical biological or clinical presentation and evolution; (2) born before 1992; (3) no significant nutritional intervention (gastrostomy or enteral feeding) during the time that body weight was recorded (intermittent food complement supplementation and low-energy diets were not considered as exclusion criteria); (4) availability of complete medical charts with regular follow-up data showing at least one body-weight measurement at the age of 11, 12 or 13 years. Of the eighty-three eligible patients, seventy were included in the audit. Of these, thirteen patients were excluded because they were lost to follow-up before the age of 15 years or because of incomplete weight charts. All but one lost their walking ability (and needed a wheelchair) before the age of 14 years. None received corticosteroid treatment during the audit period. The end of the follow-up corresponded to the cut-off date of March 2008 for twenty-four patients whose follow-up was continuing at the time of the study. Otherwise, it corresponded to the date of the last report (n 38), gastrostomy (n 3) or death (n 5). At maximal follow-up, twenty-six patients needed respiratory support: twelve patients had a tracheotomy and fourteen patients had non-invasive ventilation. Respiratory support was started at a mean age of 16·8 (sd 2·3, range 12–22) years.
Data collection
Data were collected retrospectively from the medical files. The body-weight:age ratio (W:A) was used to evaluate weight status. W:A was assessed in reference to the only published tool available for individuals with DMD, which is an ideal weight chart for boys with DMD developed by Griffiths & Edwards(Reference Griffiths and Edwards6), based on a biological model, assuming a 4 %/year decline in muscular mass. Weight centiles in this chart are therefore lower than those in the general population chart. Its accuracy was confirmed by Willig et al. (Reference Willig, Carlier and Legrand3). We defined underweight as a weight less than the 10th centile for age (i.e. W:A ≤ 85 %) on the Griffiths and Edwards chart(Reference Willig, Carlier and Legrand3, Reference Waterlow9). Obesity was defined as a weight above the 90th centile (i.e. W:A ≥ 120 %) and normal weight status as a weight between the 10th and 90th centile. W:A was calculated as the ratio of measured weight to median weight (i.e. the 50th centile) for age. Because this chart ends at the age of 18 years, we considered the median weight of DMD patients aged >18 years to be the median weight at the age of 18 years.
Statistical methods
Statistical analysis was performed using SAS software (SAS Institute, Inc., Cary, NC, USA). A P value < 0·05 was considered significant. Data are presented as means and standard deviations or medians and ranges for continuous variables and as frequencies and percentages for categorical variables.
For categorical variables, weight statuses were compared using the χ2 test or the Fisher exact test and the McNemar test of symmetry. For numerical variables, the Wilcoxon rank-sum test for continuous variables or the Student's t test was used depending on the sample size.
Receiver-operating characteristic curves were used to identify a W:A cut-off value at the age of 13 years that would predict weight status at maximal follow-up. The overall performance of W:A at the age of 13 years for predicting obesity or underweight at maximal follow-up was expressed as the area under the curve and its 95 % CI. The cut-off value was determined at the maximum value of the Youden index (corresponding to the best sensitivity (Se)/specificity (Spe) compromise). The performance at the determined cut-off values was measured in terms of sensitivity, specificity and their 95 % CI. CI were calculated according to the Sachs method(Reference Sachs10).
The W:A longitudinal data were analysed using a linear mixed model with random coefficients(Reference Verbeke and Molenberghs11). The linear mixed model is an extension of the classical ANOVA. This model allows the handling of both a fixed effect (age and weight status) and random effect (patient) and of correlations between the repeated measurements. According to the trend detected, we chose a quadratic age effect.
Ethical statement
The present paper is not a human intervention trial (it is a retrospective audit); therefore, no ethical statement is included.
Results
Weight status at 13 years of age and at maximal follow-up
Weight was available for sixty-eight of the seventy patients at the age of 13 years (the two others had weight measured at the age of 11 and 12 years); this time point was called ‘13 years old’ (mean 13·0 (sd 0·3) years). Table 1 presents the numbers of observations that was collected at each age.
Number of observations at each age

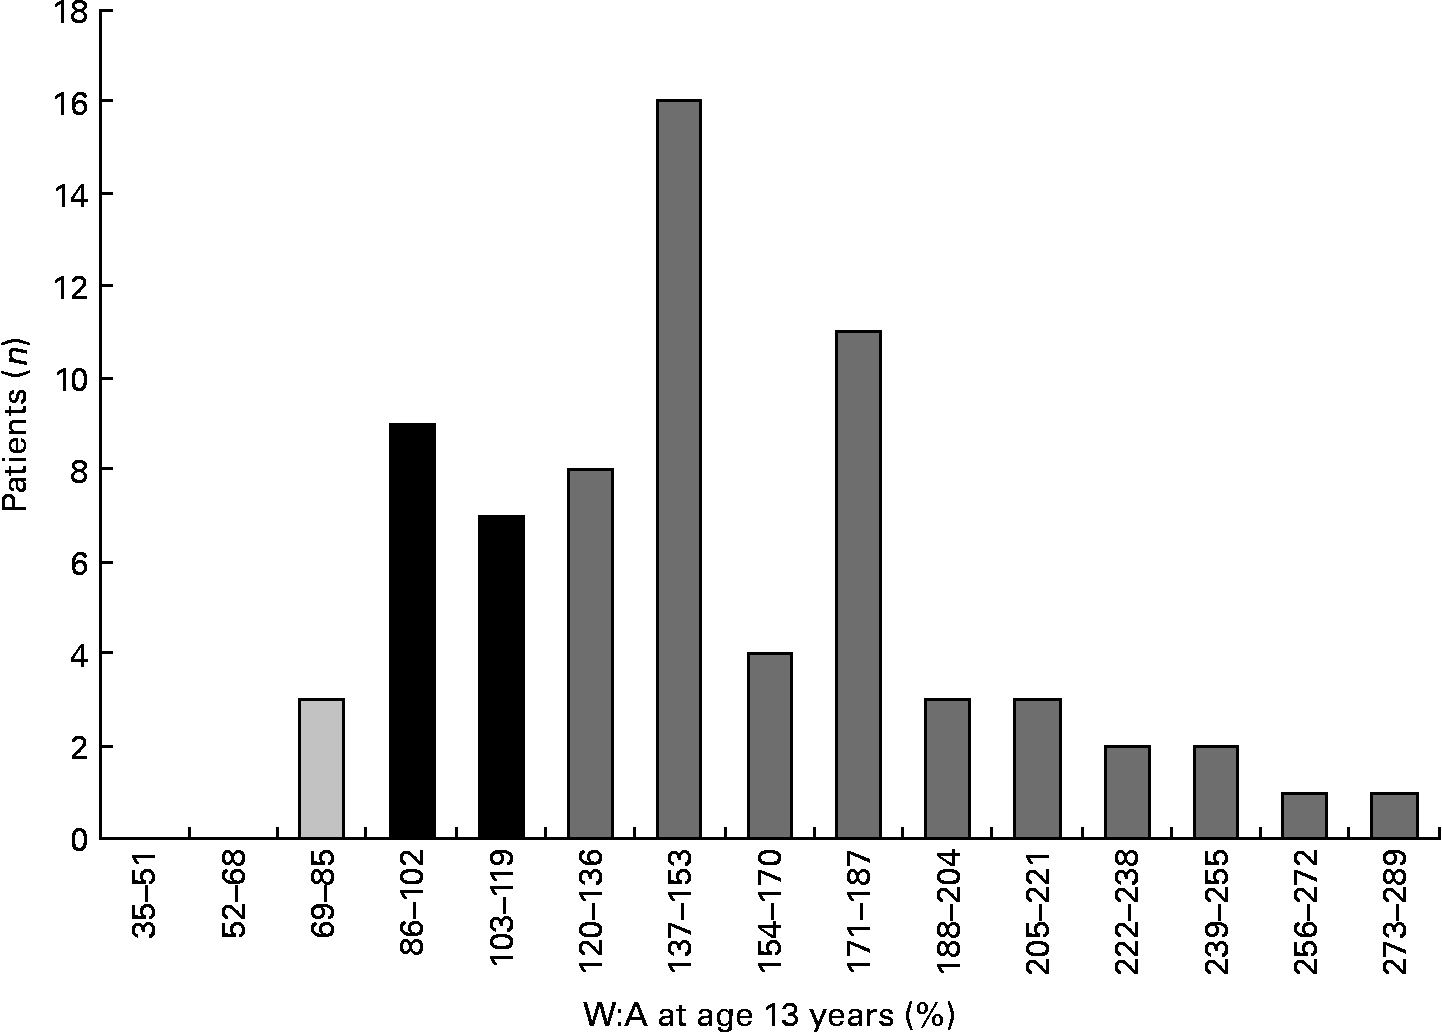
At the age of 13 years, fifty-one (73 %) patients were obese (W:A 122–278 %, mean 169 (sd 38)%); sixteen (23 %) patients had a normal weight and three (4 %) patients were underweight (Fig. 1).
Weight:age ratios (W:A) at the age of 13 years.  , Underweight patients; ■, patients with a normal weight;
  , obese patients.
At maximal follow-up (age 15–26 years, mean 18·3 (sd 2·3) years), thirty-three (47 %) patients were obese (W:A 120–198 %, mean 151 (sd 23)%) and twenty-four (34 %) patients were underweight (W:A 53–84 %, median 73 %; Fig. 2).
Weight:age ratios (W:A) at maximal follow-up (MF). , Underweight patients; ■, patients with a normal weight; , obese patients.

Relationship between weight status at the age of 13 years and weight at maximal follow-up
Obesity at the age of 13 years was significantly associated with obesity at maximal follow-up (P < 0·0001). At maximal follow-up, thirty-one of the fifty-one (61 %) 13-year-old obese patients remained obese. In contrast, nine (13 %) 13-year-old obese patients became underweight at maximal follow-up (P < 0·0001).
Normal weight status in 13-year-old patients was associated with later underweight. At maximal follow-up, twelve of sixteen (75 %) 13-year-old patients with normal weight status were underweight (P < 0·0001). Furthermore, at maximal follow-up, two 13-year-old patients (12 %) with a normal weight became obese (P < 0·002).
All three underweight 13-year-old patients remained underweight at maximal follow-up, as did all 13-year-old patients with weight < 50th centile (i.e. W:A < 100 %).
Weight:age in 13-year-old patients as a predictor of later weight
Because W:A at the age of 13 years influenced later weight, we used receiver-operating characteristic curves to establish a W:A cut-off value in adolescence to predict the risk for later obesity or underweight.
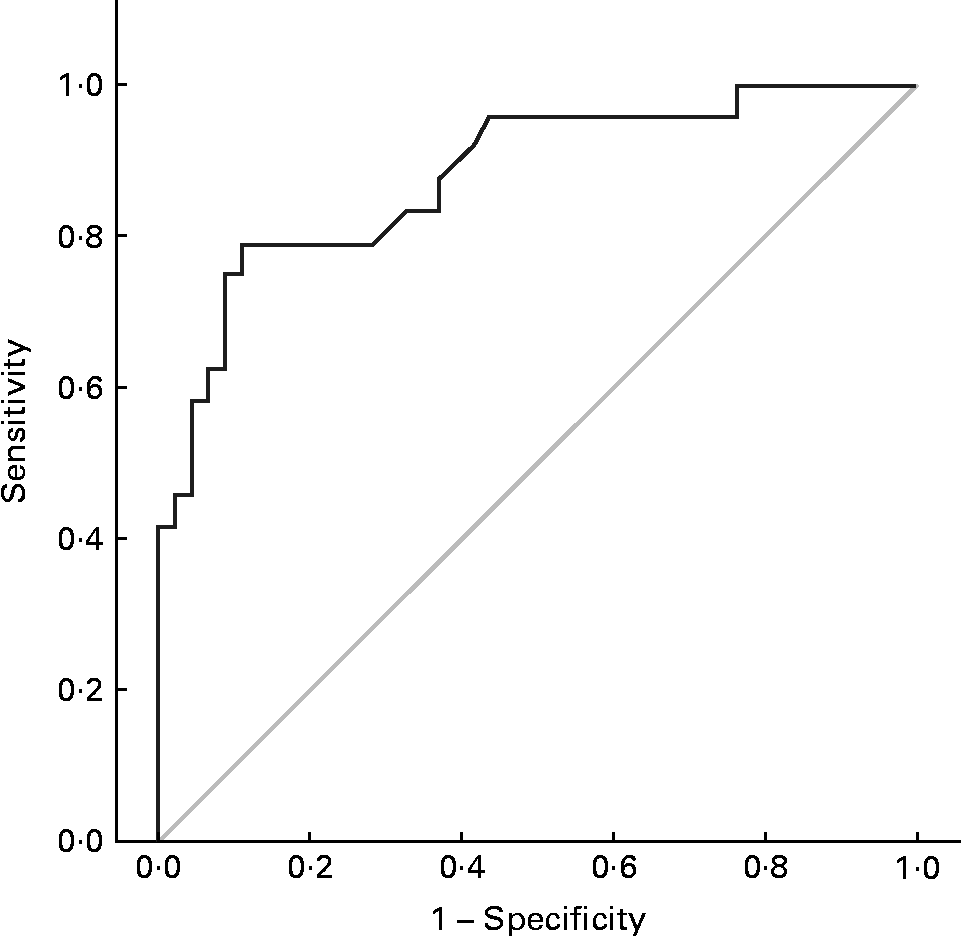
For underweight, the cut-off value was determined at 126·5 %. At maximal follow-up, 79 % of underweight patients had a W:A ≤ 126·5 % at 13 years of age (Se = 0·79). Of the non-underweight patients at maximal follow-up, 89 % had a W:A >126·5 % at 13 years of age (Spe = 0·89; Fig. 3).
Receiver-operating characteristic curves used to identify a weight: age cut-off value at the age of 13 years for predicting underweight at maximal follow-up. Area under the curve 0·882 (95 % CI 0·795, 0·968); sensitivity 0·79 (95 % CI 0·58, 0·93); specificity 0·89 (95 % CI 0·76, 0·96).
The best discriminating value of W:A at the age of 13 years for predicting later obesity was 151 %. At maximal follow-up, 76 % of obese patients had a W:A ≥ 151 % at 13 years of age (Se = 0·76). Of the non-obese patients at maximal follow-up, 89 % had a W:A < 151 % at 13 years of age (Spe = 0·89; Fig. 4).
Receiver-operating characteristic curves used to identify a weight: age cut-off value at the age of 13 years for predicting obesity at maximal follow-up. Area under the curve 0·883 (95 % CI 0·806, 0·961); sensitivity 0·76 (95 % CI 0·58, 0·89); specificity 0·89 (95 % CI 0·75, 0·97).

Spontaneous evolution of weight curves according to weight status at the age of 13 years
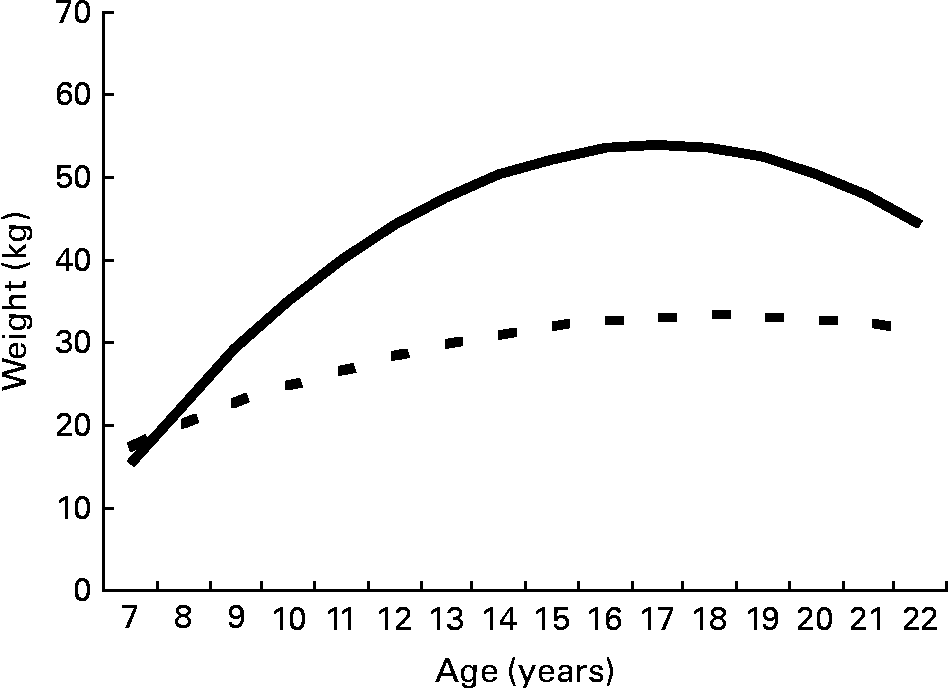
Weight evolution differed between 13-year-old patients with a normal weight and those who were obese (P < 0·001; Fig. 5). The weight evolution of 13-year-old obese patients reached a plateau at the age of 18·2 years, and then declined slightly. Normal-weight patients reached a plateau at the age of 17 years. However, there was high variability in the obese group as some of the 13-year-old obese patients were developing obesity in late adolescence, while others became normal weight or underweight.
Linear mixed model predicting the average evolution of weight between the ages of 7 and 22 years according to weight status at 13 years of age. The predictions stop at the age of 22 years because there were too few patients (n 2) whose weight was measured after this age. Because only three 13-year-old patients were underweight, we did not include them in the analysis.  , Normal weight status;
  , obesity.
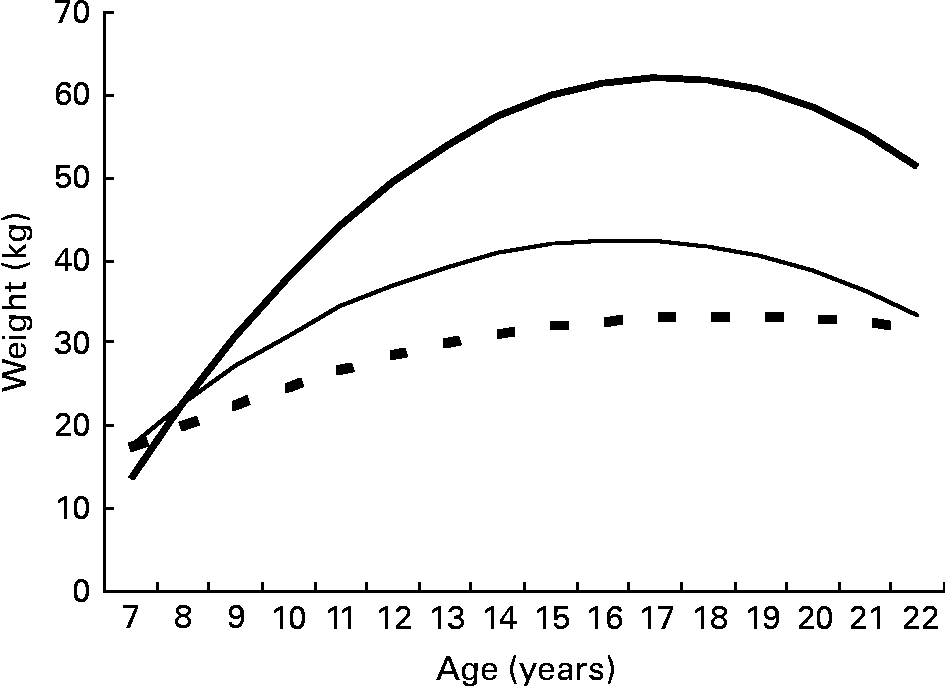
Because of this variability in 13-year-old obese patients and based on the W:A cut-off value of ≥ 151 % in 13-year-old patients, we compared these two subgroups in the obese early adolescent population. Weight evolution differed significantly between the 13-year-old patients with a normal weight, the 13-year-old obese patients with W:A < 151 % and those with W:A ≥ 151 % (P < 0·001; Fig. 6).
Linear mixed model predicting the average evolution of weight between the ages of 7 and 22 years in patients with a normal weight (, 85 % < weight:age ratio (W:A) < 120 %), obese patients with 120 % ≤ W:A < 151 % ( ) and obese patients with W:A ≥ 151 % () according to weight status at the age of 13 years. The predictions stop at the age of 22 years because there were too few patients (n 2) whose weight was measured after this age. Because only three 13-year-old patients were underweight, we did not include them in the analysis.
Associations between weight, age of ambulation loss, spinal arthrodesis and respiratory support
The mean age of ambulation loss was 10 (sd 2) years, and there was no significant difference in age between weight groups at 13 years or at follow-up. Similarly, the average age of spinal surgery (n 59) was 13 (sd 1) years, and it was not related to weight groups at either time.
The need for respiratory support at maximal follow-up did not differ according to weight status in underweight and normal-weight patients at maximal follow-up, and was not significantly related to weight status at the age of 13 years.
An interesting finding is that most obese patients (75 %) did not need any respiratory support (P = 0·03): twenty-five of the forty-four patients without any respiratory support were obese at maximal follow-up (i.e. 75 % of the thirty-three obese patients at maximal follow-up). Of the twenty-six patients with the need for respiratory support at maximal follow-up, eight were obese.
Discussion
This audit is the first to report longitudinal information about the outcome of the natural evolution of weight status in patients with DMD. Willig et al. (Reference Willig, Carlier and Legrand3) found that the highest prevalence of obesity (54 %) occurred around the age of 13 years; they found a similar prevalence of underweight at the age of 18 years. Similar findings were published by McDonald et al. (Reference McDonald, Abresch and Carter2). We found that the change in body weight from the age of 13 years to late adolescence differed between obese and normal-weight 13-year-old boys with DMD. Obese boys remained obese for several years, at least until the age of 18·2 years, when their body weight plateaued and then started to decline. Several factors are implicated in the development of obesity in DMD patients including low levels of physical activity. However, the role of energy expenditure remains unclear, as the literature is conflicting(Reference Davidson and Truby1).
One limitation of the present study is the lack of accurate data about height and therefore our inability to calculate W:A or height:age ratios. Indeed, due to joint retraction and difficulties of mobilisation, height was often lacking or inaccurate. The risk is therefore to underestimate weight status in patients with a low height, although there is very few information about normal height growth velocity in DMD. Short stature has been documented in DMD patients, and although our patients were steroid naive, the current use of steroid treatment can impair height growth and can increase weight gain in young patients already susceptible to obesity. This therapy may therefore increase the consequences of obesity in shorter patients, compared with taller patients. These consequences are not well documented, although it has been suggested that obesity can aggravate difficulties in locomotion(Reference Davidson and Truby1, Reference Willig, Bach and Venance4, Reference Bushby, Bourke and Bullock12). Several studies have recommended that obesity should be prevented in early adolescence(Reference Bushby, Bourke and Bullock12–Reference Hankard, Gottrand and Turck14). The 13-year-old patients with a W:A ≥ 151 % were more likely to remain obese later in life, but obesity (W:A >120 %) seemed to prevent underweight in late adolescence. This suggests that mild obesity at early adolescence (W:A between 120 and 150 %) should not be discouraged because it may prevent underweight in late adolescence.
Body weight is a general reflection of nutritional status, and we did not obtain data about body composition, which could have been estimated by other measures, such as X-ray absorptiometry or MRI(Reference Davidson and Truby1). We cannot know whether the obese patients who became patients with a normal weight did so by losing more fat or muscle mass. Hankard et al. (Reference Hankard, Gottrand and Turck14) found no difference neither in muscle mass nor in fat-free mass between obese and non-obese DMD patients. They hypothesised that obesity is not associated with increased muscle mass, therefore only increasing the burden on already weakened muscles. They recommended prevention of obesity by dietary counselling and adapting energy intake in relation to body composition. Davidson et al. (Reference Davidson and Truby1) reminded that dietitians should keep in mind that negative energy balance is likely to increase muscle loss, and that prevention of obesity is preferable to severe food restriction(Reference Griffiths and Edwards6).
We found that 13-year-old patients with a normal weight were more likely to become underweight during late adolescence, and receiver-operating characteristic analysis determined a W:A cut-off value of 126·5 %. The discriminant power of W:A at the age of 13 years was assessed using sensitivity and specificity. In the present study, we found values near or greater than 0·8, which is considered as a good discriminant power. The W:A cut-off value may be useful for deciding which DMD patients should receive nutritional support or intervention. Because none of the underweight boys showed spontaneous improvement of weight status, enteral nutrition via gastrostomy should be considered early when oral energy complementary treatment fails(Reference Bushby, Bourke and Bullock12, Reference Finder, Birnkrant and Carl15–Reference Tilton, Miller and Khoshoo18). Several authors have suggested that obesity occurs simultaneously with the loss of ambulation(Reference Willig, Carlier and Legrand3, Reference Bushby, Bourke and Bullock12). However, the present results do not support this hypothesis or the idea that the age of ambulation loss is a risk factor for obesity.
More than 90 % of DMD patients develop scoliosis(Reference Bushby, Bourke and Bullock12, Reference Galasko, Delaney and Morris19). Spinal arthrodesis improves seating posture and comfort, and slows the aggravation of scoliosis(Reference Finder, Birnkrant and Carl15, Reference Galasko, Delaney and Morris19). Clinical practice suggests that this type of major surgery represents a risk for malnutrition and that underweight can cause pressure sores or infectious problems after surgery. Recent recommendations advise the optimisation of weight status before surgery(Reference Finder, Birnkrant and Carl15). The present results clearly showed that spinal arthrodesis is not associated with weight status.
Respiratory status is closely associated with nutritional status(Reference Aldrich7, Reference Finder, Birnkrant and Carl15). We found no relationship between underweight and respiratory alterations or between the beginning of respiratory support and improved weight status. However, we found a negative association between obesity and the need for respiratory support at the end of the follow-up. We hypothesise that obese patients experience a slower loss of respiratory function or, conversely, that preserved respiratory function protects these patients from weight loss by avoiding energy wasting caused by catabolism associated with lung infections(Reference Aldrich7).
Conclusion
This audit shows the need for nutritional care of DMD patients. The present results may be valuable for medical staff to identify DMD patients needing dietary adaptation and intervention. Early prevention of underweight and obesity can avoid further complications such as locomotion problems associated with obesity, pressure sores and respiratory complications associated with underweight. Our data show that a normal W:A at 13 years of age may predict poor prognosis for later weight status, suggesting that early adolescent DMD patients with a normal weight need nutritional monitoring. Mild obesity (W:A between 120 and 150 %) at the beginning of adolescence should be respected because it may prevent later complications.
Acknowledgements
The present study was supported in part by AFM (Association Française contre les Myopathies). The authors declare that there are no conflicts of interest. L. M. was the first author and the corresponding author. F. G. helped much in writing the manuscript by giving help and advice, and by contacting the different co-authors. J. S. made the statistical analysis. M. M. provided help by giving access to her patients’ files and gave advice on the manuscript. J.-M. C. provided help by giving access to his patients’ files (neuromuscular unit) and gave advice on the manuscript. A. C. provided help by giving access to his patients’ files and gave advice on the manuscript. V. N. provided help by giving access to his patients’ files (respiratory unit) and gave advice on the manuscript. V. T. provided help by giving access to his patients’ files and gave advice on the manuscript. D. G. provided help by giving access to her patients’ files and gave advice on the manuscript. Each author has seen and approved the submission of this version of the paper and takes full responsibility for the paper.



