





The authors regret a minor figure assembly error in Figure 4. The schematic brain illustrations above Panels A and B were inadvertently transposed during final figure preparation. This error has been corrected in the original article.
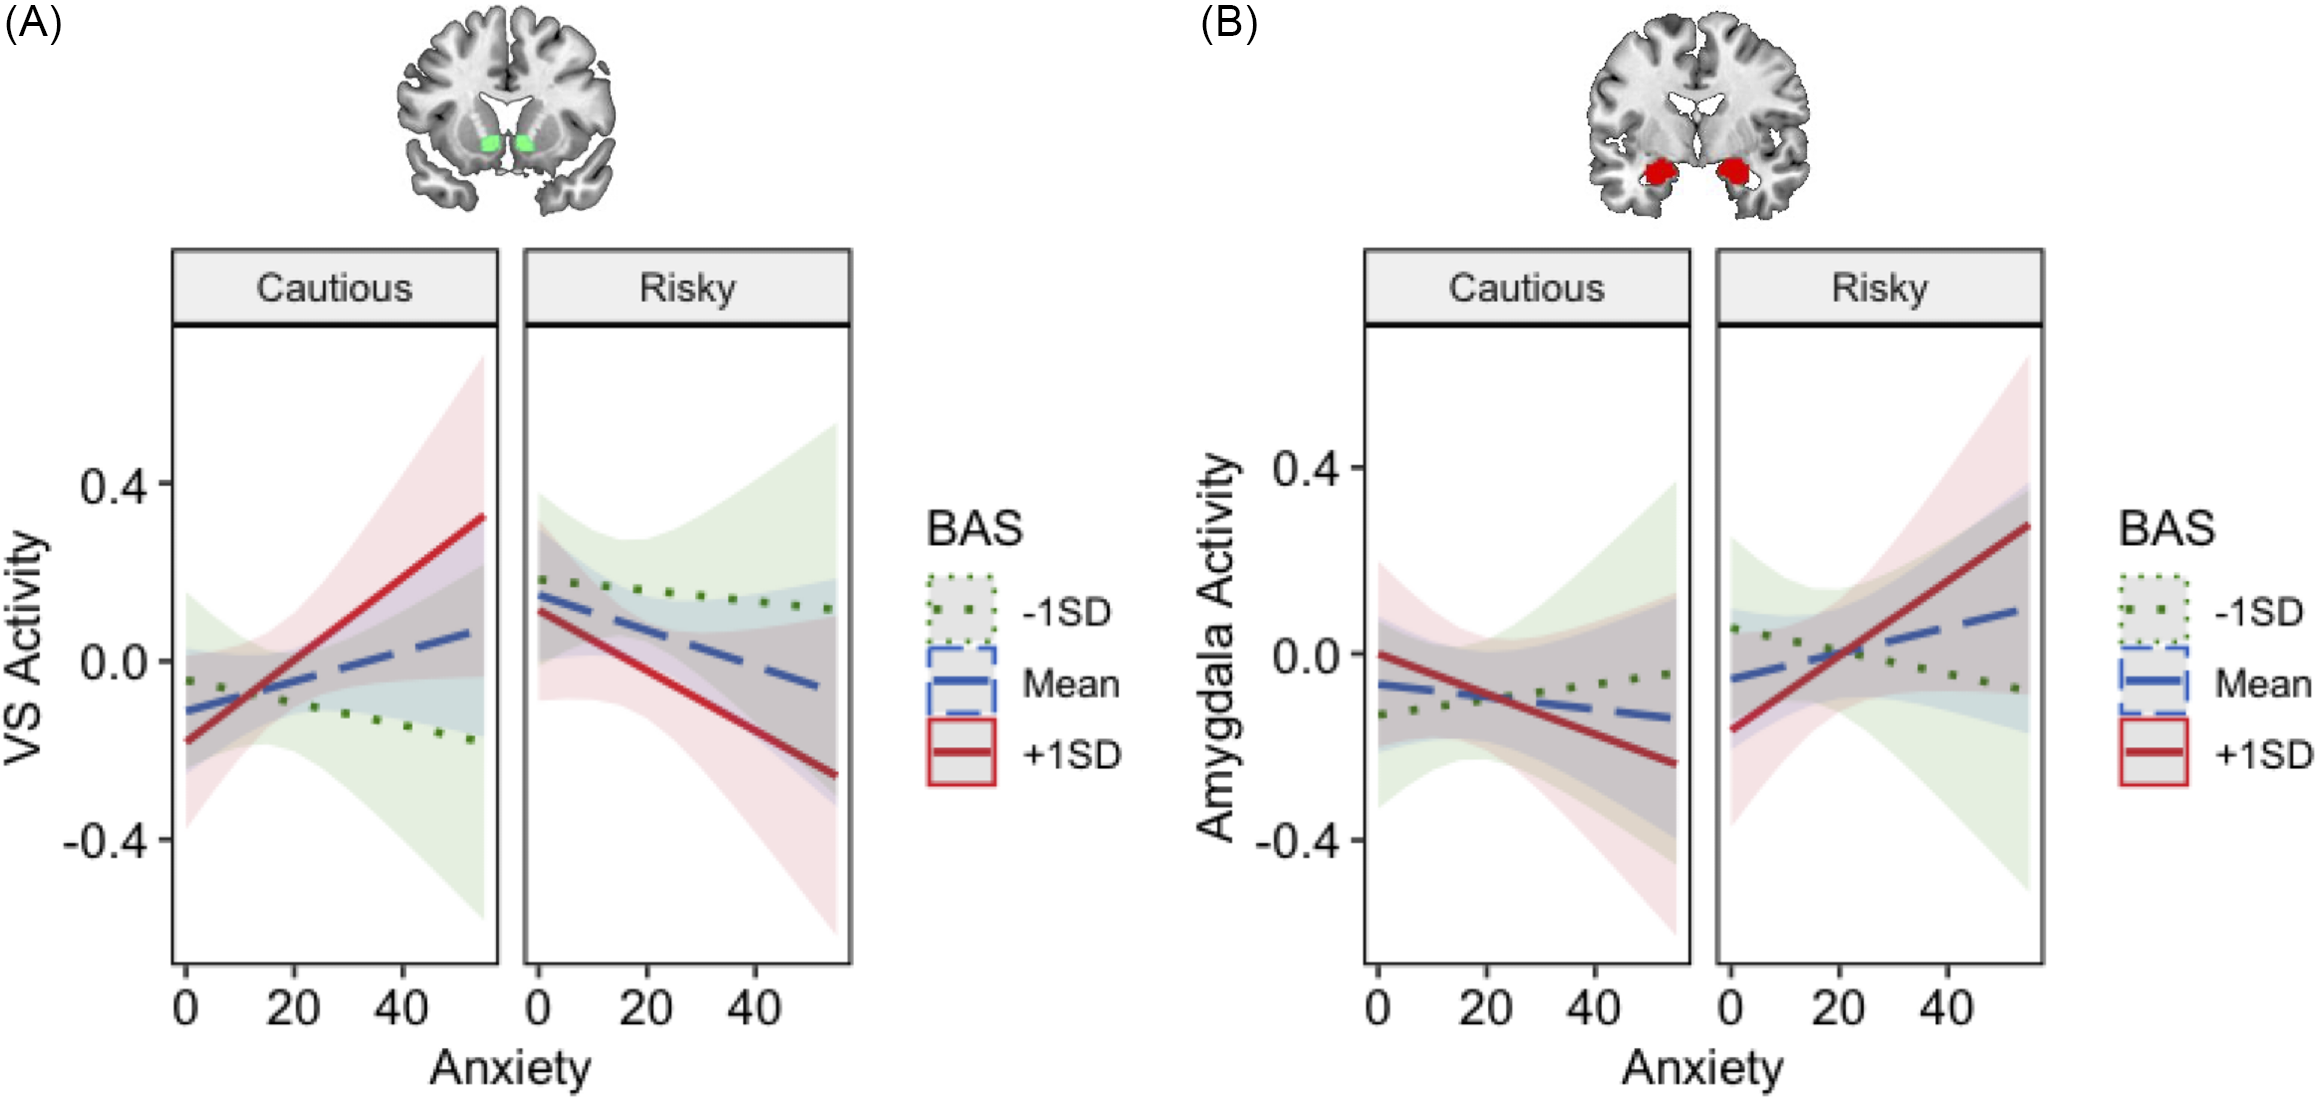
Figure 4 Long description
The figure contains two sets of line graphs, each with two panels labeled A and B. Panel A shows VS Activity, while Panel B shows Amygdala Activity. Each panel is divided into two sub-panels: Cautious and Risky. The x-axis represents Anxiety, and the y-axis represents brain activity levels. The graphs include three lines representing different BAS levels: -1SD (dotted green line), Mean (dashed blue line), and +1SD (solid red line). In Panel A, VS Activity increases with anxiety in the Cautious scenario for higher BAS levels, while it decreases in the Risky scenario. In Panel B, Amygdala Activity shows a similar trend, with higher BAS levels indicating increased activity with anxiety in both Cautious and Risky scenarios.

 Open access

