

1. Introduction
How does corruption affect economic growth? The theoretical literature provides no clear guidance on this issue. One strand of the theoretical literature argues that corruption increases economic growth by enabling investors to avoid bureaucratic delay through the use of ‘speed money’ and by encouraging lowly paid government employees to work harder if they could supplement their income by levying bribes (De Soto, Reference De Soto1989; Egger and Winner, Reference Egger and Winner2005; Huntington, Reference Huntington1968; Leff Reference Leff1964; Lui, Reference Lui1985). Another strand of the theoretical literature contends that corruption has a negative effect on economic growth by reducing investment, both in physical and human capital (Keefer and Knack, Reference Keefer and Knack1997; Mauro, Reference Mauro1995; Reinikka and Svensson, Reference Reinikka and Svensson2005) and by leading to a misallocation of public expenditures away from growth-enhancing areas (such as education and health) towards areas which are less productivity-enhancing, but are more corruption-intensive (such as large and expensive infrastructural projects) (Mauro, Reference Mauro and Ann Elliott1997; Tanzi and Davoodi, Reference Tanzi and Davoodi1997). In this paper, we test for the corruption–growth relationship by using panel data for over 100 countries from 1984 to 2016, allowing this relationship to differ by political regime.
A vast empirical literature has studied the impact of corruption on growth. For example, Mauro (Reference Mauro1995) finds that a one standard deviation increase in bureaucratic integrity will lead to a five percentage point increase in investment and an increase in the annual growth rate by half a percentage point. Fisman and Svensson (Reference Fisman and Svensson2001) estimate that a 1% increase in corruption leads to a 3% reduction in firm growth. Mo (Reference Mo2001) finds that a one percentage increase in the corruption level reduces the growth rate by about 0.72%. Pellegrini and Gerlagh (Reference Pellegrini and Gerlagh2004) find that a one standard deviation decrease in corruption leads to an increase in growth of 1% per year, for a given initial income level.
Similarly, there is a large empirical literature on the effect of democracy on economic growth. In one of the early empirical contributions to this literature, Barro (Reference Barro1996) finds that the overall effects of democracy on growth are weakly negative using repeated cross-sections for 84 countries, with growth rates of GDP per capita averaged over 1965–75, 1975–85 and 1985–90. A similar finding is obtained by Tavares and Wacziarg (Reference Tavares and Wacziarg2001), also with cross-sectional data. On the other hand, Rodrik and Wacziarg (Reference Rodrik and Wacziarg2005), Persson and Tabellini (Reference Persson and Tabellini2007) and Papaioannou and Siourounis (Reference Papaioannou and Siourounis2008) find a positive effect using panel data. More recently, Acemoglu et al. (Reference Acemoglu, Naidu, Restrepo and Robinson2014) find a sizeable and robust effect of democracy on economic growth using annual panel data and Generalized Method of Moments (GMM) methods for 175 countries for 1960–2010.
In this paper, we look at the joint effect of corruption and the type of political regime (dictatorship versus democracy) on economic growth. In other words, the joint effect examines if corruption–growth relationship varies in different political systems, i.e. in autocracy and democracy. A set of studies have highlighted the so-called ‘East Asian Paradox’, where countries in North and South East Asia grew rapidly in spite of high levels of corruption (Campos, Reference Campos2002; Rock and Bonnett, Reference Rock and Bonnett2004; Gill and Kharas, Reference Gill and Kharas2007). The observed positive relationship between corruption and growth has been attributed, at least in part, to the authoritarian regimes prevalent in these countries, which made sure that corruption was growth-enhancing. On the other hand, there are several autocratic regimes, mainly in Africa and Latin America, where high rates of corruption had a deleterious effect on economic growth (Bates, Reference Bates1981; Bratton and Van de Walle, Reference Bratton and Van de Walle1994; Haber, Reference Haber2002).
To examine whether the corruption–growth relationship is different in autocracies than in democracies, we test for the relationship allowing it to differ by political regime. We use panel data for over 100 countries from 1984 to 2016. To test for the mediating effect of political regime on the corruption–growth relationship, we include an interaction term between our measure of democracy and of corruption, along with including the measures of corruption and democracy directly in the regressions we estimate.
We find clear and unambiguous evidence that the corruption–growth relationship differs by political regime, and that the growth-enhancing effect of corruption is more likely in autocracies than in democracies. The findings support the argument that credible commitment necessary for investment and growth is more likely in autocracies than democracies, and that corruption per se may not have a negative effect on growth if the deals made by politicians and firms are seen as credible.
The rest of the paper is in three sections. The next section discusses literature review; Section 3 presents our empirical model and the data to be used in the empirical analysis. Section 4 describes the results of the empirical analysis and Section 5 concludes.
2. The relationship between corruption, political regimes and economic growth
In this section, we review the theoretical and empirical literature on the relationship between corruption, political regimes and economic growth.
From a theoretical standpoint, it is not clear whether the corruption–growth relationship will differ between democracies and autocracies, and if so, in which way. On one hand, the postulated negative effect of corruption on growth may be lower in an autocracy than in a democracy if the centralization of authority in the former regime leads to more efficient bribe-taking and lower loss of output (Ehrlich and Lui, Reference Ehrlich and Lui1999; Shleifer and Vishny, Reference Shleifer and Vishny1993). On the other hand, the possibility of the greater secrecy in corruption in an autocracy (as corruption includes all the actions taken to influence rule enforcers) (Campos and Giovannoni, Reference Campos and Giovannoni2017) allows for less growth-enhancing public and private investments which are not as corruption intensive than low-value projects in areas such as defence and infrastructure (Shleifer and Vishny, Reference Shleifer and Vishny1993), while the greater accountability pressures in a democracy limit the possibility of such growth-retarding investments. Aidt et al. (Reference Aidt, Dutta and Sena2008) provide a theoretical model which shows that in regimes where citizens cannot hold their political leaders to account (as in an autocracy), the political leadership may try and extract as much rent as possible from the formal sector, leading to an increase in the size of the informal sector, with a consequent negative effect on growth.
The heterodox economics literature has taken a different standpoint on the role of the political regime to mediate the effect of corruption on growth. It has argued that corruption is unlikely to negatively affect economic growth, especially in autocracies (Khan and Jomo, Reference Khan and Jomo2000). In some autocratic regimes, where ruling elites may have long-term time horizons, politicians are able to make the credible commitments to firms not to expropriate all of the rents that accrue from the investment decision, though some rent-sharing may exist in the form of bribes from firms to politicians (Bardhan, Reference Bardhan1997; Khan Reference Khan1996). Thus, bribe-taking by politicians from firms may not have a deleterious effect on investment and growth as deals offered by politicians to firms are likely to be ‘ordered’ – firms can be confident that politicians will deliver on the deals that they have entered into with them (Pritchett and Werker, Reference Pritchett and Werker2013; Sen Reference Sen2013). On the other hand, in democratic regimes, with frequent change of ruling parties, commitments made by politicians to firms are less likely to be credible. Here, bribe-taking by politicians is associated with deals that are ‘disordered’ as firms are less likely to believe that politicians are able to deliver on the deals offered to them. In this case, corruption is likely to have a deterring effect on growth.
The positive view in the heterodox literature on the growth-enhancing nature of corruption among autocracies draws primarily from the East Asian experience, and is not consistent with the experience of autocracies in Sub-Saharan Africa and South Asia, which have observed high rates of corruption and low rates of economic growth (Khan, Reference Khan, Jomo and Ben2006; Ndulu and O'Connell, Reference Ndulu and O'Connell1999). Using case-study evidence from four African countries, Coolidge and Rose-Ackerman (Reference Coolidge and Rose-Ackerman1999) argue that where the autocrat is not confident of the length of his tenure (due to the fear of deposition from other factions in the ruling elite such as the military), he may engage in rent extraction from the private sector, leading to high corruption and low growth. In other words, if the autocrat has a sufficiently short time horizon, it would be in ‘his interest to confiscate the property of his subjects, to abrogate any contracts he has signed in borrowing money from them, and generally to ignore the long-run economic consequences of his choices’ (Olson, Reference Olson1993: 572).
This suggests that the crucial distinguishing feature between the authoritarian regimes in East Asia as compared to the authoritarian regimes in other parts of the developing world is that the leaders in East Asia had an interest in providing a stable economic environment for the private sector to take long-term investment decisions, even though the relations between the state and the private sector were of the ‘crony capitalist’ variety. Such collusive relations between government and business provided security for corrupt payments, so that corruption acted as ‘the grease in the wheels’ in these countries. Therefore, the key mechanism by which corruption was growth-enhancing in East Asian autocracies as compared to other autocracies was the East Asian autocrat's credible commitment to economic freedom and pro-business policies, thereby providing confidence to the firms to invest, leading to long-term growth (Saha et al., Reference Saha, Gounder, Campbell and Su2014).Footnote 1 We test for the presence of this mechanism explicitly in our empirical analysis.
There are few quantitative cross-country studies on the inter-relationship between corruption, political regimes and growth. Mendez and Sepulveda (Reference Méndez and Sepúlveda2006) find that there is a non-monotonic relationship between corruption and growth, with corruption beneficial for economic growth at low levels of incidence and detrimental at high levels of incidence. They also find that in political regimes that are ‘not free’, corruption does not affect economic growth in the same fashion as for ‘free’ political regimes, and that the non-monotonic relationship between corruption and growth is observed only in ‘free’ countries. Assiotis and Sylwester (Reference Assiotis and Sylwester2014) find that while corruption does have a negative effect on growth, this is more likely to be observed in autocracies. Similarly, Meon and Sekkat (Reference Méon and Sekkat2005) show that while corruption has a negative effect on growth, it is particularly true for countries with weak governance quality (see also Berggren et al., Reference Berggren, Bergh and Bjørnskov2012).
The argument that corruption may be beneficial to growth in autocracies as compared to democracies finds strong support in qualitative country case-studies. In the case of South Korea, an authoritarian regime since 1963, with the coming to power of the military general Park Chung-heee, till democratization in 1987, there was wide spread corruption in the period of authoritarian rule in 1963–1987 (see Figure 1). This was also the period of rapid growth of the Korean economy. During the autocratic period, personal ties between the business elite and the political elite and the mutual advantage that the system of exchanging bribes for political favours to the Korean conglomerates provided to both political and economic elites underpinned institutions of credible commitment (‘ordered deals’) in Korea all through the 1960s to the 1980s, and was crucial for Korea's success in the early stage of growth, in a context where the rule of law in Korea was vague and seldom enforced (Kang, Reference Kang2002a, Reference Kang2002b). As Figure 2 makes clear, high growth in Korea in the 1980s (and earlier) coincided with high levels of corruption. Therefore, in South Korea in the 1960s and 1970s, ‘development and money politics proceeded hand in hand’ (Kang, Reference Kang2002a: 185).
Evolution of democracy in China, India, South Korea and Zimbabwe.
Note: We use the Polity2 measure of democracy. We re-scale the measure from −10 to + 10 to 0 to 20, with higher values of the measure capturing higher levels of democracy. A score of 0–10 implies autocracy while a score of 10–20 implies democracy. India has always been a democracy from 1965 to 2017, South Korea briefly from 1965 to 1970, and then from 1987 onwards. China has never been a democracy. Zimbabwe was under autocracy since the mid-80s till the end of 2010.
Source: Authors' calculation.

Corruption and per capita GDP growth: China, India, South Korea and Zimbabwe.
Source: Authors' calculation.

China is also an example of an autocratic country which has witnessed high rates of economic growth along with high rates of corruption (see Figures 1 and 2). The corruption that China witnessed took the form of profit sharing where both elites and non-elites benefited from wealth creation in their jurisdictions (Ang, Reference Ang2020: 12). As Ang (Reference Ang2019) argues, corruption spurred ‘politically connected politically connected capitalists to feverishly invest and build, while enabling politicians to achieve their development targets and ascend career ladders’. Therefore, the Chinese leadership took strong methodological measures to curb the growth-damaging effects of corruption.
Zimbabwe provides an interesting counter-example of an autocracy which was highly corrupt but where corruption was growth-retarding, unlike the case of South Korea and China (as Figure 1 shows, Zimbabwe has remained an autocracy since the 1960s). Here, the ruling elite placed its own political survival and control above policies of economic growth. Thus, Zimbabwe's ruling party, the ZANU-PF, under the leadership of Robert Mugabe, used ‘the strength of the inherited state apparatus to suppress political opposition and to curtail the independent economic power of business elites’ (Bratton and Masunungure, Reference Bratton and Masunungure2011: 3.). At the same time, the quest for political power led to open corruption and nepotism (Mandaza, Reference Mandaza1986). Therefore, Zimbabwe illustrates the example of an autocracy where economic freedom was curtailed, leading to low economic growth, co-existing with high levels of corruption (as evident in Figure 2).
In contrast to South Korea, China and Zimbabwe, India has been a democracy ever since it became independent in 1947 (Figure 1). In the first three decades after independence, the Indian government created one of the most comprehensively controlled and regulated economies after independence. As a consequence, ‘the Indian elite developed a highly sophisticated mode of discrete lobbying designed to achieve particularistic benefits from the new permit, licence, quota raj. Each major business house established the equivalent of an industrial embassy designed to act as a listening post, liaison office and lobbying agency to deal with political and bureaucratic decision makers’ (Kochanek, Reference Kochanek1996: 157). There was very little mutual confidence between the government and business sector, leading to a lack of trust by the business sector on the deals that the state might offer to them. As Bhagwati (Reference Bhagwati1993) points out, ‘the industrial-cum-licensing system … had degenerated into a series of arbitrary, indeed inherently arbitrary, decisions where, for instance, one activity would be chosen over another simply because the administering bureaucrats were so empowered, and indeed obligated, to choose’ (p. 50). This led to a ‘disordered deals’ environment that contributed significantly to low rates of private investment and slow economic growth all through the 1960s and 1970s (Kar and Sen, Reference Kar and Sen2016). As Bardhan (Reference Bardhan1984) argues, the tensions that were inherent in India's democracy that led to the management of conflict in the ruling coalition/dominant proprietary classes (comprising the industrial capitalists, the agrarian elite and the professional class) resulted in an increasing share of non-development expenditures such as subsidies to the dominant proprietary classes. This left limited resources for productive capital formation by the public sector, thereby constraining economic growth. Therefore, in the Indian case, while there were high rates of corruption (see Figure 2), this did not lead to high economic growth as in the South Korean and Chinese cases.
These case-studies show that the effects of corruption on growth are likely to differ by political regime, and autocracies such as China and South Korea may have certain characteristics (a high level of economic freedom) that may make the effect of corruption on growth more benign as compared to a democracy like India, and autocracies which lack economic freedom such as Zimbabwe. We investigate this proposition next more systematically using cross-country panel data.
3. Empirical model, methodology and data
This section discusses model, methodology and data used to explore the association between corruption and growth.
3.1 Model
Our panel data analysis based on standard economic growth model expresses the rate of per capita income (growth) as dependent on various macroeconomic factors such as investment, population growth and average school enrolment. To examine the role of corruption and political regimes, we follow the standard approach of estimating growth regressions, by developing a Barro-style augmented growth model as an extension of Solow (Reference Solow1956). In the original Solow model, output/income in an economy over the long-term depends on its available factors of production and technology. Following Barro (Reference Barro1991), we extend the Solow growth model by including corruption, democracy and the interaction term to explore the joint effects of corruption and regime type on economic growth. We also include openness (economic freedom) and money supply to measure the impact of globalization and macroeconomic stability in a country. The interaction effects measuring the effect of corruption on economic growth in different regime types are the main focus of this study.
The base model using panel data over the period 1984–2016 is structured as follows:

where, LRGDPPC is log of real per capita gross domestic product as a measure of economic growth, CORR is corruption, DEMO is democracy indices, CAP is capital per capita, RND is research and development, EDU is educational attainment, OPEN (EF) is trade openness (economic freedom), M2GDP is money supply to GDP ratio, ɛ is error term. Subscripts i is country and t is for time.
The sign and significance of α 3 is of interest, which captures the interaction effect of corruption and democracy on log of per capita income. In addition, the marginal effects of corruption and democracy on income are computed as follows:


Equation (2a) demonstrates the marginal impact of corruption on income in the presence of democracy. If α 3 < 0, then equation (2a) implies that a one unit increase in CORR yields a greater reduction in income as the degree of democracy expands.Footnote 2 Alternatively, an increase in corruption level enhances growth when countries are strongly autocratic or less democratic. Contrarily, if α 3 > 0, a higher level of corruption increases growth with a greater democracy. In other words, the marginal effect of corruption and democracy reveals that an increase in the level of corruption on income per capita growth depends on the level of political regime, the impact of corruption on growth is favourable in autocracy and the opposite is true in greater democracy. Likewise, equation (2b) is the marginal effect of democracy in the presence of a corrupt system. If α 3 < 0 and exceeds α 2 > 0 then a one unit increase in the level of democracy lowers growth in a more corrupt nation.
Following neo-classical growth theory, it is expected that a greater stock of capital per capita, higher educational achievement and more research and development should boost income growth (Mankiw et al., Reference Mankiw, Romer and Weil1992; Romer, Reference Romer1990). Hence, α 4, α 5 and α 6 are expected to be positive. Rent-seeking theory and cognitive rules in the context of a market for ideas suggest that the impact of open market should have a positive impact on growth (Krueger, Reference Krueger1974; Greif and Mokyr, Reference Greif and Mokyr2017), we expect α 7 to be positive. Finally, following the basic macroeconomic model, the circular flow diagram suggests a greater money supply increases income as it is an injection. Hence, the expected sign of α 8 is positive.
This is to note here that as our empirical model uses panel fixed effects (FE), different from Mauro (Reference Mauro1995), which uses GDP per capita growth rate as a dependent variable and includes the initial level of GDP per capita as an explanatory variable in the model. The Mauro growth model analyses corruption–growth relationship for a cross-section of around 70 countries for the average per capita growth over 1960–1985, while we use panel data in our estimation. However, as a robustness check, we replace GDP per capita with its growth rate as the dependent variable with the initial level of GDP per capita as a control variable and the estimations are run using OLS (for the cross-section of countries for the average growth per capita over 1984–2016) and panel period FE. In addition, two-way FE are estimated with GDP per capita as a dependent variable with lagged GDP per capita as a control variable. For further robustness checks and to address the endogeneity issue, Dynamic-Panel-System-GMM with GDP per capita growth as the dependent variable is also estimated.
3.2 Methodology
In order to test the proposed hypothesis, a panel estimation technique is used for over 100 countries for the period 1984–2016. We first start employing an ordinary least-square estimation with the average values of each variable for the period 1984–2016. Following Saha and Gounder (Reference Saha and Gounder2013), a seven-period panel (i.e. five 5-year average for 1995–2013 and a 3-year average for 2014–16) is estimated to defecate potential business cycle effects that are assumed to be present in annual data. Then we examine the FE model with country- and time-specific variations in corruption–growth relationship. Next we test its validity, comparing the variances of parameters obtained from the random-effect model using the Hausman test. According to Baltagi (Reference Baltagi2008) and Basu et al. (Reference Basu, Bhattarai and Gatechew2019), all estimators in the FE model even with a small number of cross-sections N are consistent as time (t) increases and approaches to infinity. In the random-effects model, with the regression error term vi,t = ui + ɛi,t, where ui is the time-invariant random individual effect in addition to ɛi,t error term denoting all other missing elements. Furthermore, in both models (random effects and FE), it is assumed that all explanatory variables are independent of error terms vit, ui, and identically distributed (i.i.d) and assumed to be normally distributed. The results are presented after correcting for both heteroscedasticity and serial correlation with robust standard errors.
Also, while the simple least-squares panel data model with FE provide an important insight on the coefficients of interest, they can render biased estimates due to the potential problem of endogeneity between several of our variables such as growth and democracy, growth and corruption, which can cause the error terms to be correlated with dependent variables.Footnote 3 Although a vector of control variables is used to reduce the problem of endogeneity, there still could be omitted variables that cause changes in both corruption and growth.
There is a clear reverse causality issue between the institutional variables (corruption, democracy and the interaction term between corruption and democracy), and the dependent variable – economic growth. The usual approach to resolve the endogeneity issue is to use two-stage-least square (TSLS) which uses an instrumental variable that is correlated with the independent variable but not with the dependent variable. However, it is extremely difficult to find efficient instruments. Following Mauro (Reference Mauro1995), the potential issue of simultaneous causation is addressed here using the TSLS procedure and employing instrumental variables that may affect institutional variables but not affect growth directly. Ethnic tensions (ET), which focuses on the degree of tension within a country attributable to racial, nationality, or language divisions, is used as an instrument for institutional variable such as corruption. This is similar to Mauro (Reference Mauro1995) who uses ethnolinguistic fractionalization as instruments for corruption and points out that the extent to which countries are fractionalized along ethnolinguistic lines is exogenous and unrelated to economic variables other than through its effects on institutional efficiency.Footnote 4 The raw data also confirm that the correlation between real GDP per capita growth and ET is −0.072 but the correlation between ET and corruption is 0.341 (Appendix Table A3). We also use lag of the other right-hand side variables as instruments.Footnote 5
For a further robustness check, System-GMM-Dynamic-Panel is also employed to address the endogeneity issue. System-GMM estimators improve the efficiency of estimates by using extra moment conditions that ‘rely on certain stationarity conditions of the initial observation.’ (see Blundell and Bond, Reference Blundell and Bond1998). Identification is based on first-differencing and using lagged values of the endogenous variables as instruments. The System-GMM estimator (GMM-SYS) is composed of a difference equation instrumented with lagged levels and additionally a level equation, which is estimated using lagged differences as instruments (Bond et al., Reference Bond, Hoeffler and Temple2001; Rajan and Subramanian, Reference Rajan and Subramanian2008). Hence, System-GMM-Dynamic-Panel is used to address the endogeneity issue for the robustness check. We test the instrument validity by using Hansen's J statistic of over-identifying restrictions.
3.3 Data
The empirical model employs macroeconomic data, corruption indices and democracy indicators to test the proposed hypothesis.
3.3.1 Corruption data
The major obstacles of comparative studies of corruption have been the lack of a general definition of corruption and the absence of objective cross-national data on corrupt behaviour given its illegal and secret nature. The subjective measure of corruption is used as a principal measure, source from International Country Risk Guide (ICRG). The ICRG index is constructed by Political Risk Services.Footnote 6 It measures the corruption within the political system that threatens foreign investment by distorting the economic and financial environment and reducing the efficiency of government and business by enabling people to assume positions of power through patronage rather than ability. The ICRG corruption index (CORR) has been widely used in the literature and it is published since 1984.Footnote 7 For simplicity and ease of exposition, the ICRG index has been converted into a scale from zero (least corrupt) to six (most corrupt).
We also use Transparency International's (TI's) corruption perception index (CPI) for robustness check. The CPI index is a composite index based on individual surveys from different sources. The index is rescaled and ranges from zero to 10 and a higher value indicates a higher level of corruption. The index is available since 1995.
3.3.2 Democracy indicators
Like corruption, democracy also suffers from the problem of measurement. The measurement of democracy is disputed due to the problems of conceptualization, measurement and aggregation and no single index offers a satisfactory response to these problems, and even the best indices have significant weaknesses (Coppedge, Reference Coppedge2002; Munck and Verkuilen, Reference Munck and Verkuilen2002). For the purpose of this study, ICRG democratic accountability is used as a principal measure of democracy (DEMO). It is a measure of how responsive government is to its citizens and it is more likely that a less responsive government will fall, peacefully in a democratic society, but possibly violently in a non-democratic one. The score for the democracy index ranges from zero to six, higher values signalling dominated democracy. The Polity2 institutionalized measure of democracy index from Polity4 dataset is used as an alternative measure of democracy. The index is based on the competitiveness of political participation, the openness and competitiveness of executive recruitment and constraints on the chief executives.Footnote 8 It measures the degree of democracy and autocracy. The most widely used Polity score combines the scores on the democracy and autocracy indices to a single regime indicator. The score captures the regime authority spectrum on a 21-point scale ranging from −10 (hereditary monarchy) to +10 (consolidated democracy). For ease of explanation, we rescaled the index from 1 to 21 and a higher value indicates a higher level of democracy.
3.3.3 Macroeconomic data
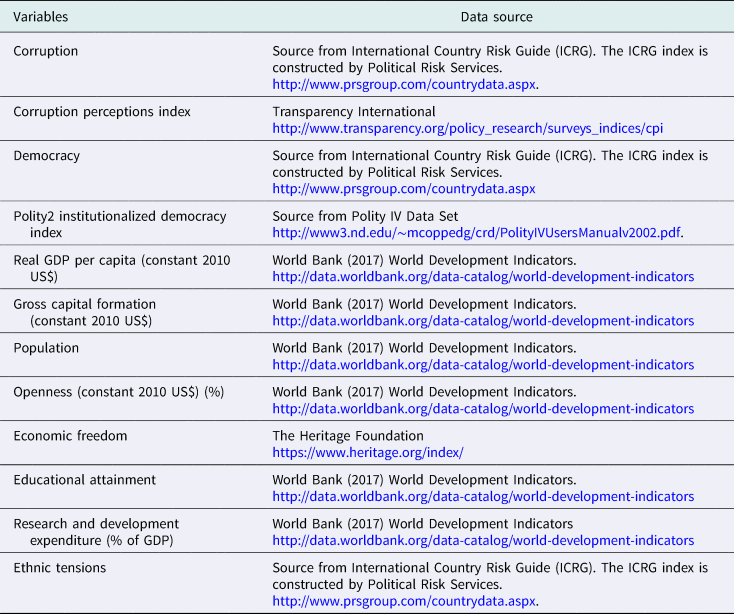
Real GDP per capita is the dependent variable. The real GDP per capita, capital formation, research and development expenditure to GDP, educational attainment and money supply (M2) to GDP data are obtained from the World Bank's World Development Indicators (WDI) database. For the purpose of the study, the economic freedom index is used along with the openness variable and the data are from the Heritage Foundation. ET data for the instrumental variable are from ICRG index, Political Risk Services. Due to missing data, the total number of countries used in any regression ranges from 103 to 136 for the period 1984–2016. The summary statistics and data description and sources are presented in Appendix Tables A1 and A2, respectively.
4. Empirical results
We start our investigation with the Kernel-fit of the scatter-plots of the relationship between per capita real GDP with corruption democracy. The Kernel-fit line depicting the relationship between LGDPPC and CORR indicates that corruption lowers per capita income (Figure 3a). In other words, a higher income growth is associated with low levels of corruption. For instance, the average level of income per capita for the period 1984–2016 in China is around US$2,520, and the corruption score is 2.26, whereas, the income per capita and corruption level in Congo Democratic Republic are US$456 (approx.) and 5.26, respectively.Footnote 9 The results support the common claim that less corruption enhances economic growth.Footnote 10 Both ICRG and TI CPIs support the results.
Kernel fit plots for the relationship between corruption, democracy and growth. (a) Relationship between corruption and growth. (b) Relationship between democracy and growth.

However, Figure 3b shows a U-shaped relationship between LGDPPC and DEMO (for both the democracy indices) suggesting that some autocratic countries are performing well in terms of growth along with their democratic counterparts. In other words, there is a high level of income both at a greater level of autocracy and democracy but the income level decreases at the transition stage in the process of democratization. On the one hand, countries with greater democracy exhibit higher income (such as Australia and United Kingdom). Likewise, countries with stronger autocracy also demonstrate a higher income (e.g. Brunei and Saudi Arabia). On the other hand, per capita income levels of the transition countries (i.e. from autocracy to democracy) such as Russia and Tunisia are quite low. However, countries with a very high level of democracy enjoy very high income compared to the strong autocratic countries. This result supports the widespread argument in the existing democracy literature that democracy provides the best opportunities for growth (e.g. Jalles, Reference Jalles2010; Barro, Reference Barro1991). However, in order to get the firmer support of the results, one should rigorously test whether the change in coefficients is significant or not. In addition, we also explore the interaction effect of corruption and democracy on economic growth to estimate the joint effect of democracy and corruption on growth.
4.1 Regression results
The estimated regression coefficients using ICRG corruption and democracy indices for the base model in equation (1) are reported in Table 1. The OLS regression results without controls suggest that corruption coefficient is negative and significant but the coefficients for democracy and the interaction term are positive but insignificant (column 1, Table 1). However, the results with control variables show that the coefficient of corruption is positive but not significant indicating that there is not enough evidence that corruption is growth-enhancing. The coefficient for democracy is positive and significant at the 5% level, suggesting that a greater democracy enhances growth (column 2, Table 1). This result supports the findings of Alfonso-Gil et al., (Reference Alfonso-Gil, Lacalle-Calderón and Sánchez-Mangas2014) and Benyishay et al., (Reference Benyishay and Betancourt2010), which show that movements towards higher levels of civil liberty are associated with higher economic growth rates. Moreover, Cooray et al. (Reference Cooray, Dutta and Mallick2017) find that a free press improves the government's accountability to the society and leads to better governance mostly in the developed countries.
Growth–corruption relationship: 1984–2016

Note: Robust standard errors are in parentheses with robust standard errors. (ii) ***, **, * indicate significance level at the 1%, 5% and 10%, respectively.
The coefficient for the interaction term between corruption and democracy is negative and significant at the 1% level of significance illustrating that democracy and corruption together have significant damaging effects on economic growth in a country (column 2, Table 1). It suggests that the effect of corruption on growth is less positive as the level of democracy expands. A one unit increase in corruption level reduces log real GDP per capita by 155%. Based on equation (2a), the interaction effect of corruption on real GDP per capita at the mean score of democracy of 3.81 is −5.85, which is significant, suggesting that a one standard deviation point increase in CORR increases economic growth by 6.51 points at the mean democracy index. The impact of corruption on economic growth demonstrates some mixed effects. If a country is more autocratic, then more corruption is associated with higher growth. Alternatively, the effect of corruption on growth is less positive as the level of democracy expands. On the other hand, the interaction effect of democracy on real GDP per capita (equation (2a)) at the mean corruption score 3.07 is 0.02 indicating that a one standard deviation point increase in democracy (DEM) increases economic growth by 0.028 points at the mean corruption index. Like corruption, democracy also illustrates the mixed effects on income growth, democracy stimulates (dampen) growth when corruption is low (high). In other words, corruption shows positive effect if a country is more autocratic. But if a country has more corruption, then more democracy is growth-inhibiting. The results of these two interactive factors are interpreted in detail in the partial (marginal) effect estimation.
The panel least-square and two-way FE results both with and without control variables confirm the OLS results that corruption is growth-enhancing in autocracies (columns 4–5 and 7–8, Table 1). Moreover, the magnitude of the coefficient of the interaction term increases after including the control variables. Control variables are expected in signs, such as higher stock of capital per capita, educational attainment, research and development expenditure, more open economy and money supply increase the rate of per capita income. One should note that due to the large number of missing values of research and development expenditure data, which reduces the number of observations significantly, we reported the results without research and expenditure variable. The results remain the same when the ICRG democracy index is replaced by Polity2 measure of institutionalized democracy indicator (Polity4 dataset) (Table 2).
Growth–corruption relationship: 1984–2016

Note: Robust standard errors are in parentheses with robust standard errors. (ii) ***, **, * indicate significance level at the 1%, 5% and 10%, respectively.
4.2 The East Asian paradox
East Asian countries present a number of puzzles and paradoxes mainly due to the fact that the growth rates in East Asia have greatly exceeded all other regions of the world. The current economic wisdom holds that, ceteris paribus, higher levels of corruption should be associated with lower rates of development (e.g. Mauro, Reference Mauro1995). East Asian countries do not follow the wisdom and the economic success is paradoxical because most of the countries in the region have been plagued by relatively serious high-level corruption throughout the period of rapid growth and the political environment in the region is mostly autocratic. The average level of corruption and GDP per capita growth over the period 1984–2016 in Table 3 show that some East Asian countries enjoy a high level of economic growth in spite of having a high level of corruption (such as China and South Korea). The East Asian paradox is tested using interaction among East Asian dummy variable and corruption and democracy variables. The FE result confirms that the interaction effect between corruption and democracy is positive (column 9, Table 1) in East Asian countries confirming the paradox that countries in East Asian countries grow faster despite the high level of corruption and restricted democracy. Both ICRG and Polity2 measure of institutional democracy indices support these results.
Average level of corruption and GDP per capita growth: East Asian Evidence

Note: CORR and GDPPCG denote corruption and GDP per capita growth
4.3 Robustness tests
4.3.1 Dependent variable GDP per capita growth
The results using GDP per capita growth as a dependent variable using the Barro type growth regression with initial GDP per capita as independent variable confirms the convergence theory of growth as the coefficient of initial GDP per capita (Barro, Reference Barro1991) is negative and significant at the 1% level (not reported due to the limited space). The result suggests that if a country's GDP per capita in 1984 is higher than others, then the country's growth rate over the period is less than other countries. The interaction coefficient is negative and significant, which is consistent with our earlier results that the impact of corruption on growth reduces as a country's democracy level expands.Footnote 11 Furthermore, the results suggest that corruption increases growth in East-Asian countries and this result is significant and positive in OLS, panel period FE and two-way FE.
4.3.2 Two-stage least squares
The TSLS estimates show that ET and lagged variables are good predictors of corruption and also confirm the panel least square and two-way FE estimates that joint effect of corruption and democracy is growth deterring, although the interaction term is not significant. The first stage estimation shows that ET coefficient is positive and significant at the 1% level indicating that corruption level increases significantly as ET increase in a country. This result is consistent with Mauro (Reference Mauro1995). The first-stage F-value is 175.08 which is >10, suggesting that the instruments are not weak.Footnote 12
System-GMM results are robust and provide a strong evidence that higher corruption does itself increase growth when countries are more autocratic (Appendix Table A4). The coefficients of the interaction terms are negative and significant for both ICRG and Polity measure of democracy, confirming our earlier results that corruption is growth-enhancing in autocracies (columns 1–4). The estimated coefficient for current per capita GDP growth with respect to its lagged value reveals a large degree of persistence in the level of GDP per capita growth. Other control variables such as higher investment, educational attainment and more open economy increase the rate of per capita income growth. On the other hand, a high inflation and population growth and a higher government final consumption level reduce economic growth. The model passes the test of absence of AR (2) in the error term and estimates are all robust. In both the cases, the model passes the Hansen-J test. The results remain the same when the ICRG democracy index is replaced by Polity2 measure of institutionalized democracy indicator (columns 3–4).
4.3.3 Transparency International's corruption perception index
We extend the analysis by estimating the equations by using TI's CPI. The results for CPI measure in both cases (ICRG and Polity2 democracy measure) show that the estimated coefficients for the interaction term retain the same sign, although the level of significance varies. The evidence strongly supports the hypothesis that an increase in corruption increases the level of income per capita if the country becomes more autocratic. However, the results are not reported here due to limited space.
4.4 Marginal effect of democracy and corruption
This subsection provides a more rigorous analysis for the interaction effect between democracy and corruption on economic growth. The above findings show that a greater democracy does not foster growth in a more corrupt country. Oppositely, autocratic countries promote growth in the presence of corruption. In order to interpret the impact of democracy and corruption on per capita income growth, the marginal effects are estimated based on equations (2a and 2b). Table 4 reports the results of the marginal effect of democracy and corruption on per capita income at various percentiles (10th, 25th, 50th, 75th, 95th and mean) of democracy and corruption using panel two-way FE.
The effect of democracy and corruption on the growth of real GDP per capita: marginal effect analysisa

(i) Robust standard errors are in parentheses with robust standard errors. (ii) ***, **, * indicate significance level at the 1%, 5% and 10%, respectively. (iii) CORR and DEM denote corruption and democracy (ICRG democracy Index), respectively.
a Two-way fixed effects.
For a deeper perspective, we provide the names of the countries to which these percentiles correspond in Table 4. The marginal effect of corruption on growth at the mean score of DEMO of 3.81 is 0.048. It suggests that a one standard deviation point increase in CORR increases income per capita by 0.05 points at the mean democracy index. As discussed earlier the impact of corruption shows some mixed results at different percentiles of democracy. If a country is less democratic then an increase in corruption is associated with greater economic growth; yet once past the threshold point (i.e. between 75th and 95th percentile), a higher level of corruption lowers growth as the economy becomes more democratic.Footnote 13 Also, it is worth noting that the effect of corruption is significantly positive at the 10th percentile when democratic freedom is very restricted (such as Togo) whereas, the effect is negative when the degree of political freedom is very high (above 95th percentile). For example, Finland has a mature democracy (average score of 6) and is at the 95th percentile in the sample and it experiences negative growth if there is an increase in corruption level. Conversely, the results show that lowering corruption has a significant positive impact on economic growth in democracies. In other words, if a country is highly democratic then the existence of a corrupt economy reduces growth. This suggests that an anti-corruption effort is a cure for growth if a country is highly democratic. Otherwise, a high level of corruption dampens growth in a democratic setting of a country like India. These empirical findings support the theoretical conjectures discussed in Section 2 of the paper.
On the other hand, the marginal effect of democracy on per capita income at the mean corruption score of 3.0 is 0.012. This implies that a one standard deviation increase in democracy index increases growth by 0.02 points. The result indicates that the marginal effect of democracy has a positive impact on growth given an average level of corruption. In particular, democracy enhances growth significantly only when there exists a very low level of corruption (at the minimum score of corruption). For instance, Sweden has a very low corruption level (average corruption score is 0.0) and a one standard deviation rise in Sweden's democracy score, real per capita GDP increases by 4.31 points (3.08*1.40). However, the effect of democracy becomes negative when a country is very corrupt (for example Congo Democratic Republic). The result suggests that democracy is a cure for growth when a country is less corrupt.
The marginal effects are also estimated using System-GMM-Dynamic-Panel with GDP per capita growth as a dependent variable. The threshold level for the marginal effects of corruption and democracy are shown in Figures 4 and 5, respectively. The threshold level for the marginal effect of corruption is between 3 and 4 of democracy indices suggesting that after the threshold level of democracy, economic growth decreases as corruption level increases. The threshold level for the marginal effect of corruption is a little lower than the threshold level for the marginal effect of democracy (between 4 and 5). The results are very similar to two-way panel FE reported in Table 4.
Marginal effect of corruption on growth.
Note: Higher values of the democracy measure indicate greater democracy.

Marginal effect of democracy on growth.
Note: Higher values of the corruption measure indicate higher corruption.

4.5 Results: autocratic countries
This final step is to explore the channels that why and how corruption is growth-intensifying in autocratic countries. To answer this, the whole sample is divided into two groups based on the mean score of Polity2 democracy index and the countries with democracy value below the mean score are treated as autocratic. We re-run the estimations for the autocratic countries for the period 1984–2016 looking at our theoretical conjecture that credible commitments by the political leaders to the business can boost investment and in turn growth. The interaction effect of corruption and economic freedom on growth is estimated as Saha et al. (Reference Saha, Gounder and Su2009) and Faria et al. (Reference Faria, Morales, Pineda and Montesinos2012) predict that economic freedom can enhance business activity by providing credibility to the investors. The results (Table 5) illustrate that coefficients on corruption are mostly positive and significant (columns 1, 4–5) which is consistent with our earlier results. The interaction effect is positive revealing that corruption may grease the wheel if greater economic freedom is provided. Moreover, column 4 suggests that corruption with higher economic freedom increases growth if capital formation in a country is increased and the coefficient is highly significant. In other words, if political leaders in an autocratic country deliver credibility by providing freedom to run business even at the cost of sharing rents, this leads to higher investment and growth in that country. The result is consistent with Mullings (Reference Mullings2018) which finds a direct effect of economic globalization on growth observed for the sub-sample of developing countries. The results for the subsample of democratic countries reveal that economic freedom is not efficient in controlling corruption and increasing growth for these countries (Table 6). The result is consistent with Saha et al. (Reference Saha, Gounder and Su2009), which find that economic freedom is needed more to combat corruption than political freedom. The case of India supports this finding as India, while being the largest democracy in the world, has less economic freedom than China and South Korea.
Growth–corruption relationship in autocracies: 5-year average panel, 1984–2016

Note: Robust standard errors are in parentheses with robust standard errors. (ii) ***, **, * indicate significance level at the 1%, 5% and 10%, respectively.
Growth–corruption relationship in democracies: 5-year average panel, 1984–2016

Note: Robust standard errors are in parentheses with robust standard errors. (ii) ***, **, * indicate significance level at the 1%, 5% and 10%, respectively.
For the robustness check, we have also selected the whole sample into autocracies (−10 to −6) and democracies (+6 to +10) based on the Center for Systemic Peace (CSP). These results confirm our earlier results presented in Tables 5 and 6. However, the number of observations for the autocracies is very low (only 33). We have also organized the subsamples using general consensus that (−10 to 0) for autocracies and (1 to +10) for democracies and the results are robust and consistent with all three measures of autocracies and democracies defined in this study.Footnote 14
On the other channel, if a greater money supply is dechannelized from the economy due to a higher level of corruption, this can have a negative effect on growth by disturbing macroeconomic stability in autocratic countries. The coefficient for the interaction term between corruption and money supply is negative and significant (column 5, Table 4) indicating that if autocracies (with greater monopolization of power) suffer from corrupt activities by political elites, this can lead to less resources resulting in negative growth and lower investment. The results explain that not all autocracies are growth-enhancing with the presence of corruption.
5. Conclusions
A large literature has examined the effect of corruption on growth. In this paper, we examine whether the corruption–growth relationship is likely to be different in autocracies as compared to democracies. We use a panel data set of over 100 countries, for the period 1984–2016. We estimate the relationship between corruption and growth using various panel estimation techniques including FE, TSLS and Dynamic-Panel-System-GMM methods. We also use different measures of democracy and corruption. Our results are remarkably consistent. We find that on average, the effect of corruption on growth is positive in autocracies as compared to democracies.
Our results provide support for the so-called East Asian paradox of high corruption and high growth and suggest that the benign effect of corruption on growth is because of the authoritarian nature of the political regimes in these countries for a large duration of their development experience. The political regimes in these countries gave firms confidence that the ruling powers will deliver on the deals that they have entered into. We present suggestive evidence that the key mechanism was the credible commitment of political leaders in East Asia to economic freedom and maintaining a pro-business environment, albeit with crony capitalist arrangements. On the contrary, for the average democratic countries, the effect of corruption on growth is likely to be strongly negative. Democratization is likely to weaken the positive relationship between corruption and growth in previously autocratic countries, and the increasing wave of democratization observed in the developing world suggests that corruption may be more of a threat to economic growth in the years ahead.
Appendix
Descriptive statistics (5-year average panel)

Data source
Correlation coefficient: 5-year panel data

Corruption, democracy and growth using System-GMM: 1984–2016


 Open access