





Underweight is a globally recognised public health concern(Reference Ezzati, Lopez and Rodgers1). According to the WHO, underweight is defined as having a BMI of less than 18·5 kg/m2 (2). Although the prevalence of underweight has been historically high in low-income countries, it has been declining globally in recent decades. In contrast, women in Japan and South Korea are among the few demographic groups worldwide that experienced a substantial increase in underweight between 1990 and 2022(3,4) . This trend is particularly evident among younger women, with increases observed in countries such as Sweden, Finland and France(Reference Lazzeri, Rossi and Kelly5).
In Japan, underweight among women has been identified as a key issue in the third term of Health Japan 21, where improving women’s health has been designated as a priority area. The proportion of underweight women in Japan is high by international standards(2,6) , with 20·2 % of women in their twenties classified as underweight(6). In addition, the average BMI among young women in Japan has declined over the past 25 years(Reference Sugawara, Saito and Sato7).
Underweight in women is associated with various health risks, including osteoporosis(Reference Blum, Harris and Must8), diabetes(Reference Tatsumi, Ohno and Morimoto9), low-birthweight infants(Reference Fukui, Suto and Kaneko10,Reference Boriboonhirunsarn and Srikureja11) , poor outcomes in assisted reproductive technologies(Reference Zheng, Cai and Liu12) and impaired glucose tolerance(Reference Sato, Tamura and Nakagata13). Previous studies have suggested that inadequate nutrient intake may underlie underweight status(Reference Uzogara14). A small-scale Japanese study conducted at a nutrition assessment clinic reported that women aged 20–65 years with a BMI below 17·5 kg/m2 had insufficient intakes of carbohydrates, dietary fibre, Fe, Ca, vitamin B₁, folate and vitamin D(Reference Iizuka, Sato and Kobae15). Although these findings suggest potential differences in dietary intake among underweight women, evaluation based solely on individual nutrients may not fully capture overall dietary characteristics. In addition, the previous study was limited in terms of sample size and participant characteristics, and comprehensive evaluation of overall diet quality was not conducted(Reference Iizuka, Sato and Kobae15). Furthermore, in Japan, previous studies examining the relationship between diet quality and body weight have mainly focused on specific populations, such as pregnant women(Reference Imai, Takimoto and Kurotani16), and evidence among healthy Japanese adults remains limited. Dietary habits may also vary depending on whether underweight women have a desire for thinness(Reference Mori, Asakura and Sasaki17), indicating that psychological factors could influence their nutrient intake.
Given these findings, overall diet quality among underweight women remains unclear. The present study aimed to assess diet quality among underweight Japanese women by comparing them with women of normal weight.
Methods
Data sources
This cross-sectional study is a secondary analysis of existing data. It used data from an online questionnaire survey conducted between February and March 2023, targeting Japanese adults aged 20–79 years. A detailed description of this study is available elsewhere(Reference Murakami, Shinozaki and Okuhara18,Reference Murakami, Shinozaki and Okuhara19) . The primary objective of the original survey was to examine the patterns of exposure to nutrition- and diet-related media information and their associated factors among the general population and health professionals allied to nutrition, including dietitians and registered dietitians. Specifically, the target population was designed to encompass the general public alongside nutrition- and diet-related health professionals, including dietitians, registered dietitians, physicians and dentists, while excluding individuals working in health professions unrelated to nutrition (e.g. veterinarians, dental hygienists, assistant nurses, clinical psychologists and nurse practitioners).
Data collection was conducted by Rakuten Insight, an online survey company, which randomly selected participants from its panel. Of 2 603 155 registered panellists aged 20–79 years, 676 329 were randomly invited via email to participate in the survey. Those who consented accessed the web-based screening survey through the webpage link. The study outline was presented at the beginning of the survey, and 76 845 individuals who agreed to participate proceeded to the screening phase. Participants were recruited using stratified sampling based on age, sex and occupation(Reference Murakami, Shinozaki and Okuhara18,Reference Murakami, Shinozaki and Okuhara19) , and only those in strata with available vacancies were able to proceed to the main study (e.g. women aged 20–29 years). Among those who completed the screening survey, 7722 advanced to the main study and 6600 completed all survey items. No weighting procedures were applied in the present analysis.
This study was conducted according to the Declaration of Helsinki and was approved by the Ethics Committee of the Faculty of Medicine, University of Tokyo (Approval No.: 2022288NI, approved on 13 January 2023). Informed consent was obtained online from all participants.
Analytic sample
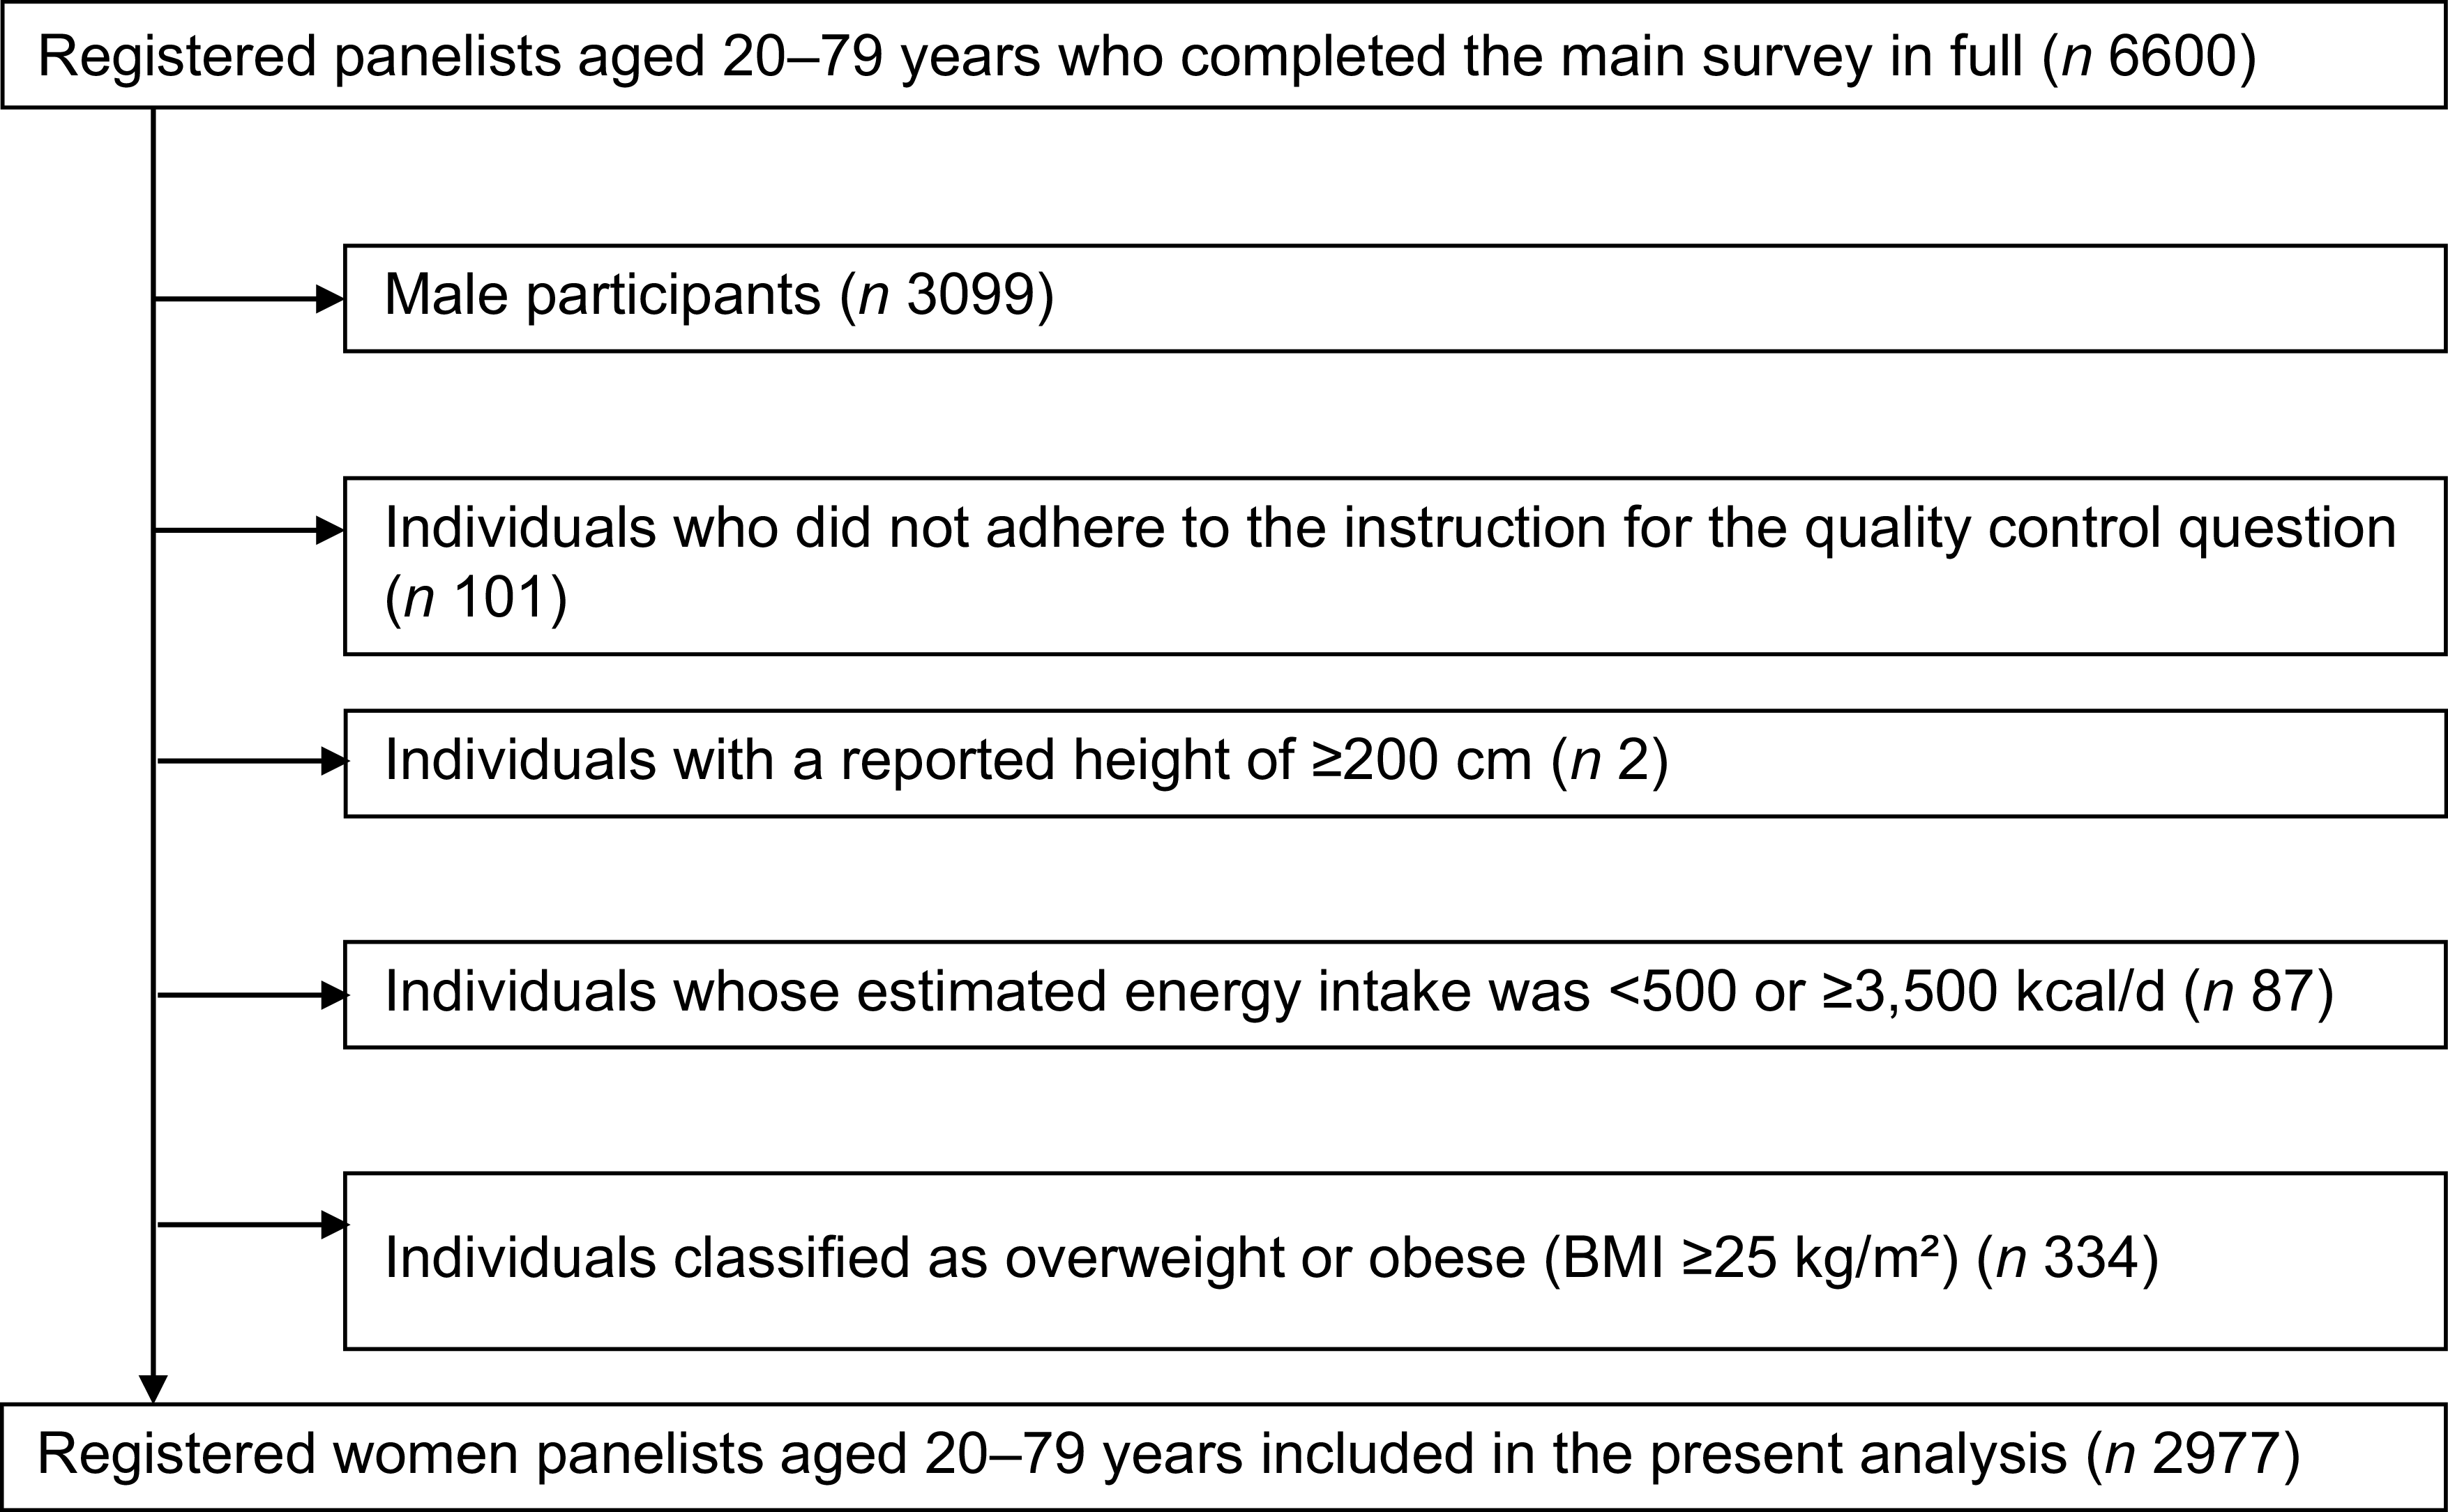
As this study focused on women, 3099 male participants were excluded from the 6600 survey respondents (Figure 1). Additionally, 101 individuals were excluded because they selected responses other than ‘neither agree nor disagree’ to the following question designed to identify unreliable responders: ‘This question is to investigate ‘unreliable’ answers when responding to the survey. Please select neither agree nor disagree from the following options’. The response options were strongly agree, agree, neither agree nor disagree, disagree or strongly disagree (Reference Murakami, Shinozaki and Okuhara19).
Flow chart of participant inclusion for the present analysis.

Participants with a reported body height of ≥ 200 cm (n 2) and those with an energy intake calculated from the short version of the Meal-based Diet History Questionnaire (sMDHQ) of < 500 kcal/d or > 3500 kcal/d (n 87) were also excluded due to concerns about data reliability(Reference Murakami, Shinozaki and Okuhara19). This cut-off was adopted to exclude individuals who reported implausible energy intakes(Reference Bertoia, Rimm and Mukamal20), and the identical criterion has also been applied in a recent dietary study among Japanese populations using the sMDHQ(Reference Murakami, Shinozaki and Okuhara19). Furthermore, 334 participants classified as overweight or obese (BMI ≥ 25 kg/m2 (2)) based on self-reported height and weight were excluded. A total of 2977 women remained in the final analysis and were categorised into the underweight group (BMI < 18·5 kg/m2 (2)) and the normal-weight group (BMI ≥ 18·5 to < 25 kg/m2 (2)). There were no missing data for the variables included in the present analyses.
Assessment of diet quality
Dietary information was collected using the sMDHQ, which was developed based on the validated full version of the Meal-based Diet History Questionnaire (MDHQ)(Reference Murakami, Shinozaki and Kimoto21–Reference Murakami, Shinozaki and Livingstone23). The MDHQ consists of three parts: (1) the frequency of consumption of major food groups during the previous month for each main meal (breakfast, lunch and dinner) and snacks (morning, afternoon and night snacks), comprising 113 items; (2) the relative consumption frequency of sub-food groups within major food groups (seventy-two items) and questions on the frequency and portion size of alcohol consumption (ten items); and (3) general eating behaviours, including twenty-two items.
In contrast, the sMDHQ includes only questions on the frequency of consumption of major food groups at breakfast, lunch and dinner (sixty-six items) and the frequency and portion size of alcohol consumption (ten items). The sMDHQ estimates dietary intake using fixed portion sizes based on sex-specific average intake values rather than collecting individual portion size information(Reference Murakami, Shinozaki and McCaffrey24). In this study, estimated energy and nutrient intake from the sMDHQ was calculated using the 2015 edition (7th revision) of the Standard Tables of Food Composition in Japan(25) and a dedicated calculation algorithm(Reference Murakami, Shinozaki and McCaffrey24).
Food group and nutrient intakes were estimated from the sMDHQ. As shown in online Supplementary Table 1, food groups were classified based on the food group of the MDHQ. Food groups were classified into nineteen categories. For energy-producing nutrients (protein, fat and carbohydrates), intakes were energy-adjusted using the density method. For food groups and other nutrients, crude intake values (amount per day) were analysed (without energy adjustment).
Diet quality was assessed using the Healthy Eating Index 2015 (HEI-2015), as described in previous studies(Reference Krebs-Smith, Pannucci and Subar26–Reference Panizza, Shvetsov and Harmon28). The HEI-2015 is a composite score used to assess adherence to the 2015–2020 Dietary Guidelines for Americans(29) and is scored on a scale from 0 to 100, with higher scores indicating better overall diet quality. It consists of nine adequacy components (maximum score for each component), including total fruits (5), whole fruits (5), total vegetables (5), greens and beans (5), total protein foods (5), seafood and plant proteins (5), whole grains (10), dairy products (10) and fatty acids (10; calculated as the ratio of PUFA and MUFA to SFA), and four moderation components, including refined grains (10), Na (10), added sugars (10) and saturated fats (10). HEI-2015 scores were calculated from dietary intake estimated using the sMDHQ. Both total and component scores were examined. The relative validity of the sMDHQ for estimating HEI-2015 scores was examined in Japanese adults against a 4-d weighed dietary record(Reference Murakami, Shinozaki and Okuhara19). The HEI-2015 score estimated from the sMDHQ showed a correlation with that from the dietary record (Spearman’s correlation coefficient: 0·47)(Reference Murakami, Shinozaki and Okuhara19), suggesting its ability to rank individuals according to overall diet quality.
Basic characteristics of participants
Information on participants’ basic characteristics, including height, weight, sex, age, educational background, annual household income, employment status, marital status, household size, presence of chronic diseases, smoking status and occupation. Age was categorised into six groups: 20–29, 30–39, 40–49, 50–59, 60–69 and 70–79 years. Education was classified as junior high school or high school, junior college or vocational school, university or graduate school and others. Household income was categorised as < 4 million yen, 4–7 million yen and > 7 million yen. Smoking status was classified as never smoked, formerly smoked and currently smoking. Participants were also classified based on nutrition- and health-related occupations into six categories: not applicable, individuals with private qualifications in food and nutrition, media-related personnel, dietitians/registered dietitians, doctors/dentists and other healthcare providers (nurses, midwives, public health nurses and pharmacists).
Statistical analysis
Basic characteristics were summarised for all participants and the normal-weight and underweight groups, with counts and percentages calculated for each category. Differences in food group intake, nutrient intake and HEI scores between the normal-weight and underweight groups were assessed using general linear models. Adjusted mean values and their standard deviations were estimated after controlling for potential confounders, including age, educational background, household income, smoking status and occupation. Additional analyses excluding participants in nutrition- and health-related professions were conducted to examine the potential influence of this subgroup on the findings. All statistical analyses were conducted using SAS software (version 9.4, SAS Institute Inc.) and R (version 4.5.2). A two-sided P-value < 0·05 was considered statistically significant.
Results
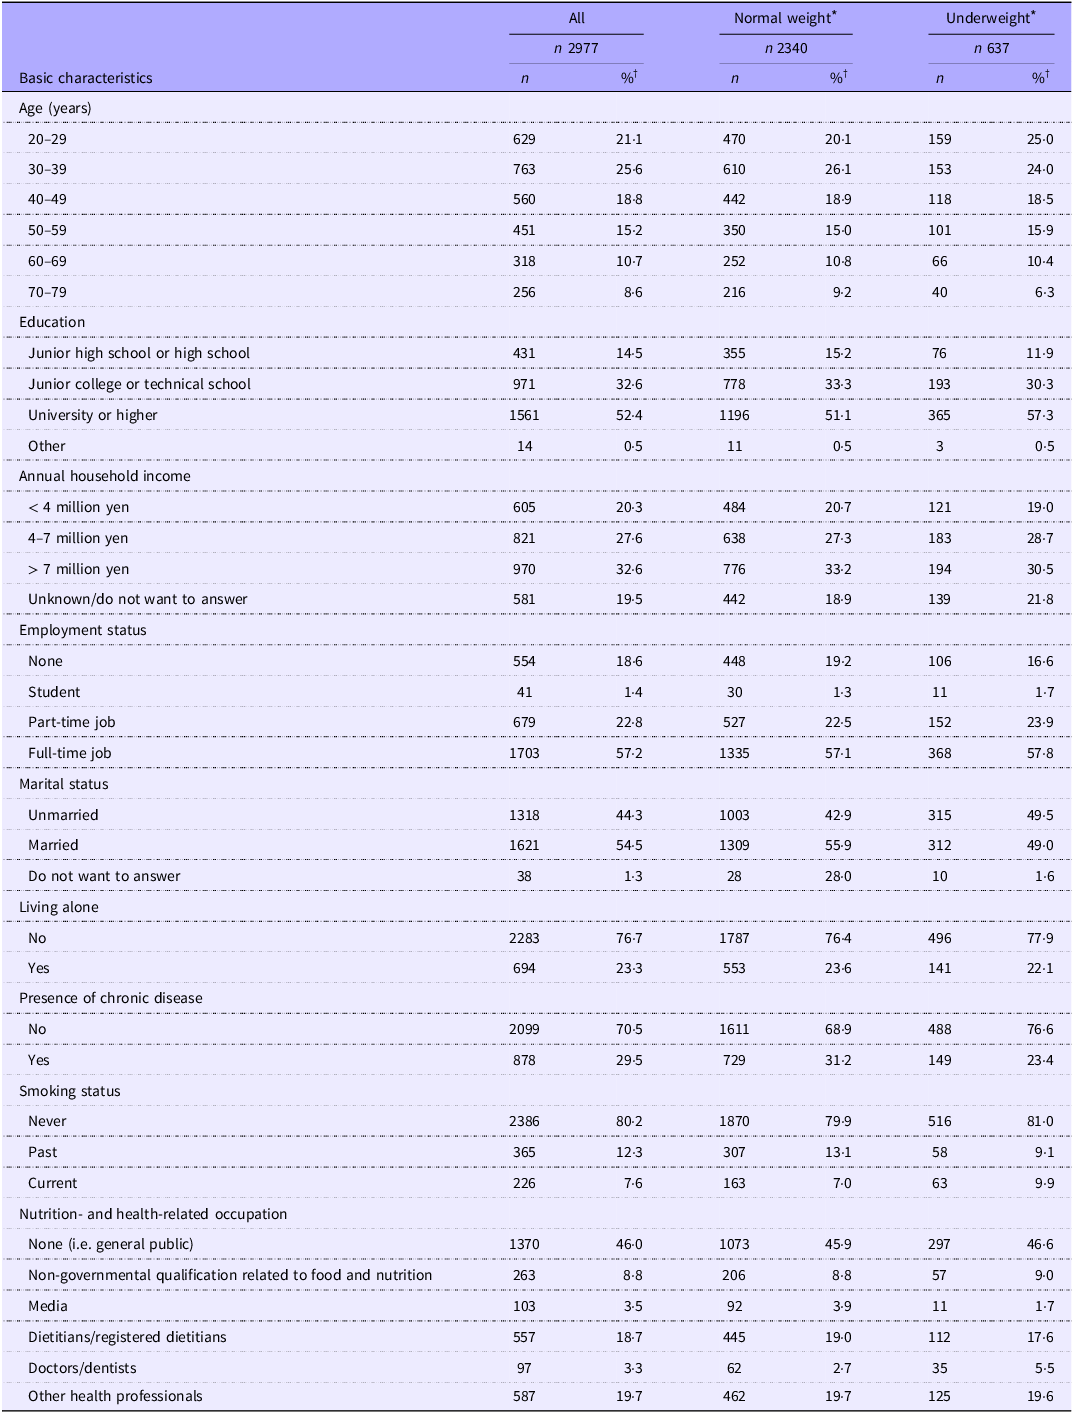
Table 1 presents basic characteristics of the participants. Among the 2977 women analysed, 637 (21·4 %) were classified as underweight (BMI < 18·5 kg/m2), while 2340 (78·6 %) were classified as normal weight (BMI ≥ 18·5 to < 25 kg/m2). Compared with the normal-weight group, the underweight group had a higher proportion of younger individuals, those with a longer educational background and those who were unmarried, while the proportion of individuals with chronic diseases was lower. Additionally, the underweight group had a higher proportion of current smokers and a lower proportion of former smokers compared with the normal-weight group. Due to the sampling design, nearly half of the participants were from the general public, while the rest were engaged in nutrition- and health-related occupations.
Basic characteristics of participants by weight status

Table 1. Long description
A table comparing basic characteristics of participants by weight status. The table has 18 rows and 6 columns. Column headers are: All, Normal weight, and Underweight. Row labels include Age, Education, Annual household income, Employment status, Marital status, Living alone, Presence of chronic disease, Smoking status, and Nutrition- and health-related occupation. Each category is further divided into subcategories with corresponding values in number and percent. The table provides a detailed comparison of various demographic and health-related characteristics between underweight and normal weight participants.
* Using self-reported weight and height, weight status categories were defined according to the criteria of the WHO, with BMI < 18·5 kg/m2 being classified as underweight and ≥ 18·5 to < 25 kg/m2 as normal weight(2).
† Due to rounding, the total may not always be 100.
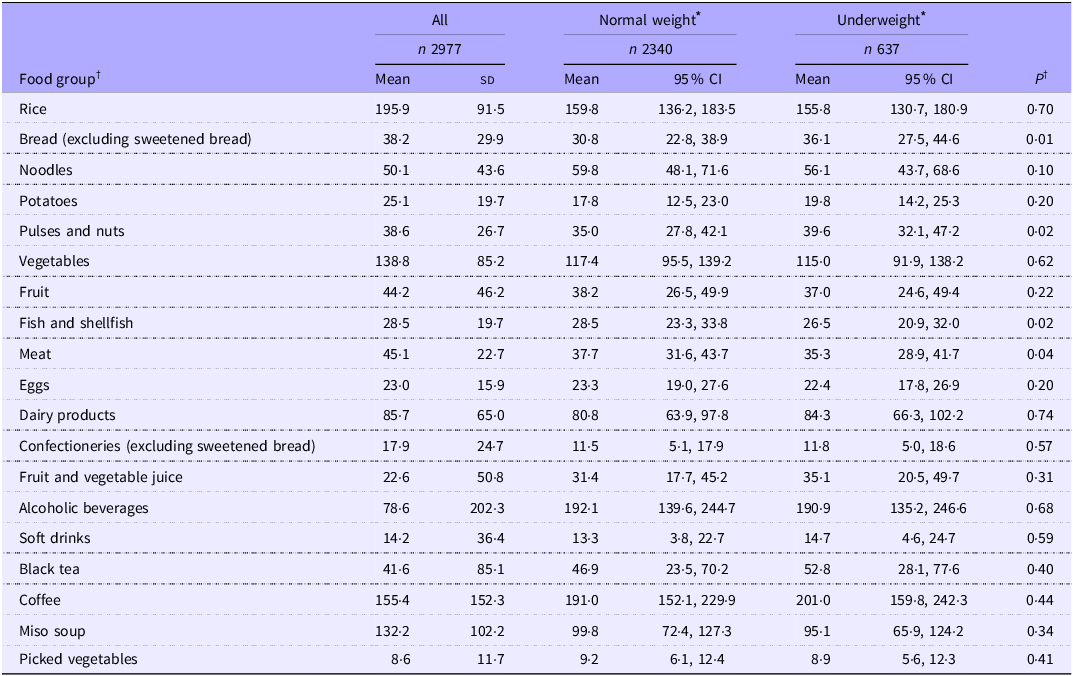
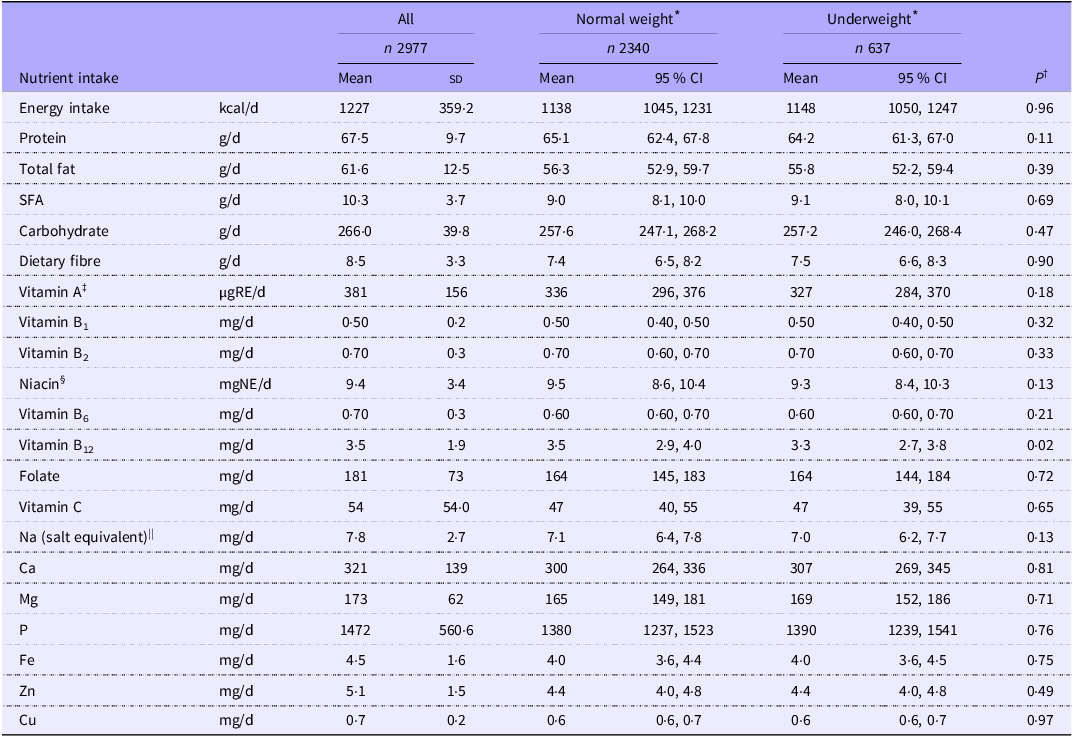
When comparing food group intake between the underweight and normal-weight groups (Table 2), the underweight group had a lower adjusted mean intake of fish and shellfish and meat and higher adjusted mean intakes of bread and pulses and nuts than the normal-weight group. Other food groups showed similar intakes between the groups. Regarding nutrient intake (Table 3), the adjusted mean intake of vitamin B12 was lower in the underweight group than in the normal-weight group. Other nutrients showed similar intakes between the groups.
Daily food group intake (g) for Japanese, according to weight status

Table 2. Long description
The table presents data on daily food group intake in grams for Japanese individuals, categorized by weight status. It includes columns for all participants, normal weight individuals, and underweight individuals. The table has 20 rows and 10 columns. Column headers are: Food group, All (Mean, SD), Normal weight (Mean, 95 percent CI), Underweight (Mean, 95 percent CI), and P value. Row labels include various food groups such as Rice, Bread, Noodles, Potatoes, Pulses and nuts, Vegetables, Fruit, Fish and shellfish, Meat, Eggs, Dairy products, Confectioneries, Fruit and vegetable juice, Alcoholic beverages, Soft drinks, Black tea, Coffee, Miso soup, and Pickled vegetables. Each row provides mean values and standard deviations for all participants, as well as mean values and 95 percent confidence intervals for normal weight and underweight individuals. The table also includes P values for comparisons between the groups.
sMDHQ, short version of the Meal-based Diet History Questionnaire; SD, Standard Deviation; CI, Confidence Interval.
* Using self-reported weight and height, weight status categories were defined according to the criteria of the WHO, with BMI < 18·5 kg/m2 being classified as underweight and ≥ 18·5 to < 25 kg/m2 as normal weight(2).
† P values were obtained using a general linear model adjusted for age category, educational level, income, employment status, marital status, living status, presence of chronic disease and smoking status.
Daily nutrient intake according to weight status

Table 3. Long description
The table presents nutrient intake data for two groups: normal weight and underweight. It includes columns for the total sample size, mean values, standard deviations, and 95 percent confidence intervals for each nutrient. The nutrients listed include energy intake, protein, total fat, saturated fatty acids, carbohydrate, dietary fiber, vitamins A, B1, B2, B6, B12, folate, C, sodium, calcium, magnesium, phosphorus, iron, zinc, and copper. Each nutrient’s intake is compared between the normal weight and underweight groups. Notable comparisons include vitamin B12, which shows a lower adjusted mean intake in the underweight group compared to the normal-weight group. Other nutrients show similar intakes between the groups.
sMDHQ, short version of the Meal-based Diet History Questionnaire; SD, Standard Deviation; CI, Confidence Interval; RE, retinol equivalents; NE, niacin equivalents.
* Using self-reported weight and height, weight status categories were defined according to the criteria of the WHO, with BMI < 18·5 kg/m2 being classified as underweight and ≥ 18·5 to < 25 kg/m2 as normal weight(2).
† P values were obtained using a general linear model adjusted for age category, educational level, income, employment status, marital status, living status, presence of chronic disease and smoking status.
‡ Retinol equivalents = retinol (μg) + β-carotene (μg) ÷ 12 + α-carotene (μg) ÷ 24 + β-cryptoxanthin (μg) ÷ 24.
§ Niacin equivalents = niacin (mg) + protein (mg) ÷ 6000.
|| Salt-equivalent (g) = Na (mg) × 2·54 ÷ 1000.
Table 4 shows the diet quality assessed by the HEI. The total HEI score was similar between the underweight and normal-weight groups. Among the adequacy components, only the score for total protein foods was lower in the underweight group. Additional analyses excluding participants in nutrition- and health-related professions showed similar findings to the main analyses (online Supplementary Table 2).
Health Eating Index score according to weight status

Table 4. Long description
The table compares diet quality assessed by the Health Eating Index score according to weight status. It includes data for all participants, those of normal weight, and those who are underweight. The table has 15 rows and 10 columns. Column headers are: All, Normal weight, Underweight, and P value. Row labels include HEI-2015, Adequacy components, Total fruit, Whole fruits, Total vegetables, Greens and beans, Whole grains, Dairy products, Total protein foods, Seafood and plant proteins, Fatty acids, Moderation components, Refined grains, Na, Added sugars, and Saturated fats. Each row provides mean values, standard deviations, and 95 percent confidence intervals for the different weight groups. Notable trends include similar total HEI scores between underweight and normal-weight groups, with the underweight group scoring lower in total protein foods.
sMDHQ, short version of the Meal-based Diet History Questionnaire; HEI-2015, Healthy Eating Index-2015; SD, Standard Deviation; CI, Confidence Interval.
* Using self-reported weight and height, weight status categories were defined according to the criteria of the WHO, with BMI < 18·5 kg/m2 being classified as underweight and ≥ 18·5 to < 25 kg/m2 as normal weight(2).
† P values were obtained using a general linear model adjusted for age category, educational level, income, employment status, marital status, living status, presence of chronic disease and smoking status.
Discussion
This study evaluated the diet quality among Japanese women with underweight compared with those with normal weight. As assessed by the HEI-2015, overall diet quality was similar between the two groups. Among the individual components of the HEI-2015, only the score for total protein foods was lower in the underweight group. To our knowledge, this is the first study to comprehensively evaluate diet quality by weight status among Japanese women.
This study showed that the underweight group had lower intakes of fish and shellfish, and meat, and higher intakes of bread, pulses and nuts compared with the normal-weight group. These findings are partially consistent with a study using 7-d photographic records among Chinese men and women aged 20–40 years(Reference Yu, Zhang and Gao30), which reported that individuals with underweight tend to consume less meat and have a higher proportion of plant-based protein. However, higher intakes of bread and lower intakes of fish and shellfish were not observed in that study, and the discrepancies may be attributable to differences in food culture, participant age and sex, or dietary assessment methods. Future research using standardised dietary assessment methods and including different age groups is needed to clarify the commonalities and differences in food group intake patterns among women with underweight. The present findings are partly consistent with a previous study among female college students, which also reported no significant differences in overall HEI scores according to BMI category(Reference Helvacı, Kartal and Ayhan31). In the present study, vitamin B₁₂ intake was lower in the underweight group than in the normal-weight group, and this may be partly explained by the lower intakes of animal-derived foods such as fish and shellfish, and meat, as observed in the food group analysis. These foods are the main dietary sources of vitamin B₁₂(Reference Watanabe32), and lower consumption of these foods may therefore contribute to reduced vitamin B₁₂ intake among underweight women.
These differences in food intake patterns may reflect not only nutritional factors but also sociocultural and behavioural influences related to body image and weight control. Previous studies have suggested that sociocultural pressures regarding thinness may contribute to body dissatisfaction and dieting behaviours among young women in Asian societies. In Japanese young women, sociocultural pressures towards thinness, particularly through social media and media exposure, have been reported to contribute to dieting and weight-control behaviours(Reference Ando, Giorgianni and Danthinne33). In addition, a study among adolescent girls in Hong Kong showed that peer pressure for thinness was strongly associated with body dissatisfaction, while media pressure was directly associated with dieting behaviours(Reference Lam, Lee and Fung34). Furthermore, among Japanese female university students, comparison with others and strong interest in female friends’ body shapes were reported to influence desire for thinness(Reference Mase, Ohara and Miyawaki35). The study also showed that female students with a desire for thinness tended to exhibit stronger dieting tendencies and disordered eating-related behaviours.
A previous study reported that dietary habits differ between underweight women with and without a desire for thinness(Reference Mori, Asakura and Sasaki17). For example, young Japanese women who were underweight and had a desire for thinness consumed smaller amounts of grains and rice compared with those without such a desire or with normal weight. These women also tend to have high intakes of confectioneries, such as candies, and fats. In contrast, underweight women without a desire for thinness have been reported to consume less confectionery and fat, but more carbohydrates, than women with normal weight. Although this study did not assess the presence or absence of a desire for thinness, such a desire may influence dietary behaviour and food intake patterns.
This study has several limitations. First, the participants were individuals registered with an Internet survey company, and only a small proportion expressed interest in the study. In addition, this study was a secondary analysis of data originally collected for a different research purpose. Notably, approximately half of the participants were nutrition- and health-related professionals. However, exclusion of participants who were nutrition- and health-related professionals did not materially alter the results (online Supplementary Table 2), suggesting that the findings were not substantially influenced by this subgroup. Nevertheless, the proportion of underweight individuals in the present study (19·2 %) was considerably higher than that reported in the National Health and Nutrition Survey (12·0 %)(6). Similarly, regarding education, the proportion of participants with a university or higher in the present sample (52·4 %) was higher than the national average reported in the 2020 Population Census (25·5 % for individuals aged 15 years and older, combining university and graduate school graduates)(36). These may be due to the younger age distribution of our sample compared with the national surveys(6). In addition, regarding household income, the present sample exhibited a higher income distribution than the national average. The proportion of participants with a household income of less than 4 million yen was lower, while those with 7 million yen or higher was greater compared with the 2024 Comprehensive Survey of Living Conditions (48·6 % and 25·4 %, respectively)(37). Regarding dietary variables, the percentages of energy intake from macronutrients (proteins, fats and carbohydrates) were relatively comparable between the present study and the National Health and Nutrition Survey(6). Overall, caution is needed when generalising the findings to Japanese women. Further studies in a more representative population are necessary.
Second, all variables in this study were based on self-reported data, including height and weight used to calculate BMI. Among women, self-reported height tends to be overestimated and weight underestimated, which can lead to a systematic underestimation of BMI(Reference Engstrom, Paterson and Doherty38), although previous studies have shown that self-reported height and weight are highly correlated with directly measured values(Reference McAdams, Van Dam and Hu39). Furthermore, the accuracy of self-reported anthropometric measures may vary according to sociodemographic characteristics such as educational attainment and socio-economic status(Reference Boström and Diderichsen40,Reference Gaston, Kendrick and Ogbenna41) . Therefore, differential misclassification of BMI according to participant characteristics cannot be ruled out. Future studies incorporating measured anthropometric data would further strengthen the validity of the findings.
Third, the HEI-2015 score estimated from the sMDHQ has shown a correlation with that from a 4-d weighed dietary record (Spearman’s correlation coefficient: 0·47)(Reference Murakami, Shinozaki and Okuhara19), suggesting its ability to rank individuals according to overall diet quality. Nevertheless, the sMDHQ estimates dietary intake using fixed portion sizes based on sex-specific average intake values rather than collecting individual portion size information. Therefore, lower intake associated with smaller-than-average portion sizes may not have been fully captured, which may be particularly important for people with underweight. In addition, as with any dietary assessment method based on self-report, measurement error cannot be ruled out, which may have obscured differences between groups. However, additional analyses restricted to plausible energy reporters (n 1529) based on the Goldberg cut-off(Reference Murakami, Livingstone and Okubo42,Reference Inomaki, Murakami and Livingstone43) showed similar findings (data not shown).
Fourth, reporting error is a common issue in dietary assessment and is well known to be closely associated with BMI(Reference Mattisson, Wirfält and Aronsson44,Reference Mahabir, Baer and Giffen45) . Previous studies have suggested that misreporting of dietary intake may vary according to body weight status, and reporting errors in dietary questionnaires have been associated with BMI, including in studies using recovery biomarkers,(Reference Murakami, Sasaki and Takahashi46,Reference Freisling, van Bakel and Biessy47) . Although evidence is limited regarding whether the extent of this bias differs specifically between underweight and normal-weight individuals, measurement error in self-reported dietary assessment may have attenuated small differences in dietary intake and diet quality between the groups. To evaluate this measurement error, we conducted additional analyses restricted to plausible energy reporters (n 1529) based on the Goldberg cut-off(Reference Murakami, Livingstone and Okubo42,Reference Inomaki, Murakami and Livingstone43) . These analyses showed similar findings (data not shown).
Fifth, the dietary data did not include snacks. Although snacks may contribute to total energy intake, their contribution in Japan is relatively small (approximately 10 %)(Reference Murakami, Shinozaki and Livingstone48), and snack consumption is lower than in many other countries. While this is a limitation, the sMDHQ meal data are likely sufficient for estimating food group and nutrient intake. Future studies should include snack data for a more comprehensive dietary assessment.
Finally, as this was a cross-sectional study, causal relationships or the direction of association cannot be determined. Longitudinal studies are needed to clarify the temporal relationships between nutrient intake and weight status.
In conclusion, this study found that overall diet quality was broadly similar between underweight and normal-weight Japanese women. These findings provide foundational evidence on the dietary characteristics and nutritional status of Japanese women and may contribute to a better understanding of factors related to dietary patterns among underweight women.
Supplementary material
For supplementary material/s referred to in this article, please visit https://doi.org/10.1017/S0007114526107867
Acknowledgements
The author would like to express sincere gratitude to Dr Hitomi Okubo (Department of Nutritional Epidemiology and Behavioural Nutrition, Graduate School of Medicine, The University of Tokyo) for her invaluable guidance and insightful advice in the preparation of this manuscript.
This work was supported by the Ministry of Health, Labour and Welfare (grant numbers: 22FA1022). The funder was not involved in the design, data collection, data management, data analysis, interpretation of results or preparation of this manuscript.
M. S.: Conceptualisation-Equal, Formal analysis-Equal, Investigation-Equal, Methodology-Equal and Writing – original draft-Lead; N. S.: Conceptualisation-Equal, Data curation-Equal, Formal analysis-Equal, Investigation-Equal, Methodology-Equal and Writing – review and editing-Equal; K. M.: Conceptualisation-Equal, Data curation-Equal, Funding acquisition-Equal, Investigation-Equal, Methodology-Equal, Project administration-Equal, Supervision-Equal and Writing – review and editing-Equal. All authors have read and agreed to the final version of the manuscript.
There are no conflicts of interest.


 Open access

