

Lactoferrin (LF) is an Fe-binding glycoprotein which is secreted into breast milk. It is multi-functional, with anti-bacterial(Reference Tomita, Bellamy and Takase1), anti-viral(Reference Harmsen, Swart and de Béthune2), immunostimulatory(Reference Zimecki, Właszczyk and Cheneau3), antioxidant(Reference Shoji, Oguchi and Shinohara4) and cancer-preventive potential(Reference Sekine, Ushida and Kuhara5). Because LF is a natural component of breast milk which is ingested by infants, it is considered to be a safe food factor; i.e. it has been approved as a food additive in Japan and is included in the generally recognised as safe category in the USA. It is therefore attracting increasing attention as a functional food. In a previous report, we documented the evidence of a novel function of LF as a visceral fat-decreasing agent. Using enteric-coated tablets to avoid degradation in the stomach, it was found that an 8-week administration of LF resulted in decreased abdominal fat accumulation, especially visceral fat, in Japanese men and women with abdominal obesity. The mechanisms underlying these phenomena are unknown. The objective of the present study was to shed light on the importance of the enteric coating.
Two studies have demonstrated the actions of LF on pre-adipocytes. Yagi et al. (Reference Yagi, Suzuki and Takayama6) showed the suppression of adipogenic differentiation of MC3T3-G2/PA6 cell lines, originally derived from the calvarium of a mouse(Reference Kodama, Amagi and Koyama7). Moreno-Navarrete et al. (Reference Moreno-Navarrete, Ortega and Ricart8) reported that LF also inhibits adipocyte differentiation of the 3T3-L1 cell line established from a mouse embryo. From these results, we hypothesised that enteric-coated LF (eLF), which reaches the small intestine intact, is transferred into the visceral fat, where it exerts inhibitory effects on lipid accumulation by adipocytes. In the present study, to validate this hypothesis, we compared the actions of LF and degradation products of stomach and small intestine digestive enzymes, respectively, on rat mesenteric fat tissue. We also investigated the LF distribution after gastric intubation to confirm that it can reach the visceral fat tissue.
Experimental methods
Animals and diets
Sprague–Dawley rats at 8 weeks of age were purchased from Japan SLC, Inc. (Shizuoka, Japan) and were maintained in a barrier room with a controlled temperature (23°C) under a 12 h light–dark cycle (light on from 07.00 to 15.00 hours), on ad libitum solid laboratory chow (CE-2, Clea Japan, Inc., Tokyo, Japan) and tap water. All animal experiments were performed in accordance with the Guide for the Care and Use of Laboratory Animals of Lion Corporation, Japan.
Preparation of lactoferrin degradation products by trypsin and pepsin
LF was purchased from DMV International (Veghel, The Netherlands). According to the manufacturer's protocol, typical protein purity is 98 %. To obtain trypsin-degraded LF, 5 g bovine LF were dissolved in 100 ml water, and the solution was adjusted to pH 7·0 with NaOH. Then, 150 000 units of trypsin (trypsin diphenyl carbamyl chloride-treated type XI from bovine pancreas, T1005-250MG, Sigma-Aldrich Japan, Tokyo, Japan) were added, followed by incubation at 37°C. Products were sampled at 3, 10 min, 0·5, 1·5, 4, 24 and 72 h after incubation, and the degradation patterns were checked by SDS-PAGE. To prepare pepsin-degraded LF, 5 g of LF were dissolved in 100 ml water and adjusted to pH 2·5 with HCl(Reference Tomita, Bellamy and Takase9). After 45 000 units of pepsin (pepsin 1:10 000, from porcine stomach mucosa, 162-20 752; Wako Pure Chemical Industries, Limited, Tokyo, Japan) were added, the solution was incubated at 37°C and the products were sampled at 3, 10 min, 0·5, 1·5, 4 and 24 h to check degradation patterns by SDS-PAGE. NuPAGE® 4–12 % Bis–Tris gels (NP0342BOX, Invitrogen Japan K.K., Tokyo, Japan) were used with MES running buffer for SDS-PAGE analysis. For pre-adipocyte assays, 24 h incubated tryptic and peptic products were used.
Primary cell culture of mesenteric fat-derived pre-adipocytes
Sprague–Dawley rats were killed by cervical dislocation(Reference Shimizu, Sakai and Ando10). Mesenteric fat was removed and washed with ice-cold PBS including 1 % antibiotic antimycotic solution (15 240-062; Invitrogen Japan K.K.). The fat tissues were minced with scissors, added to PBS containing 1 mg/ml collagenase (Collagenase S-1; Nitta Gelatin Inc., Tokyo, Japan) and incubated at 37°C for 40 min. Subsequently, the digested tissue suspension was filtered through a 100 μm mesh, and Dulbecco's modified Eagle's medium was added before centrifugation at 800 rpm for 10 min. The sediment was then collected and washed twice with Dulbecco's modified Eagle's medium, filtered through a 70 μm mesh and centrifuged. The sediment was suspended in visceral fat differentiation medium (Primary Cell Company Limited, Hokkaido, Japan) and seeded at a density of 1·5 × 105 cells/cm2 on twenty-four-well plastic culture plates (Sumitomo Bakelite Company Limited, Tokyo, Japan) coated with collagen (CellmatrixType I-C; Nitta Gelatin Inc., Tokyo, Japan). Cell culture was conducted with the visceral fat differentiation medium according to the manufacturer's protocol in a humidified atmosphere of 5 % CO2 in air at 37°C, with 30, 100 and 300 μg/ml of LF or trypsin- or pepsin-degraded LF products, 1000 μg/ml of transferrin (holo-Tranferrin, T1408; Sigma-Aldrich Japan) or 1000 μg/ml of bovine serum albumin (albumin from bovine serum, Cohn V fraction, A4503-50G; Sigma-Aldrich Japan) for up to 7 d. A sample without any additive was used as a control.
Cellular proliferation and accumulated lipid droplets were observed under a phase-contrast microscope (IMT-2; Olympus, Tokyo, Japan). Cellular proliferation was quantified by alamarBlue® assay (DAL1100; Invitrogen Japan K.K.) according to the manufacturer's protocol. Lipid droplet accumulation levels in the cells were determined by oil Red O staining (154-02 072; Wako Pure Chemical Industries, Limited).
Gene expression analysis of adipocytes by DNA microarray
For gene expression analysis, adipocytes were cultured as described earlier, except using 25 cm2 flasks (Sumitomo Bakelite Company Limited, Tokyo, Japan), harvested at 4 h, 1, 3 and 5 d after seeding, collected by cell scraper and washed with PBS. Total RNA was extracted using an RNeasy® Mini Kit (Qiagen, Hilden, Germany) according to the manufacturer's protocol. RNA was reverse transcribed with a One-Cycle complementary DNA Synthesis Kit (Affymetrix, Santa Clara, CA, USA), and complementary DNA was transcribed to produce biotin-labelled complementary RNA using an IVT Labeling Kit (Affymetrix). The complementary RNA was then hybridised with the GeneChip® Rat Genome 230 2.0 Array (Affymetrix) according to the Affymetrix protocol. Microarray data were analysed with a GeneChip 3000 Scanner, GeneChip Operating Software and an Expression Console (Affymetrix).
Quantitative RT-PCR confirmation of gene expression
For the gene expression analysis by quantitative RT-PCR, adipocytes were cultured as described in the DNA microarray section except that harvesting was at 1, 3, 5 h, 1, 2, 3, 5 and 7 d after seeding. Total RNA was extracted using an RNeasy Mini Kit and reverse transcribed with a Reva-Tra Ace® kit (Toyobo, Osaka, Japan). Quantitative real-time RT-PCR was performed on the MyiQ Single colour Real-Time PCR Detection System (Bio-Rad Laboratories, K.K., Tokyo, Japan) for analysing the gene expression of CCAAT/enhancer binding protein alpha (C/EBPα), CCAAT/enhancer binding protein beta (C/EBPβ), CCAAT/enhancer binding protein delta (C/EBPδ) and PPARγ using SYBR® Green Real-time PCR Master Mix (Toyobo) according to the manufacturer's instructions. Hypoxanthine phosphoribosyltransferase 1 was used as an endogenous control to normalise the results. PCR primers for C/EBPα (QT00395010), C/EBPβ (QT00366478), C/EBPδ (QT00368599), PPARγ (QT00186172) and hypoxanthine phosphoribosyltransferase 1 (QT00365722) were purchased from QuantiTect Primer Assay (Qiagen).
Lactoferrin distribution after gastric intubation
After overnight fasting, 1000 mg of LF (4 ml, 25 % (w/v) water solution) were administered by gastric intubation to Sprague–Dawley rats, which were then dissected 15, 30 and 60 min thereafter under pentobarbital anaesthesia. Blood samples were collected from the inferior vena cava to prepare serum, then the rats were killed by exsanguination, and the mesenteric fat and livers were dissected. Small intestines were also collected and separated into proximal and distal halves. The contents of each part were eluted with 4 ml saline including a 1 % (v/v) proteinase inhibitor cocktail (P8340, Sigma-Aldrich Japan) and 1 mm Camostat Mesylate (035-17 763; Wako Pure Chemical Industries, Limited, Tokyo, Japan), respectively, for the two portions. After elution, the solutions were diluted ten times to decrease the concentrations of digestive enzymes. All the samples were stored at − 80°C until analysis. Mesenteric fat and livers shredded by cutter were added to 10 volumes of saline including a 1 % (v/v) proteinase inhibitor cocktail. Physcotron (Microtec Company Limited, Chiba, Japan) was applied to homogenise the tissues, and supernatants were collected after centrifugation. LF concentrations of small intestine contents, mesenteric fats, livers and sera were quantified by ELISA and/or SDS-PAGE. For this purpose, a Bovine Lactoferrin ELISA Quantitation Kit (E10126) and an ELISA Starter Accessory Package (E101) were purchased from Bethyl Laboratories, Inc. (Montgomery, TX, USA). When used according to the manufacturer's protocols, the antibodies in this kit react specifically with bovine LF, but not with bovine immunoglobulins or other bovine serum proteins. Cross-reactivity testing with human milk samples showed undetectable levels of activity. Cross-reactivity with milk samples of other species has not been tested. NuPAGE® 4–12 % Bis–Tris gels (NP0342BOX, Invitrogen Japan K.K.) were employed with MES running buffer for SDS-PAGE analysis. LabWorks version 4.6.00.0 Image Acquisition and Analysis Software (Ultra-Violet Products Limited, Cambridge, UK) was used for the quantification of full-length LF from the gel images.
Statistical analysis
Measured values are all presented as means with their standard errors. The alamarBlue® assay data and quantification data for mRNA from real-time PCR were analysed by two-way ANOVA followed by an unpaired t test. The data for lipid accumulation in adipocytes and amounts of immunoreactive LF (iLF) determined by ELISA were analysed by one-way ANOVA followed by a Dunnett test for comparison with the controls. The level of statistical significance was set at P < 0·05 with data being analysed using JMP version 5.0.1a (SAS Institute Inc., Cary, NC, USA).
Results
Effects of lactoferrin on pre-adipocytes derived from rat mesenteric fat tissue
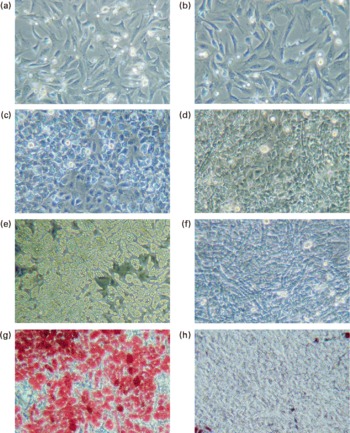
Pre-adipocytes were isolated from rat mesenteric fat and cultured in differentiation medium, with or without 300 μg/ml of LF. The cells proliferated and reached confluence 4 d after incubation, and then accumulated lipid droplets. Fig. 1 shows features of adipocytes observed under a phase-contrast microscope at 2, 4 and 6 d. LF had no effects on cell proliferation as observed from the alamarBlue® assay data (Fig. 2), but an apparent inhibitory effect on lipid droplet accumulation was observed. Table 1 shows the gene expression data for lipid droplet synthesis-related proteins at 5 d. One hundred genes with functions in glucose transport, glycolysis, the tricarboxylic acid cycle, fatty acid synthesis, TAG synthesis, fatty acid transport and acyl-CoA synthetase were selected as lipid droplet synthesis-related genes, and 63 % of those genes' expressions were decreased by the addition of LF. Table 2 shows the gene expression data for transcription factors which have important roles in the regulation of adipocyte differentiation. The gene expression of C/EBPβ (5 d) and C/EBPδ (4 h and 5 d), known as early regulators of adipocyte differentiation, was decreased by the addition of LF. The gene expressions of C/EBPα (3 and 5 d) and PPARγ (4 h, 3 and 5 d), master regulators of adipocyte differentiation, were also reduced. Fig. 3 shows the gene expression data for transcriptional factors quantified by real-time RT-PCR to validate the GeneChip findings. A remarkable decrease in gene expression of C/EBPδ (3 h and 5 h), C/EBPα (3, 5 and 7 d) and PPARγ (3, 5 and 7 d) was confirmed.
Observation of adipocytes by phase-contrast microscope. Pre-adipocytes were isolated from rat mesenteric fat and cultured in differentiation medium. Lactoferrin (LF), at the concentration of 300 μg/ml, was added from the start of the culture. Control sample was medium only. (a) Control 2 d, (b) LF 2 d, (c) control 4 d, (d) LF 4 d, (e) control 6 d, (f) LF 6 d, (g) control 7 d after oil Red O staining and (h) LF 7 d after oil Red O staining.
Effect of lactoferrin (LF) on the proliferation of adipocytes. Pre-adipocytes were isolated from rat mesenteric fat and cultured in differentiation medium. LF, at the concentration of 300 μg/ml, was added from the start of the culture. Control sample was medium only. Assays with alamarBlue® were conducted on days 1, 2, 3 and 4. □, Controls; ![]() , 300 μg/ml LF treatment. The results shown are means with their standard errors (n 3).
, 300 μg/ml LF treatment. The results shown are means with their standard errors (n 3).
Change of gene expression of lipid droplet synthesis-related proteins at 5 d

LF, lactoferrin.
* Data analysis using GeneChip Operating Software gave a fold change described as the signal log2 ratio between control (no additive) and LF. Results with a P < 0·002 were considered as increased (I) by LF, with a P>0·998 were considered as decreased (D), and the others were considered as no change (NC).
Gene expression data for transcriptional factors which have important roles in the regulation of adipocyte differentiation
LF, lactoferrin.
* Data analysis using GeneChip Operating Software gave a fold change described as the signal log2 ratio between control (no additive) and LF. Results with a P < 0·002 were considered as increased (I) by LF, with a P>0·998 were considered as decreased (D), and the others were considered as no change (NC).
Effect of lactoferrin (LF) on gene expression of transcriptional factors which have an important role in regulating adipocyte differentiation. Pre-adipocytes were isolated from rat mesenteric fat and cultured in differentiation medium. LF, at the concentration of 300 μg/ml, was added from the start of the culture. Control sample was medium only. Time course analysis of mRNA levels of (a) CCAAT/enhancer binding protein beta, (b) CCAAT/enhancer binding protein delta, (c) CCAAT/enhancer binding protein alpha and (d) PPARγ was conducted by real-time RT-PCR. Values were indicated by relative values of hypoxanthine phosphoribosyltransferase 1 (HPRT) mRNA. □, Control; ![]() , 300 μg/ml LF treatment. The results shown are means with their standard errors (n 3). † Mean values had a tendency towards significant difference (P < 0·1). Mean values were significantly different when compared with the same time data of control: * P < 0·05. ** P < 0·01 (unpaired t test).
, 300 μg/ml LF treatment. The results shown are means with their standard errors (n 3). † Mean values had a tendency towards significant difference (P < 0·1). Mean values were significantly different when compared with the same time data of control: * P < 0·05. ** P < 0·01 (unpaired t test).
Degradation behaviour of lactoferrin with digestive enzymes and actions on pre-adipocytes
Degradation patterns of pepsin- or trypsin-treated LF after 3 min and up to 24 h were checked by SDS-PAGE (Fig. 4(a), (b)). Pepsin-treated LF showed immediate degradation and many small peptide bands, but no LF band, whereas trypsin-treated LF showed much slower degradation and four main bands, including full-length LF. In both cases, 24 h-treated LF samples were used for the evaluation of lipid accumulation by pre-adipocytes.
Degradation behaviours of lactoferrin (LF) by digestive enzymes and those actions against pre-adipocytes. (a) SDS-PAGE pattern of pepsin-degraded LF. MW, molecular weight marker; lane 1, before reaction; lane 2, 3 min; lane 3, 10 min; lane 4, 0·5 h; lane 5, 1·5 h; lane 6, 4 h; lane 7, 7 h; lane 8, 24 h; 64 mg of proteins were applied. (b) SDS-PAGE pattern of trypsin-degraded LF. Lane 9, before reaction; lane 10, 3 min; lane 11, 10 min; lane 12, 0·5 h; lane 13, 1·5 h; lane 14, 4 h; lane 15, 24 h; lane 16, 72 h; 6·4 mg of proteins were applied. (c) Quantification data of oil Red O staining that was determined by the absorbance at 550 nm (Δ ABS550). LF, 1-d incubated LF with trypsin or pepsin; bovine serum albumin (BSA) and transferrin (TF) were used for evaluation. All the samples were added from the start of the culture, and oil Red O staining was conducted at 7 d. The results shown are means with their standard errors, n 3. Mean values were significantly different when compared with control group: * P < 0·05, ** P < 0·01 (Dunnett test).

Fig. 4(c) shows lipid accumulation levels by pre-adipocytes, isolated from rat mesenteric fat, cultured in differentiation medium with 30, 100 and 300 μg/ml of LF, LF degradation products prepared by the treatment with trypsin or pepsin for 24 h, 1000 μg/ml of transferrin or 1000 μg/ml of bovine serum albumin for 7 d. There was 12, 19 and 61 % inhibition of lipid accumulation with 30, 100 and 300 μg/ml LF, respectively. There was also 9, 10 and 62 % inhibition of lipid accumulation with 30, 100 and 300 μg/ml trypsin-degraded LF. On the other hand, pepsin-degraded LF did not show any such action.
Effects of oral lactoferrin supplementation on lactoferrin distribution into small intestine contents, mesenteric fat, livers and serum of rats
Fig. 5 shows the change in the amount of LF in small intestine contents after gastric intubation of 1000 mg in rats. Pooled samples (n 8) were analysed by SDS-PAGE (Fig. 5(a), (b)). Full-length LF bands were detected from 15 to 60 min in both proximal and distal halves of the small intestine. In addition, digested LF bands that closely resemble the pattern of trypsin-treated LF bands (Fig. 4(b)) were detected. On quantification of full-length LF bands using a densitometer (Fig. 5(c)), the maximum amount of full-length LF in the small intestine contents was 138 mg after 15 min of administration, with a decline thereafter such that a full-length LF band was not detected at 120 min. Samples of mesenteric fat and serum were also analysed by SDS-PAGE, but no LF bands were detected in them (data not shown).
Amount of lactoferrin (LF) in proximal and distal halves of small intestine contents after administration of LF by gastric intubation in mice. Pooled samples (n 8) were analysed by SDS-PAGE. (a) and (b) SDS-PAGE image. MW, molecular weight marker; lanes 1–4, LF standard 1, 0·5, 0·1, 0·02 mg/ml; lanes 5–9, proximal half of small intestine, lane 5, 15 min after administration of water; lanes 6–9, 15, 30, 60 and 120 min after administration of LF; lanes 10–14, distal half of small intestine; lane 10, 15 min after administration of water; lanes 11–14, 15, 30, 60 and 120 min after administration of LF. (c) Quantification of full-length LF band using densitometer.
Data for the change of iLF contents in the small intestine and iLF concentrations of mesenteric fats determined by ELISA are shown in Fig. 6. All the samples were below the detection limit in the control group. The maximum iLF amount in the small intestine contents was 168 mg in the proximal half at 15 min and 120 mg in the distal half at 60 min after LF administration. In mesenteric fat tissue, iLF was detected in all mice at 15 min after administration, and the iLF concentration was 14·4 μg/g fat (P < 0·05, Dunnett test compared with control). At 30 min and 60 min, it was detected in five and two of eight mice, respectively, but this difference was not statistically significant. Analysis of serum and liver showed that the iLF did not exceed the detection limit (0·156 μg/ml, 0·78 μg/g liver).
Amount of immunoreactive lactoferrin (iLF) in proximal half of small intestine (a), distal half of small intestine (b) and iLF concentration in mesenteric fat (c) after administration of lactoferrin (LF) by gastric intubation in rats. Control rats were administered distilled water instead of LF and dissected at 15 min after administration. iLF quantities of each sample were determined by ELISA. The results shown are means with standard errors (n 8). Mean values were significantly different when compared with control group: * P < 0·05, ** P < 0·01 (Dunnett test).
Discussion
The aim of the present study was to assess the influence of the enteric coating on the effects of LF on lipid accumulation by adipocytes. The results with trypsin and pepsin provide clear support for the conclusion that relatively non-degraded forms are necessary for the anti-adipogenic action of LF.
First, we conducted an in vitro study to confirm the anti-adipogenic action of LF on pre-adipocytes. Previous studies have used pre-adipocyte cell lines such as 3T3-L1, but their origin is uncertain. In the previous investigations, they also used artificial chemical compounds such as dexamethasone for differentiation towards mature adipocytes. With the primary culture system for visceral adipocytes recently developed by Shimizu et al. (Reference Shimizu, Sakai and Ando10), which uses stromal-vascular cells isolated from rat mesenteric fat tissue, the medium contains natural lipids as differentiation-inducing factors without any synthetic compounds. The differentiation rate of mature adipocytes obtained from stromal-vascular cells is over 80 % in culture, which is more efficient than that from pre-adipocyte cell lines. The effects of thiazolidinediones are known to differ between primary cultures of mesenteric adipose cells and cell lines such as 3T3-L1 cells(Reference Mineo, Oda and Chiji11). The source of adipocytes might be an important factor in determining the action of LF, because the effect of LF was found to be more remarkable for visceral fat than for subcutaneous fat in clinical trials. Therefore, in the present study, the inhibitory action of LF on lipid accumulation was assessed using the primary culture system of Shimizu et al. (Reference Shimizu, Sakai and Ando10). In the course of study, we compared results with differently sourced adipocytes. Interestingly, the activity of anti-adipogenic differentiation against pre-adipocytes isolated from the subcutaneous depot was almost same as that of mesenteric fat pre-adipocytes (data not shown). It seems that the origin of cells is not important for the anti-adipogenic action of LF. The fact that eLF especially reduced visceral fat might reflect LF distribution after oral administration, as described later.
Yagi et al. (Reference Yagi, Suzuki and Takayama6) reported that the inhibitory effect of LF on adipogenic differentiation was due to decreased gene expression of C/EBPα and PPARγ, known to be master regulators of adipocyte differentiation. Moreno-Navarrete et al. (Reference Moreno-Navarrete, Ortega and Ricart8) also reported actions against PPARγ, moreover arguing that the action of LF in activating the retinoblastoma gene by increasing protein expression and hypophosphorylation is important in blunting adipogenesis. Here, we found out that gene expression of C/EBPα and PPARγ was also remarkably decreased in our system. Unexpectedly, retinoblastoma gene expression was also decreased by the addition of LF, inconsistent with the report of Moreno-Navarrete et al. (Reference Moreno-Navarrete, Ortega and Ricart8). From this result, it was observed that the basal action mechanism in the primary culture system to inhibit adipogenic differentiation may be different from that in their study(Reference Yagi, Suzuki and Takayama6, Reference Moreno-Navarrete, Ortega and Ricart8). To clarify the basal mechanisms, we focused on C/EBPβ and C/EBPδ, early regulators of adipocyte differentiation(Reference Otto and Lane12). With the 3T3-L1 cell line, these isoforms are rapidly induced, and maximal protein levels are detected within 4 h of induction of differentiation. Ectopic expression of C/EBPβ, but not of C/EBPδ, can stimulate differentiation in the absence of hormone inducers(Reference Otto and Lane12). Based on this result, it was found that C/EBPβ seems to be more important in 3T3-L1 cells. Interestingly, transient gene expression of C/EBPβ and C/EBPδ were observed in our experiment, although the extent of the increase was much greater for C/EBPδ than for C/EBPβ. In contrast to the case in 3T3-L1 cells, C/EBPδ may be the more important signal in this system. We could also demonstrate that LF markedly inhibited the gene expression of C/EBPδ, which might be related to the basal mechanism of LF in inhibiting adipogenic differentiation.
DNA microarray analysis also revealed that mRNA of LRP1, an LF receptor(Reference Herz and Strickland13), is expressed in pre-adipocytes derived from rat mesenteric fat (data not shown), suggesting that LRP1 may be involved in the LF action. Dietary lipids are carried in chylomicron remnants, which are taken up into the liver mainly via LRP1. Crawford & Borensztajn(Reference Crawford and Borensztajn14) reported that LF inhibits the plasma clearance of chylomicrons in the mouse. LRP1 is expressed in visceral fat and modulates postprandial lipid transport and glucose homeostasis in mice(Reference Hofmann, Zhou and Perez-Tilve15). Considering these reports, LF may inhibit the lipid uptake of adipocytes via the LRP1 pathway. However, it is reported that LRP1 functions as a signalling receptor in addition to its recognised role in ligand endocytosis, and Grey et al. (Reference Grey, Banovic and Zhu16) suggested that mitogenic signalling through LRP1 to p42/44 MAPK contributes to the anabolic skeletal actions of LF. Thus, we can speculate that LF activates LRP1 signalling pathways by involving factors such as MAPK and thereby regulates adipocyte differentiation. Further study confirming the importance of C/EBPδ in this primary culture system and elucidating the relationship between LRP1 and key transcriptional factors for adipocyte differentiation is needed to address the fundamental actions of LF on adipocytes.
In addition to confirming the actions of LF against pre-adipocytes, we could confirm that the actions of LF are altered after degradation by digestive enzymes. The fact that pepsin-degraded LF showed no inhibitory effect on lipid accumulation suggested that the inhibitory action against visceral fat would be higher with eLF than with normal LF. It is supposed that even if eLF passes the stomach, it will be digested in the small intestine by trypsin after melting. In contrast to pepsin degradation, which results in very small peptides, digestion with trypsin yields relatively large products that retained their anti-adipogenic activity. The difference in molecular weights could clearly explain the difference in the effects on lipid accumulation. It has been reported that digested LF still has multiple functions. Especially, pepsin-degraded LF features a 2 kDa peptide called LF, which has higher bactericidal activity and immunomodulatory functions than full-length LF(Reference Wakabayashi, Takase and Tomita17). However, our findings suggest that the active sites for anti-adipogenic action of LF are different from the site of LF. Amino acid sequences of three fragments generated by trypsin degradation have been already reported. Takayama et al. (Reference Takayama, Mizumachi and Takezawa18) reported that LF promotes the contractile activity of collagen gels by fibroblasts. To identify the region of LF that is responsible for this activity, they prepared LF fragments by trypsin degradation. LF consists of a single polypeptide chain containing two lobes, independent globular structures termed the N- and C-lobes. The fragment corresponding to the C-lobe of LF (amino acids 341–689) had a more prominent effect on collagen gel contractile activity than did that of either native LF or its N-lobe (1–284). Further hydrolysis of the C-lobe with pepsin resulted in a loss of this activity. It is interesting that their data resemble our data in that the trypsin-degraded LF retains its activity, whereas the pepsin-degraded LF did not retain. Further studies will be performed to narrow down the active site by evaluating the three main fragments produced by trypsin degradation of LF.
Finally, we investigated the LF distribution in the mesenteric fat. It is impossible to administer eLF tablets to rats, so the experiment was conducted with oral administration of large doses of LF in the normal liquid form. Comparing the methods of dietary intake and gastric intubation, it appears that the latter is more efficient for reaching the stomach (data not shown). Therefore, gastric intubation was chosen as the administration method. We used the commercially available ELISA kit to detect iLF. According to the manufacturer's protocols, the antibodies in this kit react specifically with bovine LF, but not with other bovine serum proteins. Cross-reactivity testing with human milk samples showed undetectable levels of activity, but that with milk of other species has not been tested. We confirmed that trypsin-degraded bovine LF could be detected by this kit, but pepsin-degraded bovine LF could not be detected (data not shown). Thus, it seems to be able to detect relatively large fragments of LF, but not smaller fragments. SDS-PAGE analysis combined with ELISA revealed that about 14 % of full-length LF or about 24 % of iLF could reach the small intestine. The iLF concentration in the mesenteric fat was 14·3 μg/g, and considerably higher than that of the serum and liver. Fisher et al. (Reference Fischer, Debbabi and Blais19) investigated LF distribution in detail. They showed that iLF could be detected in the serum of mice (0·05 μg/ml) 10 min after gastric intubation of bovine LF. Their immunoblot analysis detected an intact LF band in the serum. They also investigated iLF distribution in various tissues such as the liver, kidneys, gall bladder, spleen and brain; of these, the liver showed the highest concentration (0·1 μg/g). Because the detection limit of the ELISA system that we applied was not as high (liver, 0·78 μg/g; serum, 0·156 μg/ml) as that of their ELISA system, iLF could not be detected in the liver or serum in the present study. Nevertheless, we could detect iLF in mesenteric fat, the concentration of which was about 20-fold higher than that of the liver at a moderate estimate. Bovine LF could be taken up by M cells, as suggested by the higher density of LF receptors in the epithelium overlying Peyer's patches than in other regions of the intestines(Reference Talukder, Takeuchi and Harada20). Takeuchi et al. (Reference Takeuchi, Kitagawa and Harada21) reported that LF is transported into the blood circulation from the intestine via the lymphatic pathway. As mentioned earlier, it was also reported that LRP1 is expressed in visceral fat(Reference Hofmann, Zhou and Perez-Tilve15). Considering these reports, we conclude that LF is transported from the small intestine into the lymph ducts and trapped in mesenteric fat by binding to LRP1. It is known that the liver also expresses LRP1; Moguilevsky et al. (Reference Moguilevsky, Retegui and Courtoy22) reported uptake by the liver after intravenous injection of LF to mice. In our preliminary study, 70 % of iLF was detected in the liver after intravenous injections in the mouse. Surprisingly, no iLF was detected in the mesenteric fat with this administration method. From these results, it is apparent that LF distribution after oral administration is quite different from that after intravenous injection. To the best of our knowledge, this is the first report to show that LF accumulates most abundantly in mesenteric fat tissue after oral administration. In the present study, we administered 1000 mg of LF into rats to detect LF easily. Although the amount of LF deposited in human mesenteric fat after a single 300 mg administration of eLF (dose of clinical trial) will be lower than that in the present in vivo study, it is expected that daily administration of eLF may over time exert anti-adipogenic activity against visceral fat. Further studies are now necessary to elucidate in detail the distribution of LF after oral administration, including absorption, metabolism and excretion.
In summary, the present in vitro study confirmed the anti-adipogenic actions of LF against adipocytes derived from mesenteric fat, while the effects of pepsin and trypsin provided specific support for the efficacy of eLF. These data strengthen the evidence that eLF can decrease visceral fat and thereby reduce the risk of the metabolic syndrome.
Acknowledgements
This research received no specific grant from any funding agency in the public, commercial or not-for-profit sectors. The authors' contributions are as follows: T. O. designed the study; M. O., M. M., H. K., K. M., M. I., T. Y., K. S. and H. N. provided advice for the design, and helped T. O. to write the manuscript; T. O. and C. F. conducted the in vitro experiments and analysed the data; C. F. and S. M. investigated the LF distribution in rats and analysed the data. All the authors read and approved the final version of the manuscript. The authors have no conflict of interest associated with the present study.


