

5.1 Introduction
Innovation is the main determinant of long-term economic development. In order to have a long-lasting effect, innovation must be produced and diffused regularly by innovation systems.
5.2 National Systems of Innovation (NIS) Defined
Chris Freeman, Bengt-Ake Lundvall and Richard Nelson, put in the public scientific domain the concept of national innovation systems. Many other publications, including those of Nelson, followed (Nelson and Sampat 2001; Nelson 2006). The literature has grown exponentially since the late 1980s.
“The network of institutions in the public and private sectors whose activities and interactions initiate, import, modify and diffuse new technologies.” (Freeman 1987)
“The set of institutions whose interaction determines the innovative performance of national firms” (Nelson and Rosenberg 1993).
“A national system of innovation is the system of interacting private and public firms (either large or small), universities and government agencies aiming at the production of science and technology within national borders. Interaction among these units may be technical, commercial, legal, social, and financial, inasmuch as the goal of the interaction is the development, protection, financing or regulation of new science and technology” (Niosi, Bellon, Saviotti, and Crow 1993).
“The national institutions, their incentive structures and their competencies that determine the rate and direction of technological learning (or the volume and composition of change generating activities) in a country” (Patel and Pavitt 1994).
NIS are composed of several regional and several sectoral systems. The innovative regions are most often large metropolitan areas such as Chicago, Los Angeles, New York/New Jersey, Silicon Valley, and Washington metropolitan areas in the United States (Reference Feldman and AudretschFeldman and Audretsch 1999). In countries like the United States, Canada, or Australia, regional systems correspond roughly with metropolitan areas; in smaller and highly populated nations such as Japan, they may correspond to prefectures.
The main sectoral systems are those actively involved in innovation and R&D. Sectoral systems are defined by their knowledge base, their technologies, and their network of actors. In each OECD country, a small number of such sectors represent the majority of the innovative effort of the country. In older industrial countries, the initial distribution of the main sectors was a matter of historical evolution and market opportunities, rather than governmental choice. Over time, however, and particularly after WWII, governments started accompanying private sector efforts. Thus, for instance, in the United States the most innovative manufacturing sectors were the aerospace, chemical (including pharmaceuticals), and computer/electronic products industries. In the service sector, software publishers are the main innovators (NSF 2010). If measured by R&D expenditure, the same sectors (R&D is highly correlated with innovation activities) appear at the top of the list.
In most countries, traditional sectors such as agriculture, food, garment, leather products, and textiles involve little public support, other than basic regulations regarding food security. The sectors that involve the highest ratio of R&D to sales, thus comprising more risky activities, are those that entail more government support. This is also true for sectors that are part of “national missions” such as defense, health, and the environment. The institutions that support those sectoral systems vary. In biotechnology, universities and government laboratories are at the origins of some of the main regional and sectoral systems (Reference Chen and LinChen and Lin 2015). Government demand for aircraft before and during the wars has given a major boost to the aerospace industry. Pharmaceuticals and biotechnology have enormously benefitted from government support to public health, often through public research organizations such as the National Institutes of Health in the United States. Also, environmental missions have helped develop such institutes as the National Renewable Energy Laboratory in the United States, Japan’s New Energy and Industrial Technology Development Organization (NEDO), or the French government’s Laboratoire des sciences du climat et de l’environnement.
5.3 Regional Innovation Systems Defined
“Regions which possess the full panoply of innovation organizations set in an institutional milieu, where systemic linkage and interactive communication among the innovation actors is normal, approach the designation of regional innovation systems” (Cooke and Morgan 1998: 71).
“Regional systems of innovation are sets of institutions (innovating firms, research universities, research funding agencies, venture capital firms and government laboratories, and other appropriate public bodies) and the flows of knowledge, personnel, research monies, regulation and embodied technology that occur within a region (metropolitan area, sub-national unit or other)” (Niosi 2005: 16).
5.4 Sectoral Innovation Systems Defined
“More accurately, a Sectoral Innovation System (SIS) can be defined as that system (group) of firms active in developing and making a sector’s products and in generating and utilizing sector technologies: such a system of firms is related in two ways: through processes of interaction and cooperation in artifact technology development and through processes of competition and selection in innovation and market activities” (Breschi and Malerba 1997: 131).
5.5 Systems of Innovation in Developing Countries: The Literature
This new literature on developing countries stands on the shoulders of other authors, as Lundvall (2007) has already underlined. These include, of course, Reference HirschmanAlbert Hirschman (1958), Gunnar Myrdal (1970), Reference PrebischRaul Prebisch (1963), and Reference StewartFrancis Stewart (1977). The new approach was launched by authors from both developed and developing countries, but in reduced numbers, compared to the OECD literature on innovation systems. In a sense, the works appear more often to be expressions of grief than thorough analyses of the causes, consequences, and potential ways out of such a situation. A short review of this literature follows.
5.5.1 Immature Systems
Reference AlbuquerqueAlbuquerque (2003) argued that Latin American innovation systems are “immature”: too young. This explanation is unconvincing. In fact, compared with their much younger East Asian systems (i.e. Singapore or Taiwan), and after 200 years of independence, Latin American systems seem instead to have experienced an unexplained lag. Albuquerque made an effort to define “immature systems” through quantitative thresholds but without making clear the processes through which NIS may mature; other authors used the term without defining it and without drawing any policy implications (Carlsson et al. 2002). Thus, we don’t know whether immature systems may one day become “mature” systems, and how. The biological metaphor is not extremely helpful in this context. We do not know why some of these systems do not mature.
5.5.2 Incomplete Systems
According to other authors, innovation systems in developing countries are incomplete, particularly at the level of their connections (Reference ErnstErnst 2002; Metcalfe and Ramlogan 2008). In developing countries, innovation systems usually lack research universities, public R&D laboratories, venture capital firms, and innovative firms. With few research universities and R&D laboratories, as well as R&D-active firms, it comes as no surprise that they lack connections: There are few incentives for businesses to collaborate with universities. Also, teaching-only universities will have few links with business organizations. University–industry connections, when they exist, will be rudimentary and limited.
5.5.3 Weak Systems
According to other authors, innovation systems in less-developed countries are weak and fragmented, with institutional and infrastructural problems (Reference Intarakumnerd and ChaminadeIntarakumnerd and Chaminade 2011; Chaminade et al. 2012). The weaknesses come from low and inappropriate government expenditure: unstable R&D investments in higher education and government R&D, as well as shaky support for innovation in industrial firms. As in the previous case, lack of backing for R&D and innovation yields a lack of connections among the elements of the system. These approaches usually lack the policy implications relating to where these countries need to go in order to reinforce those systems.
5.5.4 Neo-Peripheral Systems
In this approach, MNC are the active elements in the system (Reference Arocena and SutzArocena and Sutz 2002). The problem with this approach is that it does not explain why local agents, and particularly the state in developing countries, are so passive. Yet, some Eastern Asian countries such as China, Singapore, South Korea, and Taiwan (province of China) are actively promoting investment of MNC, and at the same time furthering learning in local organizations. This “neo-peripheral” perspective seems less useful, as it does not explain the passiveness of local organizations in most developing countries.
5.5.5 Inefficiency and Ineffectiveness
Inefficiency and ineffectiveness also affect innovation systems (Reference NiosiNiosi 2002; Reference Kravtsova and RadosevicKravtsova and Radosevic 2012). These characteristics are determined by path dependency, organizational inertia, badly designed contracts, inadequate system rules, weak coordination among institutions, and small budgets for key activities including student grants and grant loans, university–industry research centers, or university patenting.
Most, if not all, of the above perspectives present innovation systems divorced from both industrial policy and the quality of the bureaucracy that designs, implements, and assesses innovation system policies. Thus, the IS current has often paid little or no attention to the parallel literature on the impact of the quality of public bureaucracy and industrial policy on development.Footnote 1 Almost all of the above-mentioned IS approaches underlie the idea that all government bureaucracies are equally effective and efficient, and that industrial policy is a different chapter in the study of economic development, without close links to innovation systems. This is remarkable when one considers that innovation systems literature originated in Friedrich List’s original work on national industrial policy (List 1841).
A further problem is that these literatures forgot another key element of the required institutions: culture. The cultural explanation comes in different variants. All of them nevertheless put the accent on ancient ways of thinking, be they religious (Catholicism, Islam) or the order of preferences of states. In countries having inherited Catholic institutions from Italy, Portugal, or Spain, such as those in Latin America, science, rational thinking, and technology have lagged, for centuries, behind religious priorities (Reference EinsensteinEisenstein 2015). Education is underfunded, and traditional thought is common. Reference LandesDavid Landes (1998) has been the main flag bearer of this “cultural” current.
5.6 Meritocratic Bureaucracies and Their Advantages
Countries with meritocratic bureaucracies are usually those with strong innovation systems. But how did the idea and the practice of the meritocratic bureaucracy take hold?
“Replacing patronage systems for state officials by a professional bureaucracy is a necessary (though not sufficient) condition for a state to be developmental” (Reference Rauch and EvansRauch and Evans 2000: 50).
5.6.1 Historical Origins in China and Britain: Conceptual Origins in Max Weber
The idea of embedding meritocracy into public service is as old as the Chinese empire. Mandarins had to pass examinations in order to be employed in the imperial service. The British rulers in India imitated Chinese bureaucracies and introduced tests for public offices in their Indian possessions. In Europe, several countries adopted and gave more modern and precise dimensions to the policy. Under Napoleon, France made an effort to abolish inherited privilege in the public service and created a powerful government bureaucracy. In the United Kingdom, the Northcote-Trevelyan Report (1854) recommended radical changes in the British public bureaucracy, replacing patronage with examination in order to recruit skilled personnel for the British Civil Service, as well as substituting seniority by merit as the basis for promotion (Reference EdwardsEdwards 2011). In the United States, the Pendleton Civil Service Reform Act, created in 1883, and inspired by the British recruitment system, stipulated that jobs in the public sector would be based on merit (exams). The United States law also created the US Civil Service Commission, recently changed to the Office of Personnel Management and the Merit System Protection Board. By 1983, some 55 percent of all US civil employees had some higher education training; they included 22,000 Ph.D.s, and 150,000 who had a Master’s degree (Reference CiglerCigler 1990). The organizational change increased public-sector efficiency, and was soon adopted by other European and English-speaking countries.
In the area of the academic explanation, Max Weber is unanimously considered the first to show the advantages of permanent government bureaucracy. He suggested that rational government behavior could only be imposed on society by means of a highly skilled professional public civil service. For Max Weber, Germany was the quintessential case of such a bureaucracy.
5.6.2 The Advantages of Meritocracy
A more recent strand of literature, in agreement with Weber’s ideas, shows that economic development requires “quality of government”: a meritocratic, skilled, and professional bureaucracy, able to collect taxes, design public policy programs, and create incentives for education and industrial innovation. Democracy and a high level of development are not preconditions – but rather the results – of such public service (Reference Cho, Im, Porumbescu, Lee and ParkCho et al. 2013). Neither the level of salaries nor civil servants’ tenure made a difference: only meritocracy did. Such a civil service is most often absent in developing countries, where corrupt, clientelistic, and politically appointed bureaucracies are often the norm (Charron et al. 2011; Dahlström et al. 2012; Reference YouYou 2015). Corrupt bureaucracies chosen by political appointees are neither able nor interested in designing, implementing, and monitoring policies conducive to economic development.
Reference StiglitzStiglitz (1996) has suggested that governments complement markets; they do not substitute them. In particular, he stressed that in East Asia, several governments implemented:
“Policies that actively sought to ensure macroeconomic stability.
Making markets work more effectively by, for instance, regulating financial markets.
Creating markets where that did not exist;
Helping to direct investment to ensure that resources were deployed in ways that would enhance economic growth and stability;
Creating an atmosphere conducive to private investment and ensured political stability.” (Reference StiglitzStiglitz 1996: 156)
Comparing several Asian countries, Reference YouYou (2015) found that economic inequality in the Philippines fostered a patronage-prone bureaucracy, one that in turn fueled stagnation and economic disparity in a sort of “vicious circle,” or feedback loop. More equal societies, such as those of South Korea and Taiwan, on the other side, fostered a meritocratic public service, which in turn promoted economic development.
The advantages of meritocratic civil services in economic development are many; the capacity to provide a reasonable selection of industrial sectors to nurture, and the design, implementation, and monitoring of industrial policy require a sophisticated government bureaucracy, one that understands the costs and benefits of different education, science, technology, and innovation incentives and their eventual pitfalls. Thus, a permanent, professional, and meritocratic public bureaucracy is a necessary condition of industrial growth. Among modern authors, comparing Asian and Latin American countries, Evans was one of the first to argue “the efficacy of the developmental state depends on a meritocratic bureaucracy … ” (Reference EvansEvans 1989: 561). Later on, Rauch and Evans showed that a meritocratic bureaucracy is a necessary condition for economic growth (Reference Evans and RauchEvans and Rauch 1999).
5.6.3 The Opposition to Meritocratic Bureaucracies
Opponents of the Weberian civil service abound. In neoclassical economics, markets are supposed to be more flexible and efficient than governments. Opposition to public bureaucracy, rational or otherwise, became vocal in the Public Choice school of thought (J. Buchanan and G. Tullock) during the 1960s; bureaucracy was identified with rent seeking. Markets were considered efficient by their own nature, and citizens did not need a bureaucracy. This was the idea behind Ronald Reagan’s and Margaret Thatcher’s reduction of the size of the state, respectively in the United States and the United Kingdom, in the 1970s, as well as the similar process in Canada under the Conservative governments of Brian Mulroney and Stephen Harper. It was based on the application of neoclassical economics in its public choice variety.
More recently, a new attack on the meritocratic form of government has come from law: those meritocratic states are usually composed of nonelected civil servants, who share governmental responsibilities with elected officials. These elected personnel should, in a purely democratic state, be the only ones allowed to impose laws and regulations (Reference HamburgerHamburger 2014). The civil service should be composed, as much as possible, of elected officials. People should elect judges, food and health administrators, and science officials.
Hamburger’s approach is a radical form of libertarianism. For him, central bank officials establishing interest rates and quantitative easing should be replaced by elected officials, together with health authorities deciding which drugs can be accepted, or security forces. Hamburger proposes a sort of radical weakening of the state.Footnote 2 His proposal is based on the perfect rationality of agents in neoclassical economics. All economic agents have complete information about the past and rational expectations about the future. In a sense, Hamburger ignores history, namely what France discovered under Napoleon, Britain in the 1850s, and the United States in the 1890s: The necessity to curb clientelism and nepotism, and to increase performance in the public sector, abolishing the old ways of doing that, has existed for millennia; “to the victor the spoils.”
At the very opposite of “neoclassical law,” we find those authors that link underdevelopment to inefficient states (Reference Acemoglu, Ticchi and VindigniAcemoglu et al. 2006). Not far from them are those authors that link underdevelopment to weak and/or inefficient science, technology, and innovation institutions (Reference Arocena and SutzArocena and Sutz 2000; Reference NiosiNiosi 2002, 2010a).
5.6.4 The Difficulties of Implementing Meritocratic Bureaucracies in LDCs
A few authors have analyzed the difficulties of developing meritocratic structures in Latin American public services (Reference PerlmanPerlman 1989; Reference Palma and CimoliPalma 2010; Roll 2014). Reference PerlmanPerlman (1989) found that the public sector in Latin America was vastly inefficient and resisted modernization. Reference Shepherd and ValenciaShepherd and Valencia (1996: 1) suggested that “The public administrations of many Latin American countries are typically dysfunctional – are over-dimensioned, inefficient, unable to deliver services to the most needy, and bastions of opportunistic behavior.”
In Latin America, for instance, governments undermined financial stability by the creation of excessive government debt. As a consequence, the region has often been in default (Reference Reinhart and RogoffReinhart and Rogoff 2009). In order to wipe out the debt, governments have promoted high inflation by printing too much money. Social unrest followed, and political stability was undermined. The low-quality bureaucracy was unable to react. The vicious circle continued to unfold.
5.7 Cultural Explanations
Cultural explanations also have a clear Weberian flavor. Max Weber had argued that Protestant countries had a clear proclivity to save and invest. The Protestant ethic would explain such spirit of capitalism. Conversely, Weber saw the Muslim religion as one of a warrior group, tending to patrimonial states.
Several experts in economic history have put these explanations forward. They argue that in Muslim countries, representing 1.6 billion people, religion has erected a number of barriers against economic development (Reference KuranKuran 2004a, Reference Kuran2004b). These include the Islamic law of inheritance, the lack of a concept of the corporation, and the waqf, a form of trust that locked large economic resources into pious public institutions such as the madrassas (Reference KuranKuran 2004b). Also, another barrier is the Zakat, the Islamic tax on wealth and income, which is compulsory in Malaysia, Pakistan, Saudi Arabia, and Sudan, and common among other Muslim countries. Interest-free banking also discourages savings. Polygamy, with scarce household resources divided among numerous children, following the Prophet’s example, does not help education either. Neither does the general perception that modern economic and political problems have a solution in ancient formulas provided by the Book, and their more or less imaginary past successes. Also, Reference Barro, Bernheim and SholenBarro (1991) noted the strong negative correlation between population growth and investment in human capital. Most Muslim countries are affected by rapid and uncontrolled population growth. In addition, Islamic law is not derived from a rational code, but from revelation, and the judges (qadi) can interpret it at will, thus lacking generality and stability in human relations (Reference TurnerTurner 1974).
In Islamic countries, women are at a disadvantage in both education and working opportunities. Comparing gender statistics in six Arabic Gulf countries with the UK and the United States, Reference MetcalfeMetcalfe (2011) found that few women in Arab countries have seats in parliament, that their labor force participation is low, and that public law is always interpreted using Sharia law, custom, and cultural practices. Also, the World Economic Forum publishes a yearly Global Gender Gap Report. The gender gap is smaller in Nordic countries. The twenty-four lowest-ranked (more gender unequal) countries were Islamic.Footnote 3
Cultural obstacles have not only affected Islamic countries. Several authors (Reference EinsensteinEisenstein 2015) have argued that economic development in Southern Europe (mostly Catholic) may have been retarded by the centuries-old fight of the church against the printing press, and against science in general, the Index being the Church’s main weapon. Out of 142 countries, the average Latin American position was number 58. The average Catholic South European country was in 38th.
5.8 Innovation Systems and Industrial Policy: Why They Need to Be Coordinated
The necessity of coordinating and integrating innovation policy and industrial policy has been put forward several times (Reference Oughton, Landabasso and MorganOughton et al. 2002; Reference Cimoli, Dosi and StiglitzCimoli et al. 2009). The concept of innovation systems was not part of this argument.
With the exception of the Far East, many developing countries adopted the view that industrial policy resulted in inefficiency and poor economic growth. Ample historical evidence shows that industrial policy does work, when the right technologies and industries are supported and when appropriate combinations of policy measures are implemented.
However, some authors have made an effort to link industrial policy with other areas of public policy (Aiginger 2007, 2012). Yet others differentiate and separate innovation policy and industrial policy due to the “suspicious” connotation of the latter (Edquist and Hommen 1999; Reference WarwickWarwick 2013). Reference SoeteSoete (2007) sees the evolution of industrial policy into innovation policy in a favorable light.
In this chapter, we argue that industrial policy is required for the success of innovation policy for several reasons.
(a) First of all, innovation needs to be protected not only by patents, industrial design, copyright, and trademark legislation. All these are weak barriers against imitation: Patents can be “worked around”; designs can be copied; and copyrights and trademarks are even easier barriers to overcome. Being first to the market, obtaining economies of scale and scope, and searching market leadership (all linked to industrial policy) are far better ways to protect innovation.
(b) Second, no country can excel in all industries. Even the largest economies, such as those of China and the United States, have competitive advantages in a few sectors and are uncompetitive in others. Both industrial and innovation policy should promote the same industries, in a coordinated way.
(c) Finally, even if one agrees that governments have, since the industrial revolution, supported different industries, no state can provide specialized human capital and support for all industries. Public resources are limited. Thus sectors must be chosen.
In this chapter we adopt the view that innovation policy is only effective when coordinated with industrial policy, as successful cases of catching-up in Eastern Asia clearly show. Investments in innovation, particularly when they are not directed at a specific sector, run the risk of being dispersed into too many industries and firms.
In the next section, two opposite sets of countries are analyzed.
5.8.1 Disconnecting Industrial and Innovation Policies: ISI in Brazil and Argentina
Import Substitution Industrialization (ISI), developed in Latin America in the 1940s and 1950s, is the paradigmatic case of industrial policy not linked to any kind of innovation policy. Governments protected all sorts of industries without selection or emphasis on innovation, and did not provide any incentive for these industries to improve products, processes, or organizations. In Latin America, Argentina and Brazil are the classic cases of the inefficient results of badly designed ISI industrial policy after WWII; India, Indonesia, and Turkey are their Asian counterparts.
Inefficient bureaucracies, corruption, and low capacity to design, implement, and monitor or assess public policies have, for decades, characterized countries implementing ISI policies. The generally permanent tariff protection for most if not all industries resulted in high prices for low quality goods. Also, in these countries, governments have renamed ISI a “neo-structuralist” policy (Reference BielschowskyBielschowsky 2009) similar to ISI’s original structuralist approach, i.e. an ISI set of policies under another name. This set of policies encouraged capital-goods imports, strong investment in industry, and some level of planning.
Massive protectionism – mostly through tariffs – discouraged learning, as local producers and consumers were unable to compare domestic products’ qualities and prices with those of foreign-made goods and services (Reference BrutonBruton 1998). Thus ISI products became increasingly obsolete, without this process being noticed by local authorities, producers, and consumers.
5.8.2 Linking Industrial and Innovation Policies: Taiwan, Korea, Singapore, and China
In the EU, the return of industrial policy after 2000 is associated to the very successful industrial catching up of East Asian countries after Japan: South Korea, Taiwan, Singapore, and then the P.R. of China (Amsden 1992, Reference Amsden2001; Reference KimLim 1997; Reference Amsden and ChuAmsden and Chu 2003; Reference FreemanFu 2015). Their catching up was based on a careful selection of industries, and an equally cautious selection of industrial policy incentives. Also, Lee (2014) has shown that catching up occurs industry-by-industry, or sector-by-sector, as Malerba would say. In Abramovitz (1986), macroeconomic catching up could be studied by itself, without mentioning the engine industries. Today, macroeconomic catching up is seen as the result of industrial catching up in particular sectors.
It was argued that the “flying geese” policy of several countries in East Asia explains their success (Ozawa 2003). Others replied that the “flying geese” policy is a useful model but fails to capture the diversity of development paths in the region. The above-mentioned NICs are by themselves important and distinct sources of East Asian technological progress, competitiveness, and regional investment, in addition to the general flying geese model. “The flying geese model would also underplay the significance of the US economy, both as a market and as a source of technology and investment” (Reference HobdayHobday 1995).
Furthermore, Reference ClineCline (1982) maintained that the East Asian model of export-led development in Hong Kong, Singapore, South Korea, and Taiwan could not be generalized without triggering a protectionist response in industrial countries. Still, China has multiplied the East Asian model by a factor of ten without launching, at least yet, a massive protectionist response in rich countries where deindustrialization is evident.
It may be argued that East Asian countries started with a general imitation of the Japanese model of development, attaining technology and organization in the most advanced countries, while each East Asian country implemented its own set of specific policies. But these nations did more than simply “innovate” in products, processes, and organization; they successfully launched new forms of incentives, new and improved products in the global market, with a view to capturing a substantial portion of it. Singapore has attracted foreign direct investment to nurture new industries. South Korea has relied on their own chaebols to catch up in key industries. Taiwan has been more creative in its combined innovation and industrial policy, putting a nonprofit government lab (ITRI) at the center of its development efforts. Whatever the specific innovation and set of industrial policies, these countries protected innovation through successful entries in world markets.
Also, the highest-growing Asian countries have relied on active industrial policy (Amsden 1989, Reference Amsden2001; Reference StiglitzStiglitz 1996; Reference Liu and WhiteLiu and White 2001; Reference FuFu 2015), supported by the state through soft lending by different public organizations, such as the China Development Bank and the China Export-Import Bank; cluster creation such as Biopolis and Futuropolis in Singapore; and government R&D laboratories and other public agencies in South Korea and Taiwan.
What kind of industrial policies matter? Those that succeed favor the absorption of external knowledge and global externalities, particularly organizational and technological upgrading. As Reference Giuliani, Petrobelli and RabellottiGiuliani et al. (2005) have underlined, the literature on clusters has emphasized local sources of knowledge. The East Asian countries, conversely, have put the accent on external sources of knowledge, which have been more useful for catching up. They imitate technologies, organizational forms, and policies from more advanced countries. The ISI industrial policy model does not select sectors. Yet, different types of industries require specific innovation incentives. Two sets of policies have been put forward to address this problem: the decades-old flying geese and the most recent smart specialization policy approach. They are compared with the ISI model in Table 5.1.
Table 5.1 Some industrial policies compared
| Flying Geese | Import substitution | Smart specialization | Developmental state | |
|---|---|---|---|---|
| Context of emergence | Japanese catching up in the 1930s | 1940s–1970s LA and Asian catching up, | EU productivity gap with USA (2000–) | East Asia catching up after 1960s |
| Policies related | Industrial policy evolution | Infant industry | Regional policies | Infant industry |
| Sector strategy | New sector creation | None | Discover and enhance sectors with EU advantage | New sector and new activity creation |
| Roles of the state | Export incentives and price discrimination | Tariff and non-tariff protection | Increase EU integration | Picking activities, funding and coordination |
| Investment subsidies | Investment subsidies | Purveyor of funds | Purveyor of funds & strategic advice | |
| Critiques & problems | Confusion created by numerous versions of the model | Informational barriers to entry; trade deficits; old technology out-competes new one | Innovation comes from variety and recombination rather than specialization; composite regional innovation systems more productive | Successes (Korea car & ICT industry) but some failures (i.e. Korea aircraft industry; car industry in Taiwan) |
| To read more | T. Ozawa | R. Prebisch, B. Balassa | Reference ForayD. Foray (2015) | A. Amsden, R. Wade |
| R. E. Baldwin |
Smart specialization is the latest response of European countries to industrial decline following East Asian – and particularly Chinese – competition. It has some similarities with Michael Porter’s policy arguments aiming at reinforcing industrial clusters and innovative regions (Niosi 2010). While some countries like Canada and Finland have tried to develop new innovative regions from scratch, Porter’s recommendations aimed at reinforcing some capabilities already existing in the cluster or innovative region, while at the same time building up value chains and skilled activities. Such a perspective has the advantage of building on some knowledge already present in the region. The concept has undeniable merits. The European Union has built a Smart Specialization Platform, helping regions to discover and enhance their strengths and potential. Thus this variety of industrial strategy is based on regions, more than countries. Thus for instance, Andalusia in Spain found a potential for dual use technologies in the area of sustainable construction, and logistics. An Action Plan was devised and a budget of 529 million euros was voted. From 2014 on, these smart strategies were put forward in the European Union. The results will be evaluated in the years to come.
Before leaving this section it is important to underline that those countries that claim not to apply industrial strategies have in fact put forward several ad hoc ones. During the 2008–10 crisis, the United States has supported their assurance, automobile, banking, and other industries with billions of dollars of credits.
ISI has been criticized for decades: It brought informational deficits through which developing countries nurtured inefficient industries with high prices and old technologies. Today, except in a few countries such as Argentina, Brazil, and Indonesia, it has been abandoned everywhere.
Both Flying Geese (FG) and Smart Specialization (SS) concepts run against received ideas, according to which governments should pick neither winning firms nor sectors. In conventional economics, governments should let markets alone decide in which firms and sectors investors should put their capital. However, as Ozawa has argued: “In essence, the market is merely a resource-allocation mechanism, not a goal-oriented and – filling entity. Directions need to be given by states that represent collective desires at the national level. Effective masters are in great demand” (Ozawa 2010: 23). Both concepts are similar on some dimensions and complementary on other ones. They are similar in the sense that both assume that industrial policy is needed to catch up with more advanced nations. But they differ in some key elements. The FGP aims at launching new sectors, while the SSA proposes revamping existing sectors, mainly by adding General Purpose Technologies (GPT), of which ICT is the most relevant.
The concept of a “developmental state” arrived later, first with Johnson (1962) and the “governing the market” concept, with Reference WadeWade (1990). In both cases industrial policy was put forward. However, neither the FGP nor the developmental state have avoided Japan’s decades-long stagnation that started in the early 1990s and continues to this day. The second generation of geese (Taiwan, South Korea, and Singapore) are doing exceedingly well, and, among the third generation, China is now the second industrial power in the world.
Among the explanations for the success of East Asian developmental states, several appear outstanding. Reference Evans and RauchEvans and Rauch (1999) have insisted on the role of meritocratic bureaucracies in Asia in the planning, design, implementation, and upgrading of public policies. Reference LeeLee (1997) has underlined that local governments strongly pressed new Asian industries to export from the start, thus avoiding the huge trade deficits that characterized Latin American and other ISI-addicted countries. Also, Korean companies were immersed in a situation of strong market competition within the local market, even if price discrimination was allowed. In addition, like in Japan, the government preannounced well in advance the end of quotas, trade protection, and other perks. Local industrialists knew from the start that the bonanza of infant industry protection was short term. Also, in all Eastern Asian countries, government R&D laboratories reduced the informational barriers to entry by bringing technology from abroad, producing prototypes, and transferring technology to the private sector.
In East Asia, infant industry protection existed, but it was a short-term policy, and often took the form of quotas, thus allowing learning from foreign goods in the local market and avoiding situations of total informational disadvantage from consumers and producers (Reference MillitzMilitz 2005).
The following table gives an idea of the sectors and their incentives.
Acronyms: EMA: European Medical Agency; FDA: Food and Drug Administration; NREL: New Renewable Energy Laboratory; SBIR: Small Business Innovation Research program; NRC: National Research Council; INSERM: Institut national de la santé et de la recherche médicale; NEDO: New Energy and Industrial Technology; NIH: National Institutes of Health.
Table 5.2 Industrial sectors and frequent innovation incentives
| Sector | Type of innovation projects | Type of support | Countries, regions and examples |
|---|---|---|---|
| Mining industry | Long and costly capital- intensive R&D projects | Government laboratories for exploration, extraction, fabrication and composite materials | USA (Geological Survey; Advanced Program on Composite Materials) Canada (Geological Survey) |
| Pharmaceuticals | Long and human-capital intensive R&D projects | Government R&D subsidies to academia and industry, tax credits, public R&D laboratories | USA (FDA, NIH) European Union (EMA, government subsidies through Frameworks Programs) |
| Aerospace | Large projects for aircraft designs, new engines and subsystems | Large projects for aircraft designs, new engines and subsystems | USA (Aerospace Corporation, Jet Propulsion Labs), France (ONERA), Canada (NRC Aerospace labs) |
| Software | Shorter and less expensive R&D projects | University grants for computer software, public R&D contracts with private firms | USA, Canada, European Union, Japan public subsidies and procurement |
| Biotechnology | Long, costly, and human-capital intensive R&D projects | University and public grants for R&D in academia and dedicated biotech firms, large public R&D laboratories | USA (NIH laboratories), Canada (NRC biotechnology federal laboratories), France (INSERM) |
| Nanotechnology | Long and human-capital intensive R&D projects | University grants for nanotech R&D; public grants for dedicated biotech firms, public R&D | USA (National Nanotechnology Initiative); Canada (NRC Institute for Nanotechnology) |
| Renewable energy | Long and human-capital intensive R&D projects | Public grants for R&D in academia and dedicated energy firms, public R&D labs | USA (NREL, SBIR DOE grants), Japan (NEDO), Canada (CANMET-Energy) |
5.9 Policy Implications
The different policies that need to be implemented in LDCs in order to replicate Asian success require correct progression, strategy, and application. A classification of innovation policies is presented.
Table 5.3 Types of policy preferred for different types of innovation
| Goal | Type of policy preferred | Examples |
|---|---|---|
| Incremental innovation and path following policies | R&D tax credits | Canada or US tax credits for R&D |
| Subsidies for SME innovation | ||
| Radical innovation and path creation | Mission-oriented laboratories | US NIH, Jet Propulsion Lab |
| Innovation cascades and path creation | Grand challenge policy | SunShot Initiative, Human Genome Project |
The first phase of institutional building includes designing and presenting industrial, innovation, and cultural policies, which require a meritocratic and professional bureaucracy. Eventually, foreign personnel may need to be recruited for that purpose. Several examples come to mind. The revolution in Turkish education came along with President Kemal Ataturk in the mid-1920s. It was promoted by the visit made by the great US educator John Dewey (1859–1952) at that time, and his report and proposals to the Turkish government about the necessary reforms in the educational system of the new republic. Dewey made recommendations about the organization of the Ministry of Education, the training and treatment of teachers, the education curriculum, and other topics (Reference AtaAta 2000).
Similarly, the hiring of US MIT Professor of aerospace engineering Richard Smith as the first rector of the Brazilian Aeronautics Institute of Technology in the late 1940s accelerated the successful development of the Brazilian aeronautical industry. Soon, the school would boast the hiring of distinguished professors from twenty different countries.
How long did these meritocratic civil services take before they were fully operational? A ten-year period seems a reasonable minimum deadline. Several factors explain the delay. First, people need to be recruited from the domestic or international labor markets. This is not always easy or evident. Second, new institutions have to be built or revamped: government departments, public management schools, and university programs. Finally, the new managers have to become acquainted with their responsibilities, and receive public support.
Only such a meritocratic bureaucracy can bring the necessary cultural, industrial, and innovation policy reforms. How long do these reforms need in order to succeed? Few cases of such reforms come to mind. In five to ten years, the Republic of Turkey abolished the caliphate, changed the alphabet from Arabic to Western (the Revolution of the Signs), gave voting rights to women, created a laic education system, adopted European law systems, changed the Muslim calendar for the Western one, and abolished polygamy. The adoption of a family name followed in 1934.
In China, the revolution in culture extended itself over a century, starting with the creation of the Republic of China by Sun Yat-sen in late 1911, and up to this day. India’s cultural revolution started with Gandhi, decades before the declaration of independence in 1947. In India, almost seventy years after independence and the fight against caste discrimination, difference based on caste still persists in educational attainment and marriage preference (Reference Azam and BhattAzam and Bhatt 2015; Reference Emran and ShilpiEmran and Shilpi 2015). Dozens of other major cultural changes have been launched in many countries, with different levels of success. Most often than not they have either failed or were prolonged over decades. The case of South Africa’s fight against apartheid has been documented time and again, as well as its drawbacks and resistance (Reference Suransky and van der MerweSuransky and van der Merwe 2016).
Finally, institutions able to design, implement, assess, and improve industrial and innovation policy need to be built. Chang identified three types of institutions that were crucial in Asian countries’ rapid economic catching up: “institutions for coordination and administration, institutions for learning and innovation, and institutions for income redistribution and social cohesion” (Reference ChangChang 1998: 64). In Japan, the case of MITI was underlined many times (Reference JohnsonJohnson 1982). In Taiwan, ITRI had a major role as the purveyor and local window on foreign technologies.
The innovation system perspective, and China’s experience, suggests that in less-developed countries, the exclusive adoption of “incremental innovation policies” such as tax credits for R&D and subsidies for SME innovation, though useful, are not what is required to pull them out of quasi-stagnation. Mission-oriented and grand challenge policies may be far more useful to build innovation systems in the global south.
5.10 Conclusion and Theoretical Implications
Innovation systems in developing countries are often incomplete, and fairly ineffective, inefficient, and thus weak. They often lack some key institutions (appropriate public policy incentives for industrial R&D, research universities, and public R&D laboratories) as well as connections among the components of the system. The existing literature has appropriately described some of the characteristics of IS in less-developed nations.
But the literature has forgotten how to explain why this state of affairs occurs. In its first conclusion, this chapter suggests that as the basis of this ineffectual set of structures one must find the lack of a meritocratic public bureaucracy, one that is able to design, implement, monitor, and continuously improve public policy, including the set of innovation policies that compose IS. Also, the literature shows how these meritocratic bureaucracies were built in countries such as Germany, the United Kingdom, and the United States. These processes took decades before the effects of the changes in the civil service were felt.
A second conclusion is that, in order to develop, these less-developed countries also lack a set of effective industrial policies, such as the selection of industrial sectors, either in a flying geese approach or a “smart specialization” strategy, that allow progressive upgrading (or abandoning) of their low-tech industries and incorporation of medium- and high-tech industries, particularly those that bring the largest knowledge externalities. The original sectors that these countries have to promote depend on their endowment of human and natural resources, as well as on the possibility of investing in human capital and using foreign natural resources. It is clear that no country, except maybe China or India, can expect to be internationally competitive in a large set of industries.
ISI policies have been applied for decades, and on the whole they have been criticized and, except in a few cases, abandoned. The debate about flying geese/developmental state policies in East Asia has been fairly abundant. The impression of this author (following the points of view of Amsden 1989, Reference Amsden2001; Reference LeeLee 1997; Reference Evans and RauchEvans and Rauch 1999; and Reference WadeWade 1990) is that they have been enormously successful. It is too easy to judge the value of smart specialization policies.
A third conclusion is that cultural barriers and heritages are highly important and that they are as difficult to overcome as the two others. In spite of their large endowment of natural resources, most African, Asian, Latin American, and Middle Eastern countries seem unable to expand their economies. Religious and other cultural obstacles may be part of the explanation of their secular stagnation.
In order to develop, design, implement, and monitor such sector selection and adequate innovation and industrial policy incentives, they need to build an effective meritocratic public bureaucracy, one that exists in not more than fifty countries in the world. Building such a bureaucracy is not an easy task: They will have to progressively replace hundreds of thousands of public employees recruited on the basis of clientele principles with a smaller number of meritocratic and highly efficient ones.
A further theoretical conclusion is due. It is time to expand the concepts behind Myrdal’s vicious circle of poverty.Footnote 4 Underdevelopment is not only the result of a short set of related variables such as poverty, lack of health, and lack of education mutually reinforcing each other. One must add to the circle the effects of corruption, inefficient and weak government, including STI institutions, and erroneous economic (industrial and financial) policy.
So, what are the policy implications; where do we go from here? How do we build a meritocratic bureaucracy? In terms of how to change, I suggest building the meritocratic institutions through a fast but evolutionary process, one that includes policy transfer, benchmarking, and selective hiring. Instead of recruiting hordes of badly paid loyal supporters, governments in developing countries should hire highly educated bureaucrats in short numbers, and recruit them through examinations and curricula. Such an institution-building process should start with STI institutions as well as public financial organizations. Universities, government laboratories, the central bank, and the national development bank should be the priorities. At the same time, a transparency law should be passed: All tax-paying individuals and organizations must have the right to request information about the use of public monies, public assets, and government loans. Transparency is the best antidote against corruption. Institutional reform is required. Governments should concentrate on subsidizing education through scholarships, high salaries for teachers, recruiting foreign talent, excellent education facilities, and the like.
The East Asian miracle was built on education. Publication and patent figures in these countries may shame Latin American countries. (Singapore produces many more patents than Latin America every year.) STI policies will be based on education. However, financial institutions should not be let astray. So many developing countries have lost their course due to excessive debt and subsequent runaway inflation triggered in order to liquidate the debt, Argentina being probably the most outstanding example, that attention needs also to be put on public financial organizations (Reference Reinhart and RogoffReinhart and Rogoff 2009).
Another key component was industrial policy. Smart specialization may succeed, based on a careful selection of industries by the planning bureaucracy. Successful Asian countries use smart specialization; Latin America is, with Africa, the last remaining region to believe in the power of markets.
A final section will be on timeframes. How long does it take to build an NIS? Take the miracle countries of the first half of the twentieth century. Up to 1940, Argentina, Australia, and Canada displayed many similarities. Between 1940 and 1970 Canada built a system of advanced universities, public research organizations, and created powerful incentives for private firms to innovate (Reference NiosiNiosi 2000). Similar periods of time appear in the books authored by Reference KimKim (1997) on Korea, and Reference Amsden and ChuAmsden and Chu (2003) on Taiwan, and in Lemola’s article on Reference LemolaFinland (2012), to name a few. The construction of a national innovation system may require thirty to fifty years. Starting in 1978, China’s completion of its NIS will take, in all, thirty to fifty years (Reference FuFu 2015).
6.1 Introduction
The importance of innovation and technical change for economic development has been investigated in a large range of literature, both theoretical and empirical. One key finding of this research is that it is important to distinguish between innovations in the sense of cutting edge developments at the technological frontier and the incremental processes associated with the adoption and diffusion of existing technologies. Reference KimKim (1997), in his now classic study on the role of technological catch-up in Korea’s rapid economic growth from the 1960s, refers to “innovation through imitation,” and Reference LeeLee (2005), in his analysis of the opportunities and barriers to technological catch-up, also emphasizes the importance of imitation in the early so-called OEM (own equipment manufacturing) stage of the process. In a similar vein, Reference Fagerberg, Srholec and VerspagenFagerberg et al. (2010), in a recent review of the empirical research on innovation and development, observe that cutting edge technological development tends to be located in the “developed” world, while innovation in the sense of imitation and diffusion tends to characterize the “developing” world. The largely imitative nature of innovation activity in developing nations, however, doesn’t make it any less significant economically.
A closely related finding based on the results of innovation surveys is that innovation, in the sense of imitation and diffusion, far from being exceptional is a quite frequent and even common phenomenon in developing countries (Reference Crespi and PeiranoCrespi and Peirano 2007; Reference Fagerberg, Srholec and VerspagenFagerberg et al. 2010; Reference GoedhuysGoedhuys 2007; Reference SrholecSrholec 2011). It may be the necessary condition for firms to sustain a competitive position in their local or national markets. Moreover, the opportunities for innovating in the sense of introducing products or technologies that are new to the firm but not necessarily new on world markets may well be greater in nations that are behind technologically, simply because the amount of mature technology available on international markets for enterprises in these nations to “absorb” is greater. This issue is addressed in the literature on technological gaps and convergence between low income and high income nations (Reference FagerbergFagerberg 1987, Reference VerspagenVerspagen 1991).
An important conclusion coming out of these related strands of research is that there is nothing “automatic” about the process whereby firms in less-developed countries acquire the technological and organizational capabilities necessary to assimilate and possibly modify technologies and products first developed elsewhere (Reference FagerbergFagerberg 1994: 155–162 for an overview). While these capabilities are internal to the enterprise, their development depends in part on the characteristics of the national and local institutions and support structures the enterprise is embedded in. This reflects the fact that firms rely on their relations with different external organizations and institutions for the development of their core competences. Firms depend on relations with education institutions and training providers for securing supplies of labor with the required basic and domain-specific skills, and on relations with universities and public and private research institutions for the development of their research and innovation capabilities. To varying degrees they depend on their relations with banks and other financial institutions for access to credit in order to develop, produce, and commercialize new products and technologies. The importance of the nationally specific institutional setting is investigated in a large range of literature on national and regional innovation systems in both developed and developing nations (Reference LundvallLundvall 1992; Reference Niosi, Saviotti, Bellon and CrowNiosi et al. 1993; Reference Dahlman, Nelson, Koo and PerkinsDahlman and Nelson 1995; Reference FreemanFreeman 1995; Reference Arocena and SutzArocena and Sutz 2000).
In this chapter we focus on one dimension of the national institutional setting that is recognized as being central to the ability of developing-country firms to acquire the resources and develop the capabilities needed for innovation: the national financial system. We investigate the links between innovation and financial system characteristics for a sample of thirty-six developing nations spread across five regions of the world: Sub-Saharan Africa, the Middle East and North Africa, East Asia and Pacific, South Asia, and Central Asia. We seek to extend existing micro-level studies on the financing decisions of enterprises in developing countries by explicitly connecting these decisions to firms’ innovation outcomes and to the wider institutional framework formed by the national banking system. Our results show that credit constraints have a significant negative impact on innovation and that the characteristics of the national banking system indirectly affect innovation through their impact on the likelihood that firms face these financing constraints.
The chapter is structured in the following way. Section 6.2 presents a brief overview of research examining the links between financial system development, credit constraints, and innovation performance. Section 6.3 contrasts the national banking systems of the thirty-six developing nations investigated in this chapter and it develops a probit model predicting the likelihood of credit constraints as a function of both firm-level characteristics and country-level variables, measuring the national banking systems. The sources of firm-level and country-level data are described. Section 6.4 extends the analysis by developing a recursive bivariate probit model in order to examine the indirect effects of national banking system characteristics on firms’ innovation outcomes. Section 6.5 concludes with a discussion of the policy implications.
6.2 Financial Systems, Credit Constraints, and Innovation
Macroeconomic research has identified a positive relation between economic development and the development of the financial system. Contemporary cross-country econometric research starts with papers by Reference King and LevineKing and Levine (1993) building on earlier work by Reference GoldsmithGoldsmith (1969). Reference Rajan and ZingalesRajan and Zingales (1998), in an influential paper using industry and firm data, find that financial development has a substantial impact on industrial growth in part though the availability of credit for new firm formation. These papers provide evidence for a “first-order” positive relationship between financial development and economic growth (Reference LevineLevine, 2005 for an overview).
At a more micro level, a number of studies focusing on both developed and developing nations have shown that firms face more or less important financing obstacles or constraints linked to the level of development of their national financial systems. Reference Beck and Demirgüç-KuntBeck et al. (2006) explore the relationship between the characteristics of the financial system and the financing obstacles firms face for a sample of eighty countries using micro data from the World Bank’s Enterprise Surveys (WBES). They show that firms in countries with higher levels of financial intermediary and stock market development, legal system efficiency, and higher GDP per capita report, on average, lower financing obstacles. Reference Presbitero and RabellottiPresbitero and Rabellotti (2013) focus on the Latin America region and show that the financing constraints of firms depend in part on the degree of bank penetration (as measured by the number of bank branches) and bank competition. This literature also shows that the size of firms is an important determinant of access to external finance. There is substantial evidence that small and medium enterprises (SMEs) are financially more constrained than large firms and have less access to formal sources of external finance (Reference Schiffer and WederShiffer and Weder 2001; Reference Beck and Demirgüç-KuntBeck and Demirgüç-Kunt 2006).
There are a number of micro-level studies examining the relation between the obstacles firms face in gaining access to credit and their R&D expenditure and innovation performance. Reference Fazzari, Hubbard and PetersenFazzari et al. (1988), in a path-setting study, focused on the relation between investment and R&D expenditure and cash flows. They argued that higher investment-cash flow sensitivities provide a useful measure of financing or credit constraints. This gave rise to a literature focusing on advanced industrialized nations, giving particular attention to the financing decisions of small firms in high-tech or R&D-intensive industries (Reference Hall, Lerner, Hall and RosenbergHall and Lerner 2010 for a survey). Reference Mulkay, Hall and MairesseMulkay et al. (2001), for example, compared a panel of US and French firms and showed that investment-cash flow sensitivities are higher in the United States, and Reference Bond, Harhoff and Van ReenenBond et al. (1999) compared firms in the UK and Germany, finding that UK firms were more sensitive to financing constraints. The broad conclusions of this literature, however, were that the investments of firms that had exhausted all of their relatively low-cost internal funds would be more sensitive to fluctuations in their cash flow than firms with higher liquidity.
More recent literature addresses these issues using direct measures of both firms’ financing constraints and their innovation performance. Reference SavignacSavignac (2006), for example, uses data from the French Financing of Technological Innovation (FIT) survey carried out in 2000, focusing on the financial resources used for funding innovative projects. The survey provides direct measures of innovation based on the Oslo Manual definitions and direct measures of financial constraint based on asking respondent firms whether a lack of financing sources or too high interest rates have been obstacles preventing them from undertaking innovation projects. The analysis of Reference Gorodnichenko and SchnitzerGorodnichenko and Schnitzer (2013) similarly uses direct measures of innovation and credit constraints derived from the World Bank’s Business Environment and Enterprise Performance Surveys (BEEPS), which cover Eastern Europe and Commonwealth Independent States (CIS). This approach based on direct measures not only avoids potential problems with using investment-cash flow sensitivities as a proxy for financing constraints but also overcomes the well-known weaknesses associated with using R&D expenditures as proxy for innovation.Footnote 1 Not only is R&D only one among several important inputs to innovation, but as research based on the Community Innovation Surveys or surveys adopting the Oslo Manual definitions of innovation have shown, many firms innovate without having undertaken any formal R&D (Reference Arundel, Bordoy and KanervaArundel et al. 2008; Reference Rammer, Czarnitzki and SpielkampRammer et al. 2009; Reference Leitner and StehrerLeitner and Stehrer 2013).
In summary, one body of literature has shown that the level of development of the national financial system has an important impact on the ability of firms to gain access to credit and another has made the case for the importance of credit constraints for firms’ investments in innovation activities. A main objective in this chapter is to link these different insights and findings in a model investigating for a sample of developing countries the channels through which the banking system impacts indirectly on enterprise innovation performance through its effect on firms’ financing constraints.
In order to do this, we make use of recently available harmonized enterprise-level data from the World Bank Enterprise Survey (WBES), in combination with aggregate measures of national banking systems available from the World Bank’s Global Financial Development database. Different units within the World Bank have conducted firm-level surveys providing information on the financing decisions of enterprises since the 1990s. Since 2005–2006, data collection has been centralized in the Enterprise Analysis Unit using a harmonized methodology,Footnote 2 and beginning with the 2010 survey wave questions on innovation outcomes conforming to the Oslo Manual definitions have been included in the separate manufacturing and services questionnaires in selected nations.Footnote 3 In this chapter, we analyze the subset of developing nations surveyed by the World Bank during the period 2010–2014 for which innovation indicators are available for both manufacturing and service sector enterprises and for which aggregate indicators characterizing the national banking system are obtainable from the World Bank’s Global Financial Development database.Footnote 4 Table 6A.1 in the Annex lists the thirty-six countries analyzed and shows both their GDP and their GNI per capita in 2012 US dollars. Gross national income per capita for the sample of nations in 2012 ranges from a low of 320 US dollars in Malawi to a high of 9780 US dollars in Kazakhstan. The majority of nations that are classified as low income by the World Bank (less than 1025 US dollars in 2012) are located in Sub-Saharan Africa and in South Asia.
6.3 National Banking Systems in Comparative Perspective
As securities markets play a minor or insignificant role in the provision of external finance in the majority of the countries analyzed in this chapter, we focus on the characteristics of the national banking system. This applies to a considerable extent even to fast-growing Asian countries like China and India that experienced large increases in equity market capitalization during the 2000s. According to Reference Didier and SchmuklerDidier and Schmukler (2014), the use of equity financing remains quite limited across East Asian nations and tends to be concentrated in a few firms. For example, the national shares raised by the top five issuers in China and India in the 2000s were 45 percent and 55 percent, respectively, and trading is similarly concentrated with the top five capturing about 40 percent. Only a few firms in China and India use equity and bond markets on a recurrent basis and even fewer capture the bulk of capital market financing.
In comparing national systems we focus on measures of banking system depth, breadth, market concentration, and the cost of financial mediation as reflected in net interest margins. A standard measure of the level of development or the “depth” of the banking system is private bank credit as a percentage of GDP (PRVCRD). A number of cross national studies have identified a positive relation between this measure and the share of private sector firms having access to a line of credit from a financial institution (Reference Fisman and Love.Fisman and Love 2003; Reference Beck and Demirgüç-KuntBeck, et al. 2006). The unweighted population average for PRVCRD in 2008 is 30.7 percent of GDP, with values ranging from a low of 4.8 percent of GDP in the Democratic Republic of Congo to a high of 97 percent in China.Footnote 5 Figure 6.1 identifies a positive relationship between private bank credit as a percentage of GDP and the level of economic development as measured by GNI per capita. As previous comparative work has observed, the banking systems of Sub-Saharan African nations stand out in comparison to those of other regions of the world for their lack of depth (Reference Beck, Maimbo, Faye and TrikiBeck et al. 2011). The only Sub-Saharan African nation included in the analysis with a value of private bank credit as a percentage of GDP over the population average is Namibia.

Figure 6.1 Scatter plot for PRVCRD and GNI per capita
Figure 6.2 shows the correlation between GNI per capita and the number of bank branches per 100,000 adults (BRNCH), a standard measure of banking system breadth or outreach. The figure identifies a weak positive correlation. Banking system outreach may be especially important for SMEs that tend to rely more than larger firms on relationship banking depending on geographical proximity and face-to-face contacts (Reference Berger and UdellBerger and Udell 1998). The nations of Sub-Saharan Africa are also notable for their lack of banking system outreach, with Namibia at 12.4 branches being the only country with a value over the population average of 10.3 branches per 100,000 adults. Especially low values are reported in a number of Central Asian nations, including Ukraine, Belarus, and Kazakhstan. Mongolia stands out as an outlier with over sixty bank branches per 100,000 adults.

Figure 6.2 Scatter plot for BRNCH and GNI per capita
Figure 6.3 presents the correlation between GNI per capita and the 3-bank concentration ratio (CONCTR). Concentration ratios range from a low of 27 percent in India to a high of 100 percent in Namibia, Djibouti, and Tajikistan. The impact of concentration on access to credit and firm growth has been debated in the literature, especially as regards its impact on SMEs. Comparing states across the United States, Reference Black and StrahanBlack and Strahan (2002) find that higher levels of concentration result in lower rates of new firm formation. However, Reference Petersen and RajanPetersen and Rjan (1995), using data from the US National Survey of Small Business Firms, find that credit-constrained firms are more likely to gain access to credit in concentrated credit markets because the lenders are more easily able to internalize the benefits of assisting them. From the cross-national perspective, Reference Beck, Demirguc-Kunt and MaksimovicBeck et al. (2004), in a seminal study using World Bank data for seventy-four developed and developing countries, found that concentration had a negative impact on access to credit and that the negative impact is stronger for SMEs. This result is qualified, however, by the finding that the negative impact is dampened or rendered insignificant by higher levels of institutional development, in the sense of more respect for rule of law and lower levels of corruption, and by the importance of foreign banks as a share of all banks.

Figure 6.3 Scatter plot for bank concentration and GNI per capita
Interest rate spreads and net interest margins are often used as proxies for financial intermediation efficiency. Costly finance, as reflected in high net interest margins, may result in credit rationing, with some borrowers unable to borrow all they want or even impeded from having any access to bank finance. Beck et al. (Reference Beck, Maimbo, Faye and Triki2011: ch. 2), focusing on finance in Sub-Saharan Africa, argue that the generally high interest rate spreads and margins in this region may be the counterpart of the small size and inefficiency of the national financial systems. Figure 6.4 shows a negative relation for the thirty-six nations between the size of net interest margins and the level of economic development as measured by GNI per capita. Values range from a high of 11.1 percent in Uganda to a low of 1.6 percent in Tunisia.

Figure 6.4 Scatter plot for margins and GNI per capita
6.3.1 The Relation between National Banking Systems and Credit Constraints
In order to measure whether or not firms are credit constrained, we use the approach developed by Reference Kuntchev, Ramalho, Rodríguez-Meza and YangKuntchev et al. (2012), which draws on the rich information collected in the WBES on the financing decisions of establishments during the year prior to survey. Credit constrained establishments (FC) are defined as establishments that either applied for a loan or a line of credit and had their application rejected, or did not apply for a loan or a line of credit for reasons other than having enough capital for their needs. The possible reasons include the following terms and conditions implying that these firms, at least to some extent, were rationed out of the market: interest rates were not favorable, collateral requirements were too high, the size of the loan and maturity were insufficient, they did not think the application would be approved, or the application procedures were too complex. In short, credit-constrained firms are defined as firms that would like additional credit to meet their investment needs but have been unable to gain access to it.Footnote 6
The national share of firms that are credit constrained varies from a high of about 58 percent in Tanzania and Ghana to a low of about 11 percent in Mongolia. Figure 6.5 points to a negative relationship between the share of establishments in each nation that are credit constrained and GNI per capita. Nations in the Sub-Saharan African region stand out for the high shares of their establishments that are credit constrained, with Namibia and Kenya being the only nations with a share below the sample average of 34 percent.

Figure 6.5 Scatter plot for % establishments credit constrained and GNI per capita
In order to explore the impact of the characteristics of national banking systems on the probability that a firm is credit constrained, we use a probit model that takes the following form:
Where W* is a latent variable that can be interpreted as the unobservable severity of financing constraints.
Equation 6.2 presents the baseline probit model without country-level covariates. At the enterprise level we control for a set of firm characteristics that are likely to impact on the probability of being credit constrained. LogEmp refers to size of the firm as measured by the natural logarithm of the number of full-time employees, and Foreign measures whether or not the firm’s ownership is over 20 percent foreign. We expect that larger establishments with a greater sales volume will be less likely to be credit constrained and that firms with foreign ownership will have better access to sources of external credit. Young is a binary equal to 1 if the firm was established within the last three years. It is assumed that other things being equal, younger firms without established reputations will be more likely to be credit constrained. Export is a variable equal to 1 if the firm exports any of its output, either directly or indirectly. It is assumed that exporters will have better access to credit and will be less constrained than non-exporters. The regressions control for whether the sector of activity is manufacturing, mining and utilities, or service (Sector). The data is weighted and, as with Reference Beck, Demirgüç-Kunt, Laeven and MaksimovicBeck et al. (2006a) and Reference Presbitero and RabellottiPresbitero and Rabellotti (2013), we use cluster-controlled standard errors in order to correct for within-country error correlation. Table 6A.2 in the Annex gives the definitions and descriptive statistics for the enterprise-level variables.
Table 6.1 presents the results for the probit regressions. Column 1 shows the results for a model without country-level variables and column 2 includes the four aggregate indicators for banking system depth, breadth, concentration, and net interest margins.Footnote 7 In column 3 we add an interaction term (PRVCRD * BRNCH) in order to assess whether the level of banking system depth moderates the impact of banking system breadth. Our expectation is that if an increase in the number of bank branches is accompanied by a simultaneous increase in the total value of private bank credit available for lending, the negative effect on the financing constraints of firms will be enhanced.
Table 6.1 Probit model estimating credit constraints
| (1) | (2) | (3) | |
|---|---|---|---|
| Variables | FC | FC | FC |
| Foreign | −0.135** | −0.116*** | −0.115*** |
| (0.0538) | (0.0322) | (0.0314) | |
| LogEmp | −0.164*** | −0.163*** | −0.164*** |
| (0.0536) | (0.0536) | (0.0536) | |
| Young | −0.119 | −0.190*** | −0.189*** |
| (0.0799) | (0.0699) | (0.0697) | |
| Sector | 0.144*** | 0.337*** | 0.334*** |
| (0.0456) | (0.0279) | (0.0283) | |
| Export | −0.276*** | −0.258*** | −0.258*** |
| (0.00519) | (0.0190) | (0.0193) | |
| CONCTR | −0.00445*** | −0.00184 | |
| (0.00124) | (0.00154) | ||
| BRNCH | −0.0237*** | 0.00367 | |
| (0.00675) | (0.0144) | ||
| PRVCRD | −0.00600*** | −0.00125 | |
| (0.000593) | (0.00224) | ||
| MARGIN | −0.00159 | −0.0253 | |
| (0.0225) | (0.0188) | ||
| BRNCH*PRVCRD | −0.000628** | ||
| (0.000280) | |||
| Constant | 0.171 | 0.850*** | 0.648*** |
| (0.147) | (0.206) | (0.220) | |
| Pseudo R² | 0.0309 | 0.0347 | 0.0348 |
| Prob>Chi2 | 0.0000 | 0.0000 | 0.0000 |
| Observations | 25,485 | 25,485 | 25,485 |
Robust standard errors in parentheses.*** p<0.01, ** p<0.05, * p<0.1***, **, * denote significance at the 0.01, 0.05, 0.10 levels respectively. The data are weighted and the regressions control for clustering of errors within countries.
The column 1 results show that there is a negative and statistically significant impact of the variables LogEmp, Foreign, and Export on the probability of the firm being credit constrained. Larger firms, firms with foreign ownership, and firms that export are less likely to be credit constrained than their counterparts. These results are consistent with those in the literature discussed earlier in the chapter. The results also show that the firms belonging to the manufacturing sector have a higher probability of being financially constrained than those belonging to the services sector. The variable Young has a negative but not statistically significant impact.
The column 2 results show that the aggregate banking system indicators measuring breadth, depth, and concentration have a negative and statistically significant impact on the probability of a firm being credit constrained, with the effect being relatively strong in the case of BRNCH. The coefficient on MARGIN is negative but not statistically significant. Contrary to expectations, the results show that higher levels of banking concentration reduce the probability of a firm being credit constrained after controlling for the other characteristics of the national banking system.
The column 3 results show that the interaction term between the system depth and breadth is negative and statistically significant, supporting the hypothesis that the negative impact of increasing the number of bank branches on financing constraints will be larger as private bank credit as a percent of GDP increases. This implies that policies designed to reduce financing constraints by increasing banking system outreach will have a greater impact when combined with measures to increase the amount of private bank credit in the economy.
6.4 The Relation between Innovation, Credit Constraints, and National Banking Systems
In this section we focus on how the characteristics of national banking systems indirectly affect enterprise innovation performance through their impact on the probability that the enterprise is credit constrained. In keeping with the basic Oslo Manual definition, innovation is measured as the introduction onto the market during the three years prior to the survey of a product or service that is new-to-the firm (NewFrm). This measure captures processes of imitation and technology diffusion that tend to characterize innovation in developing countries, as it includes the introduction of product and services that although new to the firm are already available elsewhere, either on the national or international market. Column 4 in Table 6A.1 in the Annex shows the share of firms in each country that have introduced a new product or service. Values range from a high of about 68 percent in Kenya to a very low value of about 2 percent in Azerbaijan.
As a number of authors has observed, the cross-sectional nature of the data used in estimating the probability of innovation creates a potential problem of endogeneity resulting in biased estimates of the impact of financial constraints on innovation performance (Reference SavignacSavignac 2006; Reference Gorodnichenko and SchnitzerGorodnichenko and Schnitzer 2013). The simplest way to understand this is to observe that for reasons of asymmetric information associated with the intangible nature of the human and knowledge assets used in the early stages of an innovation project involving search and possibly prototype development, firms wishing to innovate generally rely on internal financing. To the extent that their internal funds are exhausted during the early stages of innovation activities, firms wishing to innovate will be forced to turn to relatively costly external financing in the form of bank loans or equity financing for the latter stages, including the production and marketing of the new products or services. For these reasons, firms trying to innovate are more likely to face credit constraints, in the form of having their applications to banks for a loan or a line of credit rejected or of being rationed out of the market by terms and conditions, than firms that did not even try to innovate, since these non-innovators will be less likely to have exhausted their internal funds (Reference Gorodnichenko and SchnitzerGorodnichenko and Snitzer 2013). This endogeneity means that the coefficients in a regression model estimating the impact of financial constraints on innovation outcomes will tend to be biased upward, and they may even show a positive relation between financial constraints and innovation, whereas the direction of the impact is actually negative.
One approach to addressing the endogeneity problem is through the use of instrumental variables. However, finding variables that meet the criteria for good instruments often poses a problem since many of the variables that have a direct effect on the endogenous variable will also have an effect on the dependent variable. To circumvent the difficulty in identifying valid instruments, we adopt the approach used by Reference SavignacSavignac (2006) and use a bivariate probit model with correlated disturbances and an endogenous binary variable. This is a recursive simultaneous equation model where the binary dependent variable in the first equation appears as an endogenous variable on the right-hand side of the second structural equation (Reference GreeneGreene 2012 for a presentation). As Reference WildeWilde (2000) has shown, under the standard assumption that the correlated disturbance terms between the two equations are bivariate normally distributed, the endogenous nature of one of the variables on the right-hand side of the structural equation can be ignored in formulating the log-likelihood. The only restriction on the parameters that needs to be imposed in order for complete identification is that the two equations in the simultaneous model contain a varying exogenous regressor.Footnote 8
6.4.1 The Baseline Bivariate Probit Model
The bivariate probit model with an endogenous binary variable takes the following form:
where W* and y* are unobserved latent variables. The latent variable y* can be interpreted as the expected returns from innovating and W* is the unobservable severity of financing constraints. The assumption is that the error terms of the two equations are bivariate normally distributed and correlated with the covariance equal to ρ.
Equation (6.4) presents the baseline bivariate probit model estimated to determine the impact of credit constraints on the probability of innovating. The first equation modelling the probability of being credit constrained takes the same basic form as Equation (6.1) in the ordinary probit model developed in Section 6.3.
In the second structural equation explaining innovation outcomes, the enterprise level covariates include FC, the endogenous binary variable measuring credit constraints, RD, a binary variable equal to 1 if the establishment undertakes R&D expenditures, Train, a binary variable equal to 1 if the establishment offers formal training to its permanent employees, and the control variables appearing in the first equation. The variable Export in the second equation is designed to capture horizontal linkages, and it reflects the hypothesis that exporters will be more innovative through their contacts with more knowledgeable foreign customers or due to the increased pressure of international competition. We also assume that larger establishments are more likely to innovate as they have more resources than smaller establishments. Returns to scale are hypothesized to be decreasing due to problems of managerial inefficiency and organizational inertia in larger establishments, and this is captured by including the square of the natural logarithm of employment (LogEmp2). As for the first equation we control for sector of activity. The data are weighted as in the ordinary probit regressions in Section 6.3 and we use cluster-controlled standard errors throughout to correct for within-country error correlation. Table 6A.2 in the Annex presents descriptive statistics for the enterprise-level covariates.
6.4.2 Results for the Baseline Bivariate Probit Model
Table 6.2 presents the results for both the univariate probit model estimating the probability of innovating (column 1) and for the baseline bivariate probit model taking into account the endogeneity of firm-level credit constraints (column 2). The value for rho in the bivariate model is 0.799 and highly statistically significant, showing that the disturbances of two univariate probit models are highly correlated. This result supports the hypothesis that credit constraints are endogenous to the decision to innovate and that firms that engage in innovation development projects are more likely to face financial constraints than firms that don’t even try to innovate.Footnote 9 The importance of the bias introduced by the endogeneity can be appreciated by comparing the results for the univariate probit model shown in column 1 with those for the bivariate probit model in column 2. In the univariate model the coefficient on the financial constraint variable (FC) is weakly negative and non-statistically significant, while in the structural equation predicting innovation outcomes in the bivariate probit model the negative coefficient on FC is both considerably larger in absolute size and highly statistically significant.
Table 6.2 Baseline Bivariate Probit Model
| (1) Univariate probit | (2) Bivariate probit model | |
|---|---|---|
| Innovation equation | Dependent variable : NewFrm | |
| FC | −0.128 | −1.373*** |
| (0.0894) | (0.153) | |
| R&D | 1.253*** | 0.980*** |
| (0.0154) | (0.0181) | |
| Train | 0.0405* | 0.0132 |
| (0.0238) | (0.0121) | |
| LogEmp | 0.210*** | 0.0599*** |
| (0.0490) | (0.0119) | |
| LogEmp2 | −0.0221*** | −0.0135*** |
| (0.00734) | (0.00395) | |
| Export | 0.515*** | 0.274*** |
| (0.0645) | (0.0348) | |
| Sector | −0.312*** | −0.159*** |
| (0.0570) | (0.0432) | |
| Constant | −1.034*** | −0.0571 |
| (0.0764) | (0.113) | |
| Credit constraint equation | Dependent variable : FC | |
|---|---|---|
| LogEmp | −0.167*** | |
| (0.0542) | ||
| Foreign | −0.244*** | |
| (0.0466) | ||
| Young | −0.00925 | |
| (0.0201) | ||
| Export | −0.279*** | |
| (0.00870) | ||
| Sector | 0.146*** | |
| (0.0484) | ||
| Constant | 0.186 | |
| (0.145) | ||
| Rho | 0.799 | |
| (Wald test of rho=0) Prob>Chi2 | 0.000 | |
| Observations | 25,485 | 25,485 |
Robust standard errors in parentheses. *** p<0.01, ** p<0.05, * p<0.1***, **, * denote significance at the 0.01, 0.05, 0.10 levels respectively. The data are weighted and the regressions correct for clustering of errors within countries.
Both the univariate probit and the bivariate probit models show that there is a positive and statistically significant impact of R&D expenditures on the probability of innovating. The variable measuring the provision of formal training for the firm’s full-time employees is positive in the univariate model, although it is of borderline statistical significance. It is no longer statistically significant in the bivariate probit model. The results also show that being an exporter has a statistically significant impact on the probability of innovating and that firms in the manufacturing, mining, or utilities sectors have a lower probability of innovating compared to service sector enterprises. The results for the impact of LogEmp on innovation activity do not differ between the univariate and bivariate probit models, showing that larger firms have a higher probability of innovating. There is evidence to support the presence of decreasing returns to scale in the effect of establishment size on innovation, with the squared employment term being negative and significant in both models.
Table 6.3 presents the results for the bivariate models including the national banking system indicators in the equation predicting the probability of being credit constrained. The column 2 results are for the model including an interaction term between banking system breadth and depth. In the innovation equation we control for the level of economic development by including the natural logarithm of GNI per capita (LnGNICAP).
Table 6.3 Bivariate Probit Model with country-level covariates
| (1) Bivariate probit model | (2) Bivariate probit model | |
|---|---|---|
| Innovation equation | Dependent variable: NewFrm | |
| FC | −1.277*** | −1.284*** |
| (0.302) | (0.285) | |
| R&D | 1.040*** | 1.037*** |
| (0.0955) | (0.0884) | |
| Train | 0.0769 | 0.0760 |
| (0.0535) | (0.0523) | |
| LogEmp | 0.0707*** | 0.0699*** |
| (0.0201) | (0.0180) | |
| LogEmp² | −0.0144*** | −0.0143*** |
| (0.00368) | (0.00377) | |
| Export | 0.337*** | 0.335*** |
| (0.0455) | (0.0410) | |
| Sector2 | 0.143** | 0.144** |
| (0.0612) | (0.0592) | |
| LnGNICAP | −0.285*** | −0.284*** |
| (0.0259) | (0.0252) | |
| Constant | 1.918*** | 1.915*** |
| (0.179) | (0.166) | |
| Credit constraint equation | Dependent variable: FC | |
|---|---|---|
| Foreign | −0.236*** | −0.234*** |
| (0.0320) | (0.0320) | |
| LogEmp | −0.167*** | −0.167*** |
| (0.0549) | (0.0548) | |
| Young | −0.0484 | −0.0451 |
| (0.0461) | (0.0441) | |
| Export | −0.264*** | −0.263*** |
| (0.0270) | (0.0274) | |
| Sector2 | 0.345*** | 0.341*** |
| (0.0389) | (0.0383) | |
| CONCTR | −0.00239 | 0.000887 |
| (0.00169) | (0.00199) | |
| PRVCRD | −0.00533*** | 0.000749 |
| (0.000888) | (0.00252) | |
| BRNCH | −0.0144* | 0.0204 |
| (0.00805) | (0.0139) | |
| MARGIN | −0.0115 | −0.0410 |
| (0.0299) | (0.0255) | |
| PRVCRD*BRNCH | −0.000801*** | |
| (0.000301) | ||
| Constant | 0.693*** | 0.434** |
| (0.168) | (0.182) | |
| Rho | 0.7269 | 0.7317 |
| (Wald test of rho=0) Prob>Chi2 | 0.0061 | 0.0032 |
| Observations | 25,485 | 25,485 |
Robust standard errors in parentheses. *** p<0.01, ** p<0.05, * p<0.1***, **, * denote significance at the 0.01, 0.05, 0.10 levels respectively. The data are weighted and the regressions correct for clustering of errors within countries.
The column 1 results show that the coefficients on the measures of banking system depth (PRVCRD) and breadth (BRNCH) are negative and statistically significant, as in the univariate probit model presented in Section 6.3. In the innovation equation the coefficient on LnGNICAP measuring the level of economic development is negative and statistically significant. To the extent that the size of technological gap is larger in less economically developed nations, this result supports the hypothesis that firms in nations that are more distant from the technological frontier will have a higher probability of innovating due to the greater amount of mature technology available on national and international markets for diffusion and adoption. The statistically significant negative coefficient on the interaction term between banking system depth and breadth in column 2 points to complementarities with the negative impact of banking system breadth on the probability of being credit constrained being greater when the level of private bank credit as a percentage of GDP is greater.
6.4.3 The Indirect Impact of the National Banking System on Innovation
In order to estimate the indirect effects of the level of development of the national banking system on innovation performance through its impact on firm-level financing constraints, we calculate the marginal effects of the enterprise and country-level covariates in the bivariate probit model on the probability of innovating being conditional on the firm being credit constrained. Table 6.4 reports both the indirect and direct average marginal effects for the covariates in the column 2 model in Table 6.3. The table distinguishes between those variables having a direct effect, those having an indirect effect, and those having both direct and indirect effects on the probability of innovating. The marginal effects reported for the four macro financial systems variables are indirect and reflect the way they affect innovation through their impact on the endogenous dependent variable FC, measuring whether or not the firm is credit constrained. For the binary variables, the marginal effects measure discrete changes and show how the probability of innovating changes as a binary variable changes from 0 to 1.
Table 6.4 Conditional direct and indirect marginal effects on the probability of innovating
| Variables | Marginal effects | p-value |
|---|---|---|
| Direct effects | ||
| FC | −0.3761 | 0.000 |
| R&D | 0.3037 | 0.000 |
| Train | 0.0223 | 0.209 |
| LnGNICAP | −0.0832 | 0.000 |
| Indirect effects | ||
|---|---|---|
| Foreign | 0.0362 | 0.000 |
| Young | 0.0070 | 0.254 |
| CONCTR | −0.0001 | 0.660 |
| PRVCRD | 0.0009 | 0.000 |
| BRNCH | 0.0075 | 0.001 |
| MARGIN | 0.0063 | 0.121 |
| Direct and indirect effects | ||
|---|---|---|
| LogEmp | 0.0463 | 0.000 |
| Export | 0.1389 | 0.000 |
| Sector | −0.0107 | 0.366 |
The data are weighted and the regression corrects for clustering of errors within countries.
The results show on average that being credit constrained reduces the probability of innovating by about 38 percent. Undertaking R&D expenditure increases the probability of innovating by about 30 percent and exporting increases the probability of innovating by about 14 percent. Foreign ownership, through its negative impact on the probability of being credit constrained, indirectly increases the probability of innovating by about 4 percent. The effect of undertaking training and the effect of the firm being established within the previous three years are not statistically significant.
With respect to the aggregate banking system variables, the results show that on average the indirect effects of BRNCH and PRVCRD on the probability of innovating are positive and statistically significant. The estimated indirect effect of PRVCRD is quite small and it implies that a 10 percent increase in the value of bank credit as a share of GDP would lead to an approximate 1 percent increase in the probability of innovating. In the case of BRNCH, the marginal effect is considerably larger with an increase in the number of bank branches per 100,000 adults by 10, increasing the probability of innovating by about 7.6 percent. For countries like Yemen, Uganda, and the Democratic Republic of Congo this could account for an approximate 20 percent shortfall in the probability of innovating when compared with countries with relatively well-developed banking systems like Tunisia, Morocco, and Jordan.
The negative coefficient on the interaction term between BRNCH and PRVCRD shown in Table 6.3 implies that the marginal effects on innovation of an increase in banking system breadth will be larger for higher levels of banking system depth. To explore this relation in more detail, Figure 6.6 shows the average marginal effects with 95 percent confidence intervals of an increase in BRNCH conditional on the level of private bank credit as a percent of GDP. The results show that the average marginal effects on the probability of innovating of an increase in BRNCH increase in size as PRVCRD increases, and that they are positive for values of PRVCRD above 30 percent. The positive effect is only statistically significant for values of PRVCRD over 40 percent.

Figure 6.6 Marginal effects of BRNCH for different levels of PRVCRD
The first quartile of the sample of thirty-six nations investigated here have values of PRVCRD under 23 percent of GDP and half of the nations have values under 40 percent. The results presented in Figure 6.4 imply that for the majority of nations an increase in banking system outreach or breadth will have only a limited or no positive impact on enterprise innovation performance. The results point to a threshold value of PRVCRD, over 30 percent of GDP, which needs to be attained in order for innovation performance to possibly benefit from increases in banking system breadth. These results support the view that institutions matter and moreover provide insight into the factors that may slow or inhibit innovation and technological catch-up in low income nations with a very low level of financial institutional development.
6.4.4 The Indirect Effect of Firm Size on Innovation Performance
There is considerable evidence to show that smaller firms are more likely to be credit constrained than larger ones. At the same time, increases in the breadth or outreach of the banking system (in the sense of the number of branches and their geographic spread) will arguably improve the relative position of smaller firms that tend to rely more on relational banking than larger ones. To provide evidence relevant to this, we present in Table 6.5 the results of regressions including firm size categories, and we estimate their interactions with the measures of banking system breadth and depth. We use a three-level categorical variable to measure size, with small firms employing less than 20 employees, medium firms employing 20 to 99 employees, and large firms employing over 99 employees. Large firms are the reference category in the regressions. We remove the continuous variable used in the previous regressions that measured firm size as the natural logarithm of the number of employees.
Table 6.5 Bivariate Probit Model with interaction effects on firm size
| (1) Bivariate probit model | (2) Bivariate probit model | |
|---|---|---|
| Innovation equation | Dependent variable: NewFrm | |
| FC | −1.008*** | −0.776** |
| (0.175) | (0.303) | |
| R&D | 1.145*** | 1.204*** |
| (0.0589) | (0.0396) | |
| Train | 0.0883* | 0.106* |
| (0.0475) | (0.0605) | |
| Export | 0.385*** | 0.444*** |
| (0.0570) | (0.0353) | |
| Sector | 0.108*** | 0.0856* |
| (0.0303) | (0.0476) | |
| LnGNICAP | −0.290*** | −0.292*** |
| (0.0195) | (0.0166) | |
| Constant | 1.857*** | 1.745*** |
| (0.1332) | (0.1808) | |
| Credit constraint equation | Dependent variable: FC | |
|---|---|---|
| Foreign | −0.182*** | −0.145*** |
| (0.0565) | (0.0213) | |
| Young | −0.0705** | −0.0515** |
| (0.0337) | (0.0239) | |
| Size (small) | 0.468*** | −0.0438 |
| (0.139) | (0.315) | |
| Size (medium) | 0.183*** | 0.256* |
| (0.0359) | (0.145) | |
| Export | −0.280*** | −0.258*** |
| (0.0279) | (0.0489) | |
| Sector | 0.308*** | 0.260*** |
| (0.0301) | (0.0241) | |
| CONCTR | −0.00327** | −0.00285* |
| (0.00156) | (0.00159) | |
| PRVCRD | −0.00606*** | −0.0111*** |
| (0.000629) | (0.00203) | |
| BRNCH | −0.0169** | 0.0118 |
| (0.00770) | (0.0181) | |
| MARGIN | −0.00725 | 0.00397 |
| (0.0279) | (0.0261) | |
| Size (small)*PRVCRD | 0.00995*** | |
| (0.00256) | ||
| Size (medium)*PRVCRD | 0.00208** | |
| (0.00102) | ||
| Size (small)*BRNCH | −0.0410* | |
| (0.0215) | ||
| Size (medium)*BRNCH | −0.0317*** | |
| (0.00884) | ||
| Constant | −0.0330 | 0.159 |
| (0.164) | (0.284) | |
| Rho | 0.550 | 0.401 |
| (Wald test of rho=0) Prob>Chi2 | 0.0004 | 0.0174 |
| Observations | 25,482 | 25,482 |
Robust standard errors in parentheses. ***, **, * denote significance at the 0.01, 0.05, 0.10 levels respectively.
The data are weighted and the regressions control for clustering of errors within countries. Here, we have a sample of 25,482 observations because three firms were not classified in one of the three groups in the data.
The results in column 1 show that relative to large firms, small and medium-sized firms are more likely to be credit constrained, with the effect being greater in the case of small firms. Expressed in terms of marginal effects, the indirect negative effects on the probability of innovating for small and medium-sized firms, respectively, compared to large firms come to about 6 and 2 percent.
In column 2, the model includes interaction effects. There is a clear difference between how firm size interacts with the level of BRNCH and PRVCRD. In the case of BRNCH, the coefficients on the interaction terms are negative and statistically significant, implying that the probability of being credit constrained for small and medium-sized firms decreases relative to larger ones when the number of bank branches per 100,000 adults increases. The effect is stronger for the small firm category. In the case of PRVCRD, while the interaction effects are much weaker, they work in the opposite direction, implying that the relative positon of larger firms improves as the amount of private bank credit in the economy increases. Again the size of the effect is larger for small firms than for medium-sized ones.
In Figure 6.7 we take a closer look at how the innovative performance of small and medium-sized firms is affected by banking system breadth and depth. The figure shows the predictive margins or probabilities of innovating for each size category of firm for different levels of banking system depth and breadth. The results show that for all levels of private bank credit as a percent of GDP, the innovative performance of small firms and, to a lesser extent, medium-sized firms benefits from increases in the number of bank branches. This supports the hypothesis that increases in banking system outreach are relatively advantageous for smaller establishments. The innovative performance of both medium- and large-sized firms improves from increases in the amount private bank credit in the system regardless of the level of banking system breadth or outreach. For medium-sized firms, this improvement means that their probability of innovating is slightly greater than that for smaller firms at very high levels of private bank credit as a share of GDP. In the case of large firms, at very high levels of private bank credit their probability of innovating is equal to or outstrips that of small firms, except in the case where the number of bank branches per 100,000 adults is well above the sample average.

Figure 6.7 Predicted probabilities of size on innovation
6.5 Conclusions
There is considerable evidence at the country level that financial system development is positively correlated with economic development. At the same time, micro-level studies drawing on firm-level data have identified a significant negative relation between financing constraints and firms’ investments in their R&D and innovation activities. These combined results are suggestive of a channel through which financial development may influence innovation and technological change, and hence promote economic development. A main objective in this chapter is to contribute to the modelling of this channel by showing how the level of development of the national banking system indirectly influences enterprise innovation activity through its effects on firms’ financing constraints. Our results show that low levels of financial system development may hinder or slow processes of innovation and technical change.
When estimating the impact on innovation of measures of country-level banking system depth and breadth, we obtain a number of important results. At the margin, the indirect effects of increases in the depth and breadth of national banking systems on the probability of innovating are important, and we show that the impact of an increase in banking system breadth or outreach only becomes positive above a threshold level of private bank credit as a percentage of GDP. This result illuminates a possible obstacle to technological catch-up in lower income nations with relatively shallow financial systems, and it may, as Reference LevineLevine (1997) has suggested, be a contributing factor to the creation of a “poverty trap.”
Our results are relevant to understanding the position of small enterprises, which account for the majority of businesses in developing nations and for about 56 percent of our sample. Consistent with other research we find that small firms are more likely to be credit constrained than medium and large-sized firms, and we show that this disadvantages the innovation performance of small firms relative to larger firms. We also identify important differences in the effects of increases in banking system depth and breadth on innovation performance according to firm size. Large firms tends to benefit disproportionately from increases in banking system depth, while small firms and, to a lesser extent, medium-sized firms reap relative innovation benefits from increases in banking system breadth. Our results show that the majority of enterprises will garner limited benefits from policies focusing narrowly on increasing the amount of available credit in the banking system without concomitant increases in the number of bank branches.
Our research could be usefully extended in a number of directions. The measure of innovation we use is the basic one proposed by the Oslo Manual, defined as the introduction of a product or service that is new-to-the firm. While this measure allows us to capture processes of imitation and diffusion of technologies and products, it fails to characterize differences in the importance of the firm’s in-house contribution to the innovation activity. While in some cases firms will be creatively adapting or modifying products or services developed by other organizations, in other cases they may be simply adopting and selling on new products or services developed by other organizations without any significant contribution. While the adoption of existing technologies and products without modifications requires in-house learning activity and may require investments in workforce training, we would expect financing constraints to be more binding in the case of the more substantial investments needed for the creative forms of adaptation and modification. The WBES group is currently undertaking follow-up surveys in selected nations, providing a rich characterization of the innovation process, including marketing and organizational innovations. As this survey work continues and provides coverage for a large number of nations worldwide, it will become possible to extend the analysis we have undertaken here to take into account differences in the firm’s in-house creative contribution to innovation.
Another useful extension would be to explore more explicitly the links between the level of development of the financial system, the existence of a technology gap, and processes of catch-up. Our results are suggestive in this respect. On the one hand we find that the probability of innovating tends to be greater in nations at lower levels of economic development, as measured by GNI per capita, which is suggestive of positive catch-up through technology diffusion. At the same time, we have shown that having a relatively shallow financial system decreases the probability of firms innovating. These results could be strengthened by determining whether there are threshold levels of economic development below which processes of catch-up tend to slow. By relating these thresholds to the level of institutional development, such an analysis could contribute to a better understanding of the factors that hinder or even block economic development in the world’s weakest nations.
7.1 Introduction
Determining the causal relationship between innovation and growth is a classic quest of the economics of innovation studies. However, empirical research that goes beyond verifying the existence of causality, to investigate the direction, intensity, and mechanisms that explain those causal links is still a green field (Reference Foster and PykaFoster and Pyka 2014). Investment in the public goods associated with science, technology, and innovation (STI) activities depends on a country’s available public resources, which opens up a causal loop that may be associated with either growth and welfare or poverty traps. This interaction between investment in STI and growth remains at the core of many theoretical discussions, especially in developing countries, where this investment is expected to drive economic growth, sustain catching up processes, and assist in poverty alleviation. From an evolutionary perspective, in this chapter we argue that to better understand how STI can foster economic growth, as well as differences in development trajectories between countries, consideration of the “time” dimension is a fundamental drawback in the analysis.
The “time” dimension helps to track the development path followed by a given society. In the literature, two approaches have been adopted. One is closely linked to historical analysis where the description of the crucial events that have shaped the evolution of an economic system is combined with evidence based on appreciative theorizing, including a policy perspective (Reference LundvallLundvall 1992; Reference NelsonNelson 1993; Reference HobdayHobday 1995; Reference KimKim 1997; Reference Lundvall, Joseph, Chaminade and VangLundvall et al. 2009). The other approach has a quantitative base; it uses data to describe the nature and the causal relationships of changes observed over time. By studying autoregressive vectors, the approach seeks to determine the existence and direction of the causal links between different dimensions of the innovation process and economic growth (Reference Castellacci and NateraCastellacci and Natera 2016). The two approaches are powerful tools to explain the development paths that countries follow. However, they are seldom combined to disentangle the complexity of the causal relation between investment in STI and the dynamics of an economy.
Building on data about Mexico, this chapter explores the relation that exists between public expenditure in STI (PESTI) and the dynamics of the Mexican economy, measured in terms of the gross domestic product (GDP). The analysis looks into the causal links between the two variables, and the direction and intensity of the causal effects. The paper characterizes the evolution of STI policy in Mexico, giving due consideration to the most relevant changes in both STI and economic system over a period of more than forty years. Against this background, and using data on GDP, PESTI for the period 1970–2012, we applied a Johansen System Co-integration approach (Reference Hoover, Johansen and JuseliusHoover, Johansen, and Juselius 2008) to propose a model that links economic growth to public efforts in STI and total investment.
To achieve this, it is important to understand the effect not only of the size but also the manner in which this effort is undertaken. STI activities are highly dependent on their history and how they have evolved over time. Hence, we analyze the causal relationship between STI efforts and economic growth in Mexico by combining qualitative and quantitative approaches.
After this introduction, Section 7.2 reviews the literature on the links between efforts in STI and economic growth; the discussion includes both theoretical research designs and approaches to deal with empirical evidence. Section 7.3 describes our research design. Section 7.4 presents a historical account of the evolution of STI policy, as well as the context around investment and economic dynamics in Mexico. Section 7.5 introduces the methodology underpinning the quantitative model used to analyze the causal links between the variables of interest. The section includes a discussion around the evidence used in this paper. Section 7.6 discusses the results from our econometric models. Finally, Section 7.7 concludes.
7.2 Efforts in STI and Economic Growth
7.2.1 Theoretical Approaches and Research Designs
Assessing the relationship between innovation, economic growth, and development has been a constant in evolutionary economics research. In fact, some relevant concerns, related to learning processes and the integration of innovation into productive systems, date back to Adam Smith’s discussions around labor division in 1776, and Friedrich List’s work on national systems of production and learning in 1841 (Reference Lundvall, Johnson, Andersen and DalumLundvall et al. 2002).
A pending issue in the innovation studies tradition is that if historical perspectives are fundamental to explain development, then path dependence and nonreversibility cannot be left out of the analysis (Reference Cowan and ForayCowan and Foray 2002). Case studies are the preferred methodological approach to accomplish this task. A great amount of empirical evidence has been collected from qualitative and historical research. Reference FreemanFreeman’s (1987, Reference Freeman1991) study of agents’ interactions and the importance of the state for a country’s innovation performance set an important reference for the field; Reference NelsonNelson’s (1993) comparative analyses of national innovation systems pointed out the heterogeneity of the historical processes that underpin the building of innovation systems. Reference Lundvall, Joseph, Chaminade and VangLundvall et al. (2009) and Reference Edquist and HommenEdquist and Hommen (2008) have provided insights on the different policy and institutional settings that split developing and developed countries.
An alternative stream of research, more centered on sectorial perspectives, builds history-friendly models (Reference Malerba, Nelson, Orsenigo and WinterMalerba et al. 1999, Reference Malerba, Nelson, Orsenigo and Winter2016; Reference MalerbaMalerba 2002). Researchers in this field have focused on tracking the evolution of specific technological niches, identifying key structural changes that have impacted on the structure and functioning of productive systems. These distinct approaches to research seldom combine, at least to a desirable level, econometric evidence with historical insights around the process under study.
Econometric approaches to study growth and innovation have explored the relationship between these variables using cross-country comparative analyses. A review by Reference FagerbergFagerberg (1994) included more than twenty empirical papers that had assessed – back then – the relationship between economic growth and technology, on the one hand, and productivity measures such as GDP per capita on the other. These early contributions to the literature controlled for variables such as the share of the public sector in the economy, population growth, and economic openness, while typical innovation indicators included education variables, investment in research and development (R&D), and patents. Recent contributions to this body of literature have increased the number of countries considered in the analysis, including less developed countries when data were available (Reference Fagerberg and VerspagenFagerberg and Verspagen 2002; Reference Fagerberg, Srholec and KnellFagerberg, Srholec, and Knell 2007; Reference Castellacci and ArchibugiCastellacci and Archibugi 2008; Reference CastellacciCastellacci 2008; Reference Lee and KimLee and Kim 2009). Reference Castellacci and NateraCastellacci and Natera (2013, Reference Castellacci and Natera2016) have proposed alternatives to these empirical exercises; the authors have fully integrated the time dimension into the analysis of a systemic approach to innovation and development. However, because of their focus on a broad set of countries, it is difficult to undertake a more in-depth historical analysis of how innovation capabilities have evolved over time across countries.
The empirical evidence indicates that most catching up processes have been driven by a notable accumulation of innovation capabilities. Although investments in science, or in research and development (R&D), have been important for this accumulation (Reference LeeLee 2013; Reference WongWong 2016), learning from experience has had at least the same importance (Reference HobdayHobday 1995; Reference KimKim 1997; Reference Bell and FigueiredoBell and Figueiredo 2012; Reference Dutrénit, Lee, Nelson, Soete and Vera-CruzDutrénit et al. 2013). However, while in recent years it is possible to observe some changing conditions for catching up and development, the Schumpeterian literature on coevolution is yet to develop a basic analytical framework suitable to accommodate those new processes. In effect, we need better frameworks to connect recent catching up processes with broader discussions around development as an evolutionary process; likewise renewed approaches that link innovation with economic development are missing. Some solid efforts to address some of these questions can be found in Reference Fagerberg, Guerrieri and VerspagenFagerberg, Guerrieri, and Verspagen (1999), Reference Fagerberg and VerspagenFagerberg and Verspagen (2007), Reference Sotarauta and SrinivasSotarauta and Srinivas (2006), and Reference Saviotti, Cassiolato and Pessoa de MatosSaviotti, Cassiolato, and Pessoa de Matos (2014).
7.2.2 Empirical Evidence
There is consensus on the centrality of scientific and technological advances as drivers of economic growth (Reference SchumpeterSchumpeter 1942; Reference SolowSolow 1956; Reference AbramovitzAbramovitz 1956, Reference Abramovitz1986). Based on the experience of the United Kingdom, the work by Reference Haskel, Hughes and Bascavusoglu-MoreauHaskel, Hughes, and Bascavusoglu-Moreau (2014) is one of the most recent contributions to this line of research. Reference Castellacci and NateraCastellacci and Natera (2013) present evidence on the significant contribution that investment in STI has had on the growth dynamics of eighty-seven countries; the authors used time series data for the period 1980 through 2008.
The evidence suggests that the dynamics of investment in STI should consider the characteristic of a given economy. Such characteristics determine the impacts that can reasonably be associated with an amount of this investment. At the same time, it is possible to study why the benefits from investment in STI can differ between countries.
Two recent studies by Reference Capdevielle, Enríquez, Farías, Puchet, Sánchez, Solano and ZaragozaCapdevielle et al. (2013) and Reference Santiago and NateraSantiago and Natera (2014) have proposed different scenarios that help to explain the joint long-term dynamics of STI investment, GDP growth, and labor productivity in Mexico. In particular, the authors documented trends that define the historical performance of STI-related indicators, such as Gross Expenditure in Experimental Development (GIDE for its Spanish acronym), and the federal government’s expenditure in STI (PESTI). Essentially, these studies have proposed a set of scenarios for the dynamics of STI expenditures, GDP growth, and other macroeconomic variables consistent with a level of investment in STI equivalent to 1 percent of Mexico’s GDP. In both cases, a critical assumption is that the patterns of investment in STI observed since 1970 remain unchanged over a time horizon of 10–25 years.Footnote 1
From a methodological perspective, Reference Capdevielle, Enríquez, Farías, Puchet, Sánchez, Solano and ZaragozaCapdevielle et al. (2013) introduced vector autoregressive models (VAR) to analyze, in Mexico, the magnitude of the impact on labor productivity and GDP per capita that can be associated with changes in STI investment. The study showed that a positive relationship exists between investment in STI, aggregate investment, and GDP growth. The authors illustrated the recursive effects between STI efforts and macroeconomic performance; in effect, they documented the mutually reinforcing effects between STI policy interventions and economic policies. These findings have significant implications on the levels of public investment in STI, measured in terms of the PESTI that would be required to achieve a desired effect on both GERD and GDP. Ceteris paribus, in order to reach a level of investment in STI equivalent to 1 percent of Mexico’s GDP by 2018, the PESTI would have needed to increase at a sustained pace of about 11.6 percent per annum between 2011 and 2018. The associated effect on the dynamics of the Mexican economy would have been a long-term rate of expansion of around 3.4 percent in GDP per capita, and about 1.72 percent in labor productivity (Reference Capdevielle, Enríquez, Farías, Puchet, Sánchez, Solano and ZaragozaCapdevielle et al. 2013).
Reference Santiago and NateraSantiago and Natera (2014) expanded the analysis in Reference Capdevielle, Enríquez, Farías, Puchet, Sánchez, Solano and ZaragozaCapdevielle et al. (2013) to include a time dimension into the dynamic relationship between changes in STI investment, GDP per capita, and labor productivity. The authors distinguished two stages in the expansion of GDP per capita and labor productivity associated with an initial increase in PESTI. The first stage, which the authors name “growth stage,” takes place during the five-year period immediately following the initial expansion in PESTI. In this period, both GDP per capita and labor productivity record rapid growth rates. In the second phase, the economy steadily returns to stability, with a steady rate of GDP expansion. This second phase spans about a decade after the initial increment in STI investment. The expected results are consistent with those of Reference Capdevielle, Enríquez, Farías, Puchet, Sánchez, Solano and ZaragozaCapdevielle et al. (2013); an annual increment of 1 percent in PESTI led to an expansion of about 0.1 percent in both GDP per capita and labor productivity.
The information on the magnitude of the effect that can be associated with changes in STI investment is useful to identify the potential benefits and social returns associated with public investment in STI. These findings are particularly relevant for emerging economies such as Mexico, where careful priority-setting and planning are required to maximize the use of scarce resources available to support STI activities.
In this chapter we take the analysis a further step forward; having established the existence of causal links between STI investment and GDP growth, we explore the direction and intensity of such causality.
7.3 Research Design
To analyze the causal relationship between STI efforts and economic growth in Mexico this chapter combines qualitative and quantitative approaches. The qualitative approach consists of a historical analysis of the evolution of STI policy since the creation of CONACYT in 1970. The discussion establishes the links between the scope of STI policy interventions and some of the observed performance of Mexico’s STI system over time; in particular, we show how specific objectives of research capacity building and research productivity have dominated the scene, while efforts to promote innovation are relatively more recent. The quantitative approach consists of a Johansen System Co-integration approach to propose a model that links economic growth to public efforts in STI and aggregate investment. The model was built starting with an analytical revisit of the document of Reference Capdevielle, Enríquez, Farías, Puchet, Sánchez, Solano and ZaragozaCapdevielle et al. (2013). Following this road, we include a more explicit consideration of the temporal dynamics that characterizes the relationship between those variables.
Our historical analysis builds on a timeline that characterizes the main tenets of STI policy in Mexico, which, according to Reference Crespi, Dutrénit, Crespi and DutrénitCrespi and Dutrénit (2014), can be considered structured developmental stages. The evolution of science policy and science itself is related to the economic context. The narrative is based on secondary information obtained from national S&T and STI strategies, reports, and evaluations of the main institutions with a stake in STI in Mexico, documents that reconstruct the history of institutions, and documents containing interviews with key actors in the sector.
During the last two decades, the number of econometric analyses that investigate evolutionary matters has grown. One reason is data availability on key indicators such as expenditure on R&D activities, opening the door for time series and panel econometrics. Also, new methods have been developed to include the effect of past events as determinants of the structures and patterns that define economic systems. One of those advanced methods is the vector autoregressive model, which allows for full endogeneity and cross effects of the variables in the system, incorporating information from the past to explain current states (Reference Greene and ZhangGreene and Zhang 1997). A specific case of this method that suits the purpose of our analysis is co-integration methodology, mainly developed by Reference 247JohansenJohansen (1991, Reference Johansen1995). This methodology helps to disentangle relationships among variables that co-evolve, growing over time as a system. If co-integration is confirmed, it is possible to distinguish different relationships. On the one hand, long-run relations at the core of the system, and on the other hand, the short-run structure, that represents how the system reacts to changes (Reference Hendry and JuseliusHendry and Juselius 2000; Reference JuseliusJuselius 2006).
The characterization of the short-run structure of the system helps to analyze causality among the variables and establish the dynamics of the system. The way the variables adapt to changes in the long-run structure of the system and how they transitorily adjust to the new conditions is a rich source of information (Reference JuseliusJuselius 2006). The co-integration methodology provides evidence of the forces driving the economic system, of the relationships that the time structure reveals, of agents’ aggregate interactions. Furthermore, this methodology obviates the need to impose strong restrictions onto the system; it is orientated to draw from the information contained in the data to shed light on systemic relationships. As such, the methodology is an alternative to rigid models that test approaches in which theories are confirmed or rejected; it aims at documenting empirical facts that can inform improved theorizing efforts (Reference Frydman and GoldbergFrydman and Goldberg 2008; Reference Hoover, Johansen and JuseliusHoover et al. 2008; Reference Colander, Goldberg, Haas, Juselius, Kirman, Lux and SlothColander et al. 2009).
The econometric analysis investigates the time series properties of the relationship between investment in STI and economic growth in Mexico over the period 1970–2011.
7.4 Historical Analysis
The formalization of STI policy in Mexico dates back to 1970, a year that marks the creation of the National Council for Science and Technology (CONACYT for its Spanish acronym) as the national agency responsible for planning, coordinating, and executing STI policy in the country (Reference Casas, Corona, Jaso and Vera-CruzCasas et al. 2013).Footnote 2 The creation of CONACYT built on a series of scoping and diagnostic studies and consultations with diverse organizations and communities with a stake in STI in Mexico. The studies documented the fragmented nature of the STI system in Mexico; STI activities built on individual efforts, with extremely low levels of investment and little or no connection to national development strategies (PNPCyT 1970).
The creation of CONACYT is interpreted as a symbol of the formal recognition of the Mexican government of the potential contribution that STI activities can have for the successful implementation of long-term development strategies. Specific measures were introduced to overcome shortcomings in the functioning of the STI system. In particular, the strengthening of the financial commitments around STI, and initiatives to mobilize and capture the benefits associated with a growing, yet small, base of highly qualified human resources in the country. CONACYT was expected to assume a leading role in the governance and institutional strengthening of Mexico’s STI system; the agency became responsible for designing, implementing, monitoring, and evaluating STI policies in the country (Reference Casas, Corona, Jaso and Vera-CruzCasas et al. 2013).
The ambitious changes introduced into the incipient STI system took place amid a dramatic transformation and strategic reorientation of the Mexican economy. Over the course of the last forty years or so, the Mexican economy moved away from an import substitution model orientated to the development of domestic markets for products and services, to an alternative model guided by principles of free, open, and deregulated markets. The Mexican economy became increasingly linked to global markets. Moreover, Mexico moved away from a situation of recurrent financial and economic crises, to a situation of relative macroeconomic stability yet low economic growth. Notwithstanding the initial impulse granted to STI activities as an engine of growth, the true is that in both the import substitution model and the current stage of an outward looking economy, one of the greatest bottlenecks faced by the Mexican economy has been, and still is, the limited investment in STI.
The evolution of STI policy in Mexico can be organized into three broad periods, described in the following paragraphs.
7.4.1 A Supply Push Approach (1930s through Early 1980s)
During the long period starting in the 1930s and up to the early 1970s, the demand for technology and associated services and human resources in Mexico was influenced by the dynamism of an industrialization process orientated, first, toward export markets, and then, by a rapid reorientation toward an import substitution model. In such a context, the approach to STI was characterized by a supply driven, linear model dominated by public education and research organizations. This was a period of accumulation of basic STI capacities in the country.
Starting in 1970, the official STI strategy became increasingly formalized based on the adoption of a series of plans and programs to support STI activities. The actual lifespan and scope of those programs have varied significantly, although it is possible to establish a direct link with the term of the president in office at the time (Table 7.1). In 1970, and for the first time in the recent history of STI activities in Mexico, the adoption of a National Policy and Programs for Science and Technology (Política Nacional y Programas en Ciencia y Tecnología, PNPCyT for its Spanish acronym) included STI policies informed by a series of diagnostic studies on the state of STI in the country (Reference Casas, Corona, Jaso and Vera-CruzCasas et al. 2013).
Table 7.1 STI policies and plans aligned with different government administrations in Mexico
| National plan/Program | Validity | Federal government | Average annual growth rate* | PESTI/GDP | |
|---|---|---|---|---|---|
| GDP | GFCT | ||||
| Política Nacional y Programas en Ciencia y Tecnología (PNPCyT). | 1970 | Luis Echeverría Álvarez | 6.0 | 18.7 | 0.15 |
| Programa Nacional de Ciencia y Tecnología (PNCyT). | 1978–1982 | José López Portillo | 6.7 | 11.9 | 0.40 |
| Programa Nacional de Desarrollo Tecnológico y Científico (PNDTyC). | 1984–1988 | Miguel de la Madrid | 0.5 | −8.6 | 0.32 |
| Programa Nacional de Ciencia y Modernización Tecnológica (PNDyMT). | 1990–1994 | Carlos Salinas de Gortari | 3.6 | 14.0 | 0.34 |
| Programa de Ciencia y Tecnología (PCyT). | 1995–2000 | Ernesto Zedillo | 5.5 | 9.1 | 0.40 |
| Programa Especial de Ciencia y Tecnología (PECyT). | 2001–2006 | Vicente Fox | 2.9 | −2.2 | 0.36 |
| Programa Especial de Ciencia, Tecnología e Innovación (PECITI-I). | 2008–2012 | Felipe Calderón | 0.9 | −0.9 | 0.36 |
| Programa Especial de Ciencia, Tecnología e Innovación (PECITI-II) | 2014–2018** | Enrique Peña Nieto | 2.5 | 7.8 | 0.44 |
Notes: The programs adopted in 1970 and 1976 did not specify their period of validity. In these cases, growth rates were calculated based on their actual validity, 1970–1976 and 1976–1978. *The current administration began in 2012. **Data correspond to the period 2012–2014, the first years of this administration.
During this period, the federal government’s financial commitments to STI recorded significant transformations (Table 7.1). In real terms, between 1970 and 1981, the PESTI observed a rapid expansion, with annual average growth rates (18.7 percent) greater than that corresponding to GDP growth (6.0 percent). This dynamic was sustained during the term of President López Portillo, with annual average growth rates of 11.9 percent and 6.7 percent, for PESTI and GDP, respectively. As a result, the ratio of PESTI to GDP increased from 0.15 percent in 1970, to about 0.40 percent in 1982.
The enhanced PESTI was directed to support public higher education institutions and public research centers. In addition, CONACYT’s operational budget received a substantial increase (Reference 245Corona, Dutrénit, Puchet, Santiago, Crespi and DutrénitCorona et al. 2014).
The initial boost to PESTI lost momentum between 1970 and 1982, although the breaking point took place during the 1980s. Early in the decade, and to a large extent due to the fall in oil prices, the Mexican economy entered into what was to become one of the first major economic crises that have affected it since the 1980s. The crisis made evident the structural challenges of the economy, including the significant technological backwardness that resulted from the import substitution model. Low STI capacities limited the opportunities for the Mexican economy to integrate solid value chains in the domestic market, particularly around areas of strategic importance for the economic development of the country. These included natural resource-based industries, capital goods, or industries with high technological content. It is in this period that manufacturing assumed leadership as the main driver of the Mexican economy, although competitiveness and integration of the sector with the global economy were really poor.
Mexico initiated a comprehensive economic and structural adjustment program intended to lay the foundations for a new economic development strategy. This period was characterized by an abrupt fall in the economic activity, and a subsequent period of economic stagnation; GDP growth recorded annual rates in the order of 0.5 percent between 1984 and 1988. Investment in STI took a direct hit; PESTI fell at an average rate of 8.6 percent per annum over the same period.
It is in this period that we observe the creation of some programs, in place to date, intended to contain the negative effects of the economic crisis on the scientific community in Mexico. In a way, the intention was to minimize the loss of STI capacities accumulated until then. This is the case of, for example, the System of National Researchers (SNI for its Spanish acronym). This system, created in 1984 with the intention to retain the existing base of researchers in Mexico during the crisis, grants a series of incentives linked to researchers’ individual productivity. Over time, the System of National Researchers has greatly enhanced its scope and mandate; it is now the main instrument at the disposal of the Mexican government to recognize research productivity and promote careers in STI; moreover, it serves as the leading mechanism to assess the quality of S&T production in Mexico (FCCT-AMC 2005; Reference SantiagoSantiago 2006; Reference Vega y LeónVega y León 2012).
7.4.2 Demand Pull (Late 1980s – 2000s)
This period started with the painful transition from the import substitution model through the structural adjustment process inspired by policies modeled according to the principles of the Washington consensus. Structural reforms included the steady withdrawal of the Mexican government from direct intervention in economic activity, a substantive deregulation program, economic and financial liberalization, the privatization of public assets, and the intention to promote the development of a strong private sector. A segment of export-oriented firms was expected to lead recovery and, subsequently, the expansion of the Mexican economy.
This emerging context of economic deregulation and enhanced ruling of the market failed to reverse the bottlenecks observed in the area of STI. The limited STI capacities led to a productive specialization centered on activities with low technological content and limited integration with domestic and global value chains. The increased presence of Mexican manufacturing products in export markets was led by traditional industries specialized in the processing of natural resources, while competitiveness was underpinned by lowering labor costs. The pace of economic growth was considerably below the one observed during the best years of the import substitution model, and subject to greater volatility, notwithstanding some improved macroeconomic stability.
In regards to STI policy, the change in the economic strategy had two main effects. From the perspective of supply, the political weight of the organisms responsible for the promotion of STI weakened relative to other instances of the Mexican government. At the same time, the financial restrictions characteristic of the 1980s led to severe reductions in public funding for STI organizations and actual STI activities. Significant changes were introduced to the processes governing the allocation of public support to STI, particularly R&D. It is in this period that novel mechanisms based on competitive funds and open calls for projects were adopted as the preferred approach to support STI in Mexico.
The early 1990s observed a steady recovery of the Mexican economy. This is the time of the mandate of President Salinas de Gortari. This period was characterized by an average expansion in GDP of around 3.4 percent and the consolidation of the structural adjustment program. Likewise observed was a substantial recovery in PESTI, at a pace of 14 percent between 1990 and 1994. However, the economic crisis initiated in 1994 eventually resulted in a new hit on the resources available for the STI system. A new wave of economic reforms and recovery programs was adopted between 1995 and 2000, while real GDP growth rates rose to 5.5 percent on average per annum. The STI system managed to capture some benefits from the economic recovery; PESTI grew by an average of 9.9 percent, while the ratio of PESTI/GDP returned to a level of around 0.40 percent.
In terms of the demand for technology, economic liberalization facilitated the import of capital goods and induced a substitution process from locally produced capital goods in favor of imported machinery and equipment. Although the effect was positive on the technological modernization of the local economy, the parallel effect was a significant loss of local capacities to produce capital goods. While there was a clear goal of attracting multinational enterprises to promote competition and technology transfer, productive specialization, and the insertion in global value chains, the result was the fragmentation of local production capacities and a crowding out of locally owned small and medium-size firms. Attempts to promote private investment in R&D were really timid and poorly resourced. In the late 1990s a decision was made to introduce a tax credit program to promote R&D.
7.4.3 Toward a Systemic Approach (2000s Onwards)
With the start of the new millennium, a growing consensus could be observed that the promotion of competitiveness based on individual enterprises was insufficient to sustain faster rates of economic growth. Economic transformation required a more systemic approach. A renewed interest in supply-driven economic policies was evident, this time as a mechanism contributing to attract private investments. At the same time, there was the intention to improve articulation and coordination between knowledge supply and knowledge demand. The start of this period also marked the beginning of a stage in which, for the first time, greater emphasis in learning and experimentation provides the basis for the design and implementation of STI policy.
In regards to the reform of the STI system, in 2002 a new Science and Technology (S&T) Bill was approved by the Mexican Legislative, together with other regulations and by-laws; a new mix of policy instruments was also introduced as part of the new approach to STI support. Some major features of the new S&T Bill were, (1) the adoption of a new legal framework to govern the STI system, under the leadership of CONACYT; (2) the introduction of a new systemic approach to STI, with renewed emphasis on the regionalization of STI capacities; (3) the articulation of federal and regional and local STI policies, and the democratization of decision-making around STI, with an increased presence of the research communities, and stronger leadership of the Mexican Presidency.Footnote 3 Although the scope of the new 2002 S&T Bill centered on the functioning of the STI system, in 2011 a reform to the bill introduced some important changes to make more explicit the notion of innovation. The official discourse recognized innovation as a third pillar for public policy intervention, next or in principle, at a level of importance similar to science and technology. Likewise recognized was the need to build a National System of STI. A new S&T Special Program 2002–2006 was published in 2002 (PECYT for its Spanish acronym).Footnote 4
This renewed view of the contribution of STI to economic dynamics took place in the context of sluggish economic activity. Indeed, beginning in 2001 the Mexican economy experienced a new slowdown, eventually exacerbated by the effects of the global economic crisis of 2008 and 2009. During the administration of President Felipe Calderón (2008–2012), Mexico recorded its second poorest economic performance of the last forty years; GDP growth stalled to about 0.9 percent on average per annum. In regards to public expenditure in STI, PESTI systematically recorded negative growth rates, a situation that contrasted significantly with the federal government’s ambitious plans to reform the STI system (PECITI 2008–2012).
Beginning with the PECYT 2002–2006, the subsequent PECITI I (2008–2012), and PECITI II (2014–2018), new policy instruments have been added to the suite available for STI authorities: new thematic competitive funds – sectorial funds and regional funds – programs to support scientific research orientated to address specific development problems, programs specifically designed to promote research collaboration particularly between academia and the productive sector, and programs to incentivize innovation by the private sector. The latter included an R&D tax credits program (2003–2009) and the current Innovation Stimulus Program (Programa de Estímulos a la Innovación, PEI).
A persistent structural weakness of Mexico’s STI system is the low level of investment in STI, both public and private. Moreover, erratic dynamics characteristic of PESTI has hindered the capacity to induce meaningful quantitative changes in STI expenditures relative to GDP. Both PESTI and GERD have consistently been below 0.5 percent relative to GDP. By 2015 CONACYT reported that the ratio was approaching 0.6 percent but it is still too early to see if this effort can be sustained and augmented, even.
The observed trend in the PESTI to GDP ratio can be put in context if one considers that in the early 1970s, UNESCO’s recommendation was for a level of investment in STI equivalent to 0.5 percent of GDP. In México, such ratio was just 0.15 percent of GDP (Reference Dutrénit, Capdevielle, Corona, Puchet, Santiago and Vera-CruzDutrénit et al. 2010). By 2014, while the recommended level of investment was a minimum 1 percent of GDP, the actual level recorded in Mexico was about 0.40 percent for PESTI and 0.54 percent in the case of GERDFootnote 5 (Figure 7.1).

Figure 7.1 Evolution of GDP and PESTI, 2007–2014 (standardised values).
In terms of governance of the STI system in Mexico, CONACYT faces significant challenges (Reference 245Corona, Dutrénit, Puchet, Santiago, Crespi and DutrénitCorona et al. 2014). It has difficulties in designing and implementing STI policies with a long-term perspective. One reason is the limited budgetary appropriations received from the federal government. As already noted, sitting at less than 0.6 percent, the GERD/GDP ratio is far from the 1 percent target established by the 2012 S&T Bill. Moreover, CONACYT has control of approximately half of PESTI, while the other half is distributed between myriad federal government organizations.
Imbalances in budgetary appropriations accompany differences in decision-making capacities around STI policy; CONACYT falls somewhat behind other federal government organizations with a stake in STI. Moreover, CONACYT has limited capacity to implement the directives received from the different organizations with a stake in STI, including the Mexican presidency.
This overview of the functioning of STI policy in Mexico suggests that more than a systematic progression in STI policy capacities, in practice, it is possible to identify public policy interventions that target short-term objectives. This narrow horizon for STI policy implementation is seldom articulated with a long-term development strategy that builds on an intensive use of STI activities. STI policy interventions lack continuity and consistency, with limited capacity to sustain the steady accumulation and consolidation of STI capacities in the country. Likewise missing are monitoring and evaluation approaches that make it possible to define and articulate short, medium, and long-term development outcomes with specific STI policy interventions. Moreover, there is a strong disconnection between policy objectives and actual commitment of resources over a long-term perspective.
7.5 Causal Analysis: The Quantitative Model
The econometric analysis presented in this chapter investigates the time series properties of the relationship between investment in STI and economic growth in Mexico. The data used cover the period 1970–2011. We make use of time series co-integration analysis, building on the system approach developed by Johansen.
The co-integration approach analyses the relationships between nonstationary time series by looking at their long-run equilibrium relationship as well as the process of short-run adjustment (Reference Engle and GrangerEngle and Granger 1987). More precisely, if two or more variables are integrated of the same order (e.g. they are both I (1) series), there might exist a linear combination of them whose residuals are stationary – in other words, the two series are not stationary but one (or more) linear combination of them is.Footnote 6 If this is the case, the variables are said to be co-integrated. The Johansen co-integration method has one major characteristic that makes it suitable to analyze the time series properties of a model. Based on a Vector Error Correction (VEC) econometric specification, the approach helps to distinguish between long- and short-run structures; hence it is possible to identify the long-run causal effect of each explanatory variable on a country’s growth rate along its development path. This is the crucial task that our analysis undertakes.
The method proceeds in three steps. First, it investigates the presence of unit roots in the variables. This can be done through two different tests, namely the Augmented Dickey Fuller (ADF) test and the Phillips and Perron (PP) test. Second, it studies the existence of co-integration relationships among the variables of interest. In order to do so, we specified a VEC model comprising K variables:
 (7.1)
(7.1)where Yt is the vector that contains the K variables of the model, Π is the matrix that contains the Error Correction Term (ECT), Γi are the matrices related to the transitory effects (part of the short-term structure), p is the lag order, ν and ηt are the deterministic components, and εt are independently and identically distributed (i.i.d.) errors with mean zero and a finite variance σ2. Reference Engle and GrangerEngle and Granger (1987) show that if variables are co-integrated, the Π matrix in Equation 7.1 should have a reduced rank r, such that K > r > 0. The Reference 247JohansenJohansen (1991, Reference Johansen1995) co-integration rank test seeks to determine those r co-integrating relationships by adopting Trace Test and Maximum Likelihood specifications. Under the null of finding an additional co-integrating relation, it uses a recursive test starting with r = 0 until the first rejection is encountered.
The third and crucial step is estimation and identification of the model. The ECT term comprises all the information about the long run structure of the system. The Π matrix can be expressed as:
where β is a matrix with the co-integrating relations – representing the long-run equilibrium relationships – whereas α represents the set of long-run Granger causality effects, measuring how variables react to deviations from the long-run equilibrium path (Reference GrangerGranger 1969). Specifically, the Johansen approach allows us to determine two distinct types of causality. On the one hand, we can analyze short-run causality by using the Γi matrices to investigate how variables react to short-term external shocks (i.e. the effect of one variable change on another variable change). On the other hand, for our study it is more interesting to investigate long-run causality patterns, namely how variables react to deviations from the long-run equilibrium β. Hence, we will focus on the estimation results for the α matrix, which represents the way variables react when an exogenous shock (i.e. changes on STI investment) tends to move the system out of its long-run equilibrium path.
More precisely, a positive value for an estimated α coefficient would indicate that a change in the variables investment has a driving force effect on the rate of growth of another variable (i.e. GDP per capita) over this four-decade period of its transitional dynamics. By contrast, a negative value of α coefficient would imply that changes in the variables have had an equilibrium-correcting effect on the growth rate of the economy along its transition path: A negative sign provides evidence of a pro-cyclical relationship, since it captures the inertia behavior of the system to remain unaltered.
Econometric time series analyses describe the dynamics of processes that change over time. In particular, if these processes are closely related and show signs of coevolution, it is possible to demonstrate that such link exists in a period. Evidence suggests that socioeconomic variables, such as GDP, are related with scientific and technological variables such as investment in STI over time. Johansen’s co-integration system approach allows verification of the existence of these relationships. As discussed in Section 7.3, the causality analysis here outlined is based on this approach: We aim to find evidence on the existence but also on the characteristics of the long-run causality between economic activity and STI investment. It is important to note that STI investment is only a fraction of total aggregate investment in the country; because of this it is necessary to consider the impact of Fixed Capital formation on the economy.
We present a stylized model that considers a system composed of three elements (all measured in per capita terms): GDP, Fixed Capital Investment (FK), and STI expenditure (PESTI). We have also added dummy variables to better characterize the external shocks that have occurred in the economy, as described in the historical analysis. Nevertheless, even when the configured model considers all these features, we will still focus on the relationship between GDP and STI investment. Figure 7.2 is a schematic representation of the model.

Figure 7.2 Schematic representation of the empirical model
As shown in Figure 7.2, the outline model has a systemic design, in which each element is considered in terms of its relation with the other. This allows us to analyze causality in a more complex way, by including the effects from other dimensions on the existence and direction of causal link between GDP and STI investment.
7.5.1 Data
We collected data to proxy the variables of the conceptual model for the period 1970–2011. We are considering data in per capita terms since it is more appropriate to measure welfare levels.Footnote 7 Data have been homogenized according to the country’s methodological measurement changes during the period and it is presented in real terms (year 2003). Dimensions have been proxied as follows:
GDP: GDP per capita in purchase power parity, derived from growth rates of overall consumption, government consumption, and investment. This is the proxy for economic welfare in our estimations.
STI public expenditure (PESTI): we are using Government Expenditure on STI (PESTI) activities in per capita terms. We acknowledge that we are missing private investment on STI; nevertheless, in Mexico the public sector is the main force of the innovation system and has a strong traction force on private investment. In fact, the indicator commonly used to measure the national effort on STI is the gross expenditure on R&D (GERD). In the case of Mexico, it has time series of government-financed GERD since 1970. In contrast, data on the total GERD is collected since 1993, when information about the business enterprise expenditure on R&D (BERD) began to be systematically collected from the R&D surveys. Therefore, for an analysis of time, you can only use public investment in STI. Mexico is a federation as this indicator is called “Federal Spending on STI.” Data from 1993 show that private spending is reduced, and is less than federal government spending; BERD has not exceeded 35 percent of GERD. In fact, evidence suggests that over time private spending has been associated with public effort (Reference Capdevielle, Enríquez, Farías, Puchet, Sánchez, Solano and ZaragozaCapdevielle et al. 2013). Therefore, federal government-financed GERD is a good indicator of the national effort in STI.
Fixed Capital investment (FK): total investment in the country, in per capita terms.
Shocks (DS): During the last forty years, as has been shown in the historical analysis, Mexico has undergone important economic and political transformations, and many of them have sometimes experienced episodes of crises and stability. These structural breaks have important effects on the aggregate time series dynamics, and must therefore be considered in the econometric analysis. The inclusion of permanent time dummies, for long-lasting external shocks, allows us to control for the presence of these exogenous events in the empirical exercise. We have added three dummy variables to mark important shocks in Mexican economic history, namely in 1982, 1988, and 1994. All these shocks are discussed in detail in the historical analysis (Section 7.4).
7.5.2 Model Results
We have applied the Johansen System Co-integration approach in order to estimate our model. In Table 7A.2, we present the preliminary tests required to build the empirical exercise: variables’ unit root analysis, co-integration tests, and lag structure. Based on those tests, we found evidence of co-integration with rank r = 2, defining two co-integrating equations.Footnote 8 We have identified the model in such a way that the long-run causality between GDP and STI could be directly evaluated. The corresponding mathematical representation of our system is as followsFootnote 9:
 (7.3)
(7.3)
where the vector [(β1; φ1; δ1; λ1; η1; c1) (β2; φ2; δ2; λ2; η2; c2)] represents the long-run co-integration (equilibrium) relationships, and the vector [(α11; α12) [(α21; α22)] provides a measure of the extent to which the growth rate of the economy responds to a (level) change in STI expenditure (e.g. due to a policy change). The first co-integrating equation (the one that contains the parameters β1; φ1; δ1; λ1; η1; c1) shows the long run relationship between GDP and STI expenditure. The second co-integrating equation (the parameters β2; φ2; δ2; λ2; η2; c2) expresses the long run relationship between GDP and FK. In Table 7.2, we show the result from the long-run co-integration relationships:
Table 7.2 Long run co-integration equations (the β vector)
| Cointegration equation 1 | Cointegration equation 2 | ||
|---|---|---|---|
| GDP | Coefficient | 1 | 1 |
| Standard error | - | - | |
| T-Statistic | - | - | |
| FK | Coefficient | - | [−0.335631] |
| Standard error | - | (0.02444) | |
| T-Statistic | - | −13.7335*** | |
| PESTI | Coefficient | [−0.168137] | - |
| Standard error | (0.01853) | - | |
| T-Statistic | −9.07359*** | - |
Significance level: *** 1% sig. level; ** 5% sig. level; * 10% sig. level.
Coefficients in brackets [ ]
Standard errors in parenthesis ( )
Arranging the model in this fashion allows us to test the direct effect of STI expenditure on GDP. As explained in Section 7.3, by looking at the sign and significance of the α coefficients, we are able to identify the kind of long-run causality that is evidenced between those variables:
Causality from PESTI to GDP: applying a Wald test on the α11 coefficient, we can explore whether there is evidence of a causal relationship between STI and GDP. Furthermore, if the coefficient is statically significant, a positive sign would mean that PESTI is a driving force for GDP growth; while a negative sign would imply that PESTI has a procyclical behavior.
Causality from GDP to PESTI: since GDP takes part in both co-integrating equations, in order to check for the existence of this causal link, we should apply a joint Wald test on the coefficients α21 and α22. In this case, the analysis of the type of causality is more complex: provided that the joint Wald test is statically significant, a positive sign in α21 implies reinforcing relation between PESTI and GDP, while a negative one would imply an inertial behavior; a positive sign on α22 provides evidence that economic growth and capital investment are the ones that could foster STI expenditure; to the contrary, a negative sign would be evidence of an inertial behavior. The final effect of GDP on PESTI would depend on the combined effect of both parts of the equation.
The causality results are presented in Table 7.3.
Table 7.3 Causality analysis
| From | To | Chi-Squared statistic | Cointegration equation 1 (αk1) | Cointegration equation 2 (αk2) |
|---|---|---|---|---|
| PESTI | GDP | 24.28975*** | [−1.2331] | - |
| (0.2502) | ||||
| GDP | PESTI | 6.561536** | [−0.651253] | [2.844135] |
| (1.06466) | (1.170513) |
Significance level: *** 1% sig. level; ** 5% sig. level; * 10% sig. level.
Coefficients in brackets []
Standard errors in parenthesis ()
The causality analysis provides evidence of the procyclical behavior of STI expenditure in the last four decades in Mexico. The α11 coefficient is negative and significant: STI expenditure has an equilibrium correcting behavior on GDP per capita, it has not been a driving force of the country’s economic growth. The joint Wald test on the coefficients α21 and α22 is significant, but they have opposite signs: α1 is negative; it indicates that PESTI and GDP follow the same inertial path; on the other hand, α22 is positive and greater than α21, meaning that it is the combination of FK and GDP that are the driving forces for PESTI. In a nutshell, STI expenditure has depended on the availability of economic resources. Evidence suggests that STI expenditure has not been seen as a tool to foster economic growth but as a generic expenditure that is assumed only when an economic surplus is available.
7.6 Discussion
Quantitative results show evidence of co-integration and bidirectional causality between expenditure in STI and macroeconomic aggregates. However, not all of the causal links work in the same fashion: STI investment has had an “equilibrium correcting” behavior on economic growth; it has sustained the economic growth cycle. However, it has been unable to change the direction of the long-term economic trend. At the same time, economic growth has had an “equilibrium divergent” behavior on public efforts in STI. In other words, long-term trends in STI efforts are dependent on the availability of economic resources.
The qualitative analysis shows that STI policies have changed from one political cycle to the other. In fact, during the last four decades, nine different STI policy programs have been implemented in Mexico, generating an unstable environment, discontinuity, and poor coordination of STI efforts over time. In this chapter we document some of the impacts that this environment has had on STI investment in Mexico.
The combination of quantitative and qualitative methodological tools that we propose for analyzing the relationship between STI and economic growth in Mexico’s recent history sheds light on a series of unfortunate events (Reference 245Corona, Dutrénit, Puchet, Santiago, Crespi and DutrénitCorona et al. 2014). Contrary to the ambition that STI activities would foster economic growth and the country’s development path, our findings suggest that a procyclical behavior exists: Investment in STI fluctuates following economic growth trends, and at the same time, economic ups and downs may completely change STI investment trends. The impact of this evidence is multidimensional: (i) it is clear that STI activities have not been incorporated in governments’ agendas as a priority: Mexico has not followed a knowledge-driven economic development strategy; (ii) the capability building process that the STI system requires is unlikely to be developed, as uncertainty on the governmental financial efforts in STI hinders the implementation of long-term strategies; and (iii) the country is limiting its possibilities to react to economic turndowns, since the capabilities already existing in the country lack institutional support to deliver expected benefits, generating a poverty trap. In a nutshell, contrary to what we found in the literature, STI activities in Mexico do not steer the wheel of economic growth, on the contrary, they go with the wind of the economic cycle.
Reference SchumpeterSchumpeter (1939), almost eight decades ago, already proposed that innovation efforts should be contra-cyclical to economic growth. When in the low valley of business cycles, countries should make an effort to foster innovative activities in order to generate new sources of economic growth. In Mexico, the causality analysis has shown the opposite behavior: STI activities are pushed by economic growth. When food is scarce, we fail to feed the goose that laid the golden eggs.
7.7 Conclusions
The contribution of this chapter to the literature is twofold. First, we offer an alternative way to analyze causality, since we incorporate the time dimension using a mix method approach: historical policy analysis and Johansen’s co-integration system. Second, we challenge the literature by characterizing the causal links between STI activities and economic growth: It is not sufficient to find evidence of the existence of causality; the direction and intensity of the causal link have major implications on the behavior of the system.
Our causality analysis results show (i) an equilibrium correcting force from STI investment to economic growth and (ii) a driving force from economic growth and total investment on STI activities. These results are contradictory to usage of innovation capabilities as a tool to foster economic growth as it has been evidenced in most of the empirical analysis that investigate the relationship between innovation and growth (Reference HobdayHobday 1995; Reference KimKim 1997; Reference Fagerberg, Guerrieri and VerspagenFagerberg et al. 1999, Reference Sotarauta and SrinivasSotarauta and Srinivas 2006; Reference Fagerberg and VerspagenFagerberg and Verspagen 2007; Reference Castellacci and NateraCastellacci and Natera 2013, Reference Castellacci and Natera2016). The evidence suggests a tragic scenario for the future of Mexico.
As expected, a study of this type faces some limitations. As mentioned earlier, because the models used in this document utilize information on only three variables, there is the possibility that the results concerning the level of impact on GDP associated with changes/increases in PESTI could be overestimated. Any inference or policy recommendation should address this limitation.
Finally, an active policy of STI also requires understanding the behavior of the different policy tools available, whose evolution over time can alter the dynamic trend of the aggregate product. Unfortunately, in the current context of limited continuity of the instruments of STI in Mexico, particularly in terms of plans, programs, and instruments of direct support for innovation, an exercise in long-term analysis is problematic because it does not have sufficient data. Similar limitations prevent the realization of sectoral and detailed studies on the contributions differentiated by type of industry. Such further studies are proposed for an agenda for future research.
8.1 Introduction
The aim of this chapter is to analyze how the relative performance of National Innovation Systems (NIS) in the Organization for Economic Cooperation and Development (OECD) and the BRICS countries of Brazil, the Russian Federation, India, China, and South Africa could impact countries’ long-run economic growth rates. To that end, we first estimated the relative efficiency of national innovation systems and their main objectives in those countries, creation, diffusion, and utilization, using Data Envelopment Analysis (DEA) software. Then we analyzed how relative NIS performance (efficiency) could impact each country’s economic growth.
This research has two main influences. The first is from authors who recognize that technological progress is a fundamental factor in explaining economic growth (Schumpeter 1942 and Solow 1957, in neoclassical theory, and Reference RomerRomer 1990, in the new endogenous growth theory). The second comes from authors whose research has focused on nis (Reference FreemanFreeman 1987, Reference Freeman1995; Reference LundvallLundvall 1992; Reference NelsonNelson 1993; Reference Metcalfe and StonemanMetcalfe 1995; and Reference NiosiNiosi 2002, among others).
Despite their theoretical differences, Schumpeter, Solow, and Romer recognize the key role of innovation or technological progress in economic growth. Sources of innovation include human capital and R&D (Research and Development). According to Reference RomerRomer (1990), dissimilar R&D levels (population involved in R&D activities) and uneven productivity performance in the research sector explain per capita income differentials across countries. Although Romer considers patents a key factor in his research sector analysis, he does not include various institutional factors that can influence decisions to increase countries’ R&D efforts. Reference NelsonNelson (1993) points out how the new endogenous growth theory does not include in its models certain institutional variables that a growing number of authors have already accepted as essential to analyze economic growth. In this sense, the second theoretical group has pointed out that the systemic approach provides relevant and additional elements to assess success in generating new ideas (innovation) through the combined efforts of various institutions and agents, whose activities and interactions create, modify, and disseminate new technologies (Reference FreemanFreeman 1987), and also includes the utilization of new, economically useful knowledge (Reference LundvallLundvall 1992).
This study estimates the national innovation system’s relative efficiency index (NIS-REI) in OECD and BRICS countries, using DEA methodology (Charnes, Cooper and Rhodes 1978; Reference RamanathanRamanathan 2009).Footnote 1 A subsequent estimate is made of the effect of this performance on countries’ long-term economic growth. Most studies on this topic have focused on estimating whether a system is efficient as a whole. Unlike previous studies (Reference Nasierowski and ArcelusNasierowski and Arcelus 2003; Reference Lee and ParkLee and Park 2005; Reference Hollanders and CelikelHollanders and Celikel 2007; Reference PanPan 2007; Reference Pan, Hung and LuPan, Hung and Lu 2010; Reference CaiCai 2011; Reference Cai and HanleyCai and Hanley 2012), our goal is to contribute to measuring NIS-REI by objectives, in addition to assessing its global efficiency. We considered it appropriate for the NIS-REI measurement to be based on the achievement of each central NIS objective: creating, disseminating, and using new knowledge (Reference 305Whitley, Smelser and BaltesWhitley 2001).
The oecd has contributed to the performance analysis of individual and comparative NIS of its member states and of other emerging nations – such as the BRICS. As our contribution to such NIS analyses, we have estimated the NIS-REI of thirty-nine OECD (thirty-five) and BRIC (four) countries. We sought to measure relative nis efficiency across oecd and non-oecd emerging countries, such as Brazil, China, India, the Russian Federation, and South Africa. We also sought to explain how the systemic performance of innovation might impact each country’s long-term economic growth. We asked whether countries with a weak R&D sector and disjointed NIS could have positive relative efficiency compared with countries that have built strong technological capabilities and appear to have institutional and social agents interacting to foster innovative efforts, and how their innovation performance impacts their economic growth rate. In other words, we asked whether it is possible for countries lacking a strong research sector and which are dependent on technology transfer or importing capital goods to produce new ideas. We also asked if such countries could create, disseminate, and use new technological knowledge efficiently, compared with countries that possess a research sector and entrepreneurs linked to the innovation frontier. Finally, we asked whether those countries could link new ideas and technological knowledge to their growth performance.
The key questions in this research are: do countries, which invest the most in each of the three NIS objectives, achieve higher relative efficiency? Even if some NIS are efficient in achieving one or two of their objectives, might they be inefficient in achieving the others? How does this relative nis performance affect long-term economic growth? As a hypothesis, we propose that OECD and BRICS countries with the greatest GDP results derived from investing most heavily in the three core nis objectives should achieve greater NIS-REI levels than those countries channeling fewer resources into that area. We also expected that some NIS are relatively efficient in relation to some objectives but inefficient in relation to others. Finally, we expected that those countries with better relative NIS performance would report higher sustained economic growth.
In the second of the five parts comprising this chapter, we analyzed the relevance of nis and their comparative evaluation. In the third, we briefly described the Data Envelopment Analysis (DEA) methodology and outlined some findings in measuring nis with DEA. In the fourth part, we estimated the efficiency indices of each of the following objectives: creation, diffusion, and utilization, using XLDEA software. Part five is a study of the impact of relative NIS efficiency on economic growth across countries by means of an econometric model. In conclusion, we summarize our main findings.
8.2 Why Are National Innovation Systems Important and How Can We Measure Their Relative Efficiency?
The National Innovation Systems approach provides the theoretical tools to analyze all the components that combine to make innovation possible. This holisticFootnote 2 approach assumes that firms join efforts with other organizations in an institutional framework in order to create, disseminate, and use technological knowledge (Edquist 1997; Soete, Verspagen, and Weel 2010).Footnote 3 Institutions and organizations as a whole are key in arriving at innovation events (Reference BalzatBalzat 2002; Reference Balzat and HanuschBalzat and Hanusch 2004). Their importance differs depending on whether countries have developed an institutional framework, cultural heritage, and policies to foster innovation.Footnote 4
Although this approach emphasizes the national dimension within a nation-state’s geographic boundaries (OECD 1997; Reference LundvallLundvall 1992; Reference NiosiNiosi 2002), today, international institutions and organizations interact with national agents, increasing their influence on national science, technology, and innovation policy.Footnote 5 In the context of globalization processes, international trade agreements (or other kinds of arrangements) or the enactment of international legislation, such as the TRIPS, seem to affect some countries’ NIS performance, either in whole systems or in parts of systems. However, it is relevant to analyze those national factors, and also international factors affecting endogenous systemic elements, their properties, and their ties to key NIS objectives (such as foreign direct investment (FDI), technology transfer (TT), and information and communications technology (ICT) imports).
There are various approaches to analyze innovative performance and national innovative capacity (Furman et al. 2002; Reference Porter and SternPorter and Stern 2001). For this study, we chose to analyze NIS efficiency based on three main objectives: (i) creation, (ii) diffusion, and (iii) utilization (Reference 305Whitley, Smelser and BaltesWhitley 2001).
8.3 Measuring Relative NIS Efficiency with the DEA Model
Data Envelopment Analysis (DEA) is a useful tool for evaluating the relative efficiency of a set of decision-making units (DMUs). The DEA uses a variety of inputs (means) to achieve the production of goods and services (ends). The tool takes as reference the most efficient DMUs, to which it assigns an efficiency index of one, and evaluates the relative performance of the least efficient DMU, which it values between zero and one (Reference NiosiNiosi 2002) (see Annex).
We evaluated relative NIS efficiency by means of DEA, using Science & Technology (S&T) indicators, which can be quantitative or qualitative, and may be used as input or output. According to Grupp and Schubert (2010), the methodology for choosing indicators is a multidisciplinary decision based on two main ideas. The first is that innovation is a process that, when successful, may generate monopolistic profits. The second is that statistics validate the performance of each step of the innovation process. The individual indicators could be partial, not measuring innovation as a whole, and often are indirect because innovation is sometimes intangible. But there are also indicators intended to generate statistics on innovation, such as R&D expenditure and patents, among others.Footnote 6
Different studies on the relative efficiency of NIS through DEA models use R&D expenditure as input (Reference Nasierowski and ArcelusNasierowski and Arcelus 2003; Reference Lee and ParkLee and Park 2005; Reference Hollanders and CelikelHollanders and Celikel 2007; Reference PanPan 2007; Reference Pan, Hung and LuPan, Hung, and Lu 2010; Reference CaiCai 2011; Reference Cai and HanleyCai and Hanley 2012); differentiate between public R&D (Matei and Aldea 2012) and private R&D (Reference ZhangZhang 2013), or R&D capital stocks (Guan and Chen 2012; Reference ZhangZhang 2013; Reference Hu, Yang and ChenHu, Yang, and Chen 2014). All those authors take human capital into account as input under different specific variables. As output variables, it is common that the authors use patents granted by different offices (WIPO, USPTO, EPO, JPO) and scientific and technical journal articles. The authors use different output variables, such as royalty and licensing fees (Reference Nasierowski and ArcelusNasierowski and Arcelus 2003; Reference Hu, Yang and ChenHu, Yang, and Chen 2014); high-technology export and national productivity (Reference ZhangZhang 2013), especially ICT products (Reference CaiCai-Yuezhou 2011) or medium and high-tech product exports as % total product exports (Matei and Aldea 2012); employment in knowledge-intensive activities (manufacturing services) as % of total employment; knowledge-intensive services exports as % total service exports (Matei and Aldea 2012), and computers per capita (Afzala 2014) (see Table 8.1).
Table 8.1 National Innovation Systems relative efficiency studies
| Author (s) | Number of countries studied | Inputs | Outputs | Main findings |
|---|---|---|---|---|
| Reference Hu, Yang and ChenHu, Yang, and Chen (2014) | 24 countries, 1998–2005 periods | 1) Total R&D manpower; 2) R&D capital stocks | 1) Patents; 2) Royalty and licensing fees; 3)Scientific journal articles | The authors aim for comparing R&D efficiency and its determinants across countries, and the role of NIS. They find an average R&D efficiency of 0.8286 in 1998 with an improvement of 18.138 in 2015. Germany, Ireland, Netherlands, Israel, Canada, and Unites States had the higher R&D efficiency scores (more than 0.9). Romania had the lowest efficiency score of 0.2688 in 2015. The higher intellectual property rights protection, higher education investment intensity, the technological cooperation within business sector, knowledge flows(transfer) between business sector, and universities, agglomeration of R&D facilities contribute to improve national R&D. |
| Afzala (2014) | 20 emerging and developed countries | i) Openness as % of GDP; 2) Legal & regulatory framework; 3) R&D/GDP; 4) Transparency; 5) FDI/GDP; 6) Total education expenditure/GDP; 7) Secondary school enrolment; 8) Knowledge transfer | 1) Real GDP growth; 2) Scientific and technical journals; 3) Computers per capita; 4) High technology exports; 5) Inflation | The efficiency scores obtained allow identification of which countries were innovation leaders. Based on the Tobit regression model and DEA, with constant returns to scale, technical efficiency scores, the study concluded that inefficient countries could improve their innovation capabilities through increases in three main variables: the secondary school enrolment ratio; the labor force (ages 15–65), as a percentage of the total population; and domestic credit expansion by the business sector, as a percentage of GDP. |
| Reference KotsemirKotsemir (2013) | Review of 11 empirical studies on cross-country analysis of NIS efficiency | The author detects general trends and differences in the sets of variables and the content of country samples. It seems suitable for estimating the NIS’ relative efficiency through DEA model, using a sample of more than 40 countries. He recommended including highly developed countries, developing countries, and countries in transition (as Eastern European countries). There is a discussion of the set of input and output variables and also how to weigh the output variables. | ||
| Reference ZhangZhang (2013) | China comparing with 11 countries (US, Germany, Japan, UK, Italy, France, Canada, Republic of Korea, Singapore, Brazil, Russia) | 1) Firm expenditure on R&D; 2) Higher education expenditure on R&D; 3) Government expenditure on R&D; 4) Firm R&D personnel ; and 5) Government R&D personnel | Indicators of output are divided into: a) Technological output (Triadic patent; Scientific articles) and b) Economic output (market share of high-technology export and national productivity). | Chinese innovation system has achieved significant improvement in the last ten years, and narrowed the overall gap with developed countries. The economic efficiency is not a satisfactory one; it has been the bottleneck of the Chinese innovation system. |
| Matei and Aldea (2012) | EU 27 countries, 2011 | 1) New doctorate graduates per 1000 population aged 25–34; 2) International scientific co-publication per million; 3) Public R&D expenditure as % of GDP; 4) Business R&D expenditure as % of GDP; 5) Public-private co-publications per million population; 6) PCT patent applications per billion GDP; 7) Community trademarks per billion GDP | 1) Employment in knowledge-intensive activities (manufacturing services) as % of total employment; 2) Medium and high-tech product exports as % total product exports; 3) Knowledge-intensive service exports as % total service exports | The authors identify five performance groups: i) Innovation leaders, countries above the EU27 average: Denmark, Finland, Germany, and Sweden; do not always have the most efficient innovation system; ii) Innovation followers countries with a performance next to the EU27 average (Austria, Belgium, Cyprus, Estonia, France, Ireland, Luxembourg, Netherlands, Slovenia, and UK; iii) Moderate innovators countries with a performance below that of EU27 average (Czech Republic, Greece, Hungary, Italy, Malta, Poland, Slovakia, and Spain, and iv) Modest innovators countries with a performance considerably below the EU27 average. The DEA estimations of relative efficiency corrected show three countries with the highest NIS efficiency: Malta, Ireland, and UK. Although, Romania and Turkey had an efficiency score equal to one, they were in 4th and 6th place. The inefficient countries were Greece, Portugal, and Lithuania. Taking into account the first classification and the DEA efficiency scores, the authors conclude that Ireland, UK, and Germany may be considered best practices in terms of innovation policies, even if they are not necessarily efficient. |
| Guan and Chen (2012) | OECD 22 countries | 1) Number of full-time equivalent scientists and engineers; 2) Incremental R&D expenditure funding innovation activities; 3) Prior accumulated knowledge stock breeding upstream knowledge production; 4) Prior accumulated knowledge stock participating in downstream knowledge commercialization; 5) Consumed full-time equivalent labor for non R&D. | 1) Number of USPTO patents; 2) International scientific papers; 3) Added value of industries; 4) Export of new products in high-tech industries. | Various factors were chosen to represent the embedded policy-based institutional environment (IPR, Legal environment for technological development and application; openness for international trade; Private R&D funding; University R&D performance; Venture capital; University industry collaboration; Technological cooperation between enterprises). These factors had a significant influence on the efficiency performance of the two individual component processes (an upstream knowledge production process (KPP) and a downstream knowledge commercialization process (KCP) confirming the impact of public policy interventions undertaken by the government on the innovation performance of NIS. |
| Reference CaiCai-Yuezhou (2011) | 22 countries (Including BRICS and G7 countries), 2000–2008 | 1) R&D expenditure; 2) Total R&D personnel | 1) WIPO Patents granted; 2) Scientific and technical journal articles; 3) high-technology and ICT exports | BRICS have a very different relative efficiency of NIS. On one hand, Russia, India, and China have relatively high efficiency scores and, on the other hand, Brazil and South Africa have not. Some factors affecting the NIS performance are ICT infrastructure, enterprise R&D activities, economic scale, economic openness, financial structure, market circumstance, governance, education system, and natural endowments. |
| Reference Hollanders and CelikelHollanders and Celikel (2007) | 37 | Fifteen indicators in three dimensions: 1) Innovation drivers; 2) knowledge creation; 3) Innovation & entrepreneurship | Ten indicators in two dimensions: 1) Applications measures the performance expressed in terms of labor and business activities and their value added in innovative sectors and 2) Intellectual property measures they achieved in terms of successful know-how | Classification of NIS relative efficiency according to the average efficiency performance using different input combinations on two outputs dimensions: innovation leadership (with the highest values); innovation followers (values above average efficiency); moderate innovators (range of different efficiencies); catching up countries (variety of efficiencies and the lowest of the average). |
| Reference PanPan (2007) | 40 | 1) Total public education expenditure; 2) R&D expenditure; 3) FDI; 4) Goods and service imports; 5) Total R&D personnel employment | 1) Patents granted to residents; 2) Patents granted in foreign offices | Improvement of NIS relative efficiency is linked to higher R&D resources and progress in the educational systems as well as in literacy. |
| Reference Lee and ParkLee and Park (2005) | 27 | 1) R&D expenditure and 2) number of researchers | 1) Technology revenue; 2) Scientific and technical journal articles; and 3) triadic patents | A typology of countries related to relative efficiency by technological area. The first group efficient in production of patents (or inventors); a second group, efficient in technology revenue (or businessman); a third one, efficient in scientific and technical journal articles (or academician); and finally, a fourth group of inefficient countries in all the mentioned areas. |
| Reference Nasierowski and ArcelusNasierowski and Arcelus (2003) | 45 | 1) Import of goods & commercial services; 2) GER&D; 3) Degree of private business involvement in R&D; 4) Employment in R&D; 5) Total educational expenditures | 1) External patents by resident; 2) Patents by country’s resident; 3) National productivity | The authors differentiate R&D contribution to national productivity and its ability to transform inputs into outputs. Also, they differentiate the country’s role as a consumer and as generator of technological effort. The authors contrast two groups of countries. One group that overinvests in some aspect of technological effort to the detriment of its overall efficiency; its R&D effort is still at early stages of development. The other group consists of country leaders with signs of diminishing returns. |
8.4 Relative NIS Efficiency across OECD and BRICS Countries by Data Envelopment Analysis
Studies of NIS relative efficiency using DEA models usually include different numbers of countries, most of them developed and emerging countries (see Table 8.1). Reference KotsemirKotsemir (2013) points out that it is suitable to use a sample of more than forty nations, including developed, developing, and transition countries. From the literature we reviewed, only Reference Nasierowski and ArcelusNasierowski and Arcelus (2003) and Reference PanPan (2007) satisfy this recommendation; these authors studied forty-five and forty countries, respectively. Reference Hollanders and CelikelHollanders and Celikel (2007) studied thirty-seven countries, approaching that recommendation. Our study is close to that recommendation as well. We studied the National Innovation Systems of thirty-nine OECD and BRICS countries, estimating relative efficiency indices, one for each of the NIS objectives: creation, diffusion, and utilization, and one for the general system.
We estimated the relative efficiency indices of each of the following objectives of NIS for OECD and BRICS countries: creation, diffusion, and utilization. In DEA, the most efficient NIS received an efficiency index of one, and we evaluated the relative performance of the less efficient NIS, each taking values between zero and one. This methodology is based on a series of basic assumptions (see the assumptions of the DEA in Reference RamanathanRamanathan [2009]), of which we will mention only two. First, the nis, when compared to one another, operate uniformly: They receive the same inputs and produce the same outputs, although in different quantities. The concept of relative efficiency means that if an efficient nis is capable of producing x units of output with y units of input, another nis should also be capable of doing so if it operates efficiently. Second, the efficiency of each NIS is measured with the rate resulting from the sum of weighted outputs divided by the sum of weighted inputs. This rate is a number between zero and one. Points of efficiency provide guidelines and objectives for improving inefficient NIS.
We used the XLDEA 2.1 (2009) model, output-oriented with variable returns to scale.Footnote 7 In this section we describe the input and output variables, which we used to estimate the efficiency indices for each of the nis objectives and their general index. In applying the model, the same input and output variables were used for both years in the study.
In a global system, a NIS efficient in creation could be one with the best relative performance and leadership in innovation; a NIS efficient in diffusion could be one in which firms are good at absorbing new technological knowledge and are relatively moderate innovators; and a NIS efficient in utilization could be recognized as a relative innovation follower. Although a NIS efficient in creation has the scientific and technological human skills and the infrastructure required to be an efficient technological knowledge disseminator and user, it could be specialized in creation. This is because countries that have built scientific and technological capabilities focused on creation have found such activities more profitable. It could be the case that these countries suffer relative backwardness in other main objectives. The same may happen with a NIS efficient in diffusion or in utilization, where the countries may lack the technological capabilities needed to be significant creators of innovation, for example. Thus, there seems to be a relative division of activities with an interaction of competition and cooperation among the NIS in the global system, with outstanding performance in creation seen in some NIS, and outstanding performance in diffusion and utilization in other NIS.
Creation Model. Creation is defined as a NIS capacity to generate new knowledge or improve previous knowledge (Reference 305Whitley, Smelser and BaltesWhitley 2001). This model has as its inputs those variables associated with countries’ efforts to build technological capabilities to obtain new scientific and technological knowledge. The first variable is linked with high human skills involved in research and development activities (number of R&D specialists per million inhabitants, World Data Bank on Science and Technology 2007 and 2014).Footnote 8 The second refers to the expenditures needed to make research and development possible, including researchers’ earnings and the tangible and intangible capital invested as a percentage of gross domestic product (R&D expenditures as a percentage of GDP, according to the World Data Bank on Science and Technology 2007 and 2014). The third concerns foreign direct investment (fdi) and technology transfer (TT).Footnote 9 We included fdi because we consider it a key source of knowledge for firms needing access to advanced products and blueprints within each country. The indicators fdi and tt measure to what extent each variable is a key source of new technology (where 1= not at all and 7= to a great extent, World Economic Forum 2006 and 2014). “fdi encourages the transfer of technology and know-how between economies. It also provides an opportunity for the host economy to promote its products more widely in international markets. fdi, in addition to its positive effect on the development of international trade, is an important source of capital for a range of host and home economies.” (OECD 2008: 17) (see Table 8.2).
Table 8.2 Variables for the National Innovation Systems REI – DEA models of creation, diffusion, utilization, and a general model
 |
For outputs, we used two variables. The first accounts for technological innovation with potential for exploitation at industrial and commercial scales as patents applied by residents in each country’s intellectual property – IP – office (see WIPO) and also patent applications in the three main world offices (USPTO, EPO, and JPO), called triadic patents (OECD Patent Databases 2007 and 2011); both are normalized by dividing the number of patents per million inhabitants in each country. The second output variable shows the scientific or codified knowledge findings of each country as the number of scientific articles per million inhabitants in each country (Reference PanPan 2007; Reference CaiCai 2011) (see Table 8.2).
Diffusion model. Diffusion is seen as a NIS capacity to spread innovation through transmission channels other than markets. For firms, such innovations are disseminated, even when the economic impact is not restricted to firms but spread throughout society (Reference 305Whitley, Smelser and BaltesWhitley 2001). For this model, we have used as inputs indicators that express the level of education attained by each country’s population (education index),Footnote 10 the high level education involved in r&d (r&d specialists per million inhabitants) and the inventive capabilities achieved by each country (resident patent applications). As to technological infrastructure, we included the quality of overall infrastructure and specifically that derived from the ICT technological paradigm (ICT goods imports as % of total goods imports). Finally, we added a variable that shows how two agents are connecting to generate new or incremental technological knowledge (university-industry collaboration in R&D). As outputs, we took into account variables that reveal, on one hand, how countries have acquired new technologies (availability of latest technologies, FDI, and technology transfer), and on the other hand, how the different agents have achieved certain development recognized as the knowledge-acquiring capacity of firms (firm-level technology absorption), the quality environment in those institutions focused on conducting scientific research (quality of scientific research institutions), and the impact of scientific production (citations in articles by one million inhabitants), which value the relevance of scientific production after it is disseminated (see Table 8.2).
Utilization model. The innovation process has utilization as its purpose and is the point of departure that drives creation and diffusion (Reference 305Whitley, Smelser and BaltesWhitley 2001). In the utilization or usage model we used as inputs those variables showing, first, how institutions are efficient in regulating the acquisition of new technologies; second, the extent to which countries possess the quality of overall infrastructure needed to facilitate the use of new technologies; and third, the level of internet connectivity in the ICT paradigm (fixed broadband subscriptions/100 inhabitants and % individual internet users) “ … not only for business purposes but also for access to knowledge” (Reference Archibugi and CocoArchibugi and Coco 2004: 14). Finally, we included as a variable the local market size index, to measure the population’s ability to acquire innovations. As outputs of utilization, we have considered indicators accounting for human and institutional improvement once innovations are available to be used, as well as institutional efficiency and level (quality of scientific research institutions), population well-being either by increased income or access to better living conditions (per capita GDP; human development index), and the labor productivity achieved by each country (see Table 8.2).
General model. For the nis general model, we included as inputs two variables, which summarize the effort countries make in NIS, R&D specialists per million inhabitants, and R&D spending as percentage of GDP. For output, we took into account three variables that show innovation outcomes and how firms have acquired technology knowledge absorption (see Table 8.2).
8.4.1 NIS Creation Model 2007 and 2014
We proceed briefly to look over the inputs and outputs variables selected for the NIS creation models for OECD and BRICS countries in 2007 and 2014. Accordingly, we show relative efficiency index (REI) results for NIS creation using DEA estimation. As to R&D efforts among the OECD and BRICS countries, the United States leads the world in spending on R&D by amount in US dollars (USD), followed by China (453.5 and 333.5 billion USD PPP, respectively). The United States and China are followed by Japan (160.2) and Germany (101.1) (UNESCO 2015). When this expenditure in R&D is divided by the GDP, we can identify how intensive r&d spending is, taking into account the size of each national economy. In 2007, the average R&D S/GDP of the thirty-nine countries in this study was 1.7 percent, with the United Kingdom at the median line, sixteen countries above and twenty-one below that line. In 2014, this average rose to 1.9 percent with similar distribution and some changes in the country ranking and with Iceland at the median line. The efforts made by South Korea (going from 3.0 percent in 2007 to 4.29 percent in 2014) and Israel (with more than 4 percent in 2007 and 2014) are noteworthy. The intensity of R&D is also remarkable in Japan, the Nordic countries, Switzerland, and the United States (with more than 3 percent in 2007 and 2014). On the other hand, Latin American countries showed lesser efforts to improve their R&D/GDP ratio: Chile and Mexico (slightly more than 0.3 percent, although Mexico increased its effort to 0.5 percent in 2014). Among emerging countries, some have made a quantitative leap, moving to or near 1 percent of R&D/GDP (Brazil, Turkey, Slovakia, India, and Greece). A special case is China, going from 1.38 percent in 2007 to 2.05 percent in 2014 (see Table 8A.1a).
The average number of R&D specialists per million inhabitants in the countries we studied was 3277.82 in 2007 and 3546.97 in 2012. Among the countries with above average percentage of researchers – from more than 5000 to 7000 per million inhabitants – are Japan, Israel, the Nordic countries (Finland, Denmark, Iceland, Norway, and Sweden), and Luxembourg. In South Korea, this indicator rose to 3.7 percent, reaching 5928 researchers/million inhabitants. India, Chile, Mexico, and South Africa have the smallest numbers of specialists in R&D activities per million inhabitants. In 2012, India reported 156.6, while Chile, Mexico, and South Africa reported more than three hundred (see Table 8A.1a).
Concerning FDI and technology transfer, we found that the average index for the countries we studied was 5.1 in 2007 and 4.8 in 2014 (World Economic Forum 2006 and 2014). In general, we observed that not a single country has reached outstanding results relying on FDI as a key source of new technology (estimated as 7 by WEF), though FDI is an important source of new technology for all countries. Ireland reported 6.4 in 2007 and 2014, the highest estimate index; followed by Slovakia (6 in 2007). Other countries with high FDI and TT indices were some Eastern European countries, such as the Czech Republic, Estonia, Slovakia, and Hungary in 2007, as well as Australia and Mexico (all with an FDI index between 5.5 to 5.9) (see Table 8A.1a).
In the creation model, we found that major technological innovations are concentrated in a few countries, although more countries are getting better results for arriving at new scientific findings. We found an important gap across the countries we studied as to patent applications by residents per million inhabitants. South Korea and Japan stand out with the largest numbers of patents applied for by residents in their own countries; both had similar numbers in 2007 (2669.9 and 2620.8, respectively). South Korea’s number of patent applications by residents increased to 3253.9 and Japan’s fell to 2092 in 2014. Switzerland, Germany, the United States, the Nordic countries, and the Netherlands followed South Korea and Japan in 2007 with 500 to 1000 patent applications by residents per million inhabitants. Although the United States’ leadership in innovation is widely recognized, the United States fell to fifth place in 2007 (800) and third place in 2014 (894.1) as to the number of patent applications by its population. China advanced rapidly from 116 patent applications per million inhabitants in 2007 to 587.2 patent applications per million inhabitants in 2014. The median of patent applications by residents per million inhabitants in all the countries we studied in 2007 was 399.4, with twelve countries above and twenty-seven below the median. The median of patent applications by residents per million inhabitants in those countries was 302.1 in 2014, with six countries above and twenty-eight below the median. India and Mexico were far from the median and showed the lowest relative endogenous capabilities for technological inventions per million inhabitants (see Table 8A.1a).
We found great differences in the index of triadic patents among the countries we studied. Trade activity and/or the presence of multinational corporations account for Japan and Switzerland having the most patent applications by residents per million inhabitants. Sweden, Germany, the Netherlands, Denmark, and South Korea follow Japan and Switzerland as having the most patent applications by residents per million inhabitants. Brazil, Chile, India, Mexico, and Turkey had marginal triadic patents per million inhabitants in 2007. India and Brazil have seen increases in the triadic patents index since then. India went from 0.17 in 2007 to 1.60 in 2014. Brazil went from 0.36 in 2007 to 3.35 in 2014. The Eastern European countries saw an increase in the triadic patents index as well between the years 2007 and 2014.
Switzerland led the way as to distribution and ranking of scientific and technological articles published by researchers in R&D with 0.639 articles per researcher in 2007. Chile led the way in 2013 with 0.8408 articles per researcher in R&D. It is noteworthy that, in 2007, Greece, Italy, Slovenia, and Turkey did not have high numbers of patent applications by residents per million inhabitants, but had high numbers of scientific articles published by researchers in R&D. Between 2007 and 2013, Chile, India, Australia, Luxembourg, Spain, and South Africa had increased numbers of articles published by researchers in R&D. In 2007, the median for scientific articles by R&D researchers was 0.3792 with only ten countries above and twenty-three below the median. In 2013, the median for scientific articles by R&D researchers was 0.423, with only four countries above and twenty-nine countries below the median. In 2007 and 2013, the Russian Federation had the least number of scientific articles by R&D researchers (0.0603 in 2007 and 0.0797 in 2013) (see Table 8A.1a).
8.4.2 NIS Creation Relative Efficiency Index 2007 and 2014
Based on estimates of the relative efficiency index (REI) of NIS by the creation objective, in 2007, we identified six countries with an efficiency index of 1 (see Figure 8.1a). Among them are Japan, South Korea, and Switzerland, which showed higher investments in R&D activities and human capital, complemented by high scientific and technological absorption capabilities, high levels of technological innovation (patents), but not a higher volume of scientific production (articles by R&D researchers). The other three countries with relative efficiency in creation, Chile, India, and Italy, show a low level of patents and lesser efforts in innovation considered in the inputs of the REI creation model, but Chile and Italy, in particular, had the highest numbers of articles by R&D researchers, after Switzerland.

Figure 8.1a Creation relative efficiency index by OECD and BRICS countries, 2007.
Among the most efficient countries (with rei index equal to 1) in NIS creation in 2007 are seven European countries that fell above the median (0.71) of all countries studied, including Greece, the Netherlands, Slovenia, Sweden, and Turkey, the Asian countries of India, Japan, and South Korea, the Latin American country of Chile, and New Zealand. Germany, Poland, and the United States fell below and near the median. Other European countries, such as Austria, Ireland, Belgium, the United Kingdom, the Nordic countries, and Australia showed a lower creation efficiency index. Among the countries with the lowest creation efficiency index are countries that have been recognized for their poor efforts in r&d and their limited creation products, such as the Russian Federation, China, Iceland, Slovakia, Estonia, and Portugal (see Figure 8.1a).
Estimates of REI in the NIS creation model in 2014 showed substantial changes. Chile, India, Italy, Japan, South Korea, and Switzerland were efficient in creation in 2007 and maintained a REI =1 in 2014. China joined this efficient group of countries in 2014 when it substantially boosted its R&D efforts (R&D/GDP) and scientific production, and reported notable growth in number of patents. Luxembourg and South Africa were above the median in 2007, but fell under the median in 2014, although remaining close to it. Greece, the Netherlands, Slovenia, Sweden, Turkey, and New Zealand were no longer above the median in 2014, as they were in 2007, yet they each remained close to the median as well. Canada, the United States, Austria, the Nordic countries, and Spain showed improvement in NIS creation REI. Belgium, Ireland, France, Germany, Poland, and the United Kingdom saw their efficiency index fall slightly. The Czech Republic, Estonia, Hungary, Israel, Mexico, Slovakia, and especially the Russian Federation had the lowest efficiency indices in creation index (see Figure 8.1b). There are a number of countries that do not have large numbers of patents or scientific articles, but have increased efforts in some inputs with important results in their outputs, including some Eastern European countries, such as Slovenia. Other countries were relatively efficient in having more production even when their efforts, in per capita figures, were very low, such as China and India.

Figure 8.1b Creation relative efficiency index by OECD and BRICS countries, 2014.
8.4.3 NIS Diffusion Model 2007 and 2014
As we previously explained, we took as inputs the human and institutional capabilities of countries and each country’s physical infrastructure supporting the process of disseminating innovation. The countries in this study, with few exceptions, have medium to high levels of education. In 2007, the median education index was 0.78 (with a maximum value of 1), with Norway, Poland, and Australia having the highest education index of 0.91 and twenty-three other countries falling above the median. In 2007, China, India, and Turkey had the lowest education index (0.56, 0.43, and 0.56, respectively), and ten other countries fell below the median. In 2014, the median education index increased to 0.803 and the overall distribution of nations remained the same, but some countries improved their education levels, as was the case of South Korea (with an education index of 0.67 in 2007 and 0.86 in 2014), and in other cases, like in Mexico, education levels fell (from 0.75 in 2007 to 0.64 in 2014).
In 2007, the Western European countries of France, Switzerland, and Luxembourg, and also the United States, Canada, Japan, South Korea, and Australia had the highest quality of overall infrastructure with an index above the average of 4.93. In 2014, the distribution of countries as to overall quality of infrastructure remained almost the same as in 2007. The Netherlands, Switzerland, and Japan improved their overall quality of infrastructure, followed by Germany, the United Kingdom, and France. Brazil, Mexico, and South Africa had the lowest quality of overall infrastructure. Some BRICS and Eastern European countries improved their overall quality of infrastructure but remained below average.
In the case of ICT goods imports as % of total goods imports, only thirteen countries were above average (9.49 percent) in 2007, with China (24 percent) in the lead, followed by countries above 19 percent (Hungary and Ireland). The Netherlands, the Czech Republic, Mexico, South Korea, Slovakia, the United States, Finland, Japan, Australia, and Sweden had values ranging from the average of 9.49 percent up to 15 percent of ICT goods imports. By 2014, the median ICT goods/total goods imports was 8.31 percent and all countries had an overall lower ICT goods imports value. China maintained the highest number of ICT goods imports, followed by Mexico (see Table 8A.1b).
The variable university-industry collaboration in R&D by country shows that Australia, Japan, New Zealand, South Korea, the United States, and the Western European countries are more involved in this interinstitutional linkage, which favors the absorption of technological knowledge. The BRICS and Eastern European countries, Mexico, and Chile had less university-industry collaboration in R&D (see Table 8A.1b).
As to the products of diffusion, the countries we studied have an overall medium to high firm-level technology absorption, availability of latest technologies, and quality of scientific research. The median for firm-level technology absorption was 5.30. The Nordic countries, Japan, and the United States had the best firm-level technology absorption in 2007. In 2014, the United Kingdom led the rest of the countries we studied on firm-level technology absorption (6.5), followed in descending order by Iceland, the United States, Norway, and Japan. Firm-level technology absorption in Switzerland, Sweden, Luxembourg, and Israel was below that of the countries mentioned in the previous sentence. The Nordic countries and the United States had the best availability of latest technologies. In technology absorption and availability of latest technologies, some of the BRICS countries, Mexico, and Poland ranked behind the Nordic countries and the United States. Greece and Italy had higher levels of technology absorption and availability of latest technologies in 2014.
The median quality index of scientific research institutions in all the countries we studied was 4.84 during 2008–2009 and 5.03 in 2014, on a scale of 1 to 7. During those years, Switzerland was the leading country, followed by the United States, the United Kingdom, and Israel. China, Italy, and Slovakia increased the quality of their scientific research institutions in 2014. Greece, Mexico, Poland, and Turkey maintained the same low quality of scientific research institutions they had in 2007 (see Table 8A.1b).
Few countries had above average numbers of citations in articles by million inhabitants (the average being 3861.1 in 2007 and 6435.8 in 2014), which value the relevance of scientific production after diffusion. Yet, in 2007 and 2014 those countries saw a substantial increase of citations in articles. The Netherlands went from 53,844 citations in articles in 2007 to 93,138 in 2014. The United Kingdom went from 39,610.9 in 2007 to 61,832.9 in 2014. Ireland went from 16,458.3 in 2007 to 22,552.2 in 2014. Switzerland went from 7802 in 2007 to 20,057.5 in 2014. The United States went from 13,995 in 2007 to 16,726.5 in 2014. Germany went from 4804.1 in 2007 to 8313.2 in 2014 (see Table 8A.1b).
8.4.4 NIS Diffusion Relative Efficiency Index 2007 and 2014
The outcomes of the nis Diffusion relative efficiency index, based on DEA estimates, show that, in 2007, nineteen of thirty-nine OECD and BRICS countries were relatively efficient. Among them were the United States, some European countries, Japan, Brazil, Chile, India, and Mexico. Other European and brics countries fell below the average of 98.46. Despite some countries’ deficits in human and technological capabilities when compared to the countries with recognized leadership, either in the inputs or outputs selected, some achieved relative efficiency (see Figure 8.2a). In 2014, thirty-one of thirty-nine OECD and brics countries were relatively efficient in nis diffusion, while the other six countries were below the median (0.994) (see Figure 8.2b). A probable interpretation is that countries with lower levels of education, specialists in R&D per million inhabitants, resident patent applications, quality of overall infrastructure, ICT goods imports as % of total goods imports, and university-industry collaboration in R&D have an efficient nis diffusion. To the extent that such countries increase their efforts, they will improve the availability of latest technologies, FDI and technology transfer, firm-level technology absorption, quality of scientific research institutions, and the impact factor of scientific production efficiently, although with some relative changes.

Figure 8.2a NIS diffusion relative efficiency index by OECD and BRICS countries, 2007.

Figure 8.2b NIS Diffusion relative efficiency index by OECD and BRICS countries, 2014.
8.4.5 NIS Utilization Model 2007 and 2014
For inputs into the objective of utilization, we identified two groups of countries with different levels of efforts to facilitate their populations’ access to technological change (latest technologies in general and ICT technologies in particular, and overall infrastructure), by means of institutional efficiency and market size. The industrialized countries of Western Europe, North America, and Oceania showed the highest efforts to facilitate their populations’ access to technological change. The BRICS countries, Mexico, Chile, and the Eastern European countries showed lower levels of efforts to facilitate their populations’ access to technological change and fell below the overall average for the different inputs. Spain, Italy, Portugal, and Greece also showed lower levels of efforts to facilitate their populations’ access to technological change and fell below average on some indicators (see Table 8A.1c).
In 2007 and 2014, the industrialized countries of Europe, North America, and Oceania had higher levels of institutional efficiency. In 2014, emerging and Eastern European countries, such as Slovakia, Italy, and Mexico, showed the lowest levels of institutional efficiency (3.3, 3.4, and 3.4, respectively; the median being 4.63); Finland and New Zealand showed the highest levels of institutional efficiency (6.08 and 6.09, respectively).
The average availability of the latest technologies in all the countries studied was relatively high (5.87 in 2007 and 5.69 in 2014, on a scale from 1 to 7). This may be due to the globalization process. To the extent that countries are involved in global production, their prospects for inflows of new technologies increase. BRICS countries showed backwardness in their availability of latest technologies. This became more evident when we considered the level of connectivity through the ICT paradigm in 2007. Examples of the extreme cases were India, with 0.4 fixed broadband subscriptions/100 population and with 3.95 percent of individuals using the internet, and South Africa, with 0.8 fixed broadband subscriptions/100 population and 8.07 percent individuals using the Internet. Mexico, Turkey, and Chile were also among the countries with lower connectivity. By 2014, almost all the countries we studied had made important improvements, especially in internet use. The leading countries have near 100 percent internet use among their populations. Countries where a quarter of the population had internet access in 2007 were close to 50 percent in 2014, such as China, Mexico, Turkey, and South Africa. Substantial catching up was achieved by Brazil, Greece, and the Russian Federation in 2014, increasing to more than 50 percent. India remained as the extreme case, going from 3.95 to 15.10 percent of individuals using the internet (see Table 8A.1c).
Developed and brics countries had above average local market size in 2007 and 2014. The United States and China had the largest local market size during both years. We noticed improvements in the human and institutional environment whenever countries gained access to innovation in products (notably access to ICT products), processes, or institutional changes. The quality of scientific research institutions was higher in the industrialized countries of Europe, North America, Israel, and Oceania, which have convergent levels of quality. The BRICS and Eastern European countries had below average local market sizes (the average was 4.8 in 2007 and 5.0 in 2014).
A large of number of countries showed a high human development index, evidencing concern for the general well-being of their populations. The BRICS countries had lower human development indices in 2007 and 2014. The human development index fell for every country in 2012, due to the world financial crisis of 2009. We found an enormous gap in per capita GDP across countries. In 2007, the mean per capita gdp for all the countries we studied was 34,412 US dollars (all figures in 2011 USD and PPP). In 2014, the per capita GDP reached a mean of 34,577 USD. Luxembourg had the highest per capita income in 2007 (96,711 USD), followed by Norway (65,781 USD) and the United States and Switzerland (with more than 50,000 USD). Ireland, the Netherlands, Denmark, Sweden, Austria, Iceland, Finland, Canada, Belgium, and Australia each had a per capita income between 40,000 and 50,000 USD. The United Kingdom, Italy, France, Japan, Spain, New Zealand, and Greece had a per capita income between 30,000 USD and 40,000 USD. India and China reported the lowest per capita incomes (3699 USD and 7225 USD, respectively). The other brics countries, Mexico, Chile, Turkey, Poland, and Hungary each had per capita incomes of less than 20,000 USD. The OECD and brics countries’ per capita GDP had an average growth rate of 0.07 percent between 2007 and 2014, but the countries showed substantial differences in GDP growth rates. We note the significant GDP growth of some BRICS countries like China (8.3 percent), India (7.2 percent), and the Russian Federation (6.0 percent). Among industrialized countries, GDP growth was somewhat slower, as was the case in the United States (1.8 percent), Norway (3.31 percent), and Switzerland (3.3 percent).
Finally, the different levels of labor productivity achieved by each country also reflected their diversity in the use of new technologies. While the industrialized countries of Western Europe, North America, and Australia had above average levels of labor productivity (75,785 USD per worker in 2014), the BRICS and Eastern European countries fell below average in 2007 and 2014. The extreme cases are those with higher labor productivity, such as Luxembourg and Norway (128,663 USD and 125,650 USD per worker, respectively) and those with lower productivity, such India and China (13,091 USD and 22,318 USD per worker (see Table 8A.1c).
8.4.6 NIS Utilization Relative Efficiency Index 2007 and 2014
In 2007 and 2014, there were a large number of countries, including the industrialized countries of Eastern and Western Europe, North America, and some BRICS countries, with relative efficiency indices equal to one for the objective NIS utilization (see Figure 8.3a and Figure 8.3b). There were twenty-two relatively efficient countries in nis utilization in 2007, but the remaining seventeen countries were close to becoming relatively efficient. In 2014, twenty-nine countries were relatively efficient and ten were close to efficient (see Figure 8.3b). Notwithstanding the important gaps across countries in the various inputs and outputs, we noted that even with deficient efforts to use new technologies and scarce derivative outputs that show improvement of human, economic, and institutional capabilities, some countries succeeded in achieving relative efficiency in nis utilization.

Figure 8.3a NIS utilization relative efficiency index by OECD and BRICS countries, 2007.

Figure 8.3b NIS utilization relative efficiency index by OECD and BRICS countries, 2014.
8.4.7 NIS General Model 2007 and 2014
In the general model, countries’ efforts to improve national innovation systems are mainly reflected in two input variables: specialists in R&D per million inhabitants and r&d spending as percentage of GDP. Both variables involve institutional efforts to facilitate the creation, diffusion, and utilization of new ideas and products. We included the two variables in the inputs of the NIS creation model. For output variables, we used patent applications by residents per million inhabitants, triadic patents, and firm-level technology absorption. Patent applications by residents per million inhabitants and triadic patents show to what extent countries have maximized their innovation capabilities. We discussed firm-level technology absorption under our creation model section and triadic patent under our nis diffusion model discussion.
8.4.8 NIS General Model Relative Efficiency Index 2007 and 2014
Our DEA estimates of the NIS relative efficiency index by objective allowed us to identify the strengths and weaknesses of national innovation systems in OECD and BRICS countries and, thus, to outline policies to improve each objective. One can expect that a NIS with a high stock of inputs would have the best possible outcomes and a high relative efficiency rating. Nevertheless, countries with comparatively fewer resources allocated to their innovation system and smaller comparative outcomes in absolute terms may achieve relative efficiency. We identified six countries as relatively efficient in the NIS general model in 2007: Switzerland, South Korea, Japan, India, Iceland, and Chile. The average efficiency index for all the NIS studied was relatively high at 0.903 (see Figure 8.4a).
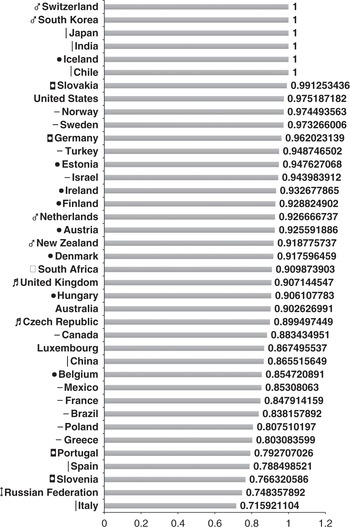
Figure 8.4a NIS general relative efficiency index by OECD and BRICS countries, 2007.
The United Kingdom, Switzerland, South Korea, South Africa, New Zealand, Luxembourg, Japan, India, China, and Chile showed improved NIS general relative efficiency in 2014. The median relative efficiency in 2014 (0.897) was similar to that reported on the 2007 model (0.903) (see Figure 8.4b). The United States is a recognized leader in innovation, though some other industrialized and BRICS countries showed a high relative efficiency in the NIS general model. This may be explained by the fact that, although some countries are far behind the leaders in innovation, they have implemented measures to improve their relative efficiency and innovation systems; yet at the same time, they face important challenges to make effective gains and catch up in absolute terms.

Figure 8.4b NIS general relative efficiency index by OECD and BRICS countries, 2014.
8.4.9 Rates of Growth and Application of an Ordinary Least Square Model (OLS)
In this second stage of our study, we used a linear OLS model to relate the efficiency indices of the different objectives of the NIS with the average long-term annual economic growth rates (2007–2014) of the countries we analyzed. The model is described here:
Model: ri = α0 + α1 Ici + α2 Idi + α3 Iui + α4 Igi + α5 Di + α6 Idi + α7 Iei + ui
Where:
ri = average economic growth rate during the period 2007–2014 of country i, where i =1, …, 39
Ici = relative efficiency index in creation of the NIS of country i;
Idi = relative efficiency index in diffusion of the NIS of country i;
Iui = relative efficiency index in utilization of country i;
Igi = relative efficiency index of the general model of country i;
Di = dummy variable, with value 1 if country i has a high per capita GDP and 0 if it does not;
Idi = index of coefficient of dependency of country i;
Iei = institutional efficiency index of country i;
αj = parameters to be estimated by OLS, where j = 0, …,7;
ui = errors in distribution N (0, 1).
Relative efficiency indices take values between 0 and 1. The values of the independent control variable coefficient of dependency is defined as the number of patent applications by foreign nationals divided by the number of patent applications by nationals (SEP-Conacyt 2000: 97) and the index of institutional efficiency is on a scale of 1 to 7. As shown in Table 8.3, the results of the OLS model of NIS efficiency indices in 2007 show two significant regression coefficients of the variables corresponding to the efficiency indices.Footnote 11 These were the coefficients corresponding to the diffusion and the general models indices. The values of the regression coefficients are elasticities; they point out the percentage increase in the dependent variable (growth rate) when the independent variable (efficiency index of the model) increases by 1 percent. For 2007, (1) the coefficient of the diffusion model index means that a one percent increase in the index would decrease the long run growth rate in 0.3 percent, (2) the coefficient of the general model index means that a one percent increase in that index would increase the long-run growth rate by 0.04 percent, and (3) the coefficient of institutions’ efficiency index, a control variable, has a negative effect on the growth rate.
Table 8.3 OECD and BRICS countries: growth rate as function of relative efficiency indices and institutional variables by robust OLS, 2007 and 2014
| Variable | 2007 | 2014 | ||||||
|---|---|---|---|---|---|---|---|---|
| Coeff. | Robust Std. Err. | t | Coeff. | Robust Std. Err. | t | |||
| Creation model | −0.01 | 0.02 | −0.57 | 0.00 | 0.01 | 0.33 | ||
| Diffusion model | −0.30 | ** | 0.17 | −1.80 | −0.45 | ** | 0.25 | −1.81 |
| Utilization model | 0.08 | 0.09 | 0.83 | 0.04 | 0.18 | 0.22 | ||
| General model | 0.17 | * | 0.05 | 3.52 | 0.14 | *** | 0.06 | 2.56 |
| Low GDP per capita | 0.44 | 0.81 | 0.55 | 0.44 | 0.63 | 0.69 | ||
| Dependency coefficient | 0.09 | 0.07 | 1.28 | 0.18 | *** | 0.08 | 2.30 | |
| Institutions Efficiency index | −1.00 | *** | 0.47 | −2.15 | −0.75 | 0.50 | −1.50 | |
| Constant | 12.85 | 20.82 | 0.62 | 31.47 | 27.22 | 1.16 | ||
| N | 39 | 39 | ||||||
| R2 | 0.505 | 0.488 | ||||||
Own estimations
* Level of significance at 99%; ** Level of significance at 95%; *** Level of significance al 90%
For the year 2014, the results also show two significant regression coefficients for the efficiency index variables, for those of the general and diffusion models. Thus, (1) the coefficient for the diffusion model index variable indicates that a 1 percent increase in this index decreases the long-term growth rate by 0.45 percent; (2) the coefficient of the general model index shows that a 1 percent increase in the efficiency index of this model would increase the long-term growth rate by 0.14%; and (3) it is noteworthy that the coefficient of dependency has a positive impact on the long-term growth rate of the countries we analyzed.
We have two important results. The unexpected one is the negative relationship between the efficiency index of the diffusion model and the long-term rate of economic growth. In theory, any kind of allocative efficiency should result in a higher rate of economic growth; i.e. efficiency and economic growth seem to go hand-in-hand. In particular, one can expect that an increase in the diffusion of new ideas and technologies should result in higher economic growth. Our results, however, indicate that such is not always the case. We asked whether the relationship between efficiency and economic growth was the same for all countries independently of their GDP and rate of economic growth. The result we expected was a positive relationship between the efficiency index of the general model and the rate of economic growth. Looking for a reasonable explanation for our unexpected result, we divided the countries we analyzed into two groups: countries with an economic growth rate under the mean long-term economic growth rate of the thirty-nine countries we studied and countries with an economic growth rate above that mean long-term economic growth rate. Then, we applied an Ordered Probit model to the aforementioned variables.
8.5 NIS Efficiency Indices and Growth Rates: Application of an Ordered Probit Model
In order to conduct correlation analysis of efficiency indices with long-term economic growth rates, we applied an Ordered Probit model to data from 2007 and 2014. The regression equation is the same as that of the OLS model, but now the dependent variable, yj, is redefined and takes two possible values (see Table 8.3).
yj = High, if a country’s economic growth rate is greater than the average economic growth rate of the thirty-nine countries we analyzed.
yj = Low, if a country’s economic growth rate is lower than the average economic growth rate of the thirty-nine countries we analyzed.
The econometric results of the general OProbit model do not allow for the interpretation of the regression coefficients and their sign. We estimated the marginal effects of independent variables on the dependent variable, as they are usually analyzed in applied econometric studies. In other words, in these models, the marginal values vary with the value of the independent variables. It is useful to calculate the marginal effects in order to interpret the results of the model (Reference GreenGreen 2000: 812–817).
We grouped the countries’ economic growth rates into two categories, one consisting of countries with high economic growth rates equal to or above the average (seventeen countries in 2007 and twenty countries in 2014). The other category we created consists of countries with below average economic growth rates (twenty-two countries in 2007 and nineteen countries in 2014). The results are shown in Table 8.4. As we have mentioned, the coefficients of a nonlinear model usually do not measure the marginal effects of independent variables on the dependent variable. Therefore, we proceed to commenting on the results of the marginal effects of the variables on the categories in which the dependent variable was divided.
Marginal effects by Ordered Probit categories, 2007 and 2014
| Variable | 2007 | 2014 | ||||
|---|---|---|---|---|---|---|
| dy/dx | Standard error | z | dy/dx | Standard error | z | |
| Low rate probability | 0.5103 | 0.199 | ||||
| Creation model | −0.002 | 0.00494 | −0.31 | −0.010** | 0.00476 | −2.00 |
| Diffusion model | 0.015 | 0.02970 | 0.51 | 0.212* | 0.08083 | 2.63 |
| Utilization model | −0.087 | 0.05692 | −1.52 | −0.278* | 0.09908 | −2.80 |
| General model | −0.017 | 0.01548 | −1.12 | −0.038** | 0.01760 | −2.15 |
| Low GDP per capita | −0.483** | 0.20073 | −2.41 | −0.774* | 0.23976 | −3.23 |
| Dependency coefficient | −0.140* | 0.04705 | −2.97 | −0.281* | 0.07596 | −3.69 |
| Institutions Efficiency | 0.140 | 0.21480 | 0.65 | 0.039 | 0.25527 | 0.15 |
| High rate probability | 0.4897 | 0.801 | ||||
|---|---|---|---|---|---|---|
| Creation model | 0.002 | 0.00494 | 0.31 | 0.010** | 0.00476 | 2.00 |
| Diffusion model | −0.015 | 0.02970 | −0.51 | −0.212* | 0.08078 | −2.63 |
| Utilization model | 0.087 | 0.05692 | 1.52 | 0.278* | 0.09913 | 2.80 |
| General model | 0.017 | 0.01548 | 1.12 | 0.038** | 0.01760 | 2.15 |
| Low GDP per capita | 0.483** | 0.20073 | 2.41 | 0.774* | 0.23976 | 3.23 |
| Dependency coefficient | 0.140* | 0.04705 | 2.97 | 0.281* | 0.07596 | 3.69 |
| Institutions Efficiency | −0.140 | 0.21480 | −0.65 | −0.039 | 0.25527 | −0.15 |
Own estimations
* Level of significance at 99%; ** Level of significance at 95%
In Table 8.4, the first row of results presents the probability of a country’s economic growth rate falling into each of the categories in which the dependent variable was divided. In 2007, the probability of a country’s economic growth rate being low was 51 percent and there was a 49 percent probability of a country’s economic growth rate being high in 2014, these figures were 20 percent and 80 percent, respectively. The coefficient that measures a marginal effect (dy/dx) is read as the effect a marginal or unitary change of the independent variable (dx) has on the probability of a country’s economic growth rate falling in a given category.
Table 8.4 shows the same econometric results for both categories of countries with low and high economic growth rates, although their coefficients have opposite signs. There are some differences in the results of the OLS and the OProbit models, and some of the efficiency indices seem to have a significant effect on the probability of a country’s economic growth rate falling in any of the categories.Footnote 12 Thus, in the results for 2007 for the category of countries with low economic growth rates, the coefficients with marginal effects show: (1) that the efficiency index variables of all models did not have statistically significant coefficients. (2) The coefficients of the control variables indicate, first, that a low per capita GDP lowers a country’s probability of having a low long-term economic growth rate by 0.48 percent; second, a 1 percent increase in a country’s dependency rate lowers the country’s probability of having a low long-term economic growth rate by 0.14 percent.
In 2007, in the category of countries with high economic growth rates, the regression coefficients showed the same effects, but with the opposite signs. Thus, (1) the efficiency index variables of all models did not have statistically significant coefficients and, (2) we found that a low per capita GDP increases a country’s probability of having a high long-term economic growth rate by 0.48 percent, while a 1 percent increase in a country’s dependency rate increases the country’s probability of having a high long-term economic growth rate by 0.14 percent.
In 2014, in the category of countries with low economic growth rates, the coefficients of the marginal effects show: (1) that a 1 percent increase in the relative efficiency index of a country’s creation model lowers the probability of that country having a low long-term economic growth rate by .01 percent; (2) that a one-percent increase in the relative efficiency index of a country’s diffusion model increases that country’s probability of having a low long-term economic growth rate by 0.21 percent; (3) that a 1 percent increase in the relative efficiency index of a country’s utilization model lowers that country’s probability of having a low long-term economic growth rate by 0.28 percent; (4) that a 1 percent increase in the relative efficiency index of a country’s general model lowers that country’s probability of having a low long-term economic growth rate by 0.04 percent; (5) the coefficients of the control variables indicate, first, that a low per capita GDP lowers a country’s probability of having a low long-term economic growth rate by 0.77 percent, and second, that a 1 percent increase in a country’s dependency coefficient lowers the country’s probability of having a low long-term economic growth rate by 0.28 percent.
In 2014, in the category of countries with high economic growth rates, the regression coefficients show the same effects but with opposite signs. Thus, (1) a 1 percent increase in the relative efficiency index of a country’s creation model would increase that country’s probability of having a high long-term economic growth rate by 0.1 percent; (2) a 1 percent increase in the relative efficiency index of a country’s diffusion model would lower that country’s probability of having a high long-term economic growth rate by 0.21 percent; (3) a 1 percent increase in the relative efficiency index of a country’s utilization model would increase a country’s probability of having a high long-term economic growth rate by 0.28 percent; (4) a 1 percent increase in the relative efficiency index of a country’s general model would increase that country’s probability of having a high long-term economic growth rate by 0.04 percent; (5) the coefficients of the control variables indicate, first, that a high per capita GDP increases a country’s probability of having a high long-term economic growth rate by 0.77 percent, and second, a 1 percent increase in a country’s dependency coefficient increases the probability of the country having a high long-term economic growth rate by 0.28 percent. The opposite signs between the models’ coefficients of relative efficiency indices, for example, of diffusion and utilization in 2014, show the presence of a trade-off or substitution between the two indices, moving along a line of equiprobability of being a country with a low or high long-term economic growth rate (see Reference Van Praag, Bruni and Portavan Praag 2005: 215–216).
8.6 Conclusions
We found some differences and similarities in efforts among OECD and BRICS countries to develop, diffuse, and use new scientific and technological knowledge. Some countries have invested more in inputs that had yielded good outputs (results). But, the innovation leaders and main followers have not necessarily achieved higher relative efficiency in the main objectives of NIS: creation, diffusion, and utilization. In the creation relative efficiency indices, gaps among countries are evident. Few countries are leading the technological innovations, although more countries are getting good results at arriving at new scientific findings. Some emerging countries like Chile and India in 2007 and Chile, China, and India in 2014 reached the highest relative efficiency (an index of 1) in NIS creation, joining developed countries like Japan, South Korea, and Switzerland, but not the known leaders in building technological and innovation capabilities, such as Germany, the United States, and other European countries.
Developed countries have traditionally invested substantial resources in building human and institutional capabilities and the physical infrastructure supporting the process of disseminating innovation. These investments are the reason behind important gaps among the inputs and outputs of developed countries, the BRICS, and Eastern European countries of the OECD included in the DEA models we applied. However, our analysis showed a small gap in the NIS relative efficiency indices in diffusion and utilization among developed and less developed countries. This result might be explained by the globalization of the mechanisms of technology and knowledge diffusion. The gaps of the general relative efficiency indices between the NIS of the countries that we studied were a kind of synthesis of the relative efficiency indices of the partial objectives of such NIS.
Some NIS were relatively efficient in relation to some objectives but inefficient in relation to others. In spite of significant gaps in relative efficiency indices, we found that some emerging countries (India, China, and South Africa, for example) had relative efficiency in their NIS in some objectives, such as diffusion and utilization, similar to that of developed countries. Eastern European and BRICS countries must learn from the quantitative and qualitative private and public policies of developed countries, not only to accede to the scientific and technological frontier, but also to have economic growth and progress for the wellbeing of their population.
The econometric results we discussed in this study must be taken cautiously because they are dependent on the quality of the information used to estimate relative efficiency indices. However, we found some noteworthy trends. First, the efficiency index variable of the general model behaved independently of its three components or parts (relative efficiency index of models of creation, diffusion, and utilization), as was shown by our multicollinearity test among these variables. This fact reminds us of Aristotle´s principle: The whole is more than the sum of its parts. Second, the efficiency indices of the diffusion model seemed to be negatively correlated with the rate of economic growth, especially in countries with high economic growth rates. More research on this result or topic is needed to support or reject this preliminary conclusion. Third, the regression coefficient of the efficiency index variable of the utilization model was consistently higher than the coefficients of the other efficiency index variables; this result suggests that improvements in this efficiency index would positively affect the long-term economic growth rate more than similar improvements in any other efficiency variable. This fact unquestionably underscores the need for further research on this topic.
9.1 Introduction
Manufacturing export-led growth has been regarded as the hallmark of the so-called Asian tigers, namely, South Korea, Singapore, Hong Kong, and Taiwan. Since the 1960s, resource-poor countries have outperformed resource-rich countries by a considerable margin (Reference AutyAuty 2001: 840). Reference FosuFosu (1990)found that developing countries specializing in manufacturing achieved higher economic growth than those specializing in exporting primary goods (minerals). The World Bank (1993) report on the East Asian miracle de facto established manufacturing export-led growth as the standard growth prescription for developing countries. Reference Razmi and BleckerRazmi and Blecker (2008) stated that developing countries have significantly increased both their export orientation and the proportion of their exports in manufactured goods in the past two decades.
More recently, Reference SetterfieldSetterfield (2010) argued that the export-led growth model is not a panacea for all developing nations, especially if they are driven by prolonged currency undervaluation, relative to competing developing countries. Some studies note the possibility of natural resource-based growth (Reference Sachs and WarnerSachs and Warner 1999; Reference AutyAuty 2001; Reference De Ferranti, Perry, Lederman and MaloneyDe Ferranti et al. 2002). Reference De Ferranti, Perry, Lederman and MaloneyDe Ferranti et al. (2002) paid attention to the fact that several advanced economies, such as Canada, Australia, Sweden, and Finland, showed that relying on natural resources for growth can be a pathway to possible diversification and upgrade into other sectors at a later stage. Although this path of natural resource-based growth has been highlighted as a possibility for Latin American (LA) countries, others have warned that resource abundance may also hurt growth (Reference Leite and WeidmannLeite and Weidmann 1999; Reference GylfasonGylfason 2002; Reference Blum and LeamerBlum and Leamer 2004). Recently, many LA countries showed a decline in growth despite remaining rich in natural resources; many countries in Africa face the same phenomenon.
This chapter scrutinizes the effect of currency undervaluation or overvaluation in this growth-path debate. The development literature includes important debates regarding the effect of exchange rate undervaluation (depreciation) on growth. Some argue that undervaluation positively affects growth (especially in developing economies), but others contend that undervaluation negatively affects growth in the long run. Reference RodrikRodrik (2008; Reference Rodrik, Elmendorf, Mankiw and Summers2009) found that currency undervaluation stimulates economic growth and export expansion, particularly in developing countries.Footnote 1 Tradable sectors in developing countries tend to be smaller because they suffer from institutional weaknesses and market failures more than nontradable sectors (Reference Rodrik, Elmendorf, Mankiw and SummersRodrik 2009). By enhancing the sector’s profitability in such a situation, undervaluation works as a second best policy that compensates for the negative effects of these distortions. High profitability promotes investment in tradable sectors, which subsequently expand and promote economic growth. Reference SetterfieldSetterfield (2010) asserted that developing countries obtain significant growth benefits by maintaining low value of their currencies relative to competing developing countries. Reference Yeyati and SturzeneggerYeyati and Sturzenegger (2007) claimed that undervalued currencies boost output and productivity growth. Reference Korinek and ServénKorinek and Servén (2010) also asserted that currency undervaluation can raise growth through learning-by-doing externalities in tradable sectors.
Nevertheless, the undervaluation-growth argument is criticized, that is, undervaluation will hurt economic growth (Reference Aguirre and CalderonAguirre and Calderon 2005; Reference WilliamsonWilliamson 2012).Footnote 2 Reference Eichengreen, Park and ShinEichengreen et al. (2012) argued that undervaluation is detrimental and slows down growth because an undervalued currency provides a disincentive to move up the technology ladder. Reference Aguirre and CalderonAguirre and Calderon (2005) explained that although small or moderate undervaluation enhances growth, large undervaluation hurts growth. Reference Haddad and PancaroHaddad and Pancaro (2010) claimed that undervaluation causes high and destabilizing liquidity growth and inflation, which lead to financial instability; undervaluation works only for low-income countries in the medium term. Reference PettingerPettinger (2011) specified that a falling currency value can be beneficial if the economy is uncompetitive and stuck in recession. Therefore, whether undervaluation is beneficial or harmful to growth remains debatable.
Given this background, this chapter delves deeply into the effects of undervaluation on growth. We identify one primary reason for this undervaluation debate within different industrial structures in different countries. Some countries exhibit manufacturing industry-based growth and others feature natural resource-based growth. If currency is more undervalued (for mineral exports) for countries highly dependent on natural resource exports, like many LA and African countries, then they earn lower income in terms of dollars. Natural resource exports are also insensitive to exchange rate valuation. Long-term currency undervaluation may not support economic growth.
We hypothesize that currency undervaluation differently affects the two groups of countries (mineral-exporting vs. manufacture-exporting countries). The empirical analysis of this currency valuation–growth linkage considers data from 1986 to 2012. Cross-sectional panel analysis is performed using five-year intervals. We tested two different samples, manufacturing-exporting countries versus mineral-exporting countries.Footnote 3 Apart from pooled OLS, panel fixed effect, and random effect estimations, we control for endogeneity using system GMM models. The estimation results suggest that currency overvaluation is good for mineral-exporting countries, whereas currency undervaluation may be good for manufacturing-exporting countries. This finding underscores the dilemma of resource-rich countries with the long-term goal of diversification into manufacturing. Given that manufacturing exports often requires currency undervaluation, this undervaluation sequentially undermines growth through its negative effect on dollar-based earnings from natural resource exports.
This paper is organized as follows. Section 9.2 discusses the literature and provides a theoretical background for empirical analysis in the following section. Section 9.3 discusses the data, regression models, and methodology. Section 9.4 presents and interprets the regression results. Finally, Section 9.5 summarizes the paper with concluding remarks.
9.2 Resource Abundance, Growth Performance, and Currency Valuation
Natural resources account for 20 percent of world trade and dominate the exports of many countries. Natural resource exports or mineral exports and growth are highlighted topics in economic history.Footnote 4 Many scholars argue that, on one hand, natural resource exports create a growth boom. On the other hand, natural resource abundance hurts growth. Reference De Ferranti, Perry, Lederman and MaloneyDe Ferranti et al. (2002) cited the history of successful natural resource-abundant countries, such as Canada, Australia, Sweden, and Finland.Footnote 5 According to the standard economic theory, the wealth effects associated with natural resources should lead to increased investment and economic growth in the long run.
Some countries in the Global South (e.g. United Arab Emirates, Malaysia, and Botswana) have managed to harness the power of natural resources and maintain both strong investment and above-average growth rates. The economic history of Latin America also shows boom periods in natural resource exports leading to growth. In Bolivia, revenue from natural resource exports rose from 11 percent of GDP to 23 percent of GDP over a nine-year period, that is, between 1975 and 1984. In Ecuador, primary exports revenue rose by 19 percent of GDP in only two years (between 1972 and 1974). In Mexico, revenue from oil exports increased by 6 percent of GDP between 1978 and 1983 (Reference Sachs and WarnerSachs and Warner 1999).
By contrast, another strand of literature argues that natural resource abundance is a curse for the economy, with Reference Blum and LeamerBlum and Leamer (2004) asserting that natural resource abundance is a curse rather than a blessing. In addition, Reference GylfasonGylfason (2001) stated that natural resource abundance may hurt growth by harming trade. Reference Leite and WeidmannLeite and Weidmann (1999) suggested that capital-intensive sectors involving natural resources are a major source of corruption. Reference PaldamPaldam (1997) explained that natural resource abundance is, as a rule, accompanied by booms and busts. Reference Sachs and WarnerSachs and Warner (1997) found in their analysis that economies with a high ratio of natural resource exports to GDP in 1970 tended to grow gradually during the subsequent twenty-year period.
Reference GylfasonGylfason (2001) explained that natural resources bring risks; too many people become restricted to low-skill and intensive natural resource-based industries. He also found evidence that nations with abundant natural capital tend to have more corruption and less trade and foreign investment, education, and domestic investment than other nations. Reference Leite and WeidmannLeite and Weidmann (1999) discussed the direct and indirect effects of natural resources. The Dutch Disease is a direct effect, whereby large discoveries of natural gas has led to a recession in the Netherlands since the 1960s. Indirect effects include those on rent-seeking activities and institution building. Reference Poelhekke and Van der PloegPoelhekke and van der Ploeg (2009) also analyzed the direct effect of natural resource abundance on economic growth and its indirect effects through volatility of unanticipated output growth. They found that the direct effect can be positive, but can be swamped by the negative effect resulting from volatility.
Many countries with a high level of mineral-export share show a growth decline in the long run. Most mineral-exporting countries are struggling with declining economic and export growth, as is the case of many LA countries. Over the last few decades, the economy of Latin America has shown significant economic decline. Figure 9.1 shows the decreasing trend of GDP and export growth in LA and Caribbean countries in the long run. Export growth has been significantly declining since 1995, which is in contrast to the positive performance in other emerging countries.

Figure 9.1 Economic performance of Latin American and Caribbean countries
Table 9.1 lists the twenty countries with the highest mineral-export contributions as a percentage of total merchandise exports in the selected years. Over time, many of the low-income countries have become increasingly reliant on export revenues from minerals as their main source of foreign exchange earnings. Many of these countries have low Human Development Index (HDI) scores, drawing attention to the potential for earnings from the mining sector to contribute to poverty reduction. In particular, in Chile, Ghana, and Brazil mining businesses contribute to poverty reduction and improve social development indicators more than nonmining ones (International Council on Mining and Metals or ICMM 2012). The ICMM suggests that the mining sector’s contribution is important for sustaining development, especially in developing countries (ICMM 2012). According to the ICMM report in 2012, the nominal value of world mineral production was nearly four times higher than it was in 2002, which implied more earnings from the same amount of production. If this is the case, then currency overvaluation would also result in bigger earnings in terms of local currency and would thus be beneficial for economic growth.
Table 9.1 Reliance on export of metallic minerals
| Rank by country (2010) | Mineral export contribution as % of total merchandise exports in 1996 | Mineral export contribution as % of total merchandise exports in 2005 | Mineral export contribution as % of total merchandise exports in 2010 |
|---|---|---|---|
| 1 Botswana | 58.70% | 86.50% | 83.70% |
| 2 Zambia | 79.40% | 64.00% | 83.60% |
| 3 Dem. Rep. of the Congo | 72.40% | 70.20% | 78.30% |
| 4 Mongolia | 60.30% | 70.10% | 77.60% |
| 5 Surinam | 68.00% | 64.30% | 75.40% |
| 6 French Polynesia | 69.20% | 55.30% | 67.10% |
| 7 Chile | 47.70% | 56.50% | 65.90% |
| 8 Guinea | 77.10% | 84.00% | 65.20% |
| 9 Peru | 48.30% | 57.90% | 62.70% |
| 10 Mauritania | 36.10% | 49.30% | 60.40% |
| 11 Northern Mariana Islands | 3.30% | 4.50% | 58.90% |
| 12 Mozambique | 6.10% | 66.90% | 57.00% |
| 13 Mali | 8.50% | 37.20% | 54.80% |
| 14 Sierra Leone | 30.60% | 58.20% | 54.30% |
| 15 Papua New Guinea | 24.50% | 39.20% | 54.00% |
| 16 Namibia | 36.20% | 41.20% | 53.40% |
| 17 Nauru | 73.10% | 25.20% | 50.80% |
| 18 Armenia | 23.90% | 39.80% | 50.60% |
| 19 Jamaica | 49.70% | 68.50% | 49.60% |
| 20 Cuba | 15.10% | 39.20% | 47.70% |
Given this contributing effect of natural resource exports, examining the effect of currency undervaluation or overvaluation on mineral exports is important. UNCTAD (2005) indicated that the real exchange rate reflects the underlying relative movement of prices at home and abroad. Generally, currency undervaluation, depreciation, or devaluation increases the competitiveness of exports and makes imports more expensive. Currency overvaluation or appreciation makes imports cheaper and exports more expensive.
In this regard, currencies in most mineral-exporting countries have been undervalued rather than overvalued. Figure 9.2 illustrates the situation in several countries (i.e. Botswana, Guinea, Mauritania, Papua New Guinea, and Peru) with shares of mineral exports over 40 percent of total exports, indicating the increasing trend of their currency undervaluation. Figure 9.3 depicts some cases that show long-term growth decline resulting from increasing the level of undervaluation in the long run. Given this background, examining whether currency undervaluation is truly responsible for the declining growth in these mineral-exporting countries is meaningful.

Figure 9.2 Trend of undervaluation in selected mineral-exporting countries.
Notes: (1) Figures are in a five-year moving average; data period is from 1986–2012.
(2) When undervaluation exceeds zero, the currency is undervalued and vice versa.

Figure 9.3 Increasing the level of undervaluation and growth decline in the long term.
Notes: Figures are in a five-year moving average; data period is from 1986–2012.
9.3 Data and Methodology
9.3.1 Dataset and Samples
This analysis consists of two different samples: manufacturing-exporting countries and natural resource-exporting countries. The natural resource-exporting sample consists of only mineral-exporting countries (excluding giant oil exporters). We limit the manufacturing-export sample to countries where manufacturing exports constitute at least 70 percent of their total exports (in at least one of the two years 1999 and 2001). This percentage corresponds to an average of 68 percent over 1999–2003, as reported by UNCTAD (2005). The eighteen countries that fit this criterion are Bangladesh, China, the Dominican Republic, Hong Kong, India, Jamaica, South Korea, Malaysia, Mauritius, Mexico, Pakistan, the Philippines, Singapore, Sri Lanka, Taiwan, Thailand, Tunisia, and Turkey. Nepal also meets this criterion but is excluded because of its land size. Taiwan is also excluded from our list because of lack of data. We include Vietnam in our list.Footnote 6 For the mineral-exporting country sample, we consider twenty-two countries: Armenia, Botswana, Brazil, Burkina Faso, Chile, Congo (Dem. Repub.), Cuba, French Polynesia, Guinea, Jamaica, Lao PDR, Mali, Mauritania, Mongolia, Montenegro, Mozambique, Namibia, Papua New Guinea, Peru, Surinam, Tanzania, and Zambia. To select this sample, we consider those countries with more than 40 percent share of mineral exports within total exports in 2010. We select the mineral-exporting countries based on ICMM (2012) country ranks.
Except for undervaluation index data, all the other variable data were taken from World Bank–World Development Indicators online database. We refer to the same estimation methodology that Reference RodrikRodrik (2008) used to calculate his undervaluation index; his sample comprises a maximum of 184 countries, and the data period is from 1950 to 2004. We calculate the undervaluation index from 1986–2012 for these countries. Rodrik’s undervaluation index is the difference between the actual real exchange rate and the Balassa–Samuelson adjusted rate with the following formula:

where in
 is the predicted value.Footnote 7 UNDERVAL is comparable across countries over time. When UNDERVAL exceeds zero, this condition indicates that the currency is undervalued and vice versa.
Table 9.2 presents the descriptive statistics of the variables. Detailed explanations for the definitions of the variables and data sources are presented in Table 9A.1 of the Appendix.
Table 9.2 Descriptive statistics
| Mineral export sample | |||||
|---|---|---|---|---|---|
| Variable | Obs. | Mean | Std. Dev. | Min | Max |
| Undervaluation | 228 | 0.83 | 0.39 | −0.60 | 1.64 |
| GDP per capita growth | 252 | 2.64 | 3.17 | −10.48 | 13.17 |
| Log initial GDP per capita | 239 | 3.24 | .64 | 2.07 | 4.58 |
| Population growth | 258 | 1.66 | .97 | −1.90 | 5.28 |
| Human capital (school enrollment) | 186 | 64.10 | 32.87 | 1.36 | 99.94 |
| Gross capita formation (physical capital) | 246 | 23.89 | 7.63 | 5.90 | 62.10 |
| FDI (net inflow as % of GDP) | 207 | 3.93 | 7.09 | −21.95 | 48.58 |
| Mineral exporter dummy | 258 | 0.58 | 0.49 | 0 | 1 |
| Manufacturing exporter dummy | 258 | 0.42 | 0.49 | 1 | 0 |
9.3.2 Methodology
This study uses cross-country panel data using a five-year average from 1986–2012.Footnote 8 To overcome observation problems, we combine both samples into one sample by including regressions in either of two dummy variables, which correspond to mineral- or manufacturing-exporting countries. To ensure robustness of our results, estimations have been completed using pooled OLS, panel fixed effects, and random effects as well as system-generalized method-of-moments estimators (system GMM) to control for endogeneity issues.
We use the standard growth model specifications, consisting of typical control variables (Xit), a set of interest variables (Zit), and other controls (Oit), as follows:
where yit is GDP per capita growth rate in country i in year t, and eit is the error term. Xit variables include the (log) initial GDP per capita of a country i expressed in constant US dollars (ln_intgdp), population growth (popgrowth), human capital (H_cap) (school enrollment) measured by primary and secondary school enrollment, and gross capital formation (P_cap) as well as the variables of FDI net inflow as a percentage of GDP (FDIit). Then, our variables (Zit) of interest are undervaluation (Undervalit) as well as its interaction term with a mineral-exporting dummy or manufacturing-exporting dummy (Underval*Mineral_Dummyit) or (Underval*Manufact_Dummyit). Thus, we derive the following simple growth equation:


We begin with the pooled ordinary least square (POLS) estimation and move on to the panel estimation approach (Reference IslamIslam 1995) to control for omitted variable bias by estimating either fixed effect (FE) or random effect (RE) with the Hausman test. To further control possible endogeneity, a system GMM estimation developed by Reference Arellano and BoverArellano and Bover (1995) and Reference Blundell and BondBlundell and Bond (1998) is also applied. We use the following criteria to evaluate the system GMM estimation model specifications: the Hansen overidentification test and the test for second-order serial correlation (AR2) of the residuals in the first differenced equation. The AR2 test also provides additional verification of the specification of the model and the legitimacy of the instrumental variables in the difference equation. We attach the greatest reliability on the system GMM results for all estimation models.
9.4 Regression Results: Undervaluation to Economic Growth
The regression results of economic growth equation, with GDP per capita growth rate as the dependent variable, are shown in Table 9.3.
Table 9.3 Undervaluation on economic growth in mineral- vs manufacturing-exporting countries
| Five-year average panel data | ||||||
|---|---|---|---|---|---|---|
| Dep. variable: GDP per capita growth | POLS (1A) | RE (1B) | GMM (1C) | POLS (2A) | RE (2B) | GMM (2C) |
| Ln (initial GDP per capita) | −1.51** | −1.51** | −2.24*** | −1.51** | −1.51** | −2.24*** |
| (−2.14) | (−2.14) | (−3.47) | (−2.14) | (−2.14) | (−3.47) | |
| Population growth | −0.84*** | −0.84*** | −0.83*** | −0.84*** | −0.84*** | −0.83*** |
| (−2.65) | (−2.65) | (−2.92) | (−2.65) | (−2.65) | (−2.92) | |
| Human capital (school enrollment) | 0.03 | 0.03 | 0.04** | 0.03 | 0.03 | 0.04** |
| (1.41) | (1.41) | (1.96) | (1.41) | (1.41) | (1.96) | |
| Physical capital (gross capital formation) | 0.24*** | 0.24*** | 0.24*** | 0.24*** | 0.24*** | 0.24*** |
| (6.30) | (6.30) | (4.58) | (6.30) | (6.30) | (4.58) | |
| Undervaluation | −2.53** | −2.53** | −3.45** | 0.19 | 0.19 | 0.11 |
| (−2.07) | (−2.07) | (−2.23) | (0.16) | (0.16) | (0.13) | |
| Undervaluation* Mineral dummy | −2.73* | −2.73* | −3.56** | |||
| (−1.66) | (−1.66) | (−2.16) | ||||
| Undervaluation * Manufacturing dummy | 2.72* | 2.73* | 3.56** | |||
| (1.66) | (1.66) | (2.16) | ||||
| Manufacturing exporter dummy | −1.72 | −1.73 | −2.05 | |||
| (−1.12) | (−1.12) | (−1.28) | ||||
| Mineral exporter dummy | 1.73 | 1.73 | 2.05 | |||
| (1.12) | (1.12) | (1.28) | ||||
| FDI (% of GDP) | 0.07 | 0.07 | 0.07* | 0.07 | 0.07 | 0.07* |
| (1.60) | (1.60) | (1.80) | (1.60) | (1.60) | (1.80) | |
| Constant | 2.65 | 2.65 | 4.73** | .92 | .92 | 2.69 |
| (1.05) | (1.05) | (2.05) | (0.32) | (0.32) | (0.93) | |
| R² | 0.39 | 0.39 | 0.39 | 0.39 | ||
| AR2 | 0.404 | 0.404 | ||||
| Sargan test | 0.001 | 0.001 | ||||
| Number of Observations | 130 | 130 | 130 | 130 | 130 | 130 |
Note: The dependent variable is GDP per capita growth. Five-year average panel data from 1986–2012 were used.
Figures in brackets represent t and z ratios: *** Significant at 1%; ** significant at 5%; * significant at 10%
The coefficients of interaction term between undervaluation and either dummy of manufacturing- or mineral-exporting countries is significant, implying that the effect of undervaluation is significantly different between these two groups. The minus sign of this interaction term with a dummy of mineral-exporting countries suggests a possibly negative effect of undervaluation on economic growth, which is confirmed by reading the GMM estimation coefficient (−3.45) of the undervaluation variable in the equation with a dummy for manufacturing-exporting countries (model 1C in Table 9.3). The results are robust in all pooled OLS, random effect, and system GMM estimations. The results indicate that currency overvaluation may be good for economic growth in mineral-exporting countries.
By contrast, the coefficient of the interaction between undervaluation and manufacture-exporting countries is plus and significant, suggesting the possibility of positive effects on economic growth. However, the net effect of undervaluation for this group turns out to be insignificant, reading from the coefficient (0.11) of growth equation with a dummy for mineral-exporting countries (model 2C) in Table 9.3. This positive but insignificant effect is consistent with Reference Lee and RamanayakeLee and Ramanayake (2017), who found that undervaluation significantly affects growth in high-income countries but not in middle- or low-income countries. Their interpretation was that undervaluation only exerts significant effects in the presence of a strong manufacturing base at an adequate level of capabilities. Given the mixed nature of our manufacturing-exporting samples, that the overall effects are insignificant is expected. Managing exchange rates alone is not a solution for long-term growth in these countries; rather, they should develop technological capabilities (Reference Lee, Mathews, Cantwell and AmannLee and Mathews 2012).
Other control variables tend to show conventional effects. The variables of the initial GDP per capita and population growth show significant and negative effects on growth. Human capital is positive on growth but not that robust in the sense that only GMM results show positive and significant coefficients. The coefficient of physical capital formation remains positive and significant on growth for these two groups. The coefficient of FDI is positive and significant on growth, but not that robust as only the GMM model results in a significant coefficient.
9.5 Summary and Concluding Remarks
Although manufacturing export-led growth has been regarded as the standard growth model for developing countries since the success of the so-called Asian tigers, resource-based economic growth has also received attention, as the strong mineral prices in the 2000s supported an economic boom in many mineral-exporting countries. This study explores the possibly differential effects of currency undervaluation or overvaluation in these two different growth paths, that is, manufacturing- versus mineral-exporting economies. The regression results in this study confirm a negative effect of undervaluation on growth in mineral-exporting groups and positive (no significant) effects of undervaluation in manufacturing-exporting groups. This finding is consistent with the fact that if currency is more undervalued in countries that highly depend on natural resource exports, then they earn less income in terms of dollars and natural resource exports are insensitive to exchange rates.
Apart from the logic of this finding and interpretation, it also underscores a policy dilemma of resource-rich countries aiming to eventually diversify into manufacturing. While they also need undervaluation to promote manufacturing exports, such a policy stance has immediate negative effects on economic growth through its negative effect on dollar-based earnings from natural resource exports. Also, as observed in several mineral-exporting countries, local currency has often tended to be undervalued rather than overvalued, indicating the difficulty of economic growth, such that undervaluation is not by choice, but often related to weak economic growth and associated recurrent balance-of-payment crises that necessitate depreciation. Thus, an important contrast between manufacturing- versus mineral-exporting countries is that depreciation often tends to exert countercyclical effects of recovering exports and growth in economies with a strong manufacturing base (or nonnegative effects on average), which is not the case in mineral-exporting economies. These mineral-exporting economies face the growth-impeding and procyclical effects of undervaluation during times of weak performance of the economy with a typical balance-of-payment crisis. This growth-impeding and procyclical effect of undervaluation underscores the difficulties facing economic growth in mineral-exporting economies and thus the dilemma of the so-called resource-based development model. The situation is close to being a vicious cycle, and the means to stop the cycle remain unclear.


