
“In the long run, History is the story of information becoming aware of itself.”
Introduction
In the first part of this book, and particularly in Chapters 4–7, I have presented the basis of this book’s argument by presenting some of the salient characteristics of my approach, such as taking a long-term ex-ante perspective, learning from the past about the present for the future, using complex systems thinking, etc.
This chapter begins the presentation and discussion of the central theses of this book by drawing an outline of the long-term coevolution of human societies, focusing on the interaction between cognition, technology, social organization, and societies’ relation with the environment. It will be followed by six chapters that describe the dynamics involved at different spatiotemporal scales, and from different perspectives.
Two of the chapters in this middle section use the same perspective but elaborate it at different scales. The first of these, the current chapter, first outlines aspects of the very long-term coevolution of human cognition (from c. 2.5 MY BP to c. 0 CE) with its technology, societal organization, and environment. Chapter 15, which begins the third part of the book, is the continuation of this story, focusing on how the European world system emerged and evolved over the period from c. 1000 CE to the present. That chapter instantiates Wallerstein’s perspective on the “Modern World System,” (1974–1989) and emphasizes, at the European scale, the three major tipping points that have, each time, brought that system to the edge of disintegration, and the changes that, nevertheless, enabled it to continue its growth and evolution to encompass the global system of the present day.
Chapter 10 looks at eight centuries of socioenvironmental evolution in the western Netherlands in some detail and emphasizes the bootstrapping process that transformed the technology, the environment, the economics, the institutions, and the geography of that region. It sees that process in terms of the continued interaction between solutions and challenges. In that process, unanticipated consequences of earlier actions play a fundamental role.
In Chapter 9, I develop parts of a theoretical approach that enables me to consider these case studies as instances of transformations in the organization of information processing. This approach adopts Prigogine’s “dissipative flow structure” idea to explain how the interaction between flows of energy, matter, and information together structure more and more complex societies. In Chapter 11, that approach is then discussed on a more theoretical level by looking at information processing as a percolation phenomenon, in which the relationship between network activation and network size in terms of the average number of edges per node determine the main characteristics of the system.
Making information processing the explanatory core of my approach, and combining it with the Complex (Adaptive) Systems (CAS) perspective that emphasizes the need for the study of emergence, prompts me to look at inventions (Chapters 12 and 13) as shaped in the interaction between the material niche created by a technological system and the perception thereof by the agents in it. To conclude this middle section of the book, I then describe a model of the dynamic of transformations in the transition from village to town systems (Chapter 14).
Human Information Processing Is at the Core
The core of my argument is that societies are collective information-processing organizations, and that the evolution of human information processing is therefore at the center of the long-term evolution of human societies. Why have I chosen this approach, which is different from most other social science approaches to the long-term evolution of humanity (except for a few archaeologists such as Wright (Reference Wright1969) and Johnson (Reference Johnson, Renfrew, Rowlands and Segraves1982), and the economist Auerwald (Reference Auerswald2017)? The reason is that I am here looking for a general rather than a series of proximate explanations of changes in human behavior over long-term time. In other words, I am looking for a dynamic that can explain the emergence of human societal behavior under a wide range of circumstances, as well as explain how that behavior has changed.
It seems obvious that human responses to the environment, as well as human technology and human social and economic behavior are determined by human cognition and organization. (See Leroi-Gourhan’s fundamental treatment of these relationships: Reference Leroi-Gourhan1943, Reference Leroi-Gourhan1945, 1993). Our cognitive apparatus is the universal interface between each one of us and his/her environment, shaping how we perceive that environment and the nature of the actions we could potentially undertake. This apparatus is acquired through learning from an individual’s earliest days, and that learning is shaped by the sociocultural and natural environments in which it occurs. This in turn shapes the ways in which human beings behave. An individual uses the tools for thought and action he or she has acquired in order to ensure his or her survival, that is to ensure his or her continued subsistence and fulfill any other needs the individual might have. It is such use of tools for thought and action that I here call information processing – the gathering of information about an individual’s or group’s circumstances, and the organization and execution of actions appropriate to those circumstances.
But this is only part of the overall argument. Contemporary science is based on the assumption that there are three fundamental commodities in nature: matter, energy, and information. The first two of these are essential to the physical survival of individuals, whether human or nonhuman. Energy can be turned into matter and vice versa, and both are subject to what physicists call the law of conservation, which implies that they cannot be shared but can be transmitted. The person who hands over an object, or performs an energy-related task, is no longer in possession or control of the energy or matter that was used or handed over. Information and its processing determine how we acquire matter and energy, and what we do with it. But, contrary to the other two commodities, information can actually be shared: if I show someone how to do something, that does not mean that subsequently I no longer know how to do it. Tools for thought and action can be shared.
Taking the argument one step further, it is easy to see that human societies are dependent on the sharing of these tools for thought and action. The set of such tools that a group of people or a society share is what we commonly call their culture – their institutions, ways of doing things, knowledge about how to survive in different environments, artifacts, etc. Hence, human societies are collective information processing organizations.
The long-term evolution of human societies is therefore in the first instance the evolution of human information processing (or, as recently described by Auerswald (Reference Auerswald2017, 1) “the advancement of code”), and this chapter is meant to present the reader with a 3 million year overview of human history from that perspective, based on a series of papers I developed with Dwight Read (Reference Read2008, Reference Read, van der Leeuw, Renfrew and Malafouris2009, Reference Read, van der Leeuw, Coward, Hosfield and Wenban-Smith2015).
That history can be divided into two parts, the first of which is essentially biological (the growth of our brain and its cognitive capacity), whilst the second is essentially sociocultural (learning to exploit the full capacity of the evolved brain). Hence, this chapter is divided into two major sections, presenting respectively the biological evolution and the cultural evolution of cognition. The chapter concludes with a description of a simple model that can integrate the two.
It should be emphasized that each of these two sections is based on insights and knowledge from different disciplines and subdisciplines. The first part derives from arguments in evolutionary biology and evolutionary psychology, and therefore is based on an essentially life science epistemology and argument, and data deriving from ethology, paleoanthropology, and cognitive science. It attempts to reconstruct the evolution of the cognitive capabilities of the human species leading up to the present by comparing the capabilities of living primates, the fossil remains of – and the artifacts made by – hominins and modern humans at various stages of their development, and the physical and behavioral characteristics of modern human beings. This leads to a patchwork of data points and ideas that, in so far as it coherently holds together, finds its principal interest in the fact that it raises new questions and provides a basis for the arguments in the second part.
That second part, on the other hand, derives from arguments in archaeology and history, which are based on humanities – and social science epistemologies, and data and insights from archaeological, written historical, and modern observational sources. It attempts to outline the development of societal organization from small roaming gatherer-hunter-fisher bands, via villages, urban systems, and empires to the present-day global society, with a focus on the roles and forms that energy and information processing assume in that development. In combining these approaches, I am using the constraints and opportunities afforded by the bio-social nature of our species to explain observed phenomena in human history, and couching the explanation in systemic terms, which many archaeologists and most historians may initially have difficulty recognizing. My justification for doing this is the fact that most, if not all, transdisciplinary research must aim to constructively upset the practitioners of the disciplines involved in order to raise new questions and challenges for consideration by the communities practicing these disciplines as well as by others, and thus to stretch the envelope of our knowledge and insights. I hope that the direction in which I have attempted to stretch that envelope can make a contribution to the current sustainability debate.
The Biological Evolution of the Human Brain
The first part of the coevolution story concerns the physical development of the human brain and its capacity to deal with an increasing number of simultaneous information sources. The core concept that is most relevant here is the evolution of the short-term working memory (STWM), which determines how many different sources of information can be processed interactively in order to follow a particular train of thought or course of action.
There are different ways to reconstruct this evolution (Read & van der Leeuw Reference Read and van der Leeuw2008, Reference Read, van der Leeuw, Renfrew and Malafouris2009, Reference Read, van der Leeuw, Coward, Hosfield and Wenban-Smith2015). Indirectly, it can be interpolated by comparing the STWM of chimpanzees (our closest common ancestor in the evolutionary tree that produced modern humans) to that of modern human STWM. In the act of cracking a nut, 75 percent of chimpanzees are able to combine three elements (an anvil, a nut, and a hammerstone), which leads us to think that the STWM of chimpanzees is 3 ± 1 (because 25 percent of them never master cracking nuts). Experiments with different ways of calculating the human capacity to combine information sources, on the other hand, seem to point to an STWM of 7 ± 2 for modern humans. This difference coincides nicely with the fact that chimpanzees reach adolescence after three to four years and modern humans at age thirteen to fourteen. We therefore assume that the growth of STWM occurs before adolescence in both species, and that the difference in the age at which adolescence is reached explains the difference in STWM capacity (Figure 8.1, see Read & van der Leeuw Reference Read and van der Leeuw2008, 1960).
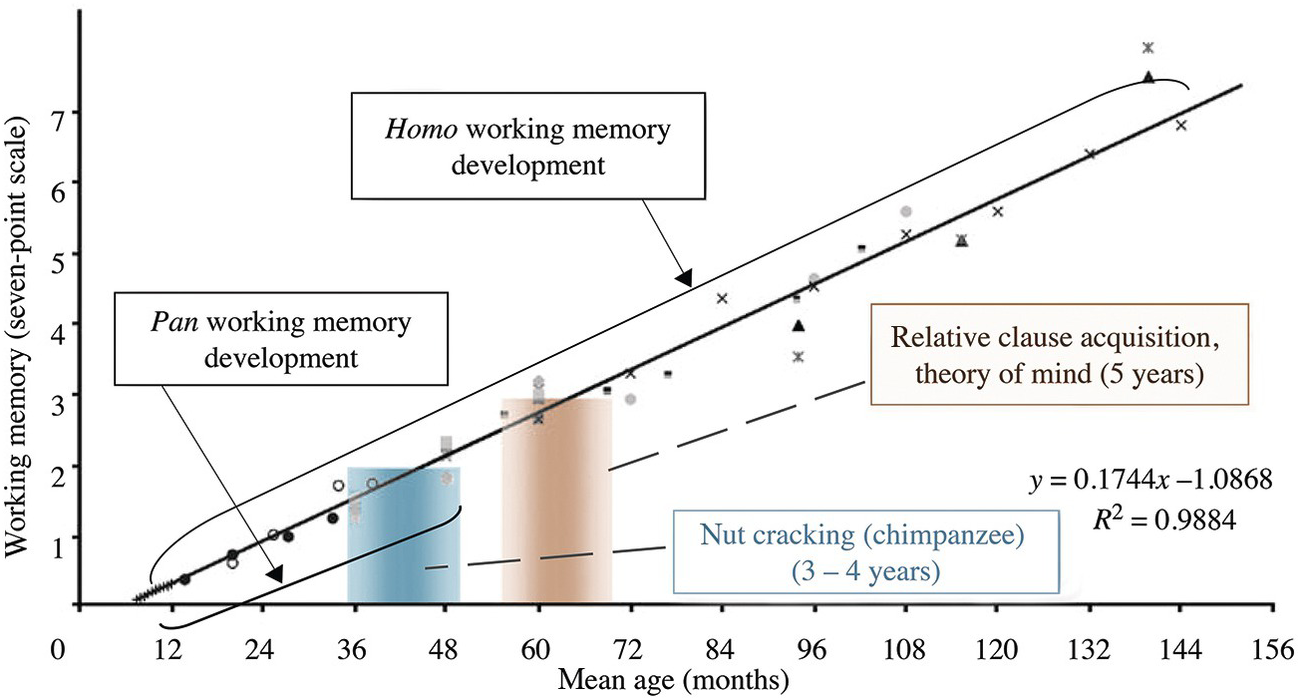
Figure 8.1 The relationship between cognitive capacity and infant growth in Pan and in Homo sapiens sapiens. The trend line is projected from the regression of time-delay response (Diamond and Doar, Reference Diamond and Doar1989) on infant age. Data are rescaled for each dataset to make the trend line pass through the mean of that dataset. Working memory scaled to STWM = 7 at 144 months. The “fuzzy” vertical bars compare the age of nut cracking among chimpanzees with the age for relative clause acquisition and theory of mind conceptualization in humans. [Data on STWM are here represented by the following symbols: • = Imitation (Alp Reference Alp1994); + = time delay (Diamond & Doar, Reference Diamond and Doar1989); □ = number recall (Siegel & Ryan Reference Siegel and Ryan1989); x = total language score (Johnson et al., Reference Johnson, Fabian and Pascual-Leone1989); x = relative clauses (Corrêa 1995; ■ = count label, span (Carlson et al., Reference Carlson, Moses and Breton2002); o = 6 month retest (Alp 1989); ▲ = world recall (Siegel & Ryan Reference Siegel and Ryan1989); ● = spatial recall (Kemps et al., Reference Kemps, De Rammelaere and Desmet2000); ♦ = relative clauses (Kidd & Bavin Reference Kidd and Bavin2002); -, spatial working memory (Luciana & Nelson Reference Luciana and Nelson1998); ––– = linear time delay (Diamond & Doar Reference Diamond and Doar1989)].
Another approach to corroborating the growth of STWM is by measuring encephalization – the evolution of the brain to body weight ratio of modern humans’ ancestors through time. The evolution of these ratios is based on the skeletal remains of each subspecies found and, as shown in Figure 8.2, corresponds nicely to the evolution of the STWM as has been established based on the way and extent to which these ancestors were able to shape stone tools (see Read & van der Leeuw Reference Read and van der Leeuw2008, 1964).
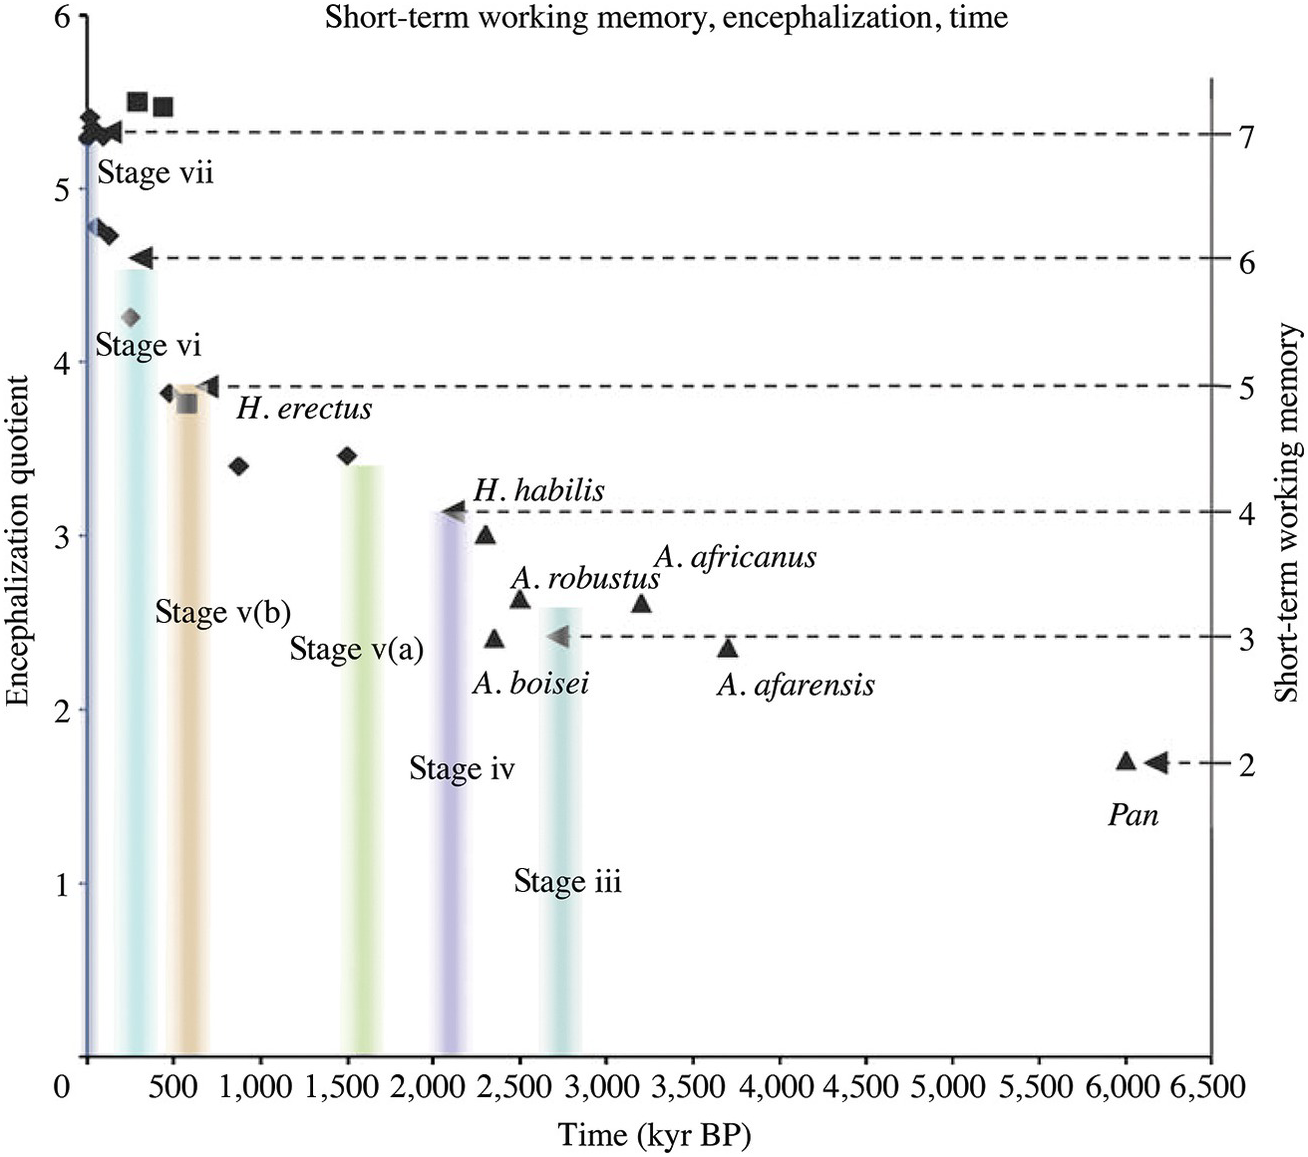
Figure 8.2 Graph of encephalization quotient (EQ) estimates based on hominid fossils and Pan (Chimpanzees). Early hominid fossils have been identified by taxon. Each data point is the mean for hominid fossils at that time period. Height of the “fuzzy” vertical bars is the hominid EQ corresponding to the data for the appearance of the stage represented by the fuzzy bar. Right vertical axis represents STWM.
Whereas both these approaches depend in fact on extrapolation and therefore do not provide any direct proof for our thesis, the study of the way and extent to which the various subspecies and variants preceding modern humans have been able to shape stone tools does provide some direct evidence, which is summarized in Table 8.1. This links the evolution of actions in stone toolmaking with the concepts that they define, the number of dimensions involved in manufacturing actions, and the STWM required, and refers to stone tools that provide examples of each stage. It shows how it took at least about 2 million years for the human STWM capacity of 7 ± 2 to develop, beginning with the Lokalalei artifacts and ending with the capacity to create blade tools.
Table 8.1 Evolution of stone tool manufacture from the earliest tools (stage 2, > 2,6 M. years ago; found in Lokalalei 1) to the complex blade technologies (stage 7, found in most parts of the world c. 50,000 BP). Columns 2–5 indicate the observations leading us to assume specific STWM capacities; Column 8 (bold) indicates the stage’s STWM capacity and column 9 the approximate age of the beginning of each stage. Column 10 refers to the relevant artifact categories documenting the stages. For a more extensive explanation, see Read & van der Leeuw Reference Read and van der Leeuw2008: 1961–1964).
| Stage | Concept | Action | Novelty | Dimensionality | Goal | Mode | STWM | Age BP | Example |
|---|---|---|---|---|---|---|---|---|---|
| 1 | Object attribute | Repetition possible | Functional attributes present; can be enhanced | 0 | Use object | 1 | |||
| 1A | Relationship between objects | Using more than one object to fulfill task | 0 | Combine objects | 2 | ||||
| 2 | Imposed attribute | Repetition possible | Object modified to fulfill task | 0 | Improve object | 2 | > 2.6 My | Lokalalei I | |
| 3 | Flaking | Repetition | Deliberate flaking without overall design | 0: incident angle < 90º | Shape flakes | 3 | 2.6 My | Lokalalei 2C | |
| 4 | Edge | Iteration: each flake controls the next | Debitage: flaking to create an edge on a core | 1: line of flakes creates partial boundary | Shape core | 1 | 4 | 2.0 My | Oldowan chopper |
| 5 | Closed curve | Iteration: each flake controls the next | Debitage: flaking to create an edge and a surface | 2: edges as generative elements of surfaces | Shape biface from edge | 2 | 4.5 | ||
| 5A | Surface | Iteration: each flake controls the next | Faconnage: flaking used to make a shape | 2: surfaces intended elements, organized in relation to one another | Shape bi-face from surfaces | 2 | 5 | 500 Ky | Biface handaxes |
| 6 | Surface | Algorithm: removal of a flake prepares the next | Control over location and angle to form surface | 2: Surface of flake brought under control, but shape constraint | Serial production of tools | 3 | 6 | 300 Ky | Levallois |
| 7 | Intersection of planes | Recursive application of algorithm | Prismatic blade technology: monotonous process | 3: flake removal retains core shape – no shape constraint | Serial production of tools | 4 | 7 | .50 Ky | Blade technologies |
Mastering the three-dimensional conceptualization of stone tools (see Figure 8.3 a–d) (Pigeot Reference Pigeot1991; van der Leeuw Reference van der Leeuw, Murray and Anderson2000) is a good example of how this worked. The first tools are essentially pebbles from which at one point of the circumference (generally where the pebble is pointed) a chip has been removed to create a sharper edge (Figure 8.3a). Removing the flake requires three pieces of information: the future tool from which the flake is removed, the hammerstone with which this is done, and the need to maintain the two at an angle of less than 90 degrees at the time of the blow. Here, we therefore have to do with proof of STWM 3. In the next stage, this action (flaking) is repeated along the edge of the pebble. That requires control over the above three variables and a fourth one: the succession of the blows in a line. STWM is therefore 4 (Figure 8.3b). Next, the edge is closed: the toolmaker goes all around the pebble until the last flake is adjacent to the first. By itself, this is not a complete new stage, and we have called this STWM 4.5. But once the closed loop is conceived as defining a surface the knapper has two options: to define a surface by knapping an edge around it and then taking off the center, or to do the reverse – take off the center first and then refine the edge. The conceptual reversibility shows that the knapper has now integrated five dimensions, and his or her STWM is 5 (Figure 8.3c). The next stage again develops sequentiality, but in a more complex way.
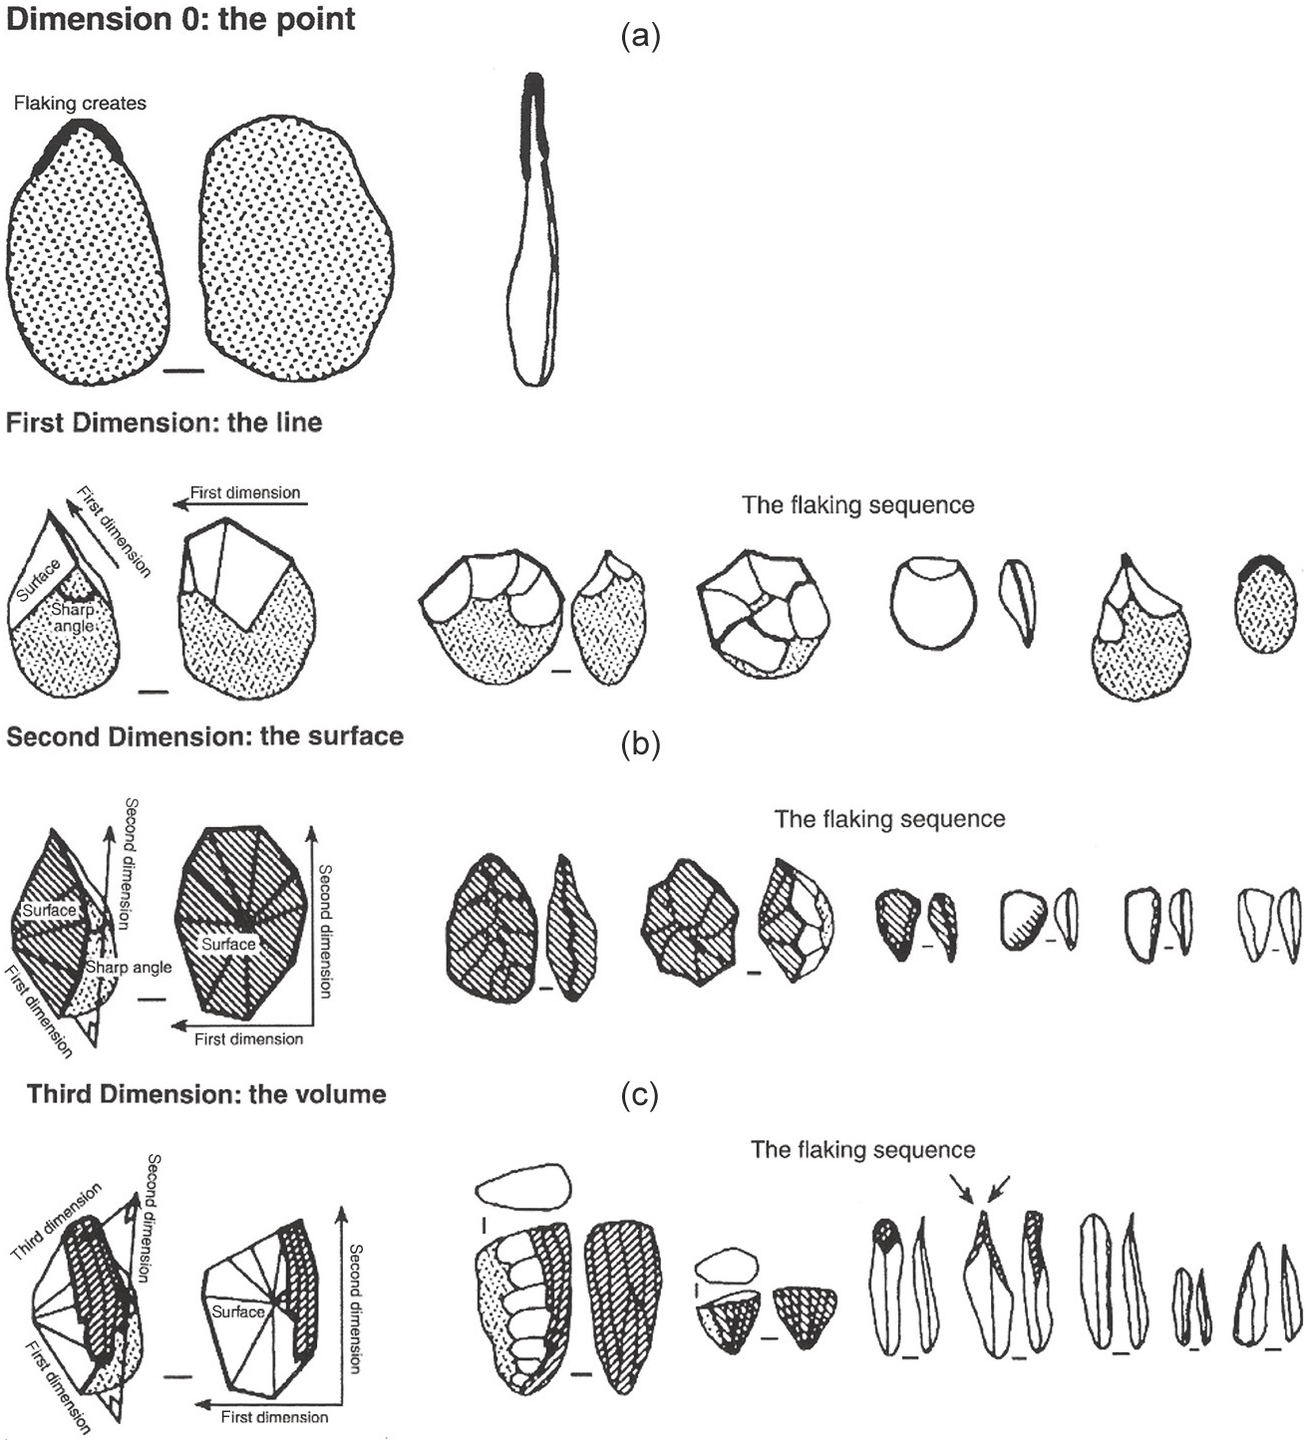
Figure 8.3 For humans to attain the capacity to conceive of a three-dimensional object (a pebble or stone tool) in three dimensions takes around 2 million years. (a) Taking a flake off at the tip of the pebble is an action in 0 dimensions, and takes STWM 3; (b) successively taking off several adjacent flakes creates a (one-dimensional) line, and requires STWM 4; (c) stretching the line until it meets itself, defines a surface by drawing a line around it represents STWM 4.5; distinguishing between that line and the surface it encloses implies fully working in two dimensions, and requires STWM 5; (c) preparing two sides in order to remove the flakes from the third side testifies to a three-dimensional conceptualization of the pebble, and requires STWM 7.
In the so-called Levallois technique, making one artifact serves at the same time as preparation for the next, by dividing the pebble conceptually in two parts along its edge (STWM 6). And finally, the knapper works completely in three dimensions, preparing two surfaces and then taking flakes off the third. At this stage, STWM 7 (Figure 8.3d), for the first time the knappers are able not only to work a three-dimensional piece of stone, but also to conceive it as three-dimensional and adapt their working techniques accordingly, greatly reducing loss and increasing efficiency.
Closely observing the tools and other traces of human existence available in the Upper Paleolithic (around 50,000 BP) indicates that, after some 2 million years, people could (van der Leeuw Reference van der Leeuw, Murray and Anderson2000):
Conceive of feedback, feedforward and reversal in time (e.g., reverse an observed causal sequence, in order to conclude from the result what kind of action could achieve it);
Remember and represent sequences of actions, including control loops, and conceive of such sequences that could be inserted as alternatives in manufacturing sequences;
Create basic hierarchies, such as point–line–surface–volume, or hierarchies of size or inclusion;
Conceive of partonomies: relationships between a whole and its constituent parts (including reversing these relationships);
Maintain complex sequences of actions in the mind, such as between different stages of a production process;
Represent an object in a reduced set of dimensions (e.g., life-like cave paintings).
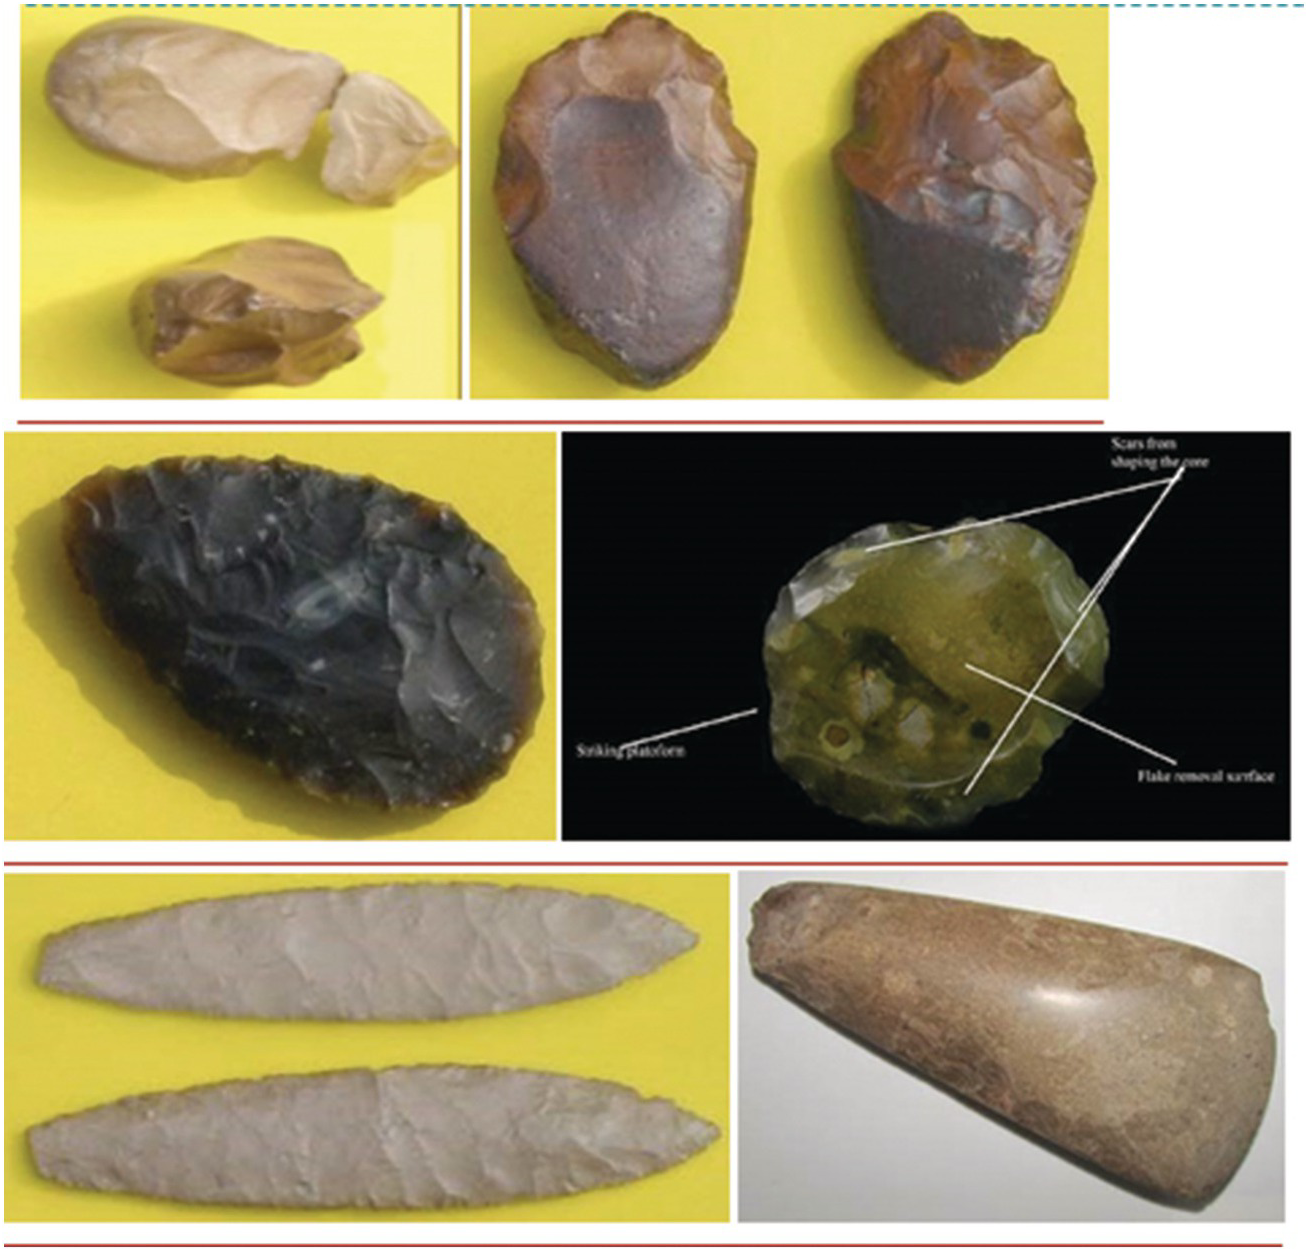
Figure 8.4 From left top to bottom, left to right, the image shows the technological advances in stone toolmaking, from an Oldowan chopper, via an Acheulean handaxe, a Mousterian handaxe, a Levallois tool, a Solutrean blade, to a Neolithic handaxe. The first four images refer to STWM stages below 7 ± 2, the last two have reached STWM 7 ± 2.
The Innovation Explosion: Mastering Matter and Learning How to Put the Brain to Use
After 50,000 BP,1 and especially after around 15,000 BP, we see a true innovation explosion occurring just about everywhere on Earth. The sheer multitude of inventions in every domain was truly astonishing, and has accelerated up to the present day. There is no reason to assume further developments of the human STWM, as the experimental evidence indicates that modern humans currently have the capacity to deal simultaneously with at most seven, eight, or occasionally nine dimensions or sources of information, while even a superficial scrutiny of modern technologies, languages, and other achievements shows the wide variety of things that can be achieved with a STWM of 7 ± 2. We would therefore argue that for this next phase, from about 50,000 BP to the present, the biological development of the mind no longer imposes any major constraints, and the emphasis is on acquiring the fullest possible range of techniques exploiting the STWM capacity available. This leads, among other things, to dramatic changes in the nature of the coevolution between human beings and their environments (e.g., Henshilwood & Marean Reference Henshilwood and Marean.2003; Hill et al. Reference Hill, Barton and Hurtado2009).
We can distinguish several phases in this process. In the first, the global toolkit explodes, but the gatherer-hunter-fisher mobile lifestyle remains the same. As part of the technological innovations emerging at the time, we see people moving into environments that were until then closed to them because they lacked the tools to survive there. At this time, for example, people began to move into higher latitudes with colder climates, into desert environments, etc., requiring completely novel technological and social adaptations. One way to explain this is to assume that people acted more and more collectively in solving various problems they were encountering, which would imply an increase in the importance, and the means, of communication as well as the pooling of some STWM capability.
In keeping with my fundamental tenet that information processing is crucial to such changes, I attribute the changes occurring from now on in human history to a new dynamic:
Problem-solving structures knowledge —> more knowledge increases the information processing capacity ––> that in turn allows the cognition of new problems ––> creates new knowledge —> knowledge creation involves more and more people ––> increases the size of the group involved and its degree of aggregation ––> creates more problems ––> increases need for problem-solving ––> problem-solving structures more knowledge … etc.
In that process, learning moved from the individual to the group because the dimensionality of the challenges to be met increased beyond the capability of individuals to deal with them. This involved the emergence of the above feedback loop (van der Leeuw Reference van der Leeuw, Costanza, Graumlich and Steffen2007).
As a result of these developments, about 35,000 years later, in what is called the Late Upper Paleolithic and Mesolithic in Europe, a number of other cognitive functions can be documented (van der Leeuw Reference van der Leeuw, Murray and Anderson2000). These include:
The use of completely new topologies (e.g., that of a solid around a void, such as in the case of a pot, hut, or basket).
The use of many new materials to make tools. Although it is difficult to prove that these materials were not used earlier, nevertheless one frequently observes from this time onwards objects in bone, as well as wood and other perishable materials.
The combination of different materials into one and the same tool (e.g., hafting small sharpened stone tools into a wooden or bone handle).
The inversion of manufacturing sequences from reductive to additive. In the former approach, which was current up to this time, making tools began with a big object such as a block of stone and smaller and smaller pieces were successively taken off it, so as to gain control over the shape. In the additive approach, tiny particles such as fibers are combined into larger, linear objects – threads – and then into a two-dimensional object (such as a woven cloth), which is finally given shape (by sewing) to fit a three-dimensional object (such as a human being). This implies the cognition of a wider range of scales, and has the advantage that corrections can take place during manufacture, which is much more difficult with reductive manufacturing sequences.
Stretching and chunking the sequence of actions kept in the mind: distinguishing between (complex) preparation stages (e.g., gathering of raw materials, preparing them, making roughouts, shaping, finishing) yet being able to link the logic of manufacture across these stages (adapting the selection of raw materials to all the later stages of the manufacturing process, etc.).
The resulting invention of new tools characterizes the period until about 13,000 BP (in East Asia) or 10,000 BP (in the Near East), while for the time being the dominant subsistence mode was still characterized by a multi-resource strategy of harvesting various foodstuffs in the environment, but now including a wider range facilitated by the new toolkit, and moving around over increasingly limited distances so as to always stay below the carrying capacity of the environment. In effect, people lacked the know-how to interact with their environment; they could only react to it. They did not invest in the environment (by means of activities such as building long-term shelter, clearing the forest and plowing the soil, or investing in a herd), and therefore, though everyone dealt daily with uncontrollable change, risk was not really important, as risk is incurred when effort or (human, natural, or financial) capital is expended by humans to achieve something, and that is then destroyed (see van der Leeuw Reference van der Leeuw, Murray and Anderson2000).
The First Villages, Agriculture and Herding
In the next stage, c. 13,000–10,000 BP, the continued innovation explosion changed the lifestyle of many human populations. The acceleration was so overwhelming that in a few thousand years it transformed the way of life of most humans on earth: rather than live in small groups that roamed around, people concentrated their activities in smaller territories, invented different subsistence strategies, and in some cases literally settled down in small villages (van der Leeuw, Reference van der Leeuw, Murray and Anderson2000, Reference van der Leeuw, Costanza, Graumlich and Steffen2007, and references therein). As the information-processing capacity of individual humans did not increase, I join many other colleagues in ascribing these developments to an ever-closer interaction between more and more people, generating a greater density of information-processing capacity by improving communication and collaboration. Together, these advances greatly increased the number of ways at people’s disposal to tackle the challenges posed by their environment. That rapidly increased our species’ capability to invent and innovate in many different domains, allowed it to meet more and more complex challenges in shorter and shorter timeframes, and thus substantively increased humans’ adaptive capacity. But the other side of the coin was that these solutions, by engaging more people in the manipulation of a material world that they now partly controlled, ultimately led to new, often unexpected, societal challenges that required the mobilization of great effort to be overcome in due time.
As part of this process, a number of fundamental changes occurred. First of all, the relationship between societies and their environments became reciprocal: the terrestrial environment from now on not only impacted on society, but society impacted on the terrestrial environment as well. As a result, sedentary societies tried to control environmental risk by intervening in the environment, notably by (1) narrowing and optimizing the range of their dependencies on the environment (by cultivating a single or a few crops), (2) simplifying or even homogenizing (parts of) their environments (by locally removing the natural diversity of the environment and replacing it by a single, or a few, species of plants), and (3) spatial and technical diversification and specialization (by allocating specific spaces to specific activities and developing specific tools for these activities) (see van der Leeuw Reference van der Leeuw, Murray and Anderson2000).
The new subsistence techniques introduced, including horticulture, agriculture and herding, narrowed the range of things people depended on for their subsistence. In the process, certain areas of the environment were cleared and dedicated to the specific purpose of growing certain kinds of plants. This required investment in certain parts of the environment, dedicating those areas to specific activities and delaying the rewards of the investment activities. Clearing the forest and sowing resulted only months later in a harvest, for example. The resulting increase of investment in the environment in turn anchored different communities more and more closely to the territory in which they chose to live. People now built permanent dwellings using the new topology (upside down containers), and devised many other new kinds of tools and toolmaking technologies facilitating the new subsistence strategies practicable in their environment (e.g., the digging stick or the ard, the domestication of animals, baskets and pottery for storage, skin bags or pottery and hot rocks for boiling). Without speaking of (full-time) specialists, certain people in a village began to dedicate more time, for example, to weaving or pottery-making, and provided the products of their work to others in exchange for some of the things they produced. Differences in resource availability and technological know-how thus led to economic diversification and, in order to provide everyone with the things they needed, exchange and trade.
The symbiosis that thus emerged between different landscapes and the lifeways invented and constructed by human groups to deal with them narrowed the spectrum of adaptive options open to the individual societies concerned, and drove each of them to devise more and more complex solutions, with more and more unanticipated consequences that then needed to be dealt with in turn.
Collective information processing among larger and larger groups enabled the continued accumulation of knowledge, and thus the growth of information-processing capacity, which in turn enabled a concomitant increase in matter, energy, and information flows through the society, and thus the growth of interactive groups.
But this growth was at all times constrained by the amount of information that could be communicated among the members of the group, as miscommunication led to misunderstandings and conflicts, and impaired the cohesion of the communities involved. Communication stress in my opinion provided the incentive for improvements in the means of communication (for example by inventing new, more precise, concepts to communicate ideas with, cf. van der Leeuw Reference van der Leeuw and van der Leeuw1981, Reference van der Leeuw, van Bakel, Hagesteijn and van de Velde1986), and a reduction in the search time needed to find those people one needed to communicate with (by adopting a sedentary grouped lifestyle).
Finally, as the social system diversified, and people became more dependent on each other, the risk spectrum increasingly included social stresses caused by misunderstandings and miscommunications. Handling risks therefore came to rely increasingly on social skills, and the collective invention and acceptance of organizational and other tools to maintain societal cohesion.
The First Towns
From this point in the story, I will no longer try to point out any novel cognitive operations emerging as human societies grew in size and spread over the surface of the earth because there are simply too many. Instead, I will focus on how the feedback system that drove societal growth as well as the conquest of the material world through innovation posed some major challenges. Overcoming these ultimately enabled the emergence of true world systems such as the colonial empires of the early modern period (Wallerstein Reference Wallerstein1974; van der Leeuw Reference van der Leeuw, Costanza, Graumlich and Steffen2007) and the current globalized world (see Chapter 15).
Throughout the third stage, from around 7,000 BP until very recently, communication remained a major constraint because more and more people were interactive with each other when the size of settlements involved grew to what we now call towns. This stage therefore sees the emergence of a host of new innovations, such as writing, recurrent markets, administration, laws, bureaucracies, and specialized full-time communities dedicated to specific activities (priests, scribes, soldiers, different kinds of craftsmen and women, etc.). Many of these had either to do with improving communication (such as writing and scribes), social regulation (administration, bureaucracies, laws), the harnessing of more and more resources (mining), or the exchange of objects and materials in part over larger and larger distances (markets, long-distance traders, innovations in transportation). As larger groups aggregated, the territory upon which they depended for their material and energetic needs (their footprint to use a modern term) expanded very rapidly, and the effort required to transport foodstuffs and other materials did so too, as did the probability of inter-settlement or intergroup conflict.
This caused the emergence of energy as a major constraint that limited the evolution of urban societies for millennia to come. To deal with this constraint, an interesting core–periphery dynamic emerged to exploit that ever-growing footprint – the exchange of organization against energy. Around towns, dynamic flow structures emerged, in which organizational capacity was generated in the town and then spread around it, extending the town’s control over a wider and wider territory. In return, the increasing quantities of energy collected in that growing territory (foodstuffs and other natural resources) provided for the ever-increasing population that kept the flow structure going by ensuring steady innovation (creation of new technology, institutions, and information-processing capacity). These flow structures became the bootstrapping drivers that created larger and larger agglomerations of people and the territories to go with them.
In their emergence, these flow structures always involved longer distance trade, which brought to each individual town products from a network of other towns and regions. This was an inherent aspect of the fact that in order to keep larger populations interested in aligning their values with each other, such systems had to provide new values, which were no longer uniquely based on the immediate needs of the population (food and other ubiquitous materials and activities) (van der Leeuw Reference van der Leeuw, Chase and Scarborough2014).
What enabled the urban populations to keep innovating, and thus to enlarge their value space (see Chapters 15–16) and thereby maintain their flow structures, was – again – the growing capacity of more and more interacting minds to identify new needs, novel functions, and new categories, as well as new artifacts and challenges. Writing contributed to that capability by enabling information to cross both time and space, and therefore to help individuals to be informed by the efforts and insights of others.
Underpinning that dynamic is one that we know well in the modern world. Invention is usually (and certainly in prehistoric and early historic times) something that involves either individuals or very small teams. Hence, in its early stages an invention is related to a relatively small number of cognitive dimensions – it solves challenges that few people are aware of (see Chapter 12 for a detailed description of the process). When inventions become the focus of attention of a larger number of people, such as in towns, they are simultaneously understood in many more dimensions (people see more uses for them, ways to slightly improve them, etc.), and this in certain cases triggers an invention cascade – a string of further inventions, including new artifacts, new uses of existing artifacts, new forms of behavior, and new social and institutional organization. In this process, clearly, towns and cities are more successful than rural areas because of the greater number of interactive individuals in such aggregations. This is corroborated by the fact that when applying allometric scaling of urban systems of different sizes against metrics of their population, energy flow, and innovation capacity, population scales linearly, energy flow sublinearly, and innovation capacity superlinearly (Bettencourt et al. Reference Bettencourt, Lobo, Helbing, Kühnert and West2007). I will return to this in Chapter 16.
The First Empires
The above flow structures continued to grow (albeit with ups and downs) until, after several millennia (from about 2500 BC in the Old World, and about 500 BC in the New), they were able to cover very large areas, such as the prehistoric and early historic empires (The Chinese, Achaemenid, Macedonian, and Roman Empires, for example, in the eastern hemisphere, the Maya and Inca Empires in the western one, and later the European colonial empires all around the globe), which concentrated large numbers of people at their center (and, in order to feed them, gathered treasure, raw materials, crops, and many other commodities from their hinterlands). Throughout this period communication and energy remained the main constraints, impacting on cities, states, and empires.
Thus we see advances in the harnessing of human energy (including slavery), wind power (for transportation in sailing vessels and for driving windmills), falling water (for mills), etc., but also in the facilitation of communication, (e.g., long distance Roman and Inca “highways” over land, the sextant and compass to facilitate navigation on the seas). This enabled societies to create and concentrate wealth that served to defray the costs of managing societal tensions: maintaining an administration and an army, creating a judiciary or other institutions to arbitrate in conflicts, etc.
The Roman Republic and Empire
To illustrate how this long-term perspective works, I will briefly look at the history of the Roman Empire (van der Leeuw & de Vries Reference van der Leeuw, de Vries, de Vries and Goudsblom2002) in these terms.
The expansion of the Roman republic was enabled by the fact that, for centuries, Greco-Roman culture had spread northward from the Mediterranean. It had, in effect, structured the societies in (modern) Italy, France, Spain, and elsewhere, by means of practical inventions (such as money, new crops, the plough), the building of infrastructure (towns, roads, aqueducts), the creation of administrative institutions, and the collection of wealth. Profiting from this situation, the Romans instituted a flow structure that aligned the organization of the periphery of their sphere of influence with their own culture, creating the channels for an inward flow of matter and energy into the core of the empire. To achieve this, they used an ingenious policy of stepwise assimilation and organization of indigenous political entities based in cities (Meyer Reference Meyer1964), making them subservient to the uninterrupted growth of flows of wealth, raw materials, foodstuffs, and slaves from the conquered territories to Rome. Linking cities across the empire, this flow structure functioned for as long as there were more preorganized societies to be conquered and wealth to be gathered (Tainter Reference Tainter1988). But once the Roman armies came to the Rhine, the Danube, and the Sahara, that was no longer the case and conquests stopped. Then, to keep the flow structure going, a phase of major internal investment in the conquered territories followed, expanding the infrastructure (highways, villas, industries) within the Empire in order to harness more resources for Rome.
As large territories were thus “Romanized,” and technologies and institutional solutions spread, they became less dependent on Rome’s innovations for their wealth, and thus expected less and less from the Empire. In about CE 250 the innovation/value-creation system at the core stalled. The information gradient between the center and the periphery leveled out, and so did the value gradient between the periphery and the center.2 This made it more and more difficult to ensure that the necessary flows of matter and energy reached the core of the empire.
As the relative cost (in terms of a military and administrative establishment) grew, the Roman emperors had more and more difficulty in maintaining their grip on the very large areas concerned. By the fifth century CE, the coherence of the western part of the Empire had decreased to such an extent that it ceased, for all intents and purposes, to exist. People began to focus on themselves, their neighborhoods, and their local environment rather than on maintaining the central system. Other, smaller, structures emerged at its edges, and there the same process of extension from a core began anew, at a much smaller scale, and based on different kinds of information processing. In other words, the alignment between different parts of the overall system broke down, and new alignments emerged that were only relevant locally.
To explain the collapse of the Roman Empire, Tainter (Reference Tainter1988) thus argues convincingly that only by laying its hands on the treasure accumulated outside its borders in the centuries before the Roman conquest was Rome able to maintain the large armies and bureaucracies necessary to keep its Empire. As soon as there was no more treasure to be gained by conquering, the empire was thrown back upon recurrent (in essence solar) energy, which was insufficient to maintain the flow structure. To deal with the difficulties this caused, the emperors progressively debased their currency until it was worth hardly anything (Figure 8.5).
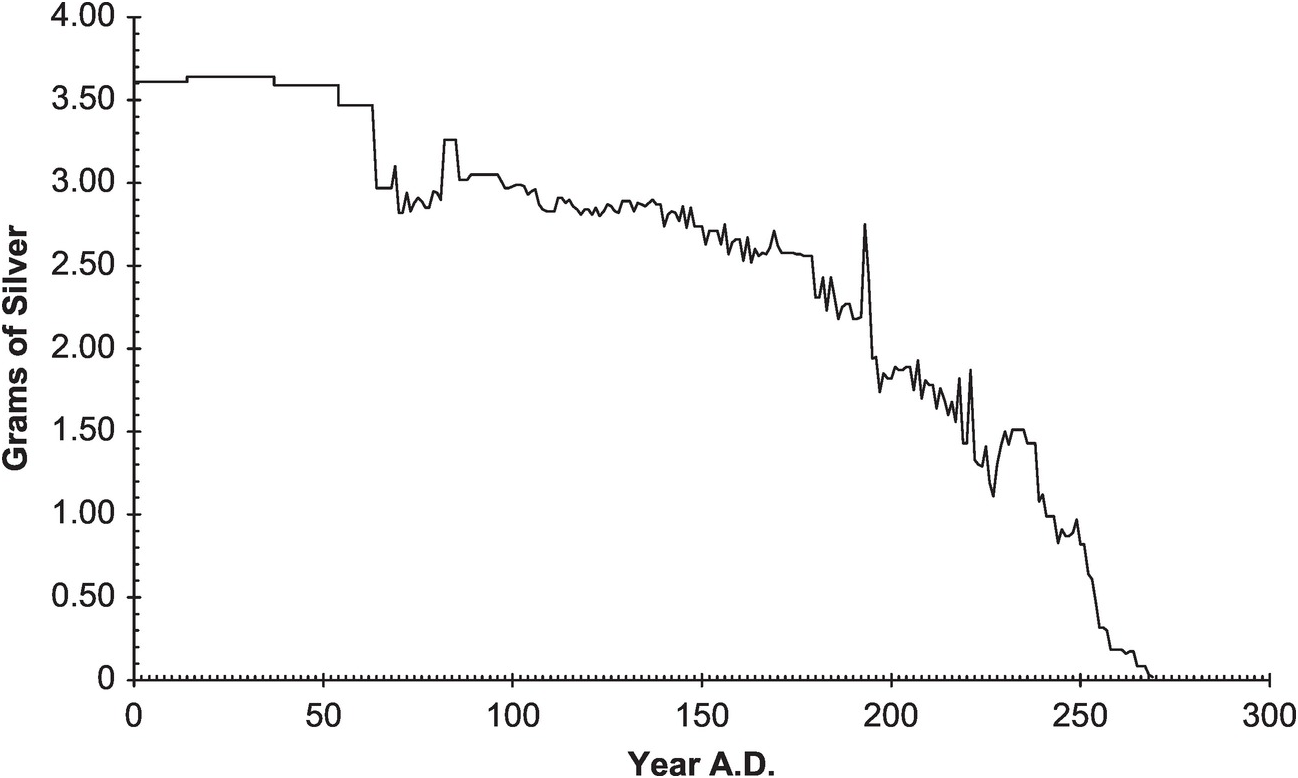
Figure 8.5 Graph showing the debasement of Roman coinage following the end of the Roman imperial conquests in around CE 100.
On the one hand, this reduced the advantages of being part of the Empire, and on the other it reduced the control of the emperors over its wide territory, so that people increasingly fell back on smaller, regional or local, networks. Disaffection or even dispersion of the population followed the cessation of the flows that generated the coherent socioeconomic structure of an empire in the first place.
As the alignment of large concentrations of people broke down, innovation also ceased, and in the ensuing period the knowledge base of many different technologies was lost. In Chapter 15, I will pick up the story at this point again, and show how from a very low base Europe managed to reemerge as a major political and economic force that conquered many parts of the overseas world.
Conclusion
We have seen how, initially, human information processing was limited by the biological capacity of the brain to deal simultaneously with different sources of information. Once those limits had been pushed back to enable the human STWM to deal with 7 ± 2 such sources, innovation took off in many different ways. Increasingly, information processing became a collective process, bringing more and more people together in groups dealing with their own specific environment, enabling humans to spread to areas with very inhospitable environments, such as the Arctic. As the number of tools for thought and action multiplied, humans became more and more dependent on communication and interaction. To reduce search times in communication, stable patterns of mobility and settlements were introduced, enabled by techniques to invest and exploit the environment for purposes of more or less stable group subsistence. As the interactive groups, and the interaction within them, grew to the size of small towns, this ultimately led to energy and resources becoming important constraints, and societal dynamics growing in importance, requiring an adaptation of communication patterns and the structure of social networks. The resulting flow structure dynamic exchanged spreading information processing capacity for increases in inward flows of the energy and resources needed for survival. As the footprints of such flow structure cells grew, they ultimately federated large territories into empires. But as the regulatory overhead of empires grew, these found themselves limited in size by energy constraints. This ultimately led to their decomposition, back into smaller units.
Of course, an overview over millennia such as this one only intends to show a general trend, the increase of the dissipative information flow capacity of human information processing over time, and simplifies an enormously complex process. This chapter is not intended as proof of the approach taken in this book, but rather as an illustration to stimulate thinking about how this approach might have played out, and to prompt new research questions that this approach raises.
In Chapters 9 and 11 I will develop the dynamics of this long-term process from a theoretical perspective. In Chapter 10 I will again present a case study, but this time in much more detail, arguing how this coevolutionary process affects all aspects of society. Then, in Chapter 15, I will try to show how European history from the Roman Empire to the present illustrates this process in more detail, and how, from about 1750, the energy constraint was lifted owing to the appropriation of fossil energy, so that information processing – again – became the main constraint.
“Theories permit consciousness to ‘jump over its own shadow’, to leave behind the given, to represent the transcendent, yet, as is self-evident, only in symbols.”
Introduction
After presenting in Chapter 8 a sketch of the coevolution of human cognition, socioenvironmental interaction, and organizational evolution, we need to look more closely and critically at the concepts and ideas that underpin this view. That raises three fundamental questions – “What do I consider information?,” “What is information processing?,” and “How is information transmitted in societies?” Those questions are the topic of this chapter, which, in order to solidly ground the book is a little more technical than earlier chapters.
It is the main thesis of this book that societies can profitably be seen as an example of self-organizing human communications structures, whether we are talking about urban societies or other forms of human social organization, such as small band societies or hierarchical tribes. The differences are merely organizational ones, owing to the need to deal with larger information loads and energy flows as human problem-solving generates more knowledge, and the concomitant increase in the population requires more food and other resources.
Although the book’s fundamental theses are (1) that the structure of social systems is due to the particularities of human information-processing, and (2) that the best way to look at social systems is from a dissipative flow structure paradigm, it differs in its use of the two core concepts “information” and “flow structure” from earlier studies.
The difference with respect to the information approach presented by Webber (Reference Webber1977), for example, is that I view societal systems as open systems, so that neither the statistical–mechanical concept of entropy nor Shannon’s concept of relative entropy can be used, as they only apply to closed systems in which entropy does not dissipate. As Chapman rightly argues (Reference Chapman1970), the existence of towns is proof that human systems go against the entropy law, which is in essence only usable as a measure of the decay of structure.1 That approach therefore seems of little use.
The difference with earlier applications of the “flow structure” approach, such as P. M. Allen’s (Allen & Sanglier Reference Allen and Sanglier1979; Allen & Engelen Reference Allen, Engelen, Ebeling and Peschel1985) or Haag and Weidlich’s (Reference Haag and Weidlich1984, Reference Haag and Weidlich1986) is that I wish to formulate a theory of the origins of societies that forces us to forego a model of social dynamics formulated in terms of a social theory (Allen) or even migration (Haag & Weidlich), as these make assumptions that we cannot validate for the genesis of societal systems. Just like Day and Walter (Reference Day, Walter, Barnett, Geweke and Shell1989) in their attempt to model long-term economic trends (in the production of energy and matter) must revert to population, we have to revert to information and organization if we wish to model long-term trends in patterning (Lane et al. Reference Lane, Maxfield, Read, van der Leeuw, Lane, Pumain, van der Leeuw and West2009).
Social Systems as Dissipative Structures
I therefore view human institutions very abstractly as self-organizing webs of channels through which matter, energy, and information flow, and model the dynamics of cultural systems as if they are similar to those of dissipative flow structures. As this conception is fundamental to the argument of this book, I will present it here in a more elaborate form.
A simple model of a dissipative structure is that of an autocatalytic chemical reaction in an open system that produces, say, two colored reagents in a liquid that is initially the color of the four substances combined.2 At equilibrium, there is no spatial or temporal structure. When the reaction is pushed away from equilibrium, a spatiotemporal configuration of contrasting colors is generated in the liquid. As it is difficult to represent this in a single picture, I refer the reader to a short YouTube video that explains both the history and the dynamics of this so-called Belouzhov-Zhabotinskii reaction: www.youtube.com/watch?v=nEncoHs6ads.
Structuring continues over relatively long time-spans, which implies that during that period the system is capable of overcoming, at least locally, its tendency toward remixing the colors (in technical terms, it dissipates entropy). The structure, as well as the reaction rate and the dissipation rate, depend on the precise history of instabilities that have occurred.
The applicability of the dissipative structure idea to human institutions, then, hinges on our ability to answer each of the following two questions positively:
Is there at least one equivalent to the autocatalytic reaction just presented that can be held responsible for coherent structuring in human systems?
Is the system an open system, i.e., is it in free exchange of matter, energy, and information with its environment, as is the case with other living systems?
It seems to me that human learning has many properties that permit us to view it as an autocatalytic reaction between observation and knowledge creation. The observation that social systems came into existence and continue to expand, rather than to decay, seems to point to an affirmative answer to the second question.
This chapter is devoted to exploring these questions further. First, I will deal with the individual human being, and consider the learning process as a dynamic interaction between knowledge, information, and observations. The second part deals with the dynamic interaction between the individual and the group, and considers shared knowledge and communication. Finally, I will consider system boundaries and dissipation.
Perception, Cognition, and Learning
Uninterrupted feedback between perception, cognition, and learning is a fundamental characteristic of any human activity. That interaction serves to reduce the apparent chaos of an uncharted environment to manageable proportions. One might visualize the world around us as containing an infinite number of phenomena that each have a potentially infinite number of dimensions along which they can be perceived. In order to give meaning to this chaos (χαοσ (Greek): the infinity that feeds creation), human beings seem to select certain dimensions of perception (the signal) by suppressing perception in many of the other potentially infinite dimensions of variability, relegating these to the status of “noise.”
On the basis of experimental psychology, Tverski and his associates (Tverski Reference Tverski1977; Tverski & Gati Reference Tverski, Gati, Rosch and Lloyd1978; Kahnemann & Tverski Reference Kahnemann, Slovic and Tverski1982) studied pattern recognition and category formation in the human mind. They concluded that:
Similarity and dissimilarity should not be taken as absolutes.
Categorization (judging in which class a phenomenon belongs) occurs by comparing the subject with a referent. Generally, the subject receives more attention than the referent.
Judgment is directly constrained by a context (the other subjects or other referents surrounding the one under consideration).
Judgments of similarity or of dissimilarity are also constrained by the aims of the comparison. For example, similar odds may be judged favorably or unfavorably depending on whether one is told that one may gain or lose in making the bet.
From these observations, one may derive the following model of perception:
1. Perception is based on comparison of patterns perceived. A first comparison always takes place outside any applicable context (the dimensions in which the phenomena occur are unknown), so that there is no referent and no specific aim. Thus, there is no specific bias toward similarity or dissimilarity. If there is any bias at all, it is either due to intuition or to what people have learned on past occasions, which cannot necessarily be mapped onto the case at hand.
2. Once an initial comparison has led to the establishment of a referent (a relevant context or patterning of similarity and dissimilarity), this context is tested against other phenomena to establish its validity. In such testing, the established pattern is the subject and the phenomena are the referents. There is therefore (following Tverski’s second statement) a distinct bias in favor of similarity.
3. Once the context is firmly established and no longer scrutinized, new phenomena are subjects in further comparisons, and the context is the referent. Thus, the comparisons are biased toward the individuality of the phenomena and toward dissimilarity.
4. Once a large number of phenomena have been judged in this way, the initial bias is neutralized, the context is no longer considered relevant at all, and the cycle starts again, so that further comparisons lead to establishing another context.
5. Ultimately, this process leads to the grouping of a large set of phenomena in a number of categories at the same level, which are generally mutually exclusive (establishing dimensions and categories along them). At a certain point, the number of categories is so large that the same comparative process begins again, at a higher level, which treats the groups as phenomena and results in higher level generalizations.
Thus, perception and cognition may be seen as a feedback cycle between the concepts (categorizations) thus generated, their material manifestations, and the (transformed) concepts that derive from and/or are constrained by these material manifestations. This cycle is illustrated in Figure 9.1.
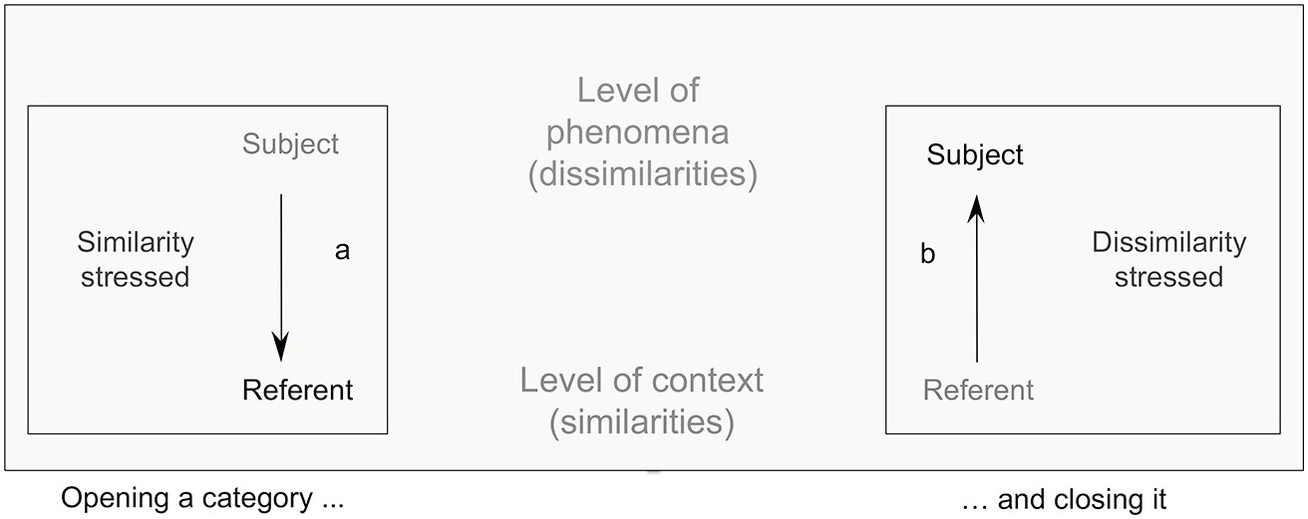
Figure 9.1 The dynamics of category formation as described by Tversky and Gati (Reference Tverski, Gati, Rosch and Lloyd1978). For an explanation, see the text.
This learning process is as endless as it is continuous, and could also be seen as an interaction between knowledge, the formalized set of substantive and relational categorizations that make up the cognitive system of an individual, and information, the messages that derive their raison d’être and their meaning from the fact that they trigger responses from these categorizations, yet never fit any of them exactly. In that sense, information can be seen as potential meaning.
Because the chances that messages exactly fit any preexisting categories are infinitesimally small, they continuously challenge and reshape knowledge. In this sense, then, information is the variation that creates the (flow) structure of knowledge. Paraphrasing Rosen, one might say that information is anything that makes a difference (or answers a question).3 But any information also poses new questions.
Communication: The Spread of Knowledge
Because humans are social beings they share, and therefore necessarily exchange, various commodities. This is as fundamental an aspect of human life as perception, cognition, and learning.
Some of these commodities are at first sight entirely material: food, raw materials, artifacts, statuettes, etc. Other exchanges seem predominantly a question of energy: collaboration in the hunt, in tilling the soil, or in building a house, but also slavery, wage labor, etc. Yet a third category primarily seems to concern information: gossip, opinions, and various other oral exchanges, but also their written counterpart: clay tablets, letters, and what have you, including electronic messages.
But in actual fact, the exchange of all commodities involves aspects of matter, energy, and information. Thus, there is the knowledge where to find raw materials or foodstuffs and the human energy expended in extracting or producing them; the knowledge and energy needed to produce artifacts or statuettes, which are reflected in the final product; the knowledge of the debt incurred in asking someone’s help, which is exchanged against that help, only to be drawn upon or reimbursed later; the matter transformed with that help; the energy with which the words are spoken; the matter to which symbols are entrusted in order to be transported. The examples are literally infinite.
Knowledge determines the exact nature and form of all commodities that are selected and/or produced by human beings, whether exchanged or not. It literally in-forms substance. Or as Roy Rappaport used to say, “Creation is the information of substance and the substantiation of form.”4 That is easy to see for the knowledge that generates specific sequences of actions with specific goals, such as in the manufacture of artifacts. But it also applies to the simple selection of materials, whether foodstuffs or raw materials of any other kind: transformation and selection by human beings are knowledge-based and consequently impart information. Hence all exchanges between human beings have material, energetic, and information aspects. But as we saw in Chapter 8, matter, energy, and information are not exchanged in the same way, nor do they affect the structure of the system in the same way.5
At the level we are talking about, matter can be passed directly from one individual to the next, a transaction in which one individual loses what the other gains. Human energy cannot thus be handed over, as the capacity to expend it is inalienable from the living being that does the expending. Clearly, fuels, animals, and slaves might he thought of as energy that is handed over, but whenever this occurs they are handed over as matter. In an exchange, energy can only be harnessed, so it is expended in favor of someone. Knowledge cannot be handed over either: an individual can only accumulate it by processing information. But knowledge can be used to generate information that may, more or less effectively, be communicated and be used by another individual to accumulate highly similar knowledge. As a result of that process, individuals may share knowledge. In this context, clearly, knowledge is a stock that is inherent in the information-processing system, while information is a flow through that information-processing system.
Not the energy and matter aspects of flows through a society are therefore responsible for that society’s coherence, but the knowledge which controls the exchange of information, energy and matter. The individual participants in a society or other human institution are (and remain) part of it because they know how that institution operates, and can use that knowledge to meet their needs and desires. I emphasize this point because often, in archaeology and in geography as well as ecology and economics, the flow of energy or matter is what is deemed to integrate a society.
If we use this argument to assert that in our opinion the flow of information is responsible for the structural form of human societies, this is not to deny that the availability and location of matter and energy play a part in the survival of human systems. Rather, I would like to suggest that material and energetic constraints are in principle of a temporary nature and that, given enough tension between the organizational dynamics of a human institution and its resource base, people will in due course resolve this tension by creating novel means to exploit the resource base differently (through invention of new techniques, choice of other resources, or of other locations, for example).
It would seem therefore that while on shorter timescales the interaction between the different ways in which matter, energy, and information spread through a system count, the long-term dynamics of human institutions are relatively independent of energy and matter, and are ruled by the dynamics of learning, innovation, and communication. These dynamics seem to be responsible for social interaction and societal patterning, and allow people to realize those material forms for which there is a coincidence between two windows of opportunity, in the ideal and the material/energetic realms respectively.
As I am mainly concerned with the very long term, my primary aim in this chapter is to consider the transmission of information in human societies, that is the syntactic aspect of communication. Scholars in the information sciences have expended considerable effort in presenting a quantifiable syntactic theory of information.6 Although my immediate aim does not extend to quantification, some of the conceptualizations behind these approaches might serve to focus the mind.
The core idea in information theory is that information can be seen as a reduction of uncertainty or elimination of possibilities:
When our ignorance or uncertainty about some state of affairs is reduced by an act (such as an observation, reading or receiving a message), the act may be viewed as a source of information pertaining to the state of affairs under consideration. […] A reduction of uncertainty by an act is accomplished only when some options considered possible prior to the act are eliminated by it. […] The amount of information obtained by the act may then be measured by the difference in uncertainty before and after the act.
There is, however, a clear limitation to the applicability of information theoretical approaches. Their success in quantifying and generalizing the concepts of uncertainty and information has been achieved by limiting their applicability in one important sense: these approaches view information strictly in terms of ignorance – or uncertainty reduction within a given syntactic and semantic framework, which is assumed to be fixed in each particular application (Klir & Folger Reference Klir and Folger1988, 189). In essence, formal Information Theory applies to closed systems in which all probabilities are known. That is why information as a quantitative concept can be said to equal the opposite of uncertainty, and increase in entropy to imply loss of information and vice versa.
In archaeology and history, we deal with open (societal) systems, and we have incomplete knowledge of the systems we study. It seems therefore that one could never successfully apply this kind of quantifiable information concept to archaeology or history, except when studying a defined channel of communication that functions within a defined syntactic and semantic framework, i.e., in a situation where symbols and meanings are known and do not change.
Nevertheless, at least one important conclusion of information theory seems to be relevant, the idea that (within a given unchanging syntactic and semantic framework), communication channels have a limited transmission capacity per unit time, and that as long as the rate at which information is inserted into the channel does not exceed its capacity, it is possible to code the information in such a way that it will reach the receiver with arbitrarily high fidelity.8 By implication, if the amount of information that needs to be transmitted through channels increases, there comes a point where a system has to improve channel capacity, introduce other channels, or alter the semantic relationship between knowledge and information.9
Social Systems as Open Systems
Next, we must answer the second of the two questions asked earlier in this chapter: “Are societal systems in free exchange of matter, energy and information with their environment?” For matter and energy, the answer is evidently positive: humanity can only survive because it takes food, fuel, and other forms of matter and energy from its nonhuman environment, and it transfers much of these commodities back into the external environment as waste, heat, etc.
But the exchange of information with the system’s environment may need some further elaboration. Information, as we have used it here, is a relational concept that links certain observations in the “real” realm of matter and energy with a pattern in the realm of ideas in the brain. I have argued above that humans generate knowledge through perceptual observation and cognitive choice, in essence therefore within the human brain, and at the group level within the societal system. Knowledge does not transcend system boundaries directly. Yet perception and cognition distill knowledge from the observation of phenomena outside the human/societal system. Those phenomena are thus, as it were, potential information to the system. We must conclude that knowledge inside the system is increased by transferring such potential information into the system from the outside. Among transfers in the opposite direction, there is first the direct loss of knowledge through loss of individual or collective memory or the death of individuals. But information is also taken out of the human system when words can be blown away, writings destroyed, and artifacts trampled so that they return to dust. And even when the information stored in artifacts is not destroyed, it ceases to function as such as soon as it is taken out of its particular knowledge context, for example because the latter changes as a result of further information processing.
Transitions in Social Systems as Dissipative Structures
An increase in the information that is communicated among the members of a group would seem to have two consequences. At the level of the individual, it would decrease uncertainty by changing the relationship between the syntactic and semantic aspects of human information processing, increasing the level of abstraction (Dretske Reference Dretske1981). At societal level it would increase participation and coherence, so that it may be said that the degree of organization increases and entropy is dissipated.
In an archaeological context, the latter is the more visible, for example when we look at the way in which a cultural system manages to harness an ever-increasing space, or the same space ever more intensively, by destroying or appropriating its natural resources in a process of (possibly slow) social incorporation (see Ingold Reference Ingold1987).
A simple example is that of “slash-and-burn” agriculture. Bakels (Reference Bakels1978), for example, has shown in detail how the early Neolithic inhabitants of Central and Northwestern Europe (5000 BCE), who are known as the Danubians, exhausted an ever-widening area of their surroundings in procuring for themselves the necessary foodstuffs and raw materials. The fact that this happened rather rapidly is certainly one of the factors responsible for the rapid spread of these peoples (see Ammerman & Cavalli Sforza Reference Ammerman, Cavalli Sforza and Renfrew1973).
I have argued (Reference Ingold1987, 1990) how in the Bronze and Iron Ages (1200 BCE–CE 250), the local population of the wetlands near the Dutch coast repeatedly transformed an untouched, extremely varied, and rich environment by selective use of the resources in it, resulting in a more homogeneous and poorer environment. As soon as a certain threshold of structuring was reached, the inhabitants had to leave an area and move to an adjacent one.
In both these cases, the information (about nature) that was contained in an area, that is those features of it that triggered a response in the knowledge structures of the population, was used for its exploitation up to the moment that the “known environment” could no longer sustain the population. In the process, the symbiosis between the population and its natural environment changed both, so that eventually the symbiosis was no longer possible, at least with the same knowledge. One example that shows the importance of the relationship between available knowledge and survival in the environment emerges when one compares the knowledge available to the Vikings on Greenland and the Inuit in the same area: whereas the stock of knowledge available to the Vikings was hardly sufficient to survive the cooling of the climate after c. 1100 except marginally, the knowledge available to the Inuit enabled them to survive more easily up to the present. This dynamic is further detailed in Chapter 13.
Similar things occur in the relationship between different societal groups. A city such as Uruk (c. 4000 BCE) seems to have slowly “emptied out” the landscape in a wide perimeter around it, probably by absorbing the population of the surrounding villages (Johnson Reference Johnson, Sabloff and Lamberg-Karlovsky1975). When it could not do so any more, probably for logistical reasons, various groups went off to found faraway colonies that fulfilled the same function locally and that remained linked to the heartland by flows of commercial and other contacts, often along the rivers.10 The same was customary among the Greeks in the classical period (sixth to fifth century BCE). As soon as there was a conflict in a community (due to errors in communication or differences in interpretation, whether deliberate or not), groups of (usually young) dissidents were sent off to other parts of the Aegean to colonize new lands. These lands were then to some extent integrated into the Greek cultural sphere. That process is no different from the one that allowed the European nations in the sixteenth to nineteenth centuries to establish colonies in large parts of the world.
As we have seen in the last chapter, the Roman Empire slowly spread over much of the Mediterranean basin, introducing specific forms of knowledge and organization (“Roman Culture”), aligning minds. In so doing it was able to avail itself of more and more foodstuffs, raw materials, and raw energy, among other things in the form of treasure and slaves. As the rate of expansion increased, the process of acculturation outside its frontiers – which was initially, during the Republic, more rapid than the expansion – was eventually (in the first centuries CE) “overtaken” by the latter. That brought expansion to a standstill, and led to a loss of integration in the Empire (and eventually its demise).
In each of these cases, structuring was maintained as long as expansion was possible in one way or another. Expansion keeps trouble away, just as in the chemical reaction that I presented as an example of a dissipative, that structure could only maintain structuring by exporting the inherent tendency of the liquid to mix the colors. It is this aspect of societal systems that seems to me to indicate that they can profitably be considered dissipative information-flow structures.
One consequence is that the very existence of any cultural entity depends on its ability to innovate and keep innovating at such a rate that, continuously, new structuring is created somewhere within it and spreads to other parts (and beyond) so as to keep entropy at bay (see Allen Reference Allen, Aida, Allen and Atlan1985; van der Leeuw Reference van der Leeuw and Manzanilla1987, Reference van der Leeuw, van der Leeuw and Torrence1989, Reference van der Leeuw, Fiches and van der Leeuw1990; McGlade & McGlade Reference McGlade, McGlade, van der Leeuw and Torrence1989). From the very moment that innovation no longer keeps pace with expansion, the entity involved is doomed. As we have seen in the case of the Bronze Age settlement of the western Netherlands, that moment is an inherent part of the cognitive dynamics responsible for the existence of the entity concerned. For the Roman Empire, a similar case can easily be made based on the exponential increase in its size, just as for the other examples given. It might be concluded that, seen from this perspective, the existence of all cultural phenomena is due to a combination of positive feedback, negative feedback, noise, and time lags between innovation and dissipation.
Conclusion
The last few pages have tried to argue the case for considering social phenomena as dissipative flow structures, and have outlined some critical elements of such a conceptualization. To begin with, I have tried to find our way through the confusion underlying the concept of information, and to outline my use of the word. Notably, I have pointed to the cognitive feedback between information and knowledge as the autocatalytic reaction underlying the development of the patterning that individual humans impose on their social and natural environment. I have also outlined why, in my opinion, all conceivable kinds of exchange between people have an information-exchange aspect, and that it is the exchange of information that seems to be responsible for the cohesion of social institutions at all levels. To introduce the concept of channel capacity within a given, fixed, semantic, and syntactic framework, I have drawn upon Shannonian information theory, making it very clear that as this theory applies to closed systems it is not otherwise compatible with the general approach I have chosen.
Shifting my focus somewhat, I have then argued the case for modeling human institutions as open systems and have considered whether such systems do indeed freely transfer information in both directions, inward and outward. Finally, I have briefly presented a few of the many available historical and archaeological cases that point to the fact that social institutions dissipate entropy. I have, however, refrained from trying to present a particular theory of entropy dissipation in human systems.
Introduction
The purpose of this chapter is to drill down a level, to illustrate by means of an example some of the detail of the long-term flow structure dynamics that are at work in any interaction that involves humans in profoundly modifying their socioenvironment, with an emphasis on the evolution of information processing. To understand this chapter correctly, it is important to realize that technologies, like institutions and tools for thought and action, are also part of the information-processing apparatus that humans create in their interactions with the outside world. All of these are part of the total knowledge that is acquired in the process, and as such codetermine the path dependency of the processing system. Tools serve to streamline decision-making processes because they mechanize some of the decision-making involved, fixing it in a material substrate that enables certain ways of doing things and constrains others.
Technical systems have a very particular place in our dealings with the environment, and should therefore have a particular position in our research into those dealings. Technical systems do not follow the logic of the societal systems in which they are embedded, nor do they follow the logic of the environmental systems with which they interact. In fact, they have their own logic that will be investigated in Chapters 12 and 13. Moreover, they result in artifacts that are in themselves substantiated tools for specific information processing tasks. As such they are themselves part of the driving dynamics of the evolution of information processing that I summarize in Chapters 8 and 9.
The Pre- and Proto-History of the Rhine Delta
The area presently called Rijnland in the Netherlands is situated just behind the Dutch coastline between two ancient branches of the Rhine, near its mouth. The term is also used for the administrative entity that governs water management in the area. In this chapter, I will try to show that such a conjunction is not accidental.1 Indeed, the management of the environment has not only given rise to new technologies (such as windmills, polders, locks, and dikes), but it has also shaped the institutional development of the Netherlands and many aspects of its societal dynamics. To do so, I will describe the genesis and evolution of the area from around 2000 BCE to the present. In that period, the natural dynamics of the region were completely brought under control of humankind. Tim Ingold (Reference Ingold1987) speaks of “The Appropriation of Nature.”
Like every river, the Rhine has for tens of millennia deposited large amounts of gravel and sand in front of its mouth, in the North Sea. As the sea level rose under the impact of non-anthropogenic climate change, and the deposits built up simultaneously, the river’s flow slowed down and the difference in level between water and land diminished, until in many places it was only a few feet. A true delta emerged, in which the sea and the river continually struggled for dominance. Sometimes above and sometimes underwater, the natural levees (ridges) became areas on which vegetation took root. But as long as the sea regularly inundated them during winter storms, and deposited large amounts of sand on the levees, vegetation could not really establish itself.
Around 2000 BCE, currents in the North Sea shifted and caused the slow buildup of a row of levees that protected the area immediately behind it from the sea (van der Leeuw, Reference van der Leeuw and Manzanilla1987; Brandt & van der Leeuw Reference Brandt, van der Leeuw and Purdy1988). The largest mouth of the Rhine shifted toward the north, fresh water accumulated behind the levees further south, and as the vegetation flourished in this area, which was now protected from the sea, it became a peat marsh.
Eventually, people settled in that marsh, initially on small tufts of peat that were a little higher than the surrounding landscape and on the edges of the creeks that drained it. These early settlements consisted of a very small number of houses (generally one to four). People exploited the land by planting some cereals and other edible plants and by allowing some domesticated cattle and sheep to graze there (Brandt et al. Reference Brandt, van Wijngaarden-Bakker and van der Leeuw1984). But the battle against water dominated their lives. One finds drainage ditches around the individual houses, and with time individual houses were built on small artificial mounds (terpen in Dutch) to ensure that they were not inundated in periods of high water when storms or high tides in the North Sea blocked the Rhine’s mouth and fresh water accumulated behind the dunes (Brandt et al. Reference Brandt, Groenman-van Waateringe and van der Leeuw1987).
To cultivate their crops, people also had to drain the peat. But as soon as the water table was lowered, the (drying) peat either oxidized or blew away, lowering the level of the land. This engendered a positive feedback loop that made drainage more and more difficult, and heightened the danger of inundations. The drainage ditches grew longer and longer, eventually creating a complicated network. These longer ditches are the first sign that people began to collaborate and organize themselves in the battle against the water.
By about 900 CE, the inhabitants’ strategy in dealing with the water changed – rather than building individual mounds for themselves, they began to collaborate in enclosing certain (initially small) surfaces by means of artificial defense systems (dikes, dijken in Dutch, levees in US English) several meters high. We may interpret this as a sign that local societal organization had reached a new level.
The Middle Ages: Keeping the Land Dry Leads to the Hoogheemraadschap Rijnland
Around 1000 CE, another factor came into effect: the political organization of the area (see van Tielhof & van Dam, Reference van Tielhof and van Dam2006, the most recent authoritative work on the history of Rijnland, upon which I have heavily relied for this chapter, including for the illustrations). Feudal lords began to play a role in the western part of what is now the Netherlands. An endless series of skirmishes between small local potentates ultimately created a political hierarchy. Not surprisingly, this process was somewhat more advanced in the drier parts of the delta than in the wetter areas nearest the coast. In particular, the bishopric of Utrecht, situated on higher ground (the sandy moraines left by the last Ice Age), had a longer history as a political entity than the lower areas immediately behind the dunes, collectively called Holtland (the woodland, from which the current Holland derives). Holland and Utrecht remained politically distinct for most of the Middle Ages, and there was a continuous series of political and military conflicts between their official rulers, the Counts of Holland and the Bishops of Utrecht, as well as among their feudal dependents.
During this time, Holland was administratively divided into several entities (so-called baljuwschappen), of which two are particularly important for this story: Rijnland, with Leiden at its center, and Kennemerland, with Haarlem as its focus (Figure 10.1). Both their centers were located at the easternmost edge of the natural levees that protected the landscape from the sea and were therefore themselves relatively safe from inundation.
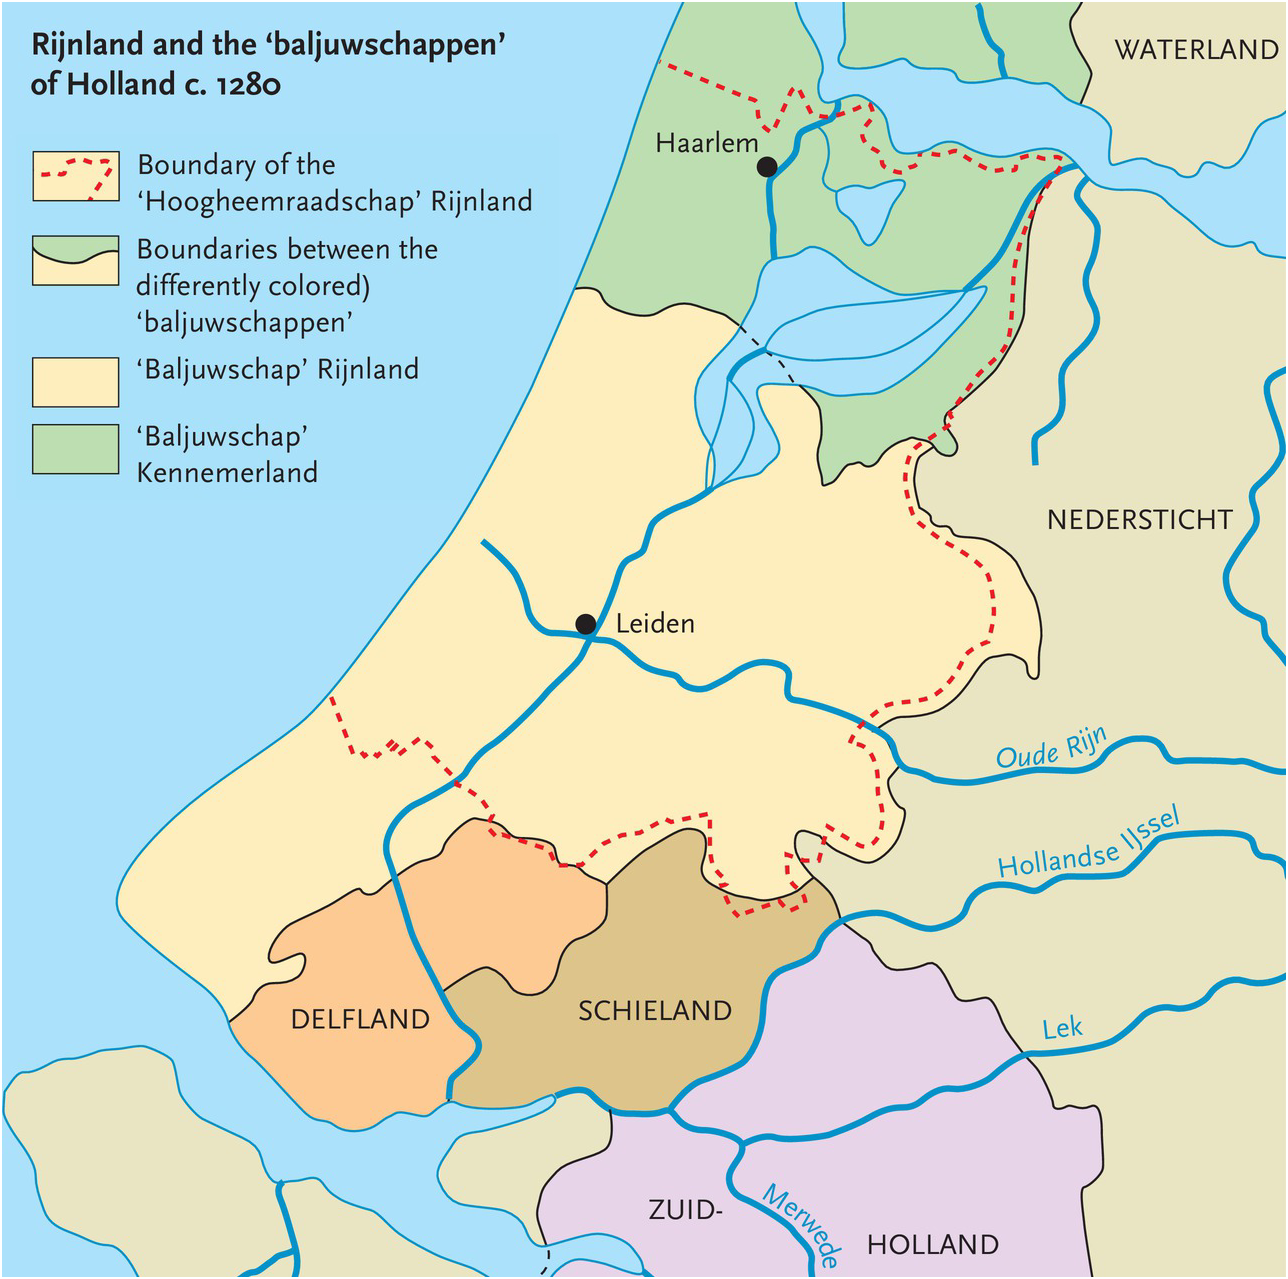
Figure 10.1 Administrative units in western Holland, c. 1280. Kennemerland and Rijnland were later brought under the authority of the Hoogheemraadschap Rijnland for all matters concerning water.
Around 1150, the mouth of the (Old) Rhine to the west of Leiden was definitively closed by the movement of large amounts of sand in the northward current along the coast. This caused the area behind the dunes to suffer more frequently from river inundation, and by 1280 collective action had to be taken on a larger scale. Not surprisingly, the first major collective intervention – the damming of the Rhine upstream to protect the inhabitants of Rijnland from flooding by the river – occurred at the boundary between Utrecht and Holland. Canals were then dug from Leiden to the north and the south, to ensure that the area’s surface water could be evacuated without danger to the population of Rijnland. But canals have the unfortunate property that they can, if the water level inverts, also be sources of flooding. Hence, locks had to be constructed at the mouth of both canals (see Figure 10.2).
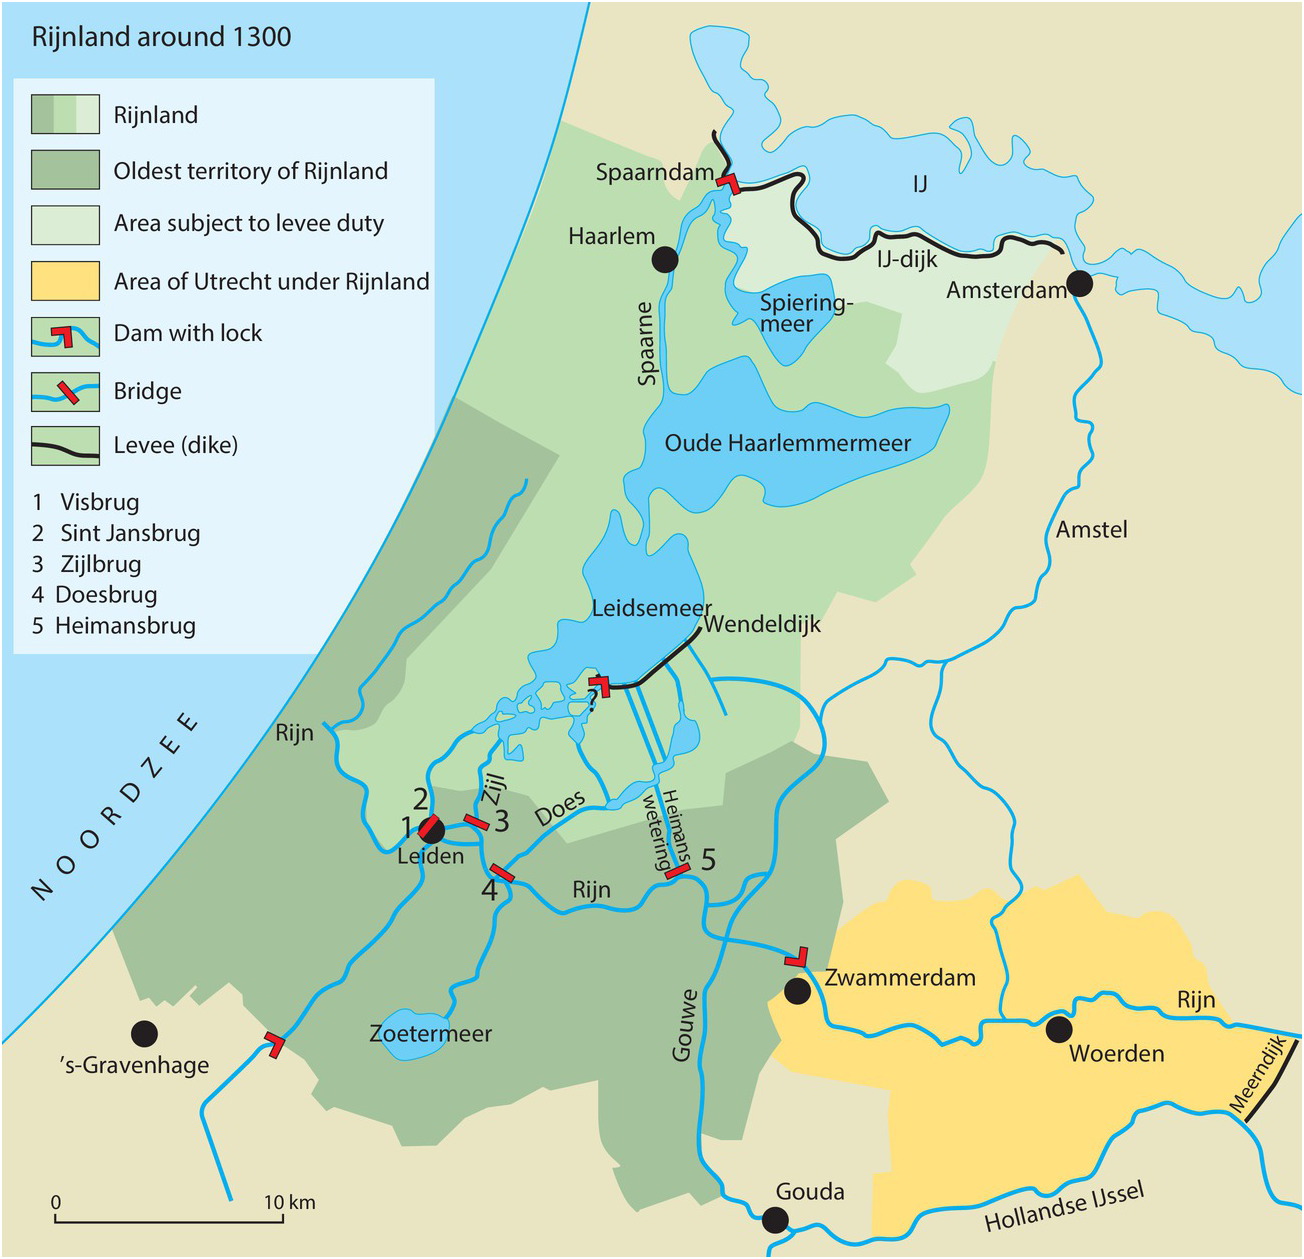
Figure 10.2 The situation in around 1300. Rijnland is in diverse shades of green. Note the civil engineering works (dikes, locks, dams) containing and guiding the water of the Rhine to the north and south of the area.
Notwithstanding these efforts, Rijnland remained very vulnerable to flooding, especially from the two large lakes (Leidse Meer and Haarlemmermeer) to the north of Leiden. It quickly became clear that to protect Rijnland from this danger, cooperation was necessary with the terrestrial authorities of Kennemerland, to the north of Rijnland, so that a dam and a sluice could be built at the hydrologically most propitious location; along the edge of the open mouth of the Rhine to the north of Haarlem. This cooperation is the first tangible sign that water management has its own rules and its own geography, which do not necessarily follow those of politics or administration. One cannot safeguard against flooding if there is no unified management. The risk is so great that differences of opinion lead to disaster. Hence, for the purposes of water management, and water management only, the southern part of Kennemerland soon became part of Rijnland. A typically Dutch solution was found: to create a dedicated “water authority,” the Hoogheemraadschap, which could impose its power on all the other political and administrative authorities within its territory, including the highest, but only in so far as water issues were concerned. From this point forward, there were two Rijnlands, that of the baljuw (the highest civil administrator representing the count), and that of the dijkgraaf (not accidentally called the “count of the dijken.” (The territory of the latter (marked by a dotted line in Figure 10.1) exceeded that of the former.)
The Early Modern Period: Land Is Turned into Water
When drained, peat is incredibly fertile, as it consists entirely of decaying or decayed organic matter. Once the medieval water problems at the regional scale had been solved, therefore, the area very quickly became a rich and intensively cultivated agricultural zone. But maintaining the agricultural intensity depended on the ability to continually drain the land. Between plots of cultivated land, narrow ditches (sloten) were dug to drain them. These drainage ditches ended at larger artificial or natural waterways, evacuating excess water to the main streams or canals crossing the territory of Rijnland.
As a result of the shrinking of the peat inherent in this loss of water and the oxidation of the organic material due to the intensive cultivation, the surface of the peat descended about 1 m per century, coming closer and closer to the subsurface water table. Because the land became wetter, its fertility declined, as did the yields of the farmers cultivating it. A process was set in motion that ultimately resulted in the surface of the land descending below that of the water. Urgent solutions were needed, again requiring major investments.
As a consequence, levees were built on both sides of the draining waterways to prevent the land from flooding. But to remove excess water, it now had to be moved up and away, instead of downward. To solve that problem, horse- or wind-driven watermills were introduced in 1408, which pumped the water up from the drainage ditches into the major waterways. As a result, a huge number of windmills dotted the landscape.
The lowering of the land surface with respect to the water table also changed the economy of the area. The local reduction in the cereal yield occurred at a time when, around the Baltic, grain was cheap and easy to obtain. This stimulated trade in the small towns, which until then had heavily relied on fisheries. Hence, it became more attractive to let the land (now often soggy) revert to pasture for grazing cattle and sheep. Milk and butter, as well as meat, fetched good prices in the growing towns of the area, and required much less labor than cereal cultivation. In turn, this forced many marginal farmers to find other means of subsistence. Some adopted other rural professions, such as fishing, but many of them moved to the towns, where there was demand for cheap labor in such typical urban activities as trade and industry. Others manned the ships that enabled a substantive growth of commerce from the cities.
The fourteenth to sixteenth centuries saw a very important expansion of urbanization in the area, under the impact of rapidly growing long distance trade and the industrial production of trade goods. Continued misery in rural areas maintained the influx of poor peasants into the cities and kept the price of labor low, thus stimulating shipbuilding and other crafts and industries. which, in turn, drove the rapid urban growth. In particular, the Dutch coastal towns of the thirteenth century became involved in trade between the Baltic countries, Great Britain, and the Atlantic coast of France. They brought dried fish, pelts, and other Nordic items to Britain and France, exported British wool to Flanders, and Flemish (woolen) cloth to France and the Baltic, as well as transporting wine from the Garonne area in Aquitaine to both Britain and the Baltic. As that trade intensified, the Dutch coastal towns of Leiden, Haarlem, and especially Amsterdam grew rapidly and increased the production of their own trade goods.
The industries that thus emerged needed fuel, and by this point most of the original Holtland had little forest left. Indeed, the only locally plentiful fuel was the (dried) peat that was sold in the form of turves for heating and industrial production, such as pottery-making. Consequently, the price of turves increased drastically, and more and more farmers reverted to digging away their land and selling it as fuel. Relatively quickly, this created surfaces of open water, which, in turn, became a danger to the remaining land by undermining its stability and subjecting it to flooding in stormy weather (Figure 10.3).

Figure 10.3 Detail of a map of a peat exploitation area in the Zegwaard. Author and date unknown. The map shows how the land surface is exploited, and how in certain areas, larger surfaces of water are emerging.
In the last phase of the early modern period, major collective activities dealing with aspects of water management were made possible by concerned volunteerism, which was subsequently replaced by wage labor paid for by a land tax imposed by the authorities of what was now the Hoogheemraadschap Rijnland.
As land was progressively dug away, of course, this reduced the tax revenue necessary for the maintenance of the dams, canals, and locks that kept the water under control. Hence, the water authorities tried to limit peat extraction and increase their taxation-based income by forcing those who practiced it to buy other tax-liable land, to compensate for the loss of income when land was dug away to become water. In the process, the water authorities gained control over aspects of land management.
This became all the more urgent because the increase in open water required another reorganization of water management. Improved locks were installed along the northern edge of Rijnland, which opened to drain the land during ebb and closed to protect the land at high tide (Figure 10.4). To realize these improvements, the Hoogheemraadschap extended its control to all the dams and related engineering works in the area.
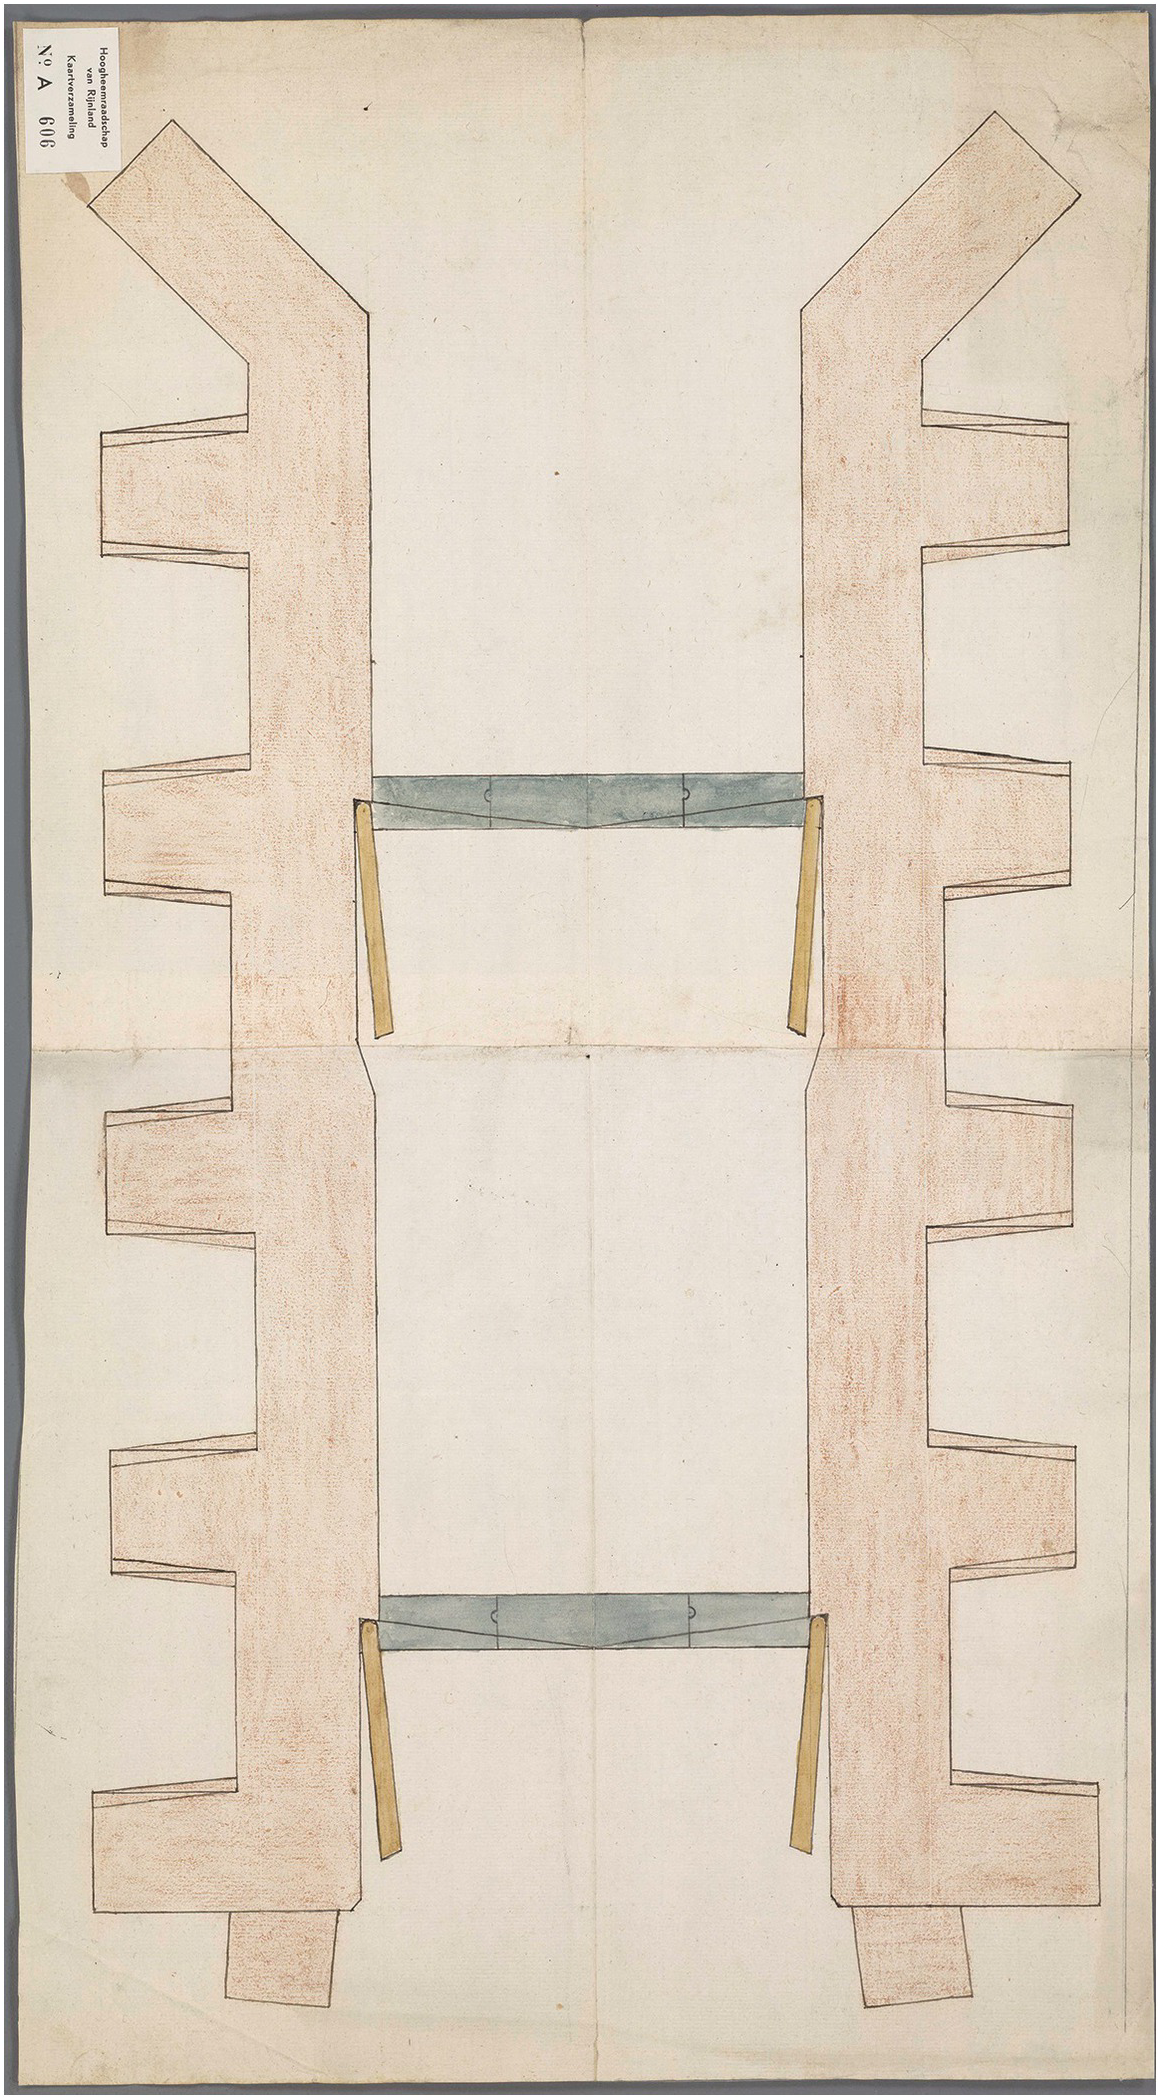
Figure 10.4 Top view of the Western lock in the Spaarndammerdijk at Halfweg by Cornelis Cornelis Frederixzoon (1556). The area to be drained is to the north of the lock (top of the illustration). When it is low tide to the south, the lock opens automatically and allows the water to flow out of the drained area. At high tide, the lock closes automatically, preventing water from flowing in.
The ‘Golden Era’: Water Is Again Transformed into Land
In the Netherlands, the period 1550–1650 is commonly called the Golden Century. It is the era in which the Dutch gained their freedom from Spain through a war that lasted eighty years (1568–1648), while the Dutch merchant fleet vied with the British for control of the oceans and Dutch merchants, particularly from the western part of the country (Holland and Zeeland), founded trading posts and colonies around the world (Dutch East Indies, Southern Africa, Brazil, Eastern North America, etc.). The Dutch coastal cities grew exponentially, and Amsterdam became one of the capitals of the world. Many urbanites profited from the rural poverty by purchasing tracts of agricultural land, grassland, or peat. From this point onwards, the towns had a direct economic interest in the countryside, and they vied with the Hoogheemraadschap for control over it. In the meantime, the Hoogheemraadschap itself ran into financial problems. An agrarian crisis in the first half of the seventeenth century occurred in parallel with a decline in available peat. As peat became the dominant source of income, the next predictable step was to impose a tax on peat rather than on land. Rising urban wealth and the need to feed a rapidly growing urban population in the seventeenth century led to a rapid increase in grain prices in the 1660s, again tipping the balance between agriculture and stockraising. For a period of some thirty years, agriculture once again became profitable. Hence, some of the (artificial) lakes in Rijnland and other parts of Holland were pumped dry, by first digging a canal around them and then installing at their edges batteries of windmills, each of which lifted the water a little higher until it could eventually be dumped into the canal surrounding the drained area (Figures 10.5a, b). After such an area had been laid dry, drainage ditches were dug across it in a rectangular pattern to ensure the maintenance of a low water table. The fertile clays thus laid bare were quickly turned into rich cereal fields.
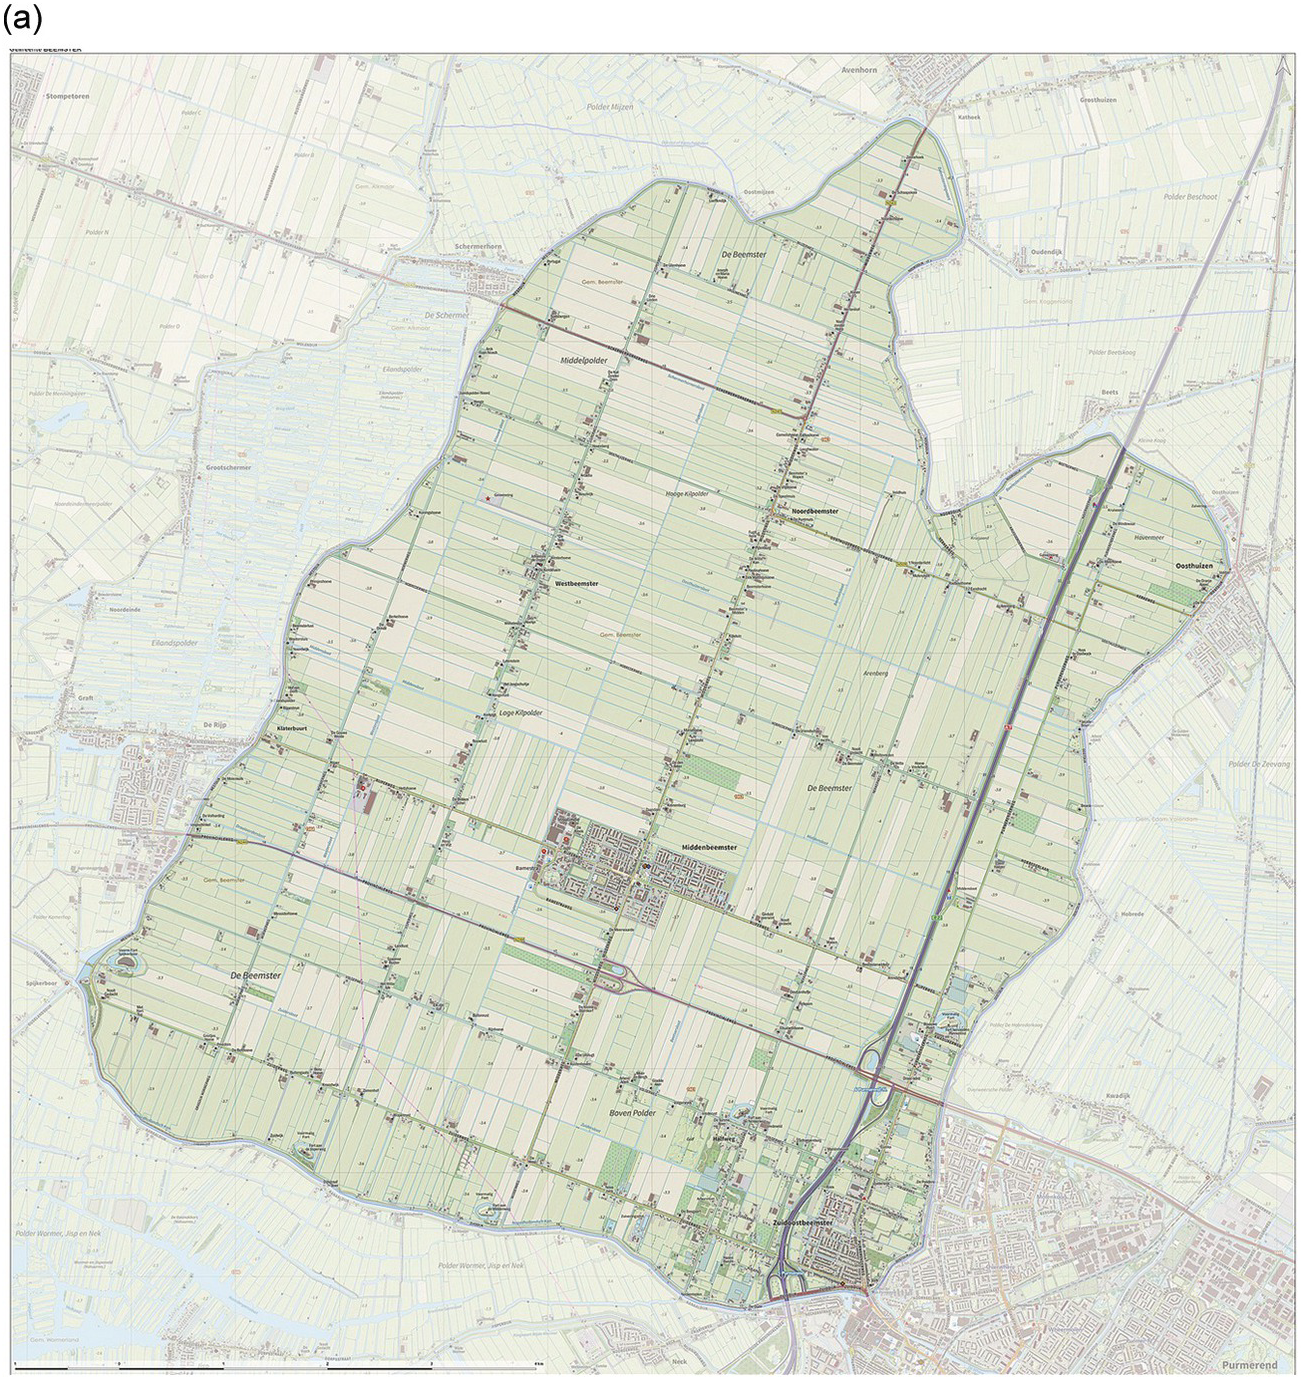
Figure 10.5a Topographic map of the Beemster polder in the Netherlands in 2015. One clearly sees the canal surrounding the polder, which served to drain it (and now keeps it dry), and the rectangular spatial organization of ditches that connect to the surrounding canal. At the time of drainage, the water was removed by windmills, as in Figure 10.5b; now it is removed by modern pumps.
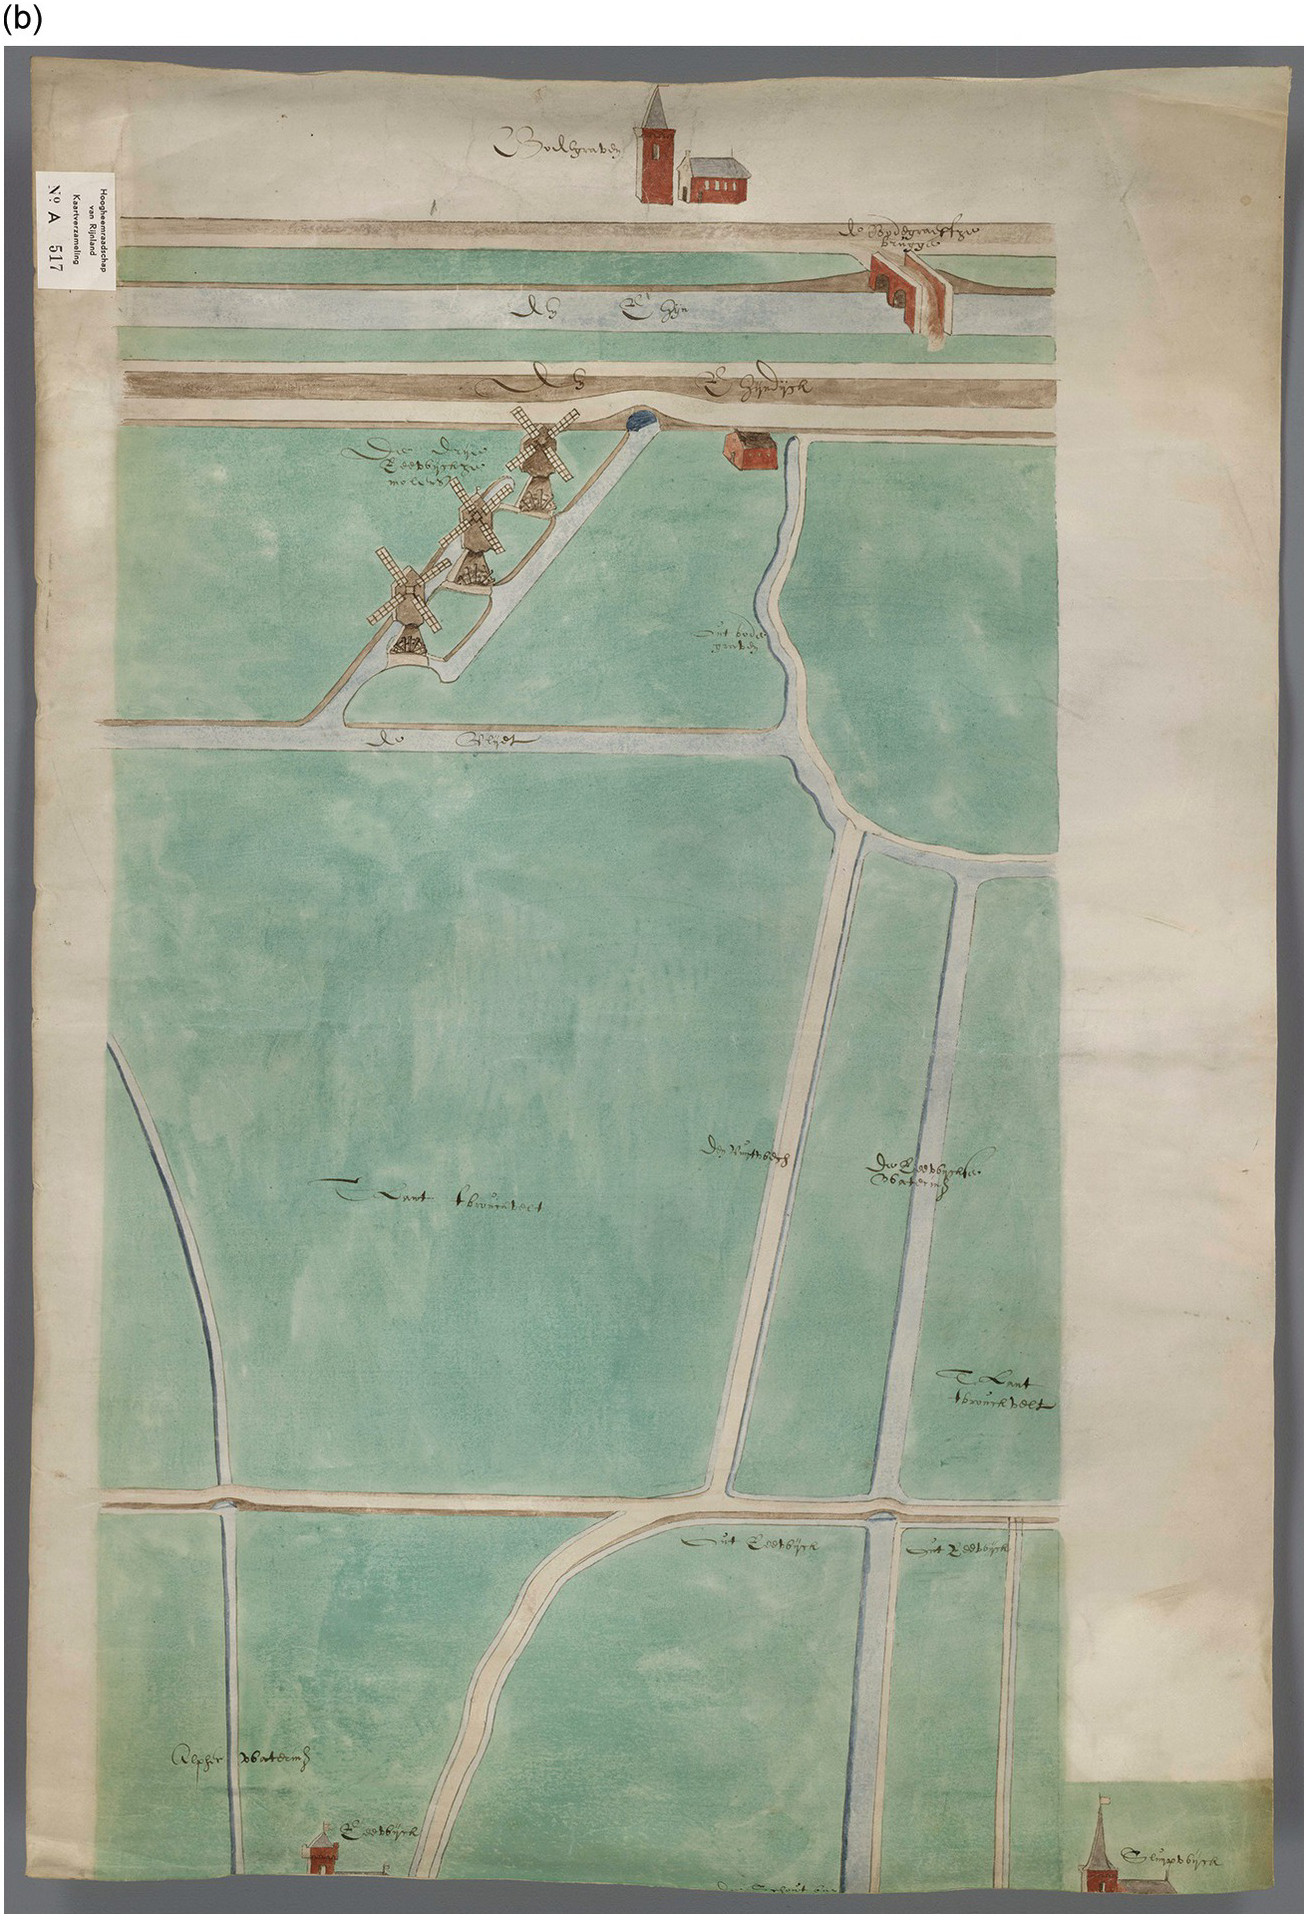
Figure 10.5b Set of three windmills near Reeuwijk. Author and date unknown. Three windmills are required to pump the water from the polder into the drainage canal surrounding it.
The investment needed to do all this, however, was beyond the means of what remained of the impoverished rural population, nor could it be funded by the Hoogheemraadschap as long as its principal source of income was the peat tax. Private investment by rich urban shareholders, associated for this purpose in ad hoc partnerships, took over the financial burden, enabling urban control over rural land.
In 1675, just after a major war (1672–1674) between the Netherlands (or more specifically Holland) on the one hand, and Britain, France, and two German principalities on the other, the main dam protecting the Rijnland against flooding broke on two occasions. Similar events occurred again in the following century. Delayed maintenance may well have been a factor because the Hoogheemraadschap was no longer solvent.
The disaster of 1675 was of such proportions that the towns (led by Amsterdam, Haarlem, and Leiden) loaned the Hoogheemraadschap the necessary funds for repairs and improvements. Subsequently, the Hoogheemraadschap began raising funds for maintenance and investment by issuing bonds against future revenue from the peat tax.
The cities’ inhabitants, many of which already owned land in Rijnland, subscribed to most of these bonds. The loans set in motion a process whereby the cities and their inhabitants ultimately established control over the Hoogheemraadschap and the rural environment that surrounded them.
Regaining Lost Ground
After about 1700, agriculture did not return to profit in a major way until the second half of the eighteenth century. At the same time, underwater peat exploitation neared the limits of what was feasible with the technical means available at the time. Income from peat (and the peat tax) declined, while protecting the banks of the lakes became an increasingly urgent and costly affair. Inhabitants and authorities were therefore faced with the question of whether it was worthwhile to continue exploitation of the area.
Deserting it would have led to major inundations and other problems. The solution chosen was to further transform water into land. The few attempts at draining small man-made lakes in the seventeenth century had demonstrated that the rich soils at the bottom could be profitably used to produce grain, meat, milk, and milk products. Hence, Rijnland and other authorities devised schemes to fund the drainage and reclamation of many of the lakes, borrowing money against future tax freedom or investing some of their own funds. The positive results of this venture initiated a phase of major land reclamation focused on lakes of limited depth and size all across Rijnland and, in effect, all over Holland.
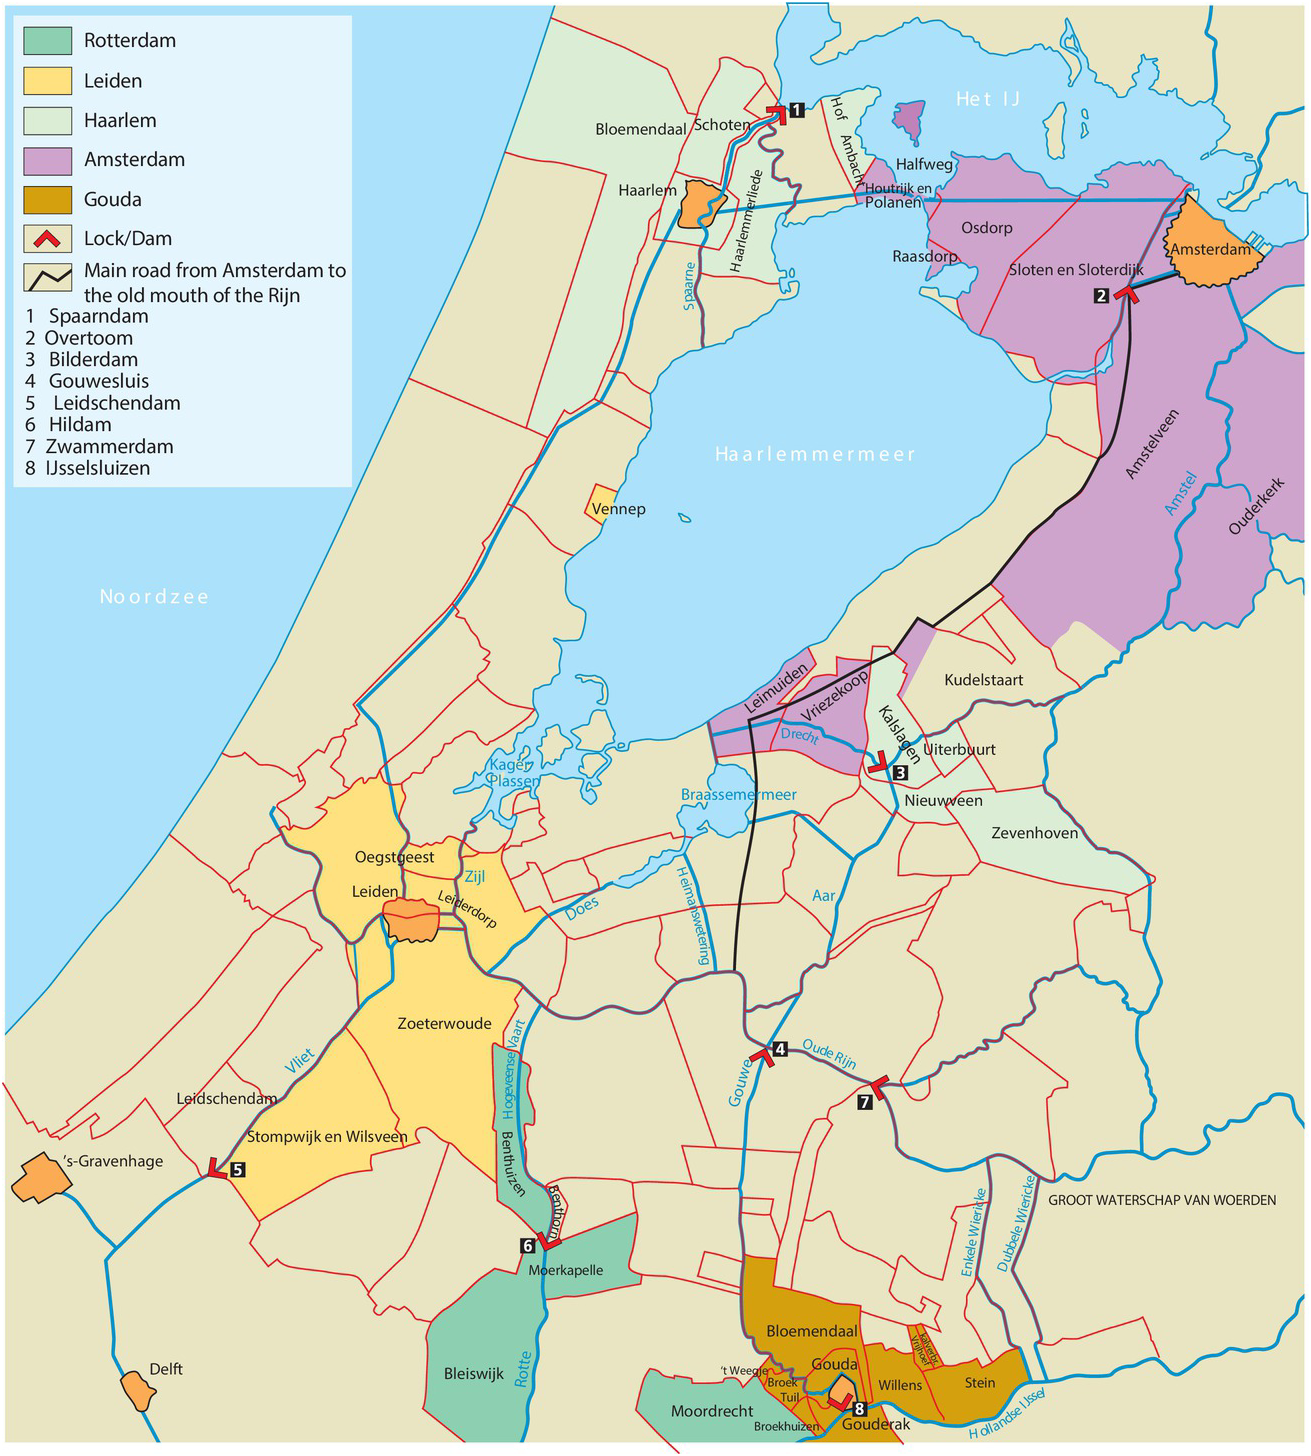
Figure 10.6 Owing to the insolvency of the Hoogheemraadschap it could not repair the dams; the cities Haarlem, Leiden, and Amsterdam took control over the whole area.
During the eighteenth century, plans to drain the (huge) Haarlemmermeer were considered several times. This large surface of open water was an important part of the transportation network, yet its size and shallow depth made it very dangerous to shipping whenever there were high winds or storms, and its edges were regularly inundated. In particular, with strong western winds, its eastern edge became a real cemetery for ships (Figure 10.7); hence the name for Amsterdam’s airport, Schiphol, which literally means “hell for ships.” But the huge costs involved could not be borne by the Hoogheemraadschap or other local or regional authorities, in part because the eighteenth century was a much less wealthy time for the Netherlands than the preceding one. Time and again, the plans were postponed.
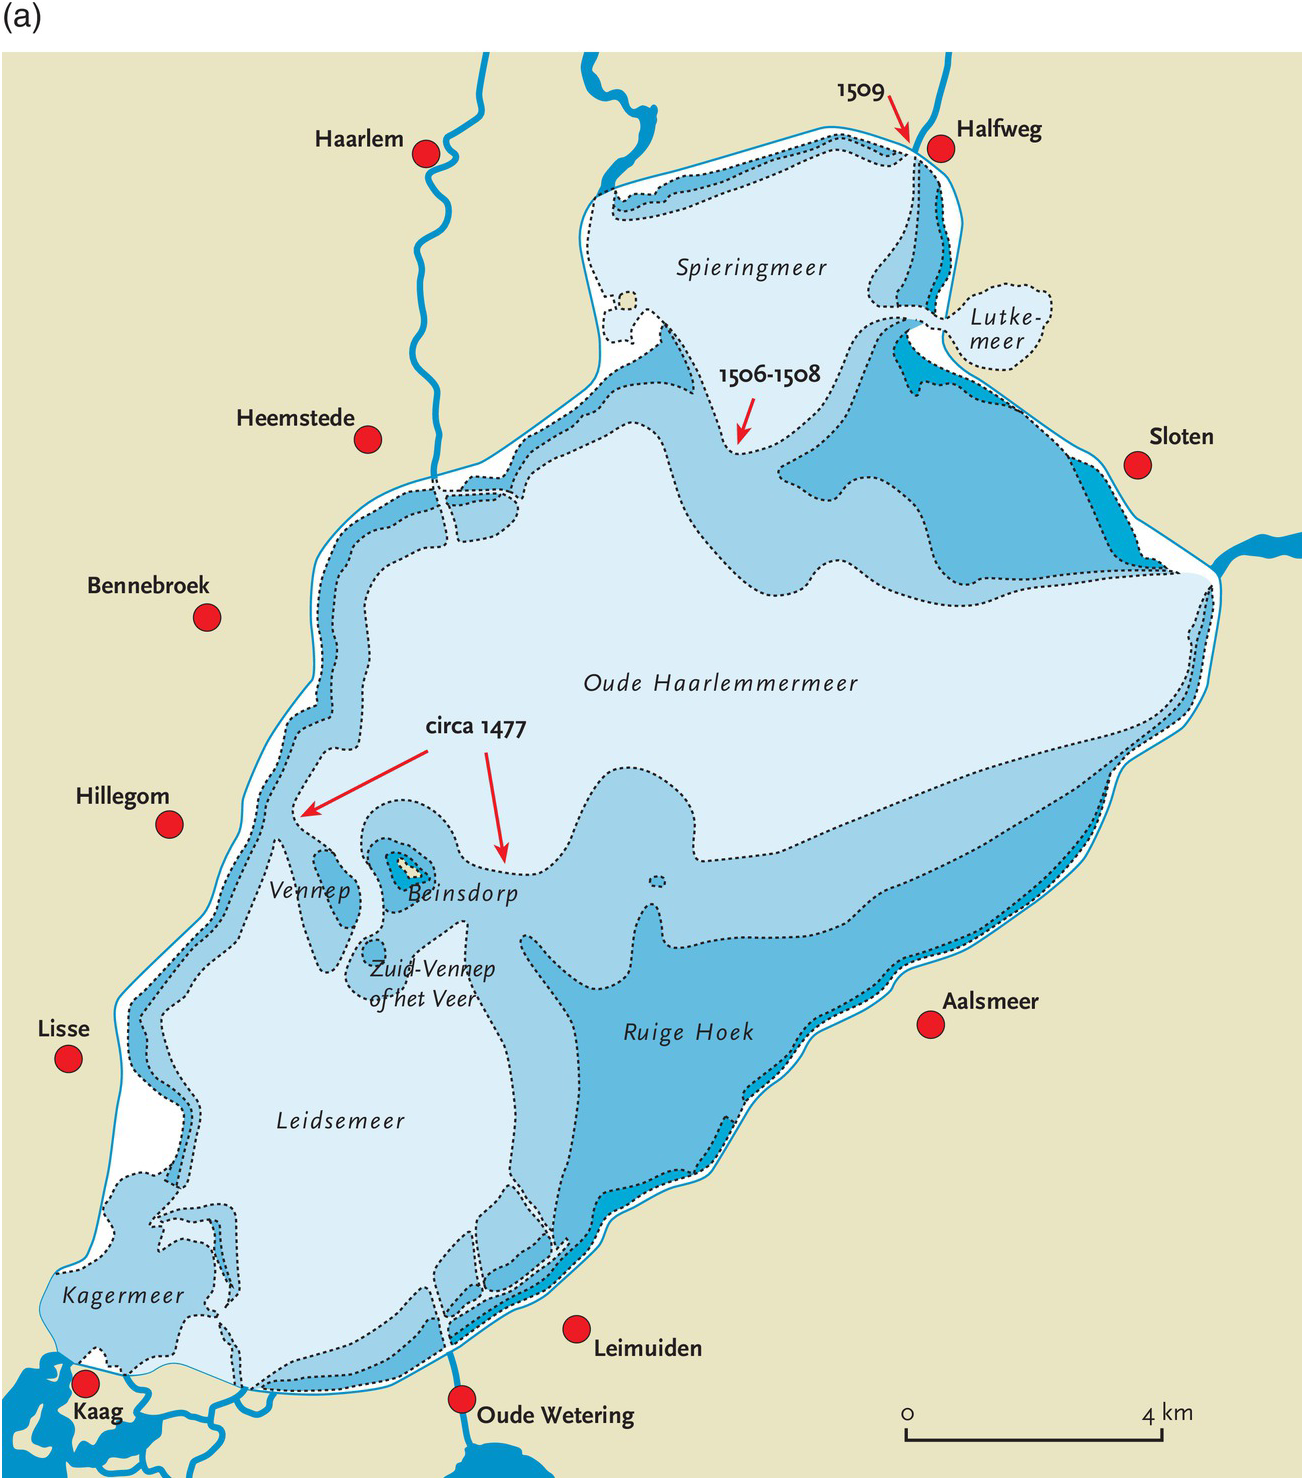

Figure 10.7 Peat excavation weakened the edges of the lake, and open water caused wind and water to batter them (Figure 10.7a). The lake doubled in size between 1250 and 1848, and with a strong wind from one direction the water level on the opposite shore could be driven up a meter or so, inundating the land(Figure 10.7b).
After the French occupation of 1795–1814, the federation of provinces that constituted the Republic of the Seven United Netherlands (Republiek der Zeven Verenigde Nederlanden) was replaced by a kingdom that included Holland, Zeeland, and the five other provinces. Simultaneously, in the East Indies, a novel landholding and exploitation system (in the form of plantations) substantively increased the income of the nation and the state. The state now had the resources needed for the project, and the invention of steam engines to drive the pumps made draining the Haarlemmermeer technically feasible.
But it was not until a furious hurricane in November 1836 drove the waters as far as the gates of Amsterdam, and another on Christmas Day the same year that sent waves in the opposite direction to submerge the streets of Leiden, that the mind of the nation seriously turned to the matter. On August 1, 1837, King William I appointed a royal commission of inquiry, and in the following May the work began. A canal of 61 km was dug around the lake, fittingly called Ringvaart (Ring Canal), to enable water drainage and boat traffic that had previously gone across the lake. The dug-out earth was used to build a dike between 30 and 50 m wide around the lake. The area enclosed was more than 180 km² and the average depth of the lake was 4 m.
As the area had no natural drainage, around 800 million tons of water had to be pumped into the Ringvaart by mechanical means to transform it into land. Unlike the historic practice to drain polders using windmills, steam powered pumping stations were used, a first. Three steam pumps were built: the Leeghwater, the Cruquius, and the Lijnden.
Pumping began in 1848, and the lake was dry by July 1, 1852. Rather than being incorporated into any particular existing administrative organization, it was given the status of an independent municipality within the province of Noord-Holland. The state thus directly assumed control over the newly reclaimed territory.
With the reclamation of the Haarlemmermeer, the history of water and land in Rijnland comes to a provisional end, as no major reversals or new reclamations have subsequently occurred in the area.
The Aftermath
But elsewhere in the Netherlands, well into the twentieth century, this project was followed by other, increasingly ambitious, ones. Initially, these reclamation projects were concerned with large parts of the so-called Zuiderzee, the large open water in the center of the country. In 1929, it was closed off from open sea by a dam connecting the provinces of Noord-Holland and Friesland. Draining the first of the polders in what was now called the IJsselmeer (ex-Zuiderzee), the Wieringermeerpolder, was completed in 1930. During World War II, this was followed by completion of the Noord-Oost Polder (1942). After the war, two huge new polders were also reclaimed, respectively called Oost Flevoland and Zuid Flevoland. In total, 1650 km2 of land were reclaimed in the 1950s to 1980s).
A last major flood occurred in 1953 when large parts of Zeeland and Brabant were inundated by a combination of an extremely high tide and a strong westerly storm. This came at a time when the dams protecting these areas had been weakened by lack of maintenance during World War II and its aftermath.
It led to a major project (the so-called Delta-werken) that now protects the area, but the idea to reclaim more land was abandoned when the Netherlands opened its trade borders more and more to agricultural products from elsewhere in Europe in the context of the emergence of the European Union (EU) (Figure 10.8).
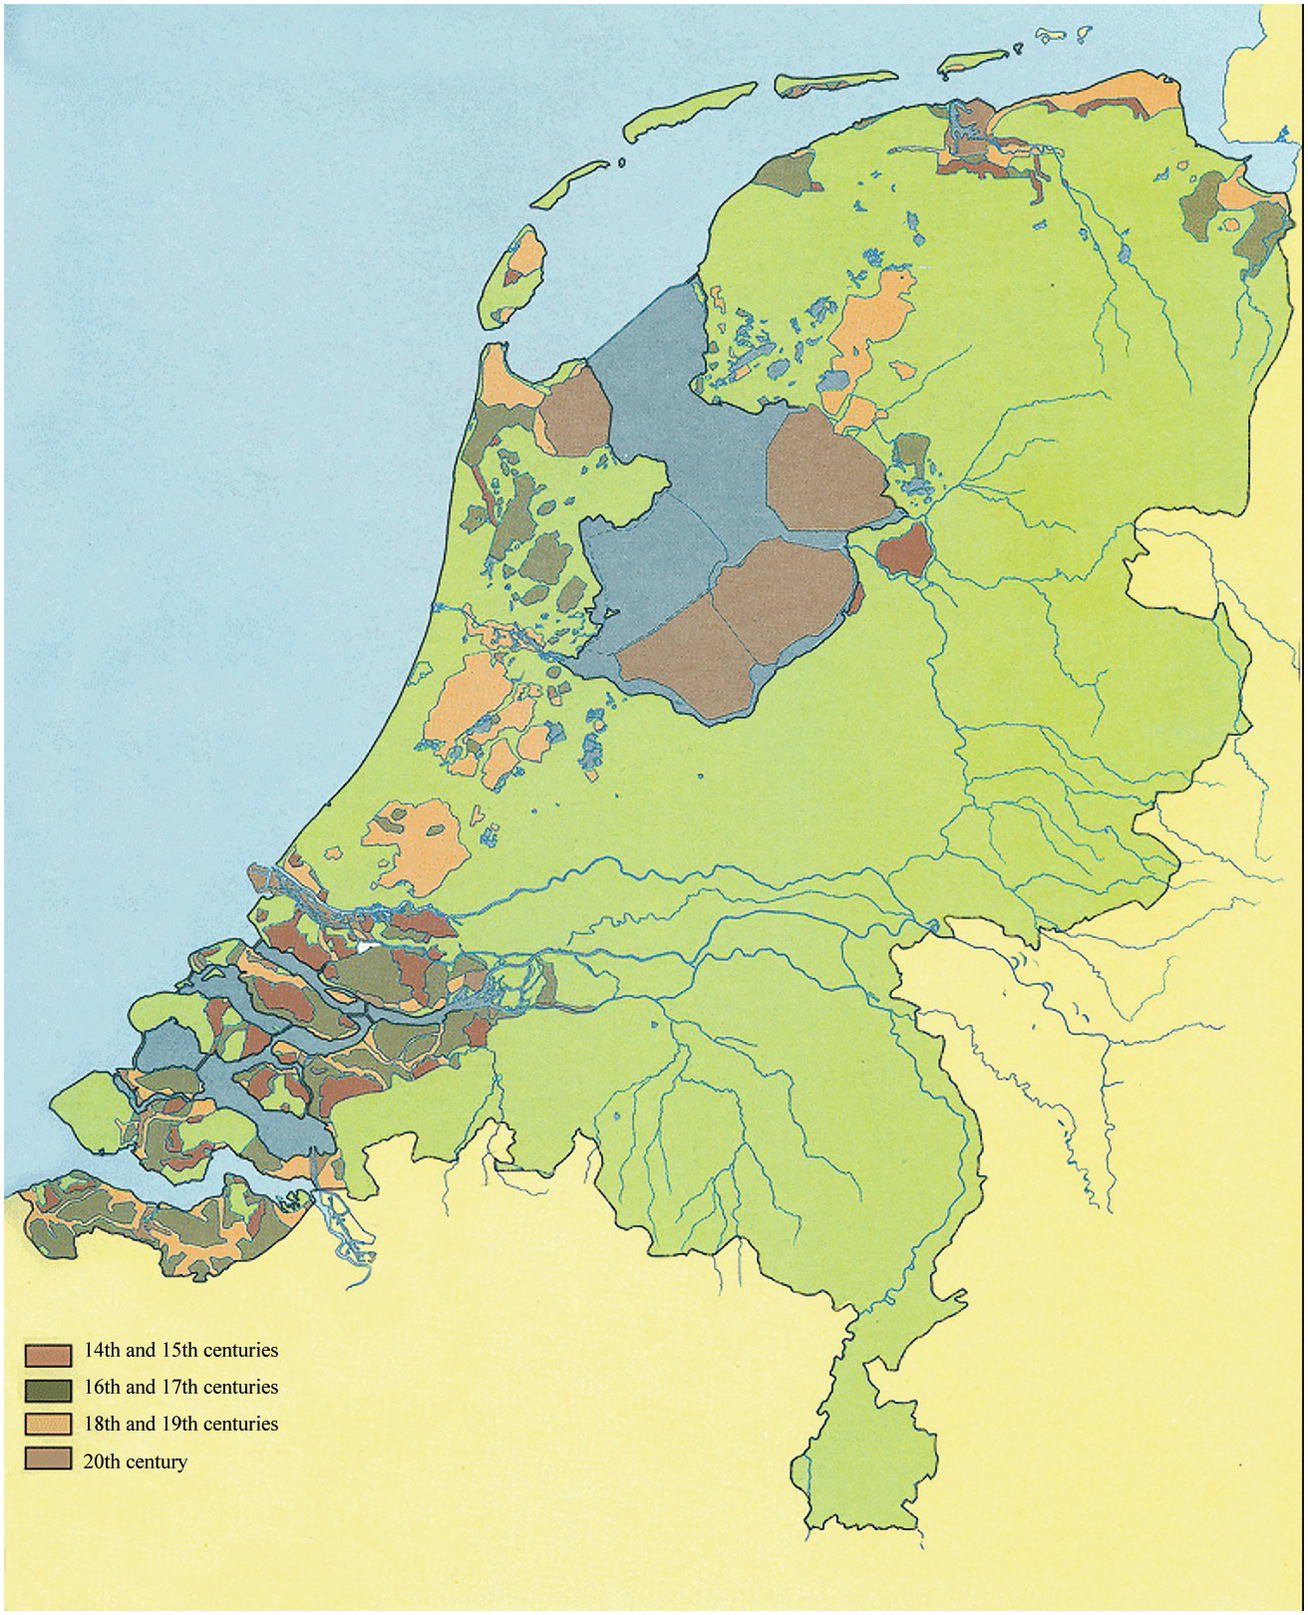
Figure 10.8 Overview of the areas of the Netherlands that were artificially drained in various periods of the country’s history.
Both in the case of the reclamation projects in the IJsselmeer and in that of the Delta-werken, only the national government had the means to undertake them, and it therefore exerted its authority over them. In effect, from its first emergence out of the sea until 1986, the whole of Flevoland and its inhabitants was subjected to the authority of a single person appointed by the government, the Landdrost!
Summary and Conclusion
The outline of the story recounted here is well known; the western Netherlands were created, as well as peopled, by its inhabitants. Water was initially a threat from which to flee and then something to be contained. The point is that not only the land itself, but new technologies, institutions, a new spatial organization, and much of Dutch culture emerged from the interaction between people and water.
The need for drainage and containment first led people to collaborate and to develop new techniques to deal with the dangers of both short-term floods and long-term degradation of terrestrial resources. The dynamics coupling environmental limitations and social initiatives resulted in newly invented management techniques that addressed and frequently solved differences of opinion and created powerful institutions. Thus, the first supraregional authority, the Hoogheemraadschap, under its president, the dijkgraaf, was created in response to the water management issue – an issue that could not be left in the hands of much smaller political principalities.
In the struggle, water was transformed into land for cultivation and grazing, and this land was then transformed into lakes by selling it in the form of turves to fuel hearths and industries. Ultimately, these lakes were drained to recreate agricultural land when the need was felt.
As a result, the surfaces of large parts of the western Netherlands were lowered to between 1 and 6 m below sea level, creating a situation of extreme vulnerability to any sea level rise that might be caused by climate change.
One of the important lessons of this story is that a kind of cyclical “Tragedy of the Commons” is taking place. It evidences the ongoing battle between individuals, institutions creating opportunities for individuals by containing the water, individuals creating new water-related threats, the calls for strengthened institutions, etc.
Individuals first colonized these low-lying parts of the delta. As they drained it for cultivation, or to build small artificial mounds to keep their houses and animals dry during floods, other longer-term threats emerged that could not be dealt with individually. Large-scale drainage systems were dug, and instead of building individual artificial mounds, people began collectively to protect land against floods by building dikes. In the process, they created institutions such as the Hoogheemraadschap to guard their collective interests. Once that was done, and cultivation enabled people to make a good living, land degraded and the economy arose and the economy shifted to grazing. Grazing is less demanding of the land and the drainage infrastructure than agriculture. When land became unsuitable for even that form of exploitation, the same individual interests transformed land into fuel. Thus, it created open water and undermined collective safety as well as the institutions that had been put in place to protect against the water.
From another perspective, it is all about spatial and temporal scales. Ultimately, when water became a local and regional threat once more, and there was insufficient land to provide food, the tendency was inverted by non-rural individuals who saw the benefit in, and provided the means to, collectively transform water into land. These means were derived from activities elsewhere, first in different urban sectors of the regional economy (successively fishing, regional trade, industry, and banking) and later on the high seas (long-distance trade and piracy), or, after 1815, in the Dutch colonies. In the process, the area became increasingly dependent on other parts of the world, other resources, or other feedback cycles (the spatial scale of the system was stepped up each time a disaster threatened or hit). Thus, the reclamation of the Haarlemmermeer was funded in part by the increasing stream of riches gained in the Dutch East Indies, where a system of intensive plantation agriculture for the European market had been instituted. In turn, the reclamation of Flevoland was made possible by the economic boom after World War II, to which the birth and growth of the EU was also closely related. In the end, the integration of the EU made further drainage uneconomic because the agricultural products that could be grown there were now made available more cheaply elsewhere.
As long as the local and regional cyclical lows did not coincide, the highly artificial and very costly system could be maintained. Local profits could be made thanks to investment of funds gained elsewhere. In Rijnland this was the case when either urbanites or the cities as institutions collectively intervened to fund the protection of land against water. Nevertheless, if there was a temporal overlap between lows in both regional and more global cycles, problems hit with redoubled severity, such as in the eighteenth and the first half of the nineteenth century. Then, disaster could only be averted by yet another increase in the spatial and the temporal scale of the system. For example, by invoking the help of the national government to drain the Haarlemmermeer, the frequency with which problems hit was dramatically reduced and both the material and institutional infrastructure that maintained the polder in a steady state was strengthened. In the process, the scope and scale of threats and institutions bootstrapped themselves to eventually encompass all of the Low Countries, shaping much of Dutch society to this day.
The story beautifully illustrates the role of risk perception in generating unintended consequences in environmental management by society. In attempts to deal with frequently occurring events in the interaction between people and their environment (such as the seasonal inundations that led people to invent artificial mounds), human intervention leads to new perspectives and new actions (such as the enclosing of whole areas by artificial levees). However, these changes frequently engendered new risks, of which neither the nature nor the frequency was known. When these risks materialized (in the form of decadal or even centennial floods, for example), other means were sought to deal with them, and the changes wrought in the environment introduced yet more risks – again of unknown nature and frequency. The investment to maintain these solutions could prove too costly for the local population, resulting in the additional risk of an area becoming dependent on another region’s economic cycles.
In each instance, the solution to an imminent challenge was based on interventions in the environment that triggered other challenges, both environmental and societal, down the line. The latter were less frequent and involved a larger timescale. As a result, over time the risk spectrum shifted from relatively frequent, spatially limited risks to less frequent but more consequential risks. Ultimately, the accumulation of risks with unknown, longer, temporalities led to another set of risks that could burst upon the scene simultaneously: a time-bomb or crisis, such as the current environmental crisis.
A conceptually similar story, about the emergence of modern finance and long distance trade in Renaissance Florence, has been elaborated by Padgett and others in great detail (Padgett & Ansell Reference Padgett and Ansell1993; McLean & Padgett, 1977; Padgett Reference Padgett, Arthur, Durlauf and Lane1997, Reference Padgett, Casella and Rauch2000; Padgett & Powell Reference Padgett and Powell2012), based on the analysis of 50,000 lives of Florentines in that period. It shows wonderfully how social relations, initially around city squares and plazas, led to financial exchanges, the availability of more capital, the need for better accounting (leading to double-entry bookkeeping), longer and longer distance trade, and many other aspects of both financial and power relations. It also shows the power of the complex systems approach in promoting understanding of societal dynamics.
In addition, as part of the ARCHAEOMEDES project, Christina Aschan-Leygonie did an interesting and related study on why, in the Haut Comtat in France, a crisis in the 1860s was quickly resolved and another one, a century later, was not (van der Leeuw & Aschan-Leygonie, Reference van der Leeuw, Aschan-Leygonie, Svedin and Lilienstrom2005). I refer to this in Chapter 6.
Although the exact nature of the changes that emerge in the process of innovation may be unanticipated, the fact that changes will emerge is far from unexpected. Similar situations and chains of events have occurred whenever and wherever people tried to impose particular solutions to the challenges posed by the environment. They seem profoundly inherent in human interactions with the environment, as those interactions are often based on making a distinction between us and our environment, although that environment is not ours to possess or on which to impose our solutions. In the current extreme form, that is a particularity of western culture that has become more and more prevalent since the fourteenth century, as outlined in Chapter 3.
Maybe we should take a closer look at the worldview of such societies as the Achuar, who do not make such a Manichaean distinction between themselves and their environment (Descola, Reference Descola2005), and from that starting point attempt to reconstruct how our present worldview might have evolved from a position like theirs. To conclude, let us therefore spend a little time looking at how we might indeed change our perspective so as to get a better grip on these dynamics.
First of all, and inherent in the Complex Adaptive Systems perspective, the point of view that we choose should be an ex-ante perspective rather than the much more common ex-post perspective. To understand new phenomena, we should be following the process of their emergence, rather than studying the origins of the current situation. We should develop a perspective that goes with the arrow of time, rather than against it. A necessary corollary of that position is that our approach should not reduce the number of dimensions taken into account in order to generate understanding (as much of science still does), but should enhance the number of dimensions taken into account. While studying to learn from the past, we should do this in order to learn for the future. This advocates for methodologies that inherently increase uncertainty and require us to embrace it, a reframing of uncertainty as positive and an advance. Needless to say, in practice, both in the academic domain and in the world of application, one encounters enormous resistance to this idea.
Part of this is the fact that we must move away from using one or a few causal chains to explain the present, and in general start thinking in multiple alternative scenarios (Bai et al. Reference Bai, van der Leeuw, O’Brien, Berkhout, Biermann, Broadgate, Brondizio, Cudennec, Dearing, Duraiappah, Glaser, Revkin, Steffen and Syvitski2015). By evaluating these, and in particular by comparing the unintended consequences of the choices made (by individuals or systems) with those that would have occurred had another option been chosen, we will get a much better grip on the relationship between choices and unintended consequences, and thus reduce (unperceived) risks as we move into the future.
Crucial in all this is the fact that we have not been able to do all this until now – indeed, our centuries-long intellectual tradition, the inherent limitations to our information processing, as well as other factors militate against such an approach. But with the information age, a number of barriers may be about to be taken away, or at least reduced. For one, modern terabyte data-dense monitoring may overcome, at least to some extent, the under-determination of our ideas by our observations. Secondly by (much) more closely integrating computing into our societal information processing than has been done to date, we may be able to take into account many more dimensions of the phenomena and processes we deal with in our decision-making. But for that to happen, we must begin to harness computing in a different way, emphasizing our capability to move from lower to higher dimensionality as well as in the other direction (as we do now). This amounts to creating the tools to move from the past to the future as well as in the reverse direction. Essential in developing this capability is the need to use much more extensive modeling, and in particular agent-based modeling to enable us to understand how an ensemble of individual actions creates collective patterns and processes (van der Leeuw et al. Reference van der Leeuw, Costanza, Aulenbach, Brewer, Burek, Cornell, Crumley, Dearing, Downy, Graumlich, Hegmon, Heckbert, Hibbard, Jackson, Kubiszewski, Sinclair, Sörlin and Steffen2011). If we are able to achieve that at least to some extent, it may help quell fears about increasing uncertainty. If you know with certainty that you have to navigate through a hundred different uncertain possible outcomes, this is better than not knowing the scale of uncertainty in your future, and this is especially relevant if you are transitioning from the comfort of an illusory belief that there are just three or four possible outcomes.
Introduction
In Chapter 8 I presented an overview of my vision of the long-term evolution of human societies with an emphasis on the transition from a biologically constrained cognitive evolution to a socially constrained one. In Chapter 9 I introduced the concept of dissipative flow structure as a tool to understand that information flow drives the coevolution between cognition, environment, and society. In Chapter 10, I drilled down into history and showed how technological advances in a region, made necessary by environmental circumstances and in interaction with the economy, transformed society and its institutions in a continuous back and forth between solutions and the challenges that these raised. Ultimately, they lead to the current landscape, technology, economy, and political organization of the Western Netherlands. In this chapter I want to step back again to a more general perspective and emphasize the nature of the principal, different system states that occurred in the second, sociocultural part of the long-term trajectory outlined in Chapter 8. This will show the role of changes in information processing structures that are responsible for such transitions.
Ever since the classic series of proposals by Sahlins and Service about the evolution of societal organization that appeared in the 1960s (Sahlins & Service Reference Sahlins and Service1960), it has generally been acknowledged that there have been a number of transitions in societal structure as societies grew in size and complexity, even though the details of these transitions have been open to much discussion. In the perspective that I am developing in this book, such transitions are essentially transformations of the structure of their information processing apparatus. In this chapter, I will look in some detail at these structures from an organization perspective.
Information Processing and Social Control
The wide literature on information-processing, communication, and control structures in very different domains presents us with (for the moment) three fundamentally different kinds of such structures. These differ notably in the form of control exerted over the information processing, regulating who has access to the information and who does not, but also determining to an important extent these structures’ efficiency in processing information and in adapting to changing circumstances, such as the growth of networks, or to various kinds of external disturbances. These differences have a number of consequences for the conditions under which each kind of communication structure operates best. I will first describe some of these consequences for each of these types of control structure.
Processing under Universal Control
When the universe of participating individuals is small enough that all know each other, messages can be sent between all participants. Even though, inevitably, some members of the society associate with each other more than others, the contacts between individual members are so frequent that information can spread in myriad ways between them. Communication therefore does not follow particular channels, except maybe in special situations. Moreover, because so many different channels link the members, there are no major delays in getting information from one individual to another. If a channel is temporarily blocked, a nearby channel, which is hardly longer, will convey the information immediately (Figure 11.1).
Figure 11.1 Graph of egalitarian information processing with universal control: all individuals are communicating with all others.
In addition, there is no control over information. Because each member of the group receives information from a number of different directions, and sends it on in different directions as well, there is ample opportunity to compare stories and thus correct for biases and errors. Although it takes time, groups in this situation usually manage eventually to have a highly homogeneous “information pool” on which to base their collective decisions.
The situation is that of small group interactions described by Mayhew and Levinger (Reference Mayhew and Levinger1976, Reference Mayhew and Levinger1977) in terms of the relationship between information flow, group size, and dominance of individuals in the group. It applies to egalitarian societies, in which control over information is very short lived and is accorded to specific individuals as a function of their aptitude to deal with specific kinds of situations, because these individuals have a particular know-how of the kind of problem faced. As a result, no single individual or group can ever gain longer-lasting control over such a society. In such situations, the homogeneity of the information pool is further aided by face-to-face contact. In such a contact situation, it is possible for the sender and the receiver of messages to communicate over many channels: words, tone of voice, gestures, eyes, body language, etc. Communication is therefore potentially very complete, detailed, and subtle. Mutual understanding can be subtle and can connect many cognitive dimensions, even though these remain relatively fuzzily defined.
Mayhew and Levinger (Reference Mayhew and Levinger1976, Reference Mayhew and Levinger1977) also show how the amount of time needed for each interaction between the members of the group effectively limits the size of such groups. The (logistic) information flow curve in a small group rises exponentially with the addition of members, until there is not enough time in the day to talk sufficiently long to everyone to keep the information pool homogeneous. Yet homogeneity is essential for the survival of the group because it keeps the incidence of conflict down. Increasing heterogeneity will immediately cause fission until the maximum sustainable group size is reached again. Johnson (Reference Johnson, Renfrew, Rowlands and Segraves1982) presents a large number of cases of societies organized along these lines. It should be noted that this kind of communication model is thus confined to very small-scale societies. It limits communication to what can be mastered by all individuals in the group and avoids the emergence of any specialized knowledge such as we see in more complex societies, thus also limiting the overall knowledge/information that can be shared. For an ethnographic study that highlights these dynamics, without using the terminology I have adopted, see Birdsell (Reference Birdsell1973).
Processing under Partial Control
When some participants know of all others, but others do not, some people can directly get messages to all concerned whereas others cannot do so. Such asymmetric situations arise when the group concerned is too large to maintain an egalitarian communication system or a homogeneous information pool. From ethnography and history, we know a wide range of societies that communicate and decide in this manner. They are extremely variable in overall size, as well as in the size of their component units, their communications, information processing structure, etc.
Processing under partial control is fundamentally different from universal control over communication and decision-making because it relies both on communication and on noncommunication between members. Members of the group usually communicate with some others, but not with the remainder of the group. The usual form that communications structures take in these societies is a hierarchical one (Figure 11.2), because it is the most efficient way to reduce the number of communications needed to (eventually) spread information from the center to the whole group (Mayhew & Levinger Reference Mayhew and Levinger1976, fig. 8).
Figure 11.2 Graph of hierarchical organization with partial control: some people have more information at their disposal than others.
Evidently, such communication structures generate considerable heterogeneity in the information pool. As stories are transmitted they will inevitably change, and for most individual members of the society there is no way to correct this by comparing stories from a wide enough range of different sources.
But because there is relatively little communication crosscutting habitual channels, few are aware of that heterogeneity. This creates a potential problem: when information spreads in unusual ways, its heterogeneity is suddenly highlighted, causing explosive increases in conflict and strong fissionary tendencies. Suppression and control of information is therefore an essential characteristic of hierarchical systems.
As long as the society needs the communication capacity of its hierarchical control structure to remain intact, that structure is acceptable; but whenever the information flow either drops too low or exceeds channel capacity, the hierarchy will be under stress. In other words, as long as it is experienced as an enabling feature, the delegation of individual responsibility to those in control is acceptable. But as soon as the hierarchy is experienced as a constraint, the members of the group will try to forge links that circumvent the established channels. This starves the hierarchy of vital information and reduces its power and efficiency. Hence, frequent system stresses favor the implementation of hierarchical information flow structures, and such structures have a stake in maintaining the stresses concerned, but also in ensuring that they do not exceed certain levels that would tear the societal structure asunder.
Many essential communication channels in hierarchical systems are longer than in egalitarian ones, so that the risk that signals are lost is enhanced. Communications need a stronger signal-to-noise ratio. What is a signal in one cognitive dimension may be noise in relation to most other dimensions. One way in which to create a stronger signal is therefore to reduce the number of cognitive dimensions to which it refers. This can be achieved by strictly defining the contexts of interpretation, for example by imposing taboos or by ritual sanctioning. The establishment of such reduced-dimension cognitive structures manifests itself in the emergence of specialized knowledge in the group, thus widening the spectrum of knowledge, whether that is technological, commercial, religious, or other.
Processing without Central Control
When none of the participants know all the others, none can send any direct messages to all concerned (Figure 11.3). More importantly, in such a situation people necessarily send out messages without knowing whom they will reach or what the effect will be.

Figure 11.3 Graph of random communication network, without any control, in which all individuals have partial knowledge.
Whereas in our first example everyone was in the know and in our second one some were informed and some were not, in this case everyone is partly informed. People depend entirely on this partial information, which they cannot complete. Their information pool is much more heterogeneous, but because it is homogeneous in its heterogeneity, the situation is relatively stable.
In this situation, there are no set communication channels. Instead, there are multiple alternative channels if information stagnates anywhere or if it becomes too garbled. The system is thus more flexible and therefore more resistant to disruption from the outside; consequently it allows for a larger interactive group and a quantum increase in total amount of information processed. By the same token, no set individuals are in control of the whole information flow, which also makes the situation less vulnerable to individual incidents, such as those that regularly mar succession in hierarchical systems.
But on the other hand, more is demanded of the means of communication. More information needs to be passed, and more efficiently, between individuals who are less frequently and less directly in contact with one another. That is, paradoxically enough, facilitated when communications no longer depend on face-to-face situations in which communication occurs across a wide range of media or channels. Written communications can transcend space and time, and they become important because they fix a signal immutably on a material substrate, reducing down-the-line loss or deformation of the signal. But they also avoid transmitting certain dimensions that can be, and are, transmitted in face-to-face communication, and such communication can thus be more precise and avoid simultaneous transmission of contradictory signals.
This third mode of communication is the one that is generally present in (proto-) urban situations. But there it always occurs alongside universally controlled networks (families and other face-to-face groups) and often together with hierarchical communication networks. The different networks are connected via individuals who function in more than one of them. We will get back to such mixed or heterarchical networks in a later part of this chapter.
Phase Transitions in the Organization of Communication
To understand the differences in information processing dynamic that are responsible for these different kinds of social organization, it is useful to look at them from the perspective of a spreading activation network. That will allow us to begin to answer the following two questions:
How may these different communication structures have come into being?
How are they affected by changes in the size of the group and in the amount of information processed?
Such a spreading activation net consists of a set of randomly placed nodes (representing individuals) that have various potentially active (communicative) states (μ: the average number of connections leaving one node) with weighted links between them (Huberman & Hogg 1987). Their weight determines how much the activation (α) of a given node directly affects others (such as the degree to which messages get across and/or the degree to which people spread a message further, etc.). After a certain time, the action has run its course and the connection between the nodes lapses into “relaxation” (γ)
The behavior of such networks is thus controlled by two parameters, one specifying their shape or topology (μ) and the other describing local interactivity (α/γ: activation over relaxation), an estimate of the volume of information flow being processed. Visualization of the system is dependent on the transformative twists and turns of topology and the curving forms of dimensional nonlinearities to understand its statistical mechanics.
In assessing its dynamics, it is important to be aware of the fact that in such a model the interactivity (represented by α/γ) and the connectivity of the system (μ) are independent variables. In the two-dimensional graph of α/γ and μ, (Figure 11.4), different zones appear that one can identify as characterizing different types of information processing systems by combining different values for the two variables.
Figure 11.4 Phase diagram of a spreading activation net. The vertical axis represents the parameter α/γ and the horizontal axis represents the connectivity parameter μ. Phase space I represents localized activation in space and time; phase space II represents localized but continuous activation; phase space III represents infinite activation.
The precise nature of each state of the information processing system is the result of the interaction between these two parameters. We shall see that this only strengthens the implications of the model.
The behaviors of both an infinite and a finite case of such a system are represented in Figure 11.4. Essentially, for the two variables μ and α/γ there are three states of the system. In the first (state I), both are small and activation remains localized in time and space. One can think of such activation as taking place in finite clusters with little temporal continuity. This leads to a kind of balancing out. Hence, as long as the activation intervals of the different sources do not change much in relation to the overall relaxation time t, a net in which different nodes give different activation impulses will almost always remain near the point where activation started (state I in Figure 11.4). It is, moreover, remarkable that, in the finite case this stable state is, for very low α/γ, valid irrespective of the value of μ across its entire spectrum left to right. As we shall see, this is one of the key insights of the model.
As α/γ increases while μ is small (state II near 1; i.e., on average each node is connected to only one other node), relaxation becomes more and more sluggish. This initially causes the event horizon to grow in time but remain localized in space: the interactive clusters remain small but gain temporal continuity (state II in Figure 11.4). In a second step, with equally small μ and further increasing α/γ, the interactive nodes also expand in space: the clusters involve more and more nodes (state III in Figure 10.4). Under those conditions, “ancient history matters in determining the activation of any node, and […] since the activity keeps increasing, the assumption of an equilibrium between the net and the time variations at the source no longer holds” (Huberman & Hogg 1987, 27). A further peculiarity of the transition between states II and III is that, for μ near 1, the size of the clusters involved will know very large fluctuations.
For yet larger α/γ and higher μ, the amount of spreading grows indefinitely in both space and time, and therefore far regions of the net can significantly affect each other, another key insight. The transition to this state (state III in Figure 11.4) is abrupt: a large number of finite clusters is suddenly transformed into a single giant one as the number of nodes with values above this activation threshold grows explosively.
There are many interesting implications of this work for an information-processing approach to societal dynamics. For our immediate concerns, we are particularly interested in the following:
As long as the α/γ of the different nodes is much longer than the overall relaxation time t, all interaction in such a net remains localized, and the overall system remains in a stable state (state I). Moreover, the above is true irrespective of the number of people with which each individual interacts (the connectivity μ of the network). This might answer one of the most poignant questions of them all: “Why are the first 60,000 years of anatomically and cognitively modern man so particularly devoid of change?” The answer is that there was not enough interaction between the members of the sparse population to make information processing and communication take off. With so little information to process, the degree of interactivity of the people sharing that task does not seem to matter.
The fact that as α/γ increases while μ remains near 1, small clusters initially only gain in continuity (state IIa), and that only for even higher values of α/γ they spread in space (state IIb). Hence, when the quantity of information processed is only moderately increased, group size will remain small, but individual groups will exist longer in terms of travel through the graph. The quantity of information processed must increase considerably before larger groups of individuals can durably be drawn together in a network. I interpret this as a transition from rather unstable, short-lived, small groups to more stable, longer-living groups of people such as (small) tribes.
The fact that very large fluctuations in stability and size occur (for μ near 1) at the transition between states II and III; i.e., as the spatial extent of the activation network grows. According to the model, even as the information flow increases very considerably, provided the interactivity of the people drawn into the network remains limited, both the size range and the degree of permanence of the groups will vary wildly. This would indicate that at this point in development, groups of similar density and interactivity, which process similar volumes of information per capita, might exhibit spectacular differences in size, and that their interaction was far from durable. This would support the view that chiefdoms are unstable transitional organizations. It also applies to our understanding of the size differences in tribes and segmented lineages.
After this period of heavy instability, a third transition suddenly occurs from groups of very many different sizes (state IIb) to a continuous communication network (state III). This transition is attained by simultaneously increasing both α/γ and μ. In effect, as the volume of the information flow and the connectivity of the population grow, participation in one infinite network is inevitable. But the following particularities of this transition have interesting implications:
∘ If one introduces a measure of physical communication distance in the model, and imposes the constraint that the individuals in strongly interacting parts must physically be close to one another, the percolation model develops “clumpiness” in the spatial distribution of interaction in state II. This suggests that although theoretically very large rural social systems are a possibility, practical constraints make the emergence of spatial centers (such as villages or towns) highly probable in the absence of the equivalent of the Internet.
∘ The suddenness of the transition is explained by the exponential increase in interactivity and information flow as population density increases. This is compatible with the thesis that large-scale communications systems do not slowly spread from one center, but that a number of centers come about virtually simultaneously. This clearly is the case with urban systems, which always emerge as clusters of towns rather than as single towns.
∘ Long-range interactions emerge in state III. As soon as the whole of the system is in effect interactive, it is of course possible that interactions occur that link nodes in very distant parts of the system. This transition is reflected in the archaeological record in the form of long-distance trade.
∘ The model seems to indicate that an increase in the volume of information processed alone is not enough to really make the network develop long distance connectivity. In other words, it is a necessary condition but not a sufficient one: increasing interactivity between participant units is at least as important. Indeed, with low interactivity the effect of a unit increase in the volume of information flow on activation is at best linear, whereas the effect of a unit increase in connectivity is exponential, both on the volume of information flow and on activation.1
Modes of Communication in Early Societies
For this section, I am tentatively according the percolation model above the status of a metaphor applicable to the different observed forms of social organization and the changes between them. This metaphor distinguishes several different states of the percolation network and at least four important transitions.
The first state is a very stable state overall, though the individual interactive groups in it are small, very fluid, and ephemeral. The number of nodes in direct contact with any other node may vary. The anthropologist is, of course, immediately reminded of the very fluid and mobile social organization into small groups that was successfully maintained by gatherer-hunter-fisher societies for all of the Palaeolithic. It is generally estimated that such groups consisted of a few families, maybe up to about fifty people. In cases such as those of the Australian Aborigines, the Inuit, and the !Kung, individual members of such societies frequently move from band to band, while bands themselves frequently fuse or fission.
The first transition from this state that becomes visible in the percolation model, as α/γ is increased, transforms small ephemeral groups (state I) into groups of about the same size, but with communications channels that are stable for somewhat longer periods (state IIa). These groups may represent both “great men” and “big men” societies (Godelier Reference Godelier1982; Godelier & Strathern Reference Godelier and Strathern1991). In “great men” societies, typically consisting of a few hundred people, particular individuals come to play the upper hand in the context of a specific (set of) problem(s). Such individuals as achieve this are generally accorded that status because of their particular knowledge or capability to deal with a situation. As such their influence is delegated to them by the society. In the case of “big men” societies, the individuals who have come to the fore have done so by virtue of their wealth and their role in redistributing wealth among the members of the group. The groups would generally seem to be of about the same size. In neither case is there hereditary transmission of power, although it is easier to become a great (or big) man if your father was so. As far as the model is concerned, this state of the system would seem to include both mobile and sedentary groups.
As α/γ grows further, the percolation model predicts a second transition, from such small, periodically stable groups to groups that are stable over longer periods and exhibit a growing spatial presence (state IIb). I would associate this state of the model with a wide range of generally sedentary societies counting minimally a few hundred or a thousand members (tribes?). All acknowledge some sort of boss. As α/γ grows, these groups become larger and more enduring societies. In the process, μ may also be increasing, but much more slowly. These larger groups I tentatively propose to equate with what anthropologists such as Service (Reference Service1962, 1975) at one time called “segmentary lineages” and “chiefdoms,” more or less stable social formations that may include up to several tens of thousands of people.1
If this interpretation is correct, the small, mobile, and ephemeral groups of state I are generally egalitarian, those of state IIa alternate egalitarian information processing with occasional moments of hierarchical organization, particularly in times of stress, and the larger groups of state IIb are usually hierarchically organized. In many instances, crosscutting affiliations do to some extent mitigate the negative effects of a hierarchical organization among segmentary lineages and chiefdoms.
A detailed comparison between properties of small hierarchies as outlined above (Huberman & Hogg Reference Hogg, Huberman, Prigogine and Sanglier1987) and empirical observations, suggests (topological) answers to some aspects of the observed behavior of social systems documented by ethnographers (e.g., Johnson Reference Johnson, Renfrew, Rowlands and Segraves1982). First, it is interesting to note that cooperation between members of randomly interacting graph structures reduces the stability of such groups. This seems to indicate that fission among small face-to-face groups (“bands” in Service’s Reference Service1962 terms) in “empty space” must have had a very high incidence indeed, which undoubtedly contributed to the long absolute time span over which such groups dominated human social organization.
Next, if we take into account that in small face-to-face groups dominance relations develop with great frequency (Mayhew & Levinger, Reference Mayhew and Levinger1976, Reference Mayhew and Levinger1977), we may conclude from Hogg et al. (Reference Hogg, Huberman and McGlade1989) that the emergence of hierarchies can be argued to be statistically probable under a wide range of topological conditions. Hierarchies, therefore, need not have emerged under pressure. By implication, we must begin to ask why hierarchies did not develop much earlier in human history, rather than question how their development was possible at all. One possible answer seems to be that there was not enough information to go around to maintain the (much more efficient) hierarchical networks. Under those circumstances, the advantages of a homogeneous information pool may well have outweighed the potential gains in efficiency that hierarchy and stability could have offered. But we should also consider the possibility that such hierarchies emerged much more frequently than the ethnographic record seems to indicate. The speed with which information diffuses increases exponentially in a hierarchy that grows linearly in number of levels. Huberman and Kerzberg (Reference Huberman and Kerzberg1985) call this effect “ultradiffusion” (discussed here and in Appendix A). This could explain why, if scalar stress increases as a function of size, an increment in the response to stress could decrease with increments of group size (see Johnson Reference Johnson, Renfrew, Rowlands and Segraves1982, 413).
Indeed, ultradiffusion implies that with linear increases in the number of levels of a hierarchy, the size of the group that communicates by means of that hierarchy can grow exponentially. Ultradiffusion may thus explain the wide range of sizes (102–104 or more) of the groups that are organized along hierarchical lines, a fact that has long been noted in the study of what archaeologists and anthropologists call, following Service (1975) chiefdoms.
The percolation model predicts a very sudden third transition from spatially localized systems (state IIb) to infinite ones (state III), owing to an extension of the communications network to a (near) infinite number of individuals, with remarkable long-distance interactions. It essentially seems to represent what is known in archaeology and anthropology as the transition to states or even empires, which potentially include millions of people spread out over very large areas. As Wallerstein (Reference Wallerstein1974) has shown, such states and empires also activate large numbers of people outside their boundaries, so that the total number of people involved in their networks may be much larger than it seems.2
As I do not know of any enduring infinitely large purely hierarchical systems, I interpret this transition as leading to the introduction of distributed information processing alongside complex and large hierarchical organizations. The distortions and delays inherent in communicating through long hierarchical channels combined with the physical proximity of individuals belonging to different hierarchies will eventually have led to the formation of cross-links in and between hierarchies. This has the advantage that the individuals concerned can collect information received through many channels.
As soon as the average channel capacity can no longer cope with the amounts of information to be processed, the maintenance of the hierarchies concerned will then have become combined with other information processing avenues. We know that the information flows in both states and empires are maintained by both hierarchical (administrative) and distributed (market) systems. Such “complex societies” are the subject of the next part of this chapter.
Hierarchical, Distributed, and Heterarchical Systems
The remainder of this chapter will be devoted to answering questions about the dynamic properties of various forms of information-processing organization. For this I turn to the stretching and transforming capabilities of their topologies, which requires a rather technical discussion of the mathematical underpinnings of the behavior of these organizations, the details of which will not be of great interest to many readers. I will therefore attempt a summary of their main characteristics in this chapter and present some of the mathematical basis in Appendix A.
I begin this inquiry by distinguishing, with Simon (Reference Simon1962, Reference Simon1969), two fundamental processes that generate structure in complex systems: hierarchies and market systems. I have already presented a (simple) outline of the structure of a hierarchy in Figure 11.2. The essential thing to remember about hierarchies is that they have a central authority. The person or (small) group at the top of the hierarchy gathers all available information from people lower down, and then decides and instructs people lower down the hierarchy. Markets, on the other hand, are distributed horizontal organizations, without central control over information processing. An example is presented in Figure 11.3. Their collective behavior emerges from the interaction of individual and generally independent elements involved in the pursuit of different goals. All individuals participating in them have equal access to partial information, but the knowledge at each individual’s disposal differs. Examples of such market systems abound in biological, ecological, and physical systems, and their societal counterparts include the stock exchange, the global trade system, and local or regional markets.
Each of these two modes of information processing has different advantages and disadvantages, and these are fundamental for our understanding of the evolution of information processing in complex societies, as such societies combine features of both these kinds of dynamic structures. These differences concern the systems’ stability or instability, their efficiency, the oscillations they are subject to, the likelihood of transitions from one state to another, etc.
The first difference to be noted between hierarchies and market systems concerns their efficiency in information processing. In multilevel hierarchical structures each level is characterized by units that have a limited degree of autonomy and considerable internal coherence owing to the overall control at the top of the hierarchy. As the number of hierarchical levels increases linearly, the number of elements at the bottom (in technical language called leaves) increases geometrically (see the next section, point 1, and Appendix A for an explanation of this phenomenon). Under ideal conditions, the goal-seeking strategies of hierarchical structures maximize or optimize given resources, and can harness and process greater quantities of material, energy, and information per capita than market organizations.
An important feature of market systems is their inherently nonoptimizing behavior. There are two basic reasons for this. First, optimality in such structures would require that each actor have perfect information. But this is impossible since, as Simon (Reference Simon1969) points out, we inhabit a world of incomplete and erroneous information. As a consequence, the mode of operation of distributed systems is best defined as satisficing rather than optimizing. Second, rather than by hierarchical control, behaviors in market systems are constrained by their nonlinear structure. The strength of existing structures, for example, can prevent the emergence of competing structures in their nearby environment – even though these new structures may be more obviously efficient. A useful modern example is to be seen in the American motor industry, which continued the production of large, energy inefficient cars long after it was apparent that smaller cars were more fuel-efficient and less polluting. Overall therefore, market systems are less efficient than their hierarchical counterparts in processing matter, energy, and information. The differences between the market and hierarchical systems probably explain why, even in modern political systems such as those examined by Fukuyama (Reference Fukuyama2015), the best choice of government is a mix of the two (see also next section, point 1).
The next difference concerns the organizational stability of these two kinds of information processing structures. Since they operate on principles of competitive gain and self-interest, market systems are highly flexible and diverse. Political and legislative control in such systems is always difficult, as we see in our current democracies, because people in such distributed systems act on partial and different information and have more freedom to foster different perspectives. Such systems’ behaviors can therefore relatively easily become potentially disruptive and even destructive of the organizational stability of society.
This is, of course, not so in the case of hierarchical structures, whose main raison d’être lies in the efficiency with which authoritative control over decision-making is exercised at the top. But this means that the people lower down the hierarchy must sublimate many of their personal desires and aspirations for the good of the system. Autocratic and authoritarian rule systems may emerge to preserve the hierarchy’s pyramidal structure and maintain its organizational goals until they are no longer accepted by the base of society.
In view of these characteristics, it is highly improbable that either fully hierarchical or entirely market-based systems would have been able to provide a durable, coherent, structural organization for large societal systems. But the limitations of both hierarchical and market organizations can be avoided if they are coupled in complementary ways (Simon Reference Simon1969).3 Such societal structures that combine hierarchical and distributed processing are here called heterarchies.4 Their hybrid nature dampens or reduces the potential for runaway chaotic behavior and thus increases the information processing capacity of the system. Our next task is therefore to analyze in more detail the relationships between the structure and the information processing dynamics of hierarchies and market systems, and then to determine how they might interact in a heterarchy.
The first issue is the speed of information diffusion in hierarchical and market systems respectively.
Information Diffusion in Complex Hierarchical and Distributed Systems
Complex Hierarchies
Unfortunately, large hierarchies cannot be studied by observing the behavior of their parts (as one can do with small systems), nor can they be treated in a statistical manner, as if the individual components behave with infinite degrees of freedom. They are essentially hybrids of micro- and macrolevel structures, and need an approach of their own.5 That would involve treating the individual leaves at the lowest levels of a hierarchy statistically, by integrating over them, while considering those at the top static, as they constrain the intervening levels of the hierarchy everywhere in the same fashion (Huberman & Kerzberg Reference Huberman and Kerzberg1985; Bachas & Huberman Reference Bachas and Huberman1987). With that as a point of departure, Huberman’s team has developed a number of ideas about the information-processing characteristics of hierarchies that can be summarized as follows (see Appendix A):
1. Independent of the size of the population that a hierarchy integrates, there is an upper limit to the time it takes to diffuse information throughout it. For example, when expanding a hierarchy from five levels to six, the additional time needed to diffuse the information is a root of the time added upon expansion from four levels to five. There is a power-law involved, which relates the speed of information diffusion to the number of levels in the hierarchy. Hierarchies are therefore very efficient in passing information throughout a system and, although somewhat counterintuitive, the more levels the hierarchy has, the more rapidly information is (on average) distributed.
2. If a hierarchical tree is asymmetrical around a vertical axis, such as when the number of offspring is three per node on one side and two per node on the other, then overall diffusion is slower because it takes more time for the information to be diffused on one side than it does on the other side, and that may in turn garble information because, as all transfers pass in part through the same channels, interference and loss of signal will occur. Such constraints might lead one to predict that under unconstrained circumstances, fat and symmetrical trees would tend to develop. Evidence of asymmetrical ones or particularly narrow ones could therefore serve as pointers to such constraints.
3. This may be a major constraint on the hierarchy’s capacity to stably transfer undistorted information. To quantify this, we need to look at the overall complexity of the tree (again, for mathematical detail see Appendix A). It turns out that for large hierarchies, very complex trees will have a complexity that at most increases linearly with the number of its levels. That complexity is inversely proportional to the tree’s information diffusion capacity.
4. But is the number of levels unlimited? Theoretically, adding one more level to a hierarchy allows for an exponential increase in the number of individuals that it connects. If we assume a constant signal emission rate for leaves at the base of the hierarchy, it follows that the number of signals produced by the individuals at the base also increases exponentially. The diffusion of information through the whole system (see point 1) that permits this exponential increase, however, is achieved at the expense of reducing the increase in the amount of information that circulates to a linear one. This is done by “coarse-graining,” or suppressing detail every time a signal moves up to the next level. Thus, while the speed of diffusion of information increases, the precision of the information distributed decreases.
5. Defining adaptability as the ability to satisfy variations in constraints with minimal changes in the structure, Huberman and Hogg (1986, 381) argue that the most adaptable systems are the most complex, because such systems are the most diverse, whereas the most adapted systems tend to have a lower complexity than the adaptable ones, because the development of situation-specific connections will lower the diversity of the structure. Complexity seems to be lowered when a system adapts to more static constraints, thus lowering its adaptability and its potential rate of evolution.
The fact that these results are due to mathematical/topological properties of hierarchies, and are independent of the nature of the nodes or the connections between them, gives them wide implications, not only for computing systems, but also for social systems in which hierarchies play an important part.
Distributed Systems
Distributed systems are characterized by structural variables such as the degree of independence of the individual participants; the degree to which they compete or cooperate; the fact that knowledge about what happens in the remainder of the system is incomplete and/or that the individual actors are informed with considerable delays, and finally the ways in which finite resources are allocated within the system. Although a formal information processing structure is missing, distributed systems behave in some respects with considerable regularity, whereas in other respects their behavior is fundamentally unstable and irregular. The regularity is evident at the overall level, and is exemplified by the so-called Power-law of Learning (Anderson Reference Anderson1982; Huberman Reference Huberman2001), which states that those parts of a system that have started to perform a task first are more efficient at it. As a result, distributed systems structure themselves universally according to a Pareto distribution.6
Huberman and Hogg (Reference Huberman, Hogg and Huberman1988) study the behavior of such distributed systems by building a model that fits the following description:
The model consists of a number of agents engaging in various tasks, and free to choose among a number of strategies according to their perceived payoffs. Because of the lack of central controls, they make these choices asynchronously. Imperfect knowledge is modeled by assuming the perceived payoff to be a slightly inaccurate version of the actual payoff. Finally, in the case when the payoffs depend on what the other agents are doing, delays can be introduced in the evaluation of the payoffs by assuming each agent only has access to the relevant state of the system at earlier times.
After analyzing one by one the impact of a number of the variables mentioned above, their conclusions give us the following ideas about the behavior of distributed systems:
1. First, they calculate the number of agents engaged in each of the different strategies at any point in time. These strategies have different degrees of efficiency. Only in the case of complete independence of action and completely perfect knowledge by all actors do they achieve optimal overall efficiency. But if imperfect knowledge is introduced, the distributed system operates below optimality: never are all agents using the optimal strategy. In real life, distributed systems satisfice rather than optimize.
2. Where action depends in part on what other agents are doing, the payoff for each actor will also depend on how many others are choosing the same strategy and bidding for the same resources. Independent of the initial values chosen, with perfect knowledge the system will converge on the same suboptimal point attractor, which is the highest available given the constraints involved. That is evidently an entirely stable situation. With imperfect knowledge, however, an optimality gap develops of a size that is dependent on the uncertainty involved. The result is the same for competitive and co-operative strategies.
3. Time delays can also introduce oscillations into distributed systems. If the evaluation of payoff is delayed for a period shorter than the relaxation rate of the system the system evidently remains stable. But longer evaluation delays give rise to damped oscillations that signify initial alternate overshooting and undershooting of the optimal efficiency, and really long delays create persistent oscillations that grow until bounded by nonlinearities in the system. The oscillations depend on the degree of uncertainty in evaluating the payoff: large uncertainty means that the delays are less likely to push the system away from stability.
4. In a system of freely choosing agents, the reduced payoff due to competition for resources and the increase in efficiency resulting from cooperation will push the system in opposite directions. In that situation, a wide range of parameter values generates a chaotic and inherently unpredictable behavior of the system with few windows of regularity. Very narrowly different initial conditions will lead to vastly different developments, while rapid and random changes in the number of agents applying them make it impossible to determine optimal mixtures of strategies. In certain circumstances, regular and chaotic behaviors can alternate periodically so that the nature of our observations is directly determined by their duration.
5. Open distributed systems have a tendency not to optimize if they include long-range interactions. Under fairly general conditions the time it takes for a system to cross over from a local fixed point that is not optimal into a global one that is optimal can grow exponentially with the number of agents in the system. When such a crossover does occur, it happens extremely fast, giving rise to a phenomenon analogous to a punctuated equilibrium in biology.
6. A corollary of these results is that open systems with metastable strategies cannot spontaneously adapt to changing constraints, thereby “necessitating the introduction of globally coordinating agents to do so” (Huberman & Hogg Reference Huberman, Hogg and Huberman1988, 147, my italics). I will return to this point in discussing hybrid information-processing systems.
Instability and Differentiation
If a system is nonlinear and can undergo transitions into undesirable chaotic regimes, what are the conditions under which it can keep operating within desired constraints in the presence of strong perturbations? Glance and Huberman (Reference Glance, Huberman, van der Leeuw and McGlade1997) demonstrate (for the mathematical derivation, see Glance & Huberman 1997, 120–130) that:
1. In a purely competitive environment the payoff tends to decrease as more agents make use of it, but in a (partly) cooperative environment (agents exchanging information) the payoff increases up to a certain point with the number of agents that make use of a certain strategy. Increases beyond that point will not be rewarded.
2. In the case of a mixture of cooperative and competitive payoffs, as long as delays are limited the system converges to an equilibrium that is close to the optimum that a central controller could obtain without loss of information. But with increasing delays, as well as with increasing uncertainty, the number of agents using a particular resource continues to vary so that the overall performance is far from optimal. The system will eventually become unstable, leading to oscillation and potential chaos unless differential payoffs related to actual performance are accorded to actors.
3. Accordingly, such differential payoffs have the net effect of increasing the proportion of agents that perform successfully and decreasing the number of those that perform with less success, which will in turn modify the choices that each actor makes. Choices that may merit a reward at one point in time need no longer be rewarded at a later point in time, so that evolving diversity ensues. This has two effects (Glance & Huberman Reference Glance, Huberman, van der Leeuw and McGlade1997): (a) a diverse community of agents emerges out of an essentially homogeneous one and (b) a series of bifurcations will render chaos a transient phenomenon (see Appendix A for a more elaborate explanation).
In assessing the relevance of this work for the problems we are dealing with, we must first caution that as far as I know it has not (yet) been proven that one may generalize the conclusions at all. But if they can indeed be generalized, the results seem of direct relevance to societal systems. They seem to point to the fact that diversification is a necessary correlate of the stability of distributed systems. This certainly seems to be so in urban systems, which in all cases show considerable craft specialization as well as administrative differentiation, for example.
Heterarchical Systems
I argued earlier that urban systems are, in all probability, hybrid or mixed systems, consisting of egalitarian groups and small hierarchies as well as complex hierarchies and distributed systems. I call these mixed systems heterarchies.7 Unfortunately, we know even less about such heterarchical systems than we do about either distributed or hierarchical ones. Research in this area is badly needed, notably in order to quantify the values of the variables involved, as there is no overall approach to hybrid systems such as Huberman and Hogg have developed for complex hierarchies and distributed systems. I can therefore do no more than create a composite picture out of bits and pieces concerning each of the kinds of information processing systems we have discussed so far, and then ask some questions.
I will begin with mixtures of egalitarian and small-scale hierarchical communication networks. I conclude from Mayhew & Levinger’s (Reference Mayhew and Levinger1976, Reference Mayhew and Levinger1977) and Johnson’s (Reference Johnson, Renfrew, Rowlands and Segraves1982) arguments that there are substantial advantages to a hierarchical communications structure as soon as unit size exceeds four or five people. At the lowest level this implies hierarchization when more than five people are commonly involved in the same decisions, but at a higher level this also applies to hierarchization of lower-level units. This probably indicates a bottom up pressure for small- and intermediate-scale hierarchization in large, complex organizations.
Reynolds (Reference Reynolds1984), in an inspired response to early questions on the origins of small-group hierarchization posed by Wright (Reference Wright1977) and Johnson (Reference Johnson and Redman1978, Reference Johnson and van der Leeuw1981, Reference Johnson1983), studies the gain in efficiency that is achieved by subdividing problem-solving tasks, rather than treating them as a unit. Depending on whether it is the size of certain problems or their frequency that increases, greater efficiency gains are achieved by what he calls “divide and rule” (D&R) and “pipe-lining” (P) strategies (Reynolds Reference Reynolds1984, 180–182). In the divide and rule strategy, the lower-level units are kept independent, and the integrative part of the task is delegated to the lower-level units among themselves in a sequence of independent sub-processes, each of which is executed by a separate unit under overall process control from higher hierarchical levels.8
Pipe-lining (P) is a hybrid strategy that involves both horizontal and vertical movement in a hierarchy. It seems to be more efficient when increases in both size and frequency of problem-solving tasks occur, as it optimizes the amount of information flowing through each participating unit. It does so by regulating the balance between routine and nonroutine operations.
Unfortunately, once the systems considered are more complex, it is not so easy to generalize, as each different system may exhibit a range of very different kinds of behavior. One aspect of complex hybrid systems that may have general importance reminds us of pipe-lining. There is a need for reduction of error-making because in such systems many interfering communications pass through long lines of communication and do so with different frequencies. To reduce such error-making, higher-level units may compare information gathered from different sources at their own level with the information coming from sources lower down the hierarchy, and correct errors when they pass the information on to a node higher up. The disadvantage is that this also entails coarse-graining, generalizing by ignoring part of the total information content transmitted through the hierarchy.
Most other arguments in favor of heterarchical systems center on their efficiency and stability. We have seen in this chapter that Ceccato and Huberman (Reference Ceccato and Huberman1988) argue that after an initial period the complexity of hierarchical self-organizing systems is reduced, and their rate of evolution and their adaptability with it. The systems become adapted to the particular environment in which they operate. As a result, certain links are continuously activated whereas others are not. The unactivated, nonoptimal ones disappear, so that when circumstances change, new links need to be forged. That takes time and energy.
In distributed systems, on the other hand, nonoptimal strategies persist (Ceccato & Huberman Reference Ceccato and Huberman1988), which seems to affect very large market systems; these therefore also have difficulty adapting. Combining the two kinds of systems into hybrid systems has two advantages. First, the introduction of globally controlled (hierarchical) communications in distributed systems causes the latter to lose their penchant for retaining nonoptimal strategies. Secondly, the existence of distributed connections in the system increases the adaptability of the hybrid structure as well.
The next aspect of heterarchical systems we need to consider is their efficiency. Upon adopting a hybrid strategy, a system will have to deal with many new challenges. It would ideally need the optimum efficiency afforded by a hierarchical system and the optimum adaptability inherent in a distributed one. In practice, a hybrid structure will develop that is a best fit in the particular context involved. As it develops solutions to the specific problems that it faces, its hierarchically organized pathways will become simpler, reducing overall adaptability and possibly reducing efficiency as the original random hierarchy becomes more diverse. On the other hand, its distributed interactions may become better informed and/or improve their decision-making efficiency, and their adaptability will not necessarily be reduced.
Innovation introduces new resources into a system, and will therefore reduce competition or at least mitigate its negative effects. It will increase the efficiency of the distributed actors, which in turn will prompt more and more of them to cooperate, further increasing efficiency gains for a limited time until competition for resources becomes dominant again. This inherent fluctuation of the market aspect of the system is reduced by the much more stable efficiency of the hierarchy.
Similarly, in market systems both the time delays and their oscillations increase rapidly with increasing numbers of actors, whereas in hierarchical systems time delays proportionately decrease with each increase in the number of participants and oscillations are virtually nonexistent. Again, heterarchical systems seem to have the advantage.
Conclusion
The main point of this chapter is to argue that one can indeed make a coherent argument for considering the major societal transformations that we know from archaeology, history, and anthropology as due to an increase in knowledge and understanding, and thus an increase in the information processing capacity of human societies. Viewing this as part of a dissipative flow structure dynamic enables us to understand these transitions as being driven by the need to enable the communications structure of human groups to adapt to the growth in numbers that is in turn inherent in the increase in knowledge and understanding. It therefore presents us with an ultimate explanation for the different societal forms of organization that we encounter in the real world and the transitions between them, an explanation that does not need any other parameters (such as climate pressures, etc.). All these are subsumed under the variable “information-processing capacity.”
Introduction
In many political and business quarters, in connection with our current sustainability and environmental change dilemma, we often hear that “We must innovate our way out of trouble.” However, this can be misleading, or at best insufficient, if it omits to point out that a 250-year period of unbridled and undirected innovation since the beginning of the Industrial Revolution is actually responsible for many of the unintended consequences of the innovation that we presently have to deal with. Those two and a half centuries of near random innovation in every conceivable dimension of the value space of our current path-dependent societal-cultural-environmental system have led to a rapid acceleration of the frequency and scope of invention and innovation as well as serious challenges regarding our environment. Greenhouse gas emissions are only the beginning. As pointed out by Carson (1954), Huesemann and Huesemann (Reference Huesemann and Huesemann2011) and many others, if we are to avert a major socioenvironmental challenge in time, we need to better understand the role of technology, and innovation in particular, so that we can improve our chances to steer invention and innovation in a direction that is more prudent than the one we are heading in.
In the perspective on (material, institutional, and social) coevolution that I outline in Chapters 8–10, technology plays a special role because it mediates between the human mind and the material world around it. All too often, it has been deemed to follow either a material or a societal logic, but I will argue in this chapter that the technological dynamic is all its own, structuring the socioenvironmental interface and the context of the economy. I will do so by discussing the emergence of novelty – the process that has transformed the world from small groups of hunter-gatherers to a global network of nation-states, enabling humanity to grow to more than 7 billion people, tapping an increasingly wide range of natural and human resources, inventing millions of novel tools, and in the process bringing our planet close to complete environmental destruction.
In Chapter 9, I argued that from the dissipative flow structure perspective continued innovation is in effect the ultimate driver behind societal coherence as well as change, because it ensures the ever further dissipation of chaos (the unknown) that is necessary for human organizations to live and grow. In Chapter 10, I described how that process of continual innovation impacts on the coevolution of a society’s technology, economy, institutions, geography and much more, engendering a feedback cycle between solutions and problems. But it is now time to discuss the process of invention and innovation itself in more detail.
Importantly, the model of the coevolutionary dynamics that is outlined in this chapter and Chapter 13 as responsible for technological invention also applies to the non-technological sphere – it can be applied to all forms of change in human societies, and has, mutatis mutandis, also been proposed for evolutionary changes in nonhuman organisms (Laubichler & Renn Reference Laubichler and Renn2015).
Technology as “Tools and Ways to Do Things”
From the long-term perspective of the anthropologist and archaeologist, it is unduly limiting to consider technology in the way that is usually the case in contemporary society – as the totality of knowledge concerning material tools and inventions that we currently use, or in the case of a specific technology a subset of the latter. When applied to the past and to other cultures, this perspective is a typical example of what I call looking through the wrong end of the telescope, taking a modern Western concept and projecting it into the past and onto other cultures in the hope of finding the origins of that concept, that way of doing things, that tool, or that technique (van der Leeuw Reference van der Leeuw, Chase and Scarborough2014). As most concepts, categories, and technologies have changed through time, it is usually impossible to define their origins with any precision, as they have morphed beyond recognition between the emergence of a novelty and the current shape. As has been discussed in Chapter 6, rather than adopt such an ex-post perspective on phenomena and search for origins of innovations, we have to adopt an ex-ante one, and search for emergence of novelty (van der Leeuw Reference van der Leeuw, Chase and Scarborough2014).
In that light we could more advantageously define technology in the broadest sense as ways to do things. In earliest times, most of these were behavioral, whether individual or collective, while material tools were either nonexistent or very simple. Over time, the balance shifted toward increasing complexity of societies’ material culture as well as their societal organization.
As we have seen in Chapters 8 and 10, the immaterial domain has always played an essential role in this. It includes the ways in which people organize their thinking and their behavior, the ways in which they interact with each other and with their environment, the ways in which they transform raw materials into tools, and, in the process, adapt their behavior so as to use these tools effectively. But in my opinion it also includes the much wider realm of how societies organize themselves, conceiving of and implementing institutions, rules, laws, and customs.
In this light, the material and immaterial aspects of technologies (in this wide sense of ways of doing things) are, and always have been, closely interwoven and coevolving through time. Indeed, one cannot imagine the adoption of any technology, even a simple one such as the use of fire, without the important changes it triggered in social behavior: consumption of different foods, storytelling around the fire at night, ability to live in colder climates, etc. The same is true of the introduction of agriculture: different foods, different settlement patterns, different subsistence activities, different divisions of labor, etc. And it is also true for very recent inventions, such as the introduction of information and communications technology, of cellphones, etc. Think only of the fact that nowadays we can be much less organized about how we set up a meeting because cellphones can at any time adapt or fine-tune an existing plan.
Objects and Ideas
First, I need to distinguish between invention and innovation. I understand by invention the process of transformation of substance and substantiation of form that is the essence of creation. It can involve only one or a few people or whole teams, and it can apply to material inventions as well as procedural, conceptual (Schlanger & Stengers Reference Schlanger and Stengers1991), even literary ones (Schlanger Reference Schlanger1991).
But it is distinct from innovation, the process of introducing and adopting new elements in society, whether new inventions or older ones that are newly introduced in a society because they have become relevant to that society. Innovation generally leads to the modification of behavior, and potentially also of customs, institutions, and other organizational aspects of a society.
Technological invention and innovation occur in the interface between the realm of phenomena and that of ideas. Ideas are instantiated in some material or organizational form, and when introduced in that form in society give rise to new ideas and new instantiations. I must therefore outline my perspective on the relationship between the respective realms of ideas and things.
Since the Enlightenment, in the western intellectual tradition, we mostly accord phenomena and objects (facts) a status that is independent of our cognitive capabilities. This is expressed by a phrase attributed by my history professor at the University of Amsterdam to the nineteenth-century historian Ludwig von Ranke: “Opinions may change, but facts remain.” This position has of course come under scrutiny from the cognitive sciences, which emphasize that the way we understand phenomena is culturally, emotionally, and socially impacted and can vary greatly between individuals. Yet, for example in physics and the natural sciences, most phenomena and processes are still deemed to lead an existence independent of our cognition, and research in these disciplines is generally thought to be aimed at “discovering” them. This perspective has in many instances been extended to the study of technology: the material aspects of various ways of doing things have in our modern minds gained the status of facts, whereas the ideas that have led to their implementation have been given much less attention.
In a similar vein, in economics, resources are often seen as essentially natural, and thus existing outside the social realm. I would argue that, on the contrary, resources do not exist as such unless they have been identified and integrated in society’s ways of doing things – until they have been recognized as valuable, and processes and procedures have been developed to socialize them, making them an integral part of a society’s flow structure and value space. They derive their value from that integration, which gives them a role in society, and which (re)shapes society in ways that integrate them.
In both instances, the role of the realm of ideas (including values and norms, see Chapter 17) in instantiating our relationship with the environment has been overshadowed by that of the material realm. This then raises the question of how far our ideas are shaped by observed phenomena or how, vice versa, our conception of reality (the world out there) is shaped by our ideas. Clearly, this is a chicken and egg question, and unsolvable. It is not really important for us here, except for one aspect: the relative lifespans of phenomena and ideas. In the traditional, positivist, approach, this was represented by the quote attributed to Ranke: facts outlive ideas. But from the perspective proposed in this book it is the other way around: the fundamental conceptual structure of tools for thought and action, and thus ways of doing things outlives objects and technologies, even if in detail they are modified. Ideas determine how we look at things, what we see, and what we do not see. Phenomena are poly-interpretable, depending on which of their many dimensions are observed by our cognitive apparatus, which is – as we have seen in Chapter 8 – very limited in its dimensionality and differs greatly between people, groups, and cultures, depending on the process of socialization and learning that they have undergone.
Human perceptions are shaped by information processing that is, as Luhmann argued (Reference Luhmann1989), self-referential within any one society or culture, so that different aspects of our perceptions reinforce each other into a coherent system. This coherence is reinforced by the overdetermination of our observations by past experience (Luhmann Reference Luhmann1989, 35; Atlan 1992), which tends to suppress out of the box change and promotes a long lifetime for the values and perspectives that characterize a society or culture.
The Presence and Absence of Change
Before I drill down into the process of novelty creation itself, we need to consider the relationship between change and its absence in our western intellectual tradition. Girard (Reference Girard1990) describes elegantly how, over the last three centuries, the focus in western (for which read European) culture has shifted away from stability toward innovation, as part of a shift from seeing the present in the context of the past to seeing it in the context of the future. As a result, much of our intellectual focus is currently on explaining novelty and change, rather than explaining stability (the absence of change). It seems to me that it is worth questioning this implicit assumption of stability and the need to explain change. One could just as legitimately, with Heraclitus of Ephesus, argue that change is ever-present in open, living systems, and that therefore stability needs to be explained. One would then ask what is responsible for the absence of change in living, open, socioenvironmental dynamics. I conclude that as novelty cannot be perceived without stability, the two concepts are inextricably interwoven, and we must look at their interaction.
It is one of the intriguing advances of genomics that the same regulatory mechanism that is responsible for change is also responsible, under certain conditions, for its absence. Could we conceive of a similar regulatory mechanism in society? Or to put it in more technological terms, what might be responsible both for the maintenance of technological traditions and for the introduction of novelty into them? To begin answering this question, we need to adopt a model of the ways in which a technological tradition is dynamically articulated between the ideas and practices of its practitioners and the physical, chemical, mechanical, and other characteristics of the natural world. And to understand this dynamic articulation, we must apply a combination of an objective perspective on the realities of the physical world and a cognitive perspective on the ways the inventor deals with them.
Perspectives on Invention
It is my contention that the study of invention has been hampered by a confusion between the perspective of the scientist, who looks from the outside at the process of invention, and the perspective of the actor, who is involved in the process. These perspectives are fundamentally different and must be distinguished and applied in conjunction, because in scientific practice, of course, both are interacting; it is in that interaction that invention occurs. The person I here call the scientist usually has a tendency to explain phenomena, procedures, and the conditions for and results of actions in terms of cause-and-effect, whereas the person I here designate the inventor thinks in terms of multiple options for actions and their intended and unintended consequences. The former practices in effect an ex-post perspective, explaining results, whereas the latter’s point of view is ex-ante, focused on the challenges of constructively juggling the many parameters involved in creating novelty.
Rather than try and achieve clarity and certainty by reducing the number of dimensions brought to bear on the challenge at hand, as the scientist usually does, the actor thinks in terms of ambiguities, uncertainties, possibilities, probabilities, and experiments, in the process enhancing the number of dimensions taken into consideration. When asked to explain certain phenomena, the actor does so with the totality – or at least the relevant parts – of the complex system in mind that relates to the phenomena in question, and will therefore usually be able to identify several chains of cause and effect that could possibly result in the phenomena in question, whereas the scientist tends to focus on one explanation only.
Invention in Economics
Since an important focus of our coevolutionary approach is the role of innovation in society, and the economy is in many ways the place where that articulation takes place, I will begin with a very brief historical reexamination of some milestones in the economic study of invention and innovation, from Schumpeter via Usher and Rosenberg to the present.1
Schumpeter’s Focus on the Effects of (Exogenous) Technological Change
Most early twentieth-century mainstream economic theory considered technological change to be exogenous to the economic system, and thus not an object of economic analysis.
Schumpeter’s theory of economic development (Reference Schumpeter1934), on the other hand, conceives of invention and innovation as entrepreneurial activities, and focuses on innovation as an act of investment that requires the ex novo creation of means of payment by credit institutions. The entrepreneur selects innovative projects that offer profit-making opportunities (Reference Schumpeter1939),2 and this allows him to obtain funding from financial institutions. But the profit disappears as soon as an innovation is adopted by others. Schumpeter remarks that innovations appear in clusters (Reference Schumpeter1934; Reference Schumpeter1939). According to him, this happens because a swarm of entrepreneurs will spread the innovation into related industries. This could explain the cyclical behavior of the economic system, because the interest in the new domain may cause ongoing projects to be crowded out by new ones.
Usher’s Cumulative Recombination Synthesis
However, one cannot understand innovation without fundamentally understanding the technology itself, as well as the economic and social dynamics that constitute the context in which it operates. It is essential to widen the scope of innovation studies accordingly. Usher moves an important step in that direction. According to him (Reference Usher1929), novelties are not the product of individual creativity, but of the cumulative actions of many individuals operating in a given historical, social, and institutional context with a certain stock of available knowledge.3 Invention unfolds in a sequence of four stages:
The first is the perception of a problem, where a certain generally accepted framework is recognized as incomplete and unsatisfactory;
The next, the setting of the stage, defines the contours of the problem and explores its various dimensions by means of a trial-and-error approach;
In the third, an act of insight takes place, which produces a solution to the problem;
In the fourth, a critical revision of the accepted framework leads to the adoption of the innovation.
The pivotal stage is, therefore, the insight. Rather than from intuition or creativity, Usher argues that insight results from a process that is determined by the intrinsic properties of the context within which the solution is explored. This does not mean that this process is propelled by necessity. Perceptions play a role, and chance also plays a part by introducing unforeseen and unpredictable elements. Invention is therefore characterized by discontinuities that are crucial in the transition to a new state of the system, as well as by a progressive synthesis that connects one stage to the next. Insight emerges when various behavioral matrices are associated (Koestler Reference Koestler1964). Once a solution has been found, we no longer separate what we have joined, and the result seems the logical consequence of the premisses involved. But we do not know which things have not been taken to their logical consequence.
Usher’s vision underlines three important aspects: a particular act of insight may not lead to the solution of the main problem to which it is directed; chance is part of a pattern of events that unfold in a certain sequence; and finally, the choice of the solution to be adopted depends on incentives and constraints that are not only technical but also social, economic, and institutional.
Rosenberg and the Drivers of Technological Convergence
Various scholars, such as the anthropologist Leroi-Gourhan (Reference Leroi-Gourhan1943, Reference Leroi-Gourhan1945) and the philosopher Simondon (Reference Simondon1958), have noticed that technological change is not random; there is an inherent tendency in the evolution of such change. Economists have initially assumed that such tendencies in technical change are driven by economies in production, but that does not explain the specific sequence or the timing of innovations. Inspired by Hirschman (Reference Hirschman1958), Rosenberg (Reference Rosenberg1963, Reference Rosenberg1969) argues that “complex technologies create internal compulsions and pressures which, in turn, initiate exploratory activity in particular directions” (Reference Rosenberg1969, 111). Two important features of the innovation process are technological imbalances and compulsive sequences. Technological imbalances (which we might nowadays call bottlenecks) often occur in the production process in individual firms or vertically integrated industries. They favor change when initial innovations do not only affect a single stage of the production process but also require modifications in other, preceding or following, stages.
Such technological imbalances occur particularly often in the transfer of technologies from one industry to another (spillovers) for three reasons: because the need to overcome them steers research in particular directions,4 they often lead to the creation of new, specialized production tools for particular products, and they widely spread a wealth of new, specific technical knowledge. They can thus lead to technological convergence.
Uncertainty can be a trigger for innovation (such as when innovations are adopted to circumvent inputs whose availability is subject to unpredictable variations), but it can also slow down the development and diffusion of new techniques (Rosenberg Reference Rosenberg1983, Reference Rosenberg1994). Uncertainty is therefore a key element in the analysis of the innovation process. A central role is played by the social process through which innovations emerge and by the cognitive realm; a process where uncertainty influences both the ways in which the actors behave and the direction and timing of the innovation process.
Arthur: The Observer’s Perspective
But to study invention and innovation we must adopt a generative approach; from a perspective that moves upstream against the flow of time, we must move to one that moves downstream with the flow of time. The Complex Systems approach, with its emphasis on emergence, does that to some extent, and it is therefore not surprising that two of the most complete recent attempts to look into innovation have that approach at its origin.
The engineer and economist Arthur (Reference Arthur2009) sees a technology as a construct to capture natural, behavioral, social, organizational, or other phenomena for one or more purposes. This does not only include technologies in the traditional sense, but also business organizations, legal or monetary systems, contracts, etc. Technologies are not standalone objects, but instantiations of more general patterns of organization and transformation that can be combined or otherwise reorganized. First, every technology is organized around a central concept or principle that harnesses a phenomenon to fulfill a certain (set of) function(s). Secondly, that principle is instantiated in the form of (physical or social) components that, together, constitute the central assembly of the technology. Thirdly, that central assembly is usually supported by other technologies whose role is to permit the assembly to function appropriately. Fourthly, all technologies are part of a multilevel recursive structure, consisting of technologies within technologies all the way down to their elementary parts, and they are themselves embedded in a hierarchy of organizations of a social, institutional, and/or economic nature that they help function appropriately.
Arthur views the long-term evolution of technology as a kind of bootstrapping from a few simple technologies (such as stone tools) to numerous complex ones (e.g., nuclear reactors, the Internet), driven by the capture of unknown phenomena that can be harnessed into new technologies and the recombination of existing simpler technologies into more complex ones. The capture of unknown phenomena leads on the one hand to cascades of new scientific discoveries and on the other to relatively rapid explosions in innovation within specific domains (groupings of technologies that work naturally together).
Arthur (Reference Arthur2009) distinguishes four levels of innovation: (1) new solutions within given technologies, (2) novel technologies, (3) new domains of technology, and (4) the overall technology of a society.
1. New solutions within given technologies. Every technological realization is a human creation involving problem solving, organization, and action, and is implemented by orchestrating the different component parts of the creation (including ideas, tools, and the like) to exploit their advantages and avoid or minimize their drawbacks. This is the process of design, and it entails making sets of choices that reflect the relationship between the realm of ideas and the material and/or social reality that gives birth to the designed object. To understand that relationship, we must evaluate the choices made against the options not chosen in every step of the creative process. Theoretically, for most designs, the number of options is huge. But in practice, many of these are excluded by physical or other constraints. The cumulative effect of the (small) percentage of novel theoretically possible options that are instantiated moves a technology along in certain directions. Coherent sets of such options may become standard building blocks – and may easily replace older modules that no longer meet the needs of the times. How the blocks emerge is in many ways path dependent on a combination of chance events and processes, so that the solutions implemented are not necessarily optimal.
2. Novel technologies are technologies that use a different principle to deal with the problems at hand. Their emergence is shaped by a conjunction of social needs, experience outside the technological domain they normally apply to, conditions that favor risk-taking, and exchange of ideas and knowledge between individuals. But they come into existence when the needs are conceptually and physically linked with a new, exploitable (set of) principles and their effects. Whether in science or in technology, the core of innovation is this process of linking problems and principles. It entails mental association between the two via a mapping of their functionalities onto each other.
Arthur distinguishes three phases in a technology’s life span: (1) ‘internal replacement’ (replacement of borrowed or otherwise non–optimal parts of a technology by better suited ones), (2) ‘structural deepening’ (adding subsystems to the system to focus, stabilize, and/or improve its performance, or to increase control over it), and (3) ‘lock-in and adaptive stretch’ (stretching the technology’s performance after it has become so embedded that fundamental change is no longer on the cards). Eventually the principle, now highly elaborated, is strained beyond its limits and gives way to a new one that is initially simpler but in due course is elaborated, so that the cycle begins anew. The overall process is not dissimilar from the Structure of Scientific Revolutions (Kuhn, Reference Kuhn1962).
3. New domains of technology. Often, technological domains coalesce around a central set of principles and tools that are initially developed in other, established, domains. At this stage, large parts of that new toolbox (enabling technologies, understanding of some of the dynamics) are still missing. As it grows, so will awareness of the missing parts, and research will plug the gaps. Once that has advanced enough, an industry will start to grow, starting with small companies. The challenge for them is not so much the development of new products as the triggering of the cultural and social restructuring that is needed to allow the insertion of the domain into the fabric of society. If that succeeds, the domain may spawn new subdomains, starting the cycle anew. When the new domain encounters opportunities to expand, it must adapt both itself and the relevant part of society to the new functionalities involved. We may view this as the kind of mutual learning that occurs when different cultures interact (acculturation).
Rather than the identification of new principles, it is this collective learning and implementation process that sets the pace for the evolution of a technology. Among its many constraints are the nature and lifetime of investments in the old, as well as the new, technologies. The replacement requires, moreover, that the economy transforms itself to take the new technologies into account – in that sense technological domains determine epochs in the economy, while the changes in economic structure determine the time involved. All this makes for a very slow process.
4. The technology of a society. In the bootstrapping process, finer and finer distinctions are made over time between different functions and different ways to deal with them. As the number of technologies increases, so does the number of combinations that are possible between them. As technologies emerge in society, they weave a web among them that links principles, implementations, functions, artifacts (including organizations), materials, and intellectual and material tools in ways that are adapted to the way of life and the worldview of the members of that society. The economics of this process heavily impact on its ultimate structure. In that process, one can distinguish discrete – but not necessarily sequential – steps: (1) entry of the technology as a new node into the active collection of technologies; (2) it becomes available to replace existing technologies or components; (3) it sets up new opportunity niches for supporting technologies and organizational changes; (4) older technologies fade from the collective, and their needs are dropped; (5) the novel technology becomes available as a potential component in further technologies; (6) the economy – the pattern of goods and services produced – adjusts to this, including costs, prices, and technologies.
In certain cases, once a threshold is crossed, this leads to cascades of destruction and creation.5 It is important to be aware that this evolution is neither completely random nor in any way predetermined. There are moments in which the evolving technology “chooses” and other times at which it simply advances on its path. That has important consequences for the potential to steer technological evolution - there must be developments we can to some extent predict (at least over a limited time horizon) and moments we cannot.
The importance of the economy in all this leads Arthur to reformulate its role and structure in a very interesting way. Rather than see it as a system of production, distribution and consumption of goods and services, he takes a wider definition: “the asset of arrangements and activities by which a society satisfies its needs” (Arthur Reference Arthur2009, 230), and rather than see the economy as the context or container of its technologies, he sees it as constructed from its technologies. This fundamentally changes the balance between economics and technology studies in understanding innovation. Technologies constitute and shape the economy’s structure. The economy emerges from its technologies – and thus continually forms and reforms as its technologies change. As the technology builds, it transforms the structure of the economic flows and decisions, and the transformed economic structure then enables changes in the technologies – the bootstrapping that we have seen for the technology actually also transforms the economy. And in the process, this bootstrapping changes the structure of society, or at least of many of its institutions (such as its banks, but also its ethics, laws, governance, etc.) (see Padgett Reference Padgett, Arthur, Durlauf and Lane1997, Reference Padgett, Casella and Rauch2000).
In conclusion, Arthur offers a first plausible theory of technology, although not (yet) one from which metrics of innovation can be derived. The importance of that theory is that it actually deals with the second order dynamics in which most innovations studied are embedded – it deals with the change of change, both in technology and in economics. It inverts the relationship between technology and economy, and thereby the focus of research on innovation – rather than distilling from economic data policies and measures to improve innovation it argues for the reverse, and whether that will in the end be correct or not is not as important as the fact that we can begin to build on his work to construct a theory of innovation that fuses the technological and economic dynamics into one, and extends both to encompass all forms of human-engendered organization.
Lane and Maxfield: The Innovator’s Perspective
Lane, Maxfield, and their collaborators (Reference Lane, Maxfield, Arthur, Durlauf and Lane1997, Reference Lane and Maxfield2005) focus on how people view, conceptualize, and act in a reflexive way between their known past and their unknown future. In that interaction, ontological uncertainty plays an important role, the uncertainty that is the result of simply not knowing what the future will look like or bring. At the level of the individuals involved, reducing that uncertainty (which depends on the actors’ beliefs about the kinds of entities that inhabit their world, about the interactions among them, and about how these interactions might change) in any firm and specific way is the wrong thing to do. But by relating past, present, and future in narratives that create a semblance of order, yet are easy to change, exploration of futures is both enabled and to some extent controlled. Such narratives allow the actors to back into the future. The (reduced) ontological uncertainty involved both allows for invention and limits the total range of inventions likely to emerge. The narrative thus creates a kind of path dependency for invention. An interesting aspect is that there may be a relationship between the extent to which the past is flexible rather than fixed in the actor’s mind (which might facilitate the changeability of the narratives) and the facility with which an actor can explore new ideas.
At the level of the local agent network, a similar role is played by the attributions of the actors to the other agents in the network: what are the qualities, functions, relevant attributes of different actors and relationships that are deemed relevant, and how do these relate to one another? Invention is essentially the generation of new attributions (new, different ways to look at an artifact or process; ascribing a new function to it, for example, or suddenly noticing another way to use it, or an aspect of it that one had until then overlooked). Such attributions arise in generative relationships among agents.
Though it is not possible to pinpoint the new attributions that may emerge one might, according to Lane and Maxfield, be able to assess the generative potential of a relationship by considering five characteristics: (1) aligned directedness (degree of alignment of the group of agents toward a particular objective), (2) heterogeneity among the agents, (3) mutual directedness (extent of focus on reciprocal relationships between the agents), (4) appropriate permissions (relevant opportunities for communication among agents), and (5) opportunities for action. These can be seen as the basis for relevant metrics concerning the inventive and innovative potential of the interaction between the agents.
Finally, as Lane and Maxfield move from the local corner of the global network in which inventions may occur to the network as a whole, their concern changes again (and so do the concepts involved). The network is seen as consisting of established competence networks and scaffolding structures put in place to construct new competence networks. The latter are governed by their conventions, both explicit (membership of a professional society) and implicit (a shared way of using expressions and abbreviations). The dynamics between these two consist of search (from a point in the scaffolding network) into the various potentially relevant competence networks, in order to identify potentially alignable members of the scaffolding structure, information dissemination (to the potential new members), interpretation (by the latter), and channeling (using the scaffolding structure to channel activities that may reinforce and expand it).
All in all, Lane and Maxwell’s work presents a phenomenology of invention and innovation processes around the concept of ontological uncertainty about the future. Such uncertainty is endemic because the transformation that is brought about by the innovation does not correspond (or only very partially corresponds) to the intentions of the individual agents. Narratives, generative relationships, and scaffolding structures all work to enable agents to cope with ontological uncertainty, in part by temporarily holding it at bay (in narratives), in part by offloading, segregating, and channeling it into special-purpose venues where interactions are highly controlled. At the same time, ontological uncertainty is uncovered, explored, and exploited in special relationships between agents.
But the work also introduces three theories of relevance to invention and innovation studies: the narrative theory of action, the theory of generative potential, and the theory of scaffolding structures. It is our opinion that these together provide a highly relevant and effective toolkit to study the process of organizational change induced by invention and innovation. I cannot here enter into details, but have to refer the reader to the publications mentioned.
Open Questions
Which of the thus far unanswered questions may we expect to be able to answer by applying this approach? As previously mentioned, the measures used in economics to identify invention, inventiveness, innovation, and related phenomena are predominantly a-posteriori indicators. Studying statistical correlations between them helps us to understand the context of invention and innovation, and which conjunction of variables influences the processes, but not how invention and innovation happen. Combining the approaches of Arthur with those of Lane and Maxfield lays the foundations for studying just that. We could then begin to develop the correct metrics to assess change, and then also to impact the process itself.
The distinction between replicative and innovative entrepreneurship is firmly established in the literature. But what interests us is how a non-inventive entrepreneur might become an inventive one. Knowing that would help us promote innovative entrepreneurship in a more focused way, create more conducive social, legal, and economic contexts, and adapt our educational strategies, for example.
Moving a level up, to the community, we remark that the study of innovation has enabled us to characterize at least loosely what makes a community innovative (see Florida Reference Florida2002), but does not enable us to understand the process by which that community has acquired such an innovative culture. That would be particularly relevant to understanding our current western economies, but also how in parts of those (for example in the financial and information technology domains) excesses are triggered (other than through simple greed).
At all three levels, one important aspect of our work will (again) be to try and evaluate choices made against options not chosen. What is the weight of a particular technical choice in the development of an invention? What is the impact of choosing to develop it for a particular purpose and not for another? How about choosing among one of the many options open to create scaffolding structures? What was (were) the decisive factor(s) in developing an innovative community, and what is the impact of that (those) factor(s) on the form that community takes?
Combining these ideas would enable us to map some of the processes leading all the way from the emergence of the ideas and decisions that engender inventions, via the network dynamics responsible for their spread into the wider world, to their implementation in different contexts, and to their eventual unanticipated consequences for sustainability and the challenges these pose.
Improved understanding of that chain of processes and events should ultimately enable us to modify it in ways that deal more effectively with the initial challenges and minimize or mitigate the unanticipated consequences, so as to ensure improved sustainability of the technology, the economy, and more widely the socioenvironmental system. In the following sections, I will try to illustrate how these ideas might be used in practice.
The Inventor and the Context: Niche Construction
Material innovations play out at the interface between a society and its natural environment. At that interface, techniques do not follow either the logic of the society or that of the environment. Though they relate to both they are not determined by either. To understand the logic involved, we need to adopt a non-determinist approach, in which the role of the maker/inventor’s ideas and choices is at the core of our reasoning, and we focus on how it articulates with the outside, material, world. As we saw in Chapter 10, that articulation plays out in the interface between solutions and challenges.
The chaîne opératoire approach first introduced by French anthropologists and archaeologists has greatly advanced our understanding of the procedures by which artifacts are created (van der Leeuw Reference van der Leeuw1976, Reference van der Leeuw and Lemonnier1993; Lemonnier Reference Lemonnier1992, Reference Lemonnier2012; Boëda Reference Boëda1994, Reference Boëda2013; and others), and has drawn our attention to the cultural context of creation. It aims to reconstruct the process of making, from the traces left by the makers’ actions on the objects made to the actions that were responsible for these traces. By reconstructing the sequences of action whereby artisans (and users) act on matter in the production (and consumption) of things in order to deal with challenges they face, this method encourages a thoroughly relational, systemic outlook on materials and artifacts. Every object is the outcome not only of, for example, the choice of raw materials, but also how the materials were prepared, how the artifact was then formed, and finished – and how any one choice in the sequence impinges on the others. Hence one begins to see the finished artifact not as some fixed entity, but as a kind of emergent stabilization from among a field of forces that are in some tension with one another – change a pottery firing technique and one may have to change the clay; change a decorative motif, and a different pigment may be required.
But the chaîne opératoire approach does not put this process in a wider, equally dynamic context that might help us understand how change occurs in any specific manufacturing tradition. To achieve that, as Knappett et al. (in press) have argued, we need to move from ontology to ontogeny. In thinking about actions, and the humans performing those actions, the next step is to contemplate:
1. Which dynamics may be responsible for variations in the instantiation of a technological tradition, leading to invention and innovation within such a tradition?
2. Given such variation, how do societies maintain a particular manufacturing tradition?
But the two questions constitute a tangled hierarchy (Dupuy Reference Dupuy1990), so one could therefore also invert them and ask:
1. How do societies dynamically maintain a particular manufacturing transition?
2. How does the dynamic involved in maintaining a tradition nevertheless allow for the emergence of novelty?
Among the useful concepts that a comparison between the emergence of novelty in biology and in society offers us is niche construction (Odling-Smee et al. Reference Odling-Smee, Laland and Feldman2003). Laubichler and Renn (Reference Laubichler and Renn2015) include this concept in their extended evolution model that emphasizes the links between the internal dynamics of a system and those that create its environment and link both. It reflects the idea that we cannot realistically represent or study invention or innovation without taking into account the fact that it occurs in, partly shapes, and is shaped by, its context. In the process, inventions and innovations create a dependency relationship with their niches in the wider context, and if, for some reason or other, that context changes, the invention may well disappear or be transformed. Conversely, if the innovation is no longer produced, the niche will disappear.
When applying this concept of niche construction to our study of technological invention, and in particular to the relationship between the inventing actor and the context in which invention occurs, we should articulate our perception – which should be as complete and unbiased as possible – of the different functions, materials, techniques, etc. that constitute that context in the world out there with a perspective on that context representing the actor’s subjective point of view. That perspective is always partial, biased, and part-driven by social, cultural, and other factors external to the material context of innovation, and its object of study is how the maker’s perception articulates these factors with the material conditions of manufacturing.
The stage for this articulation is the interaction between the objective context of manufacturing and the subjective map the inventor has of it. In the process, the external (natural and social) world and the internal (perceptual) world of the actor (partly) shape each other. Over time, this engenders a coevolution that in turn shapes the wider context of invention and innovation in what we call a technological tradition. In this coevolution, each and every technological choice, once it is made, limits the total option set of future choices and generates its own set of unintended consequences, eventually leading to new solutions. The same is true of every social, organizational, and institutional choice made.
The domain in which material and procedural inventions occur, which we could call the technosphere, thus has a logic all of its own, which does in part shape, and is shaped by, the path dependency of a society around its evolving technology.
There are (at least) three levels of knowledge involved in shaping that coevolution:
1. The slowest to change is the collective knowledge that is shared between the members of the community involved. Change at this level involves changing the worldview of the community, its habitus, its approach to technology. The main barrier to such change is that the perspective of the community is limited by the things it has never thought about and which it therefore has no way to describe, analyze or conceptualize. Breaking through that barrier is itself a major invention/innovation. But there can also be conscious social barriers, for example through the protection of intellectual property rights.
2. At the level of the individual one has to take tacit knowledge (‘know-how’) into account, which has either been subsumed under more conscious conceptual knowledge and customs or resides in the physical, neuro-muscular behavior of the human body. It is difficult to acquire, requiring substantive and often long apprenticeship, but it is also difficult to change as it is not embedded in our conscious memory but is exercised as routine movements and actions.
3. But the individual also has conscious knowledge (‘know that’), which is subject to conscious learning and is therefore the easiest and quickest to change. It actively involves the conscious mind, planning and changing behavior. Yet one must remember that such conscious knowledge is also limited by its boundary with the unknown – those processes, questions, and challenges that one has never thought about. It is in this domain that inventions are born most easily.
Looking at the conceptual aspects of techniques in this manner, as anchored in the mind rather than constrained by natural resources and the technological environment, makes a plausible argument for the fact that novelty is limited by the way in which traditions are anchored conceptually and in practice. But how might the same conceptual dynamics engender change? To answer that question, we need to look into the ways in which the practitioners of technologies articulate their relationship with the outside world, and in particular we need to give a central role to choice. Humans are making choices at every step of the way in the manufacture of even the humblest artifact – which means that technologies are mindful and full of intent (and as stated, these choices are typically interdependent as well). That a technological approach then becomes, in this recognition of choice, inherently cognitive (though not by default cognitivist) is worth emphasizing, because it is quite distinct from a materialist or biological outlook.
Creation, Perception, Cognition, and Category Identification
I have already cited the eminent anthropologist Roy Rappaport, who said in a lecture series I attended at the University of Michigan in Ann Arbor in 1977 that “Creation is the simultaneous substantiation of form and information of substance.” It involves a back and forth between mind and matter in which a form (an idea) is given shape in the material world. That process is iterative at two levels. The most evident of these is the fact that the maker begins with an approximate idea of what she or he intends to make, and during manufacture both corrects that idea and fine-tunes the product made. But there is also a deeper level in which the process of creation is iterative: that of defining the categories to be distinguished by the maker in the process of making. At that level, the iteration involves the interaction between perception and cognition in the mind of the maker. Modern cognitive science is in the process of learning how this works in the mind, but as a noncognitive scientist I do not pretend to be able to look at this process at that level. Rather, I would like to use the simplified model of category creation that is summarized in Figure 9.1, of which the basic idea is that the process of relating categories to observations is dependent on which of the two serves as a referent.
To summarize, when a concept is being generated, this is a process of comparing an idea as a subject of exploration with phenomena that serve as referents. In such a comparison, the emphasis is on similarities. After a while, the concept is established because one has a good sense of the phenomena that might belong in the category, but not yet of the phenomena that in the end might not. To gain the latter insight, the direction of the comparison is reversed – the category becomes the referent and the phenomena are compared to it. In that process, the mind emphasizes the dissimilarities between phenomena and concept, so that in the end one knows both what belongs and what does not belong in the category.
We have seen how this description of the process of categorization leads one to distinguish between open categories (where one knows which phenomena might belong but not yet which do not) and closed categories (where one knows which phenomena do belong and which do not). It seems to me that this description does indeed summarize for our purposes what goes on in the creative process, leading to the categories adopted from among the many potential ones that the creator does indeed understand and actively exploit in thinking about the manufacturing process. But of course it ignores a number of other factors, such as the emotional ones that are increasingly recognized as important in category formation and decision-making.
On the basis of this schema, one can distinguish three different cognitive spheres or cognitive spaces that are simultaneously present in the mind of a creator during manufacture:
A certainty sphere that is fully cognized, which is made up of the closed categories in the mind of the maker of (not only material) artifacts, so that he or she knows exactly what is what and has a fixed idea on how to proceed;
A possibility sphere, which consists of the open categories in the mind of the maker, where the latter is still to some extent undecided and therefore flexible in his or her interactions with matter;
A problem sphere, consisting of the domain for which there are no categories (yet) in existence, and which therefore is that of the unknown and dimly perceived but unsolved challenges, about which the maker has no idea at all.
If we next look in some more detail at how the maker deals with the problem sphere, we need to take into account that the human perception of the present iteratively relates an assumed past to personal experience and projects the resulting vector into the future. In other words, there is an interaction between perception from an a priori point of view, which opens opportunity for variation, and perception from an a posteriori perspective, which limits variation – the former is focused on emergence, on novelty, and on possibilities and probabilities (opening categories), while the latter is focused on origins, on tradition, and on causality (closing categories). It is in that interaction that invention takes place.
How Are Technical Traditions Anchored?
Next, it is interesting to look at how this interaction engenders both stability and change. Based on a comparative and detailed study of a wide range of past and present pottery-making traditions from different parts of the world that produce highly similar, globular pottery I have in an earlier publication (van der Leeuw Reference van der Leeuw and Lemonnier1993) focused on the importance of choice in studying creation, including manufacturing. That has led me to conclude that any approach to exercising a technique is anchored at a minimum of three different levels, in increasing order of flexibility and opportunity for change.
1. First of all there are the temporal, spatial, and functional conceptions of the objects to be made, anchored in the minds of the makers’ community. These shape the topology of the objects to be created, their partonomy (the relationship between a whole object and its parts), and the sequence in which the creators create their products. In most technical traditions, all three of these are deeply anchored in the collective as well as the individual (tacit and conscious) knowledge of the individuals involved, and not likely to change. They constitute the domain of the closed categories and as such anchor each individual technical tradition in its own way. New procedures to be introduced are generally such that they take the existing conceptions of topology (space), sequence (time), partonomy, and function into account. Not doing that would make innovation extremely difficult.
2. Next in my overall scheme of things are the executive functions, the tools and techniques acquired to instantiate objects that meet the existing topology, partonomy, function, and manufacturing sequence. Importantly, these executive functions include tools and the ways in which these tools are used. Executive functions are part of the possibility space in the maker’s mind. They are generally anchored in both the unconscious and the conscious knowledge of the person practicing a technology. Change in these executive functions will initially involve the conscious knowledge of the maker who experiments with the effects of a change, but once the usefulness of a particular change in executive functions has been established, with time, the tacit knowledge-base will also be involved, through longer-term practice of the actions concerned, so that they become anchored in the musculo-skeletal memory of the practitioner.
3. The third level is that of the choice of raw materials and other components of a technology, including their nature, their quantity, and their preparation. This domain is also part of the maker’s possibility space. Except in very constraining and limiting environments, these can be varied the easiest and adapted to changes in executive functions. Often, their adoption depends on the availability of parts, materials, etc. of other technologies. But the choices are made according to the ways in which the practitioners of a technology articulate them with their conceptualizations by means of the executive functions they adopt. That articulation is itself an interactive process.
I am positing that invention is part of the process that creates new categories in interaction between knowledge and data (closed and open categories) that occurs between the certainty sphere (closed categories), the possibility sphere (open categories) and the problem sphere (potential categories), and that the degree of novelty depends on the extent to which each of these spaces is involved.
The Locus of Invention
In practice, this interaction occurs between the (externally defined) context of the manufacturing process (the niche in which invention occurs), which encompasses both sociocultural (customs, institutions, economy, etc.) and material (resources, existing components and technologies, etc.) elements of that context, and the (internally defined) perception the creator has of those components. The articulation between these two is at any time a question of choice, but the choice is not (as is often assumed in the black-box model of novelty creation that relates input and output without looking at the dynamics occurring inside) random or unlimited. Choices are always limited by the reality and the perception of the niche to which the choice relates.
As a starting point, we must therefore attempt to characterize the niche in which a practitioner of a certain technology operates and the total set of contextual variables that might impact on the choices that the individual can make, whether inventive or not. Once that is done, we have to see if we can identify among that set those variables that are actually perceived as sufficiently important to be taken into account in the practitioner’s approach to practicing the technology.
In Chapter 13, I have chosen the (admittedly relatively simple) example of manual pottery-making to illustrate the invention dynamic, relying on my knowledge of both the external and the internal perspectives of the context in which that craft is practiced by pre-modern potters (van der Leeuw Reference van der Leeuw1976, Reference van der Leeuw and Longacre1991, Reference van der Leeuw and Lemonnier1993, Reference van der Leeuw and Binder1994a, Reference van der Leeuw, Latour and Lemonnier1994b; van der Leeuw & Pritchard Reference van der Leeuw and Pritchard1984; van der Leeuw & Torrence Reference van der Leeuw, van der Leeuw and Torrence1989; van der Leeuw & Papousek Reference van der Leeuw, Papousek, Audouze, Gallay and Roux1992; van der Leeuw et al. Reference van der Leeuw, Papousek and Coudart1992).
Introduction
This chapter is a direct continuation of Chapter 12, so as to divide a very lengthy exposé into two parts. It has two aims: first to illustrate the argument I made in Chapter 12 with a substantive case study, and second to explore some of the consequences of this vision on invention and innovation for our understanding of societies and societal dynamics. For that illustration, I have chosen pottery-making as an example, based on my personal familiarity with that craft, both from an internal (maker’s) and from an external (scientific) perspective (van der Leeuw Reference van der Leeuw1976, Reference van der Leeuw and Picton1984, Reference van der Leeuw and Lemonnier1993).
The Niche in which the Potter Operates
One can, at least in principle, outline a generalizable external model of the global niche in which the artisan works that is valid for most, if not all, traditions of manual pottery manufacture. It has to include the natural and social context in which the potter works, the raw materials and techniques used and their affordances and constraints, the organization of the work, and finally the range of different functions for which the artifacts can be used and their implications for the products’ shapes and other characteristics. As the potter proceeds through the different stages of the manufacturing process, her actions are all focused on dealing with different kinds of challenges that are the result of the interactions between the different variables involved. We could in effect, from the potter’s point of view, consider the niche in which she operates as her possibility and problem spaces. How that niche is approached depends of course on the particular perspective of the individual potter, which in turn is (part) shaped by the society and culture in which the potter operates.
In Figures 13.1–13.7 I have tried to give a – necessarily incomplete and somewhat simplistic – idea of the niche in which the potter operates, by representing some of the variables that she has to take into account as she goes through the various stages of manufacture. It is important to emphasize here that the potter does not consciously take all these variables into account throughout the whole manufacturing process. An important aspect of manufacture is that it is staged or chunked in the sense that at each stage in the sequence (as represented by Figures 13.2–13.7), the potter is specifically preoccupied with a subset of the total set of variables that are involved in manufacture. These are considered in detail. But the variables involved in other stages do play a role in the background, as the potter also has an idea of what the end product of each stage needs to be in order to satisfy the conditions of following stages, so that the result is a product that fulfills the expectations of the community for which it is produced. Table 13.1 summarizes the technological, organizational, and economic responses of potters to different societal contexts in which they may work. It is based on a systemic perspective and the assumption that, though there is individual variability, certain generalities can be defined in this domain.
Figure 13.1 The wider context of pottery-making includes the physical, geographic, technological, social, and economic environment in which the potter works. Under each rubric only some of the actual variables are presented to give an idea of what each category stands for. These variables will differ from case to case.
Figure 13.2 Once the potter starts gathering the raw materials, she will have a number of variables from the different categories in this figure in mind. If she intends to make cooking pots, for example, the wall of the pot has to be porous because heat gets transmitted into the pot through the water that penetrates the wall. Hence the potter looks for clay with relatively large nonplastic particles in it, or if that is not available she will add such particles. But in deciding which materials to use, she will also take effort into account (depth of clay, distance, effort involved in mixing).
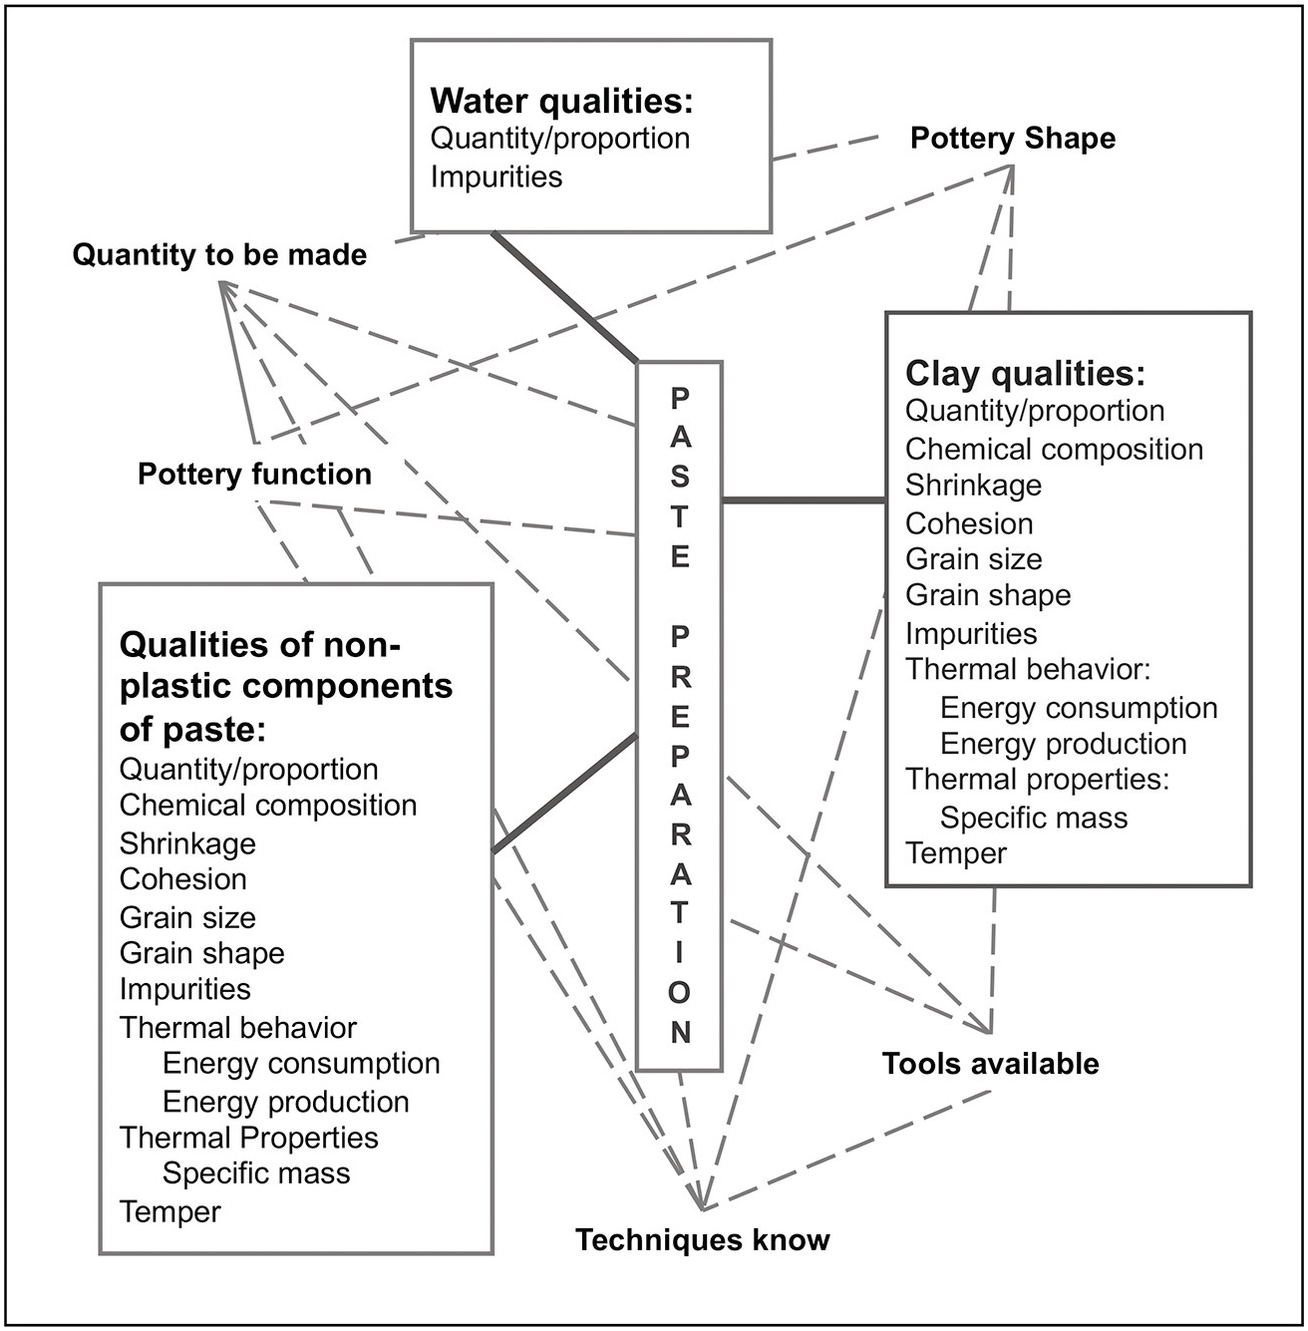
Figure 13.3 Paste preparation is a question of dosage and mixing of the plastic and nonplastic ingredients and water. The characteristics of each of these three are taken into account in determining the proportions of each to mix. More water makes the paste easier to shape, but if there is too much the paste will lose coherence. The exact dose of water depends to a large extent on the proportions and the nature of the clay and the nonplastic materials chosen, which in turn depend on the function of the pottery, as we see in Figure 13.2.

Figure 13.4 Conceiving the shape and other qualities of the pottery to be produced integrates the topology, partonomy, and sequentiality of her conception of pottery, her assessment of her capabilities in handling the technique chosen, the function(s) of the pottery to be produced, the nature and quality of the tools at her disposal, as well as the nature of the paste to be used (see Figure 13.3). But it also relates to the quantity to be produced, and thus to the size of the market, the capabilities of the workshop, etc. For mass production, for example, molding or throwing are more efficient than coil building.
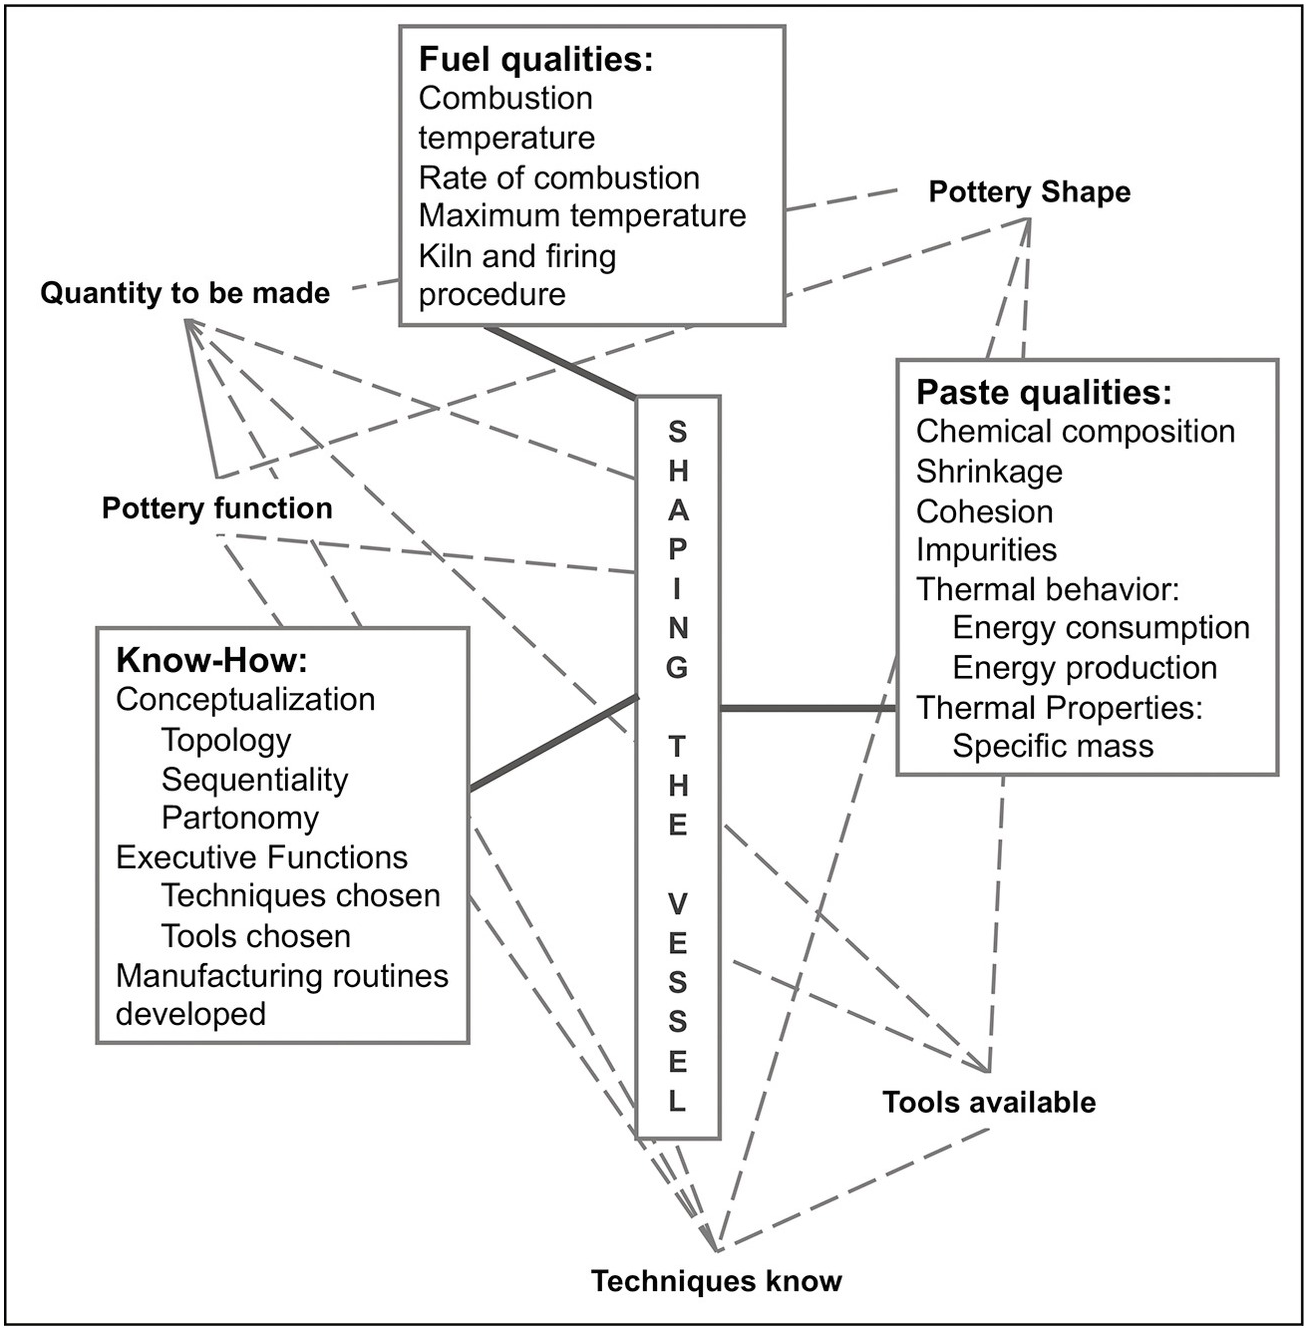
Figure 13.5 Once the potter has conceived the vessel, the same factors will play a role in the shaping of the object. In reality, that shaping occurs in two or three phases, (1) shaping, (2) drying, and (3) firing. Much of the shaping will now be a question not of the conscious memory of the potter, but of her know-how, the musculo-skeletal memory and the memory of the nervous system, here summarized under “manufacturing routines developed.” The second phase, drying, is one in which only the atmosphere of the pot and the time allotted to drying are controlled. It may be interrupted by some minor modifications in the shape of the pottery or by decoration, but it does not require any major handling. In the third phase, firing, the paste and fuel categories play an important role, but they are integrated in the process of conceiving of the pottery. The categories “fuel qualities” and “paste qualities” have been added to this figure for reasons of space, although they should be seen as part of the last one.
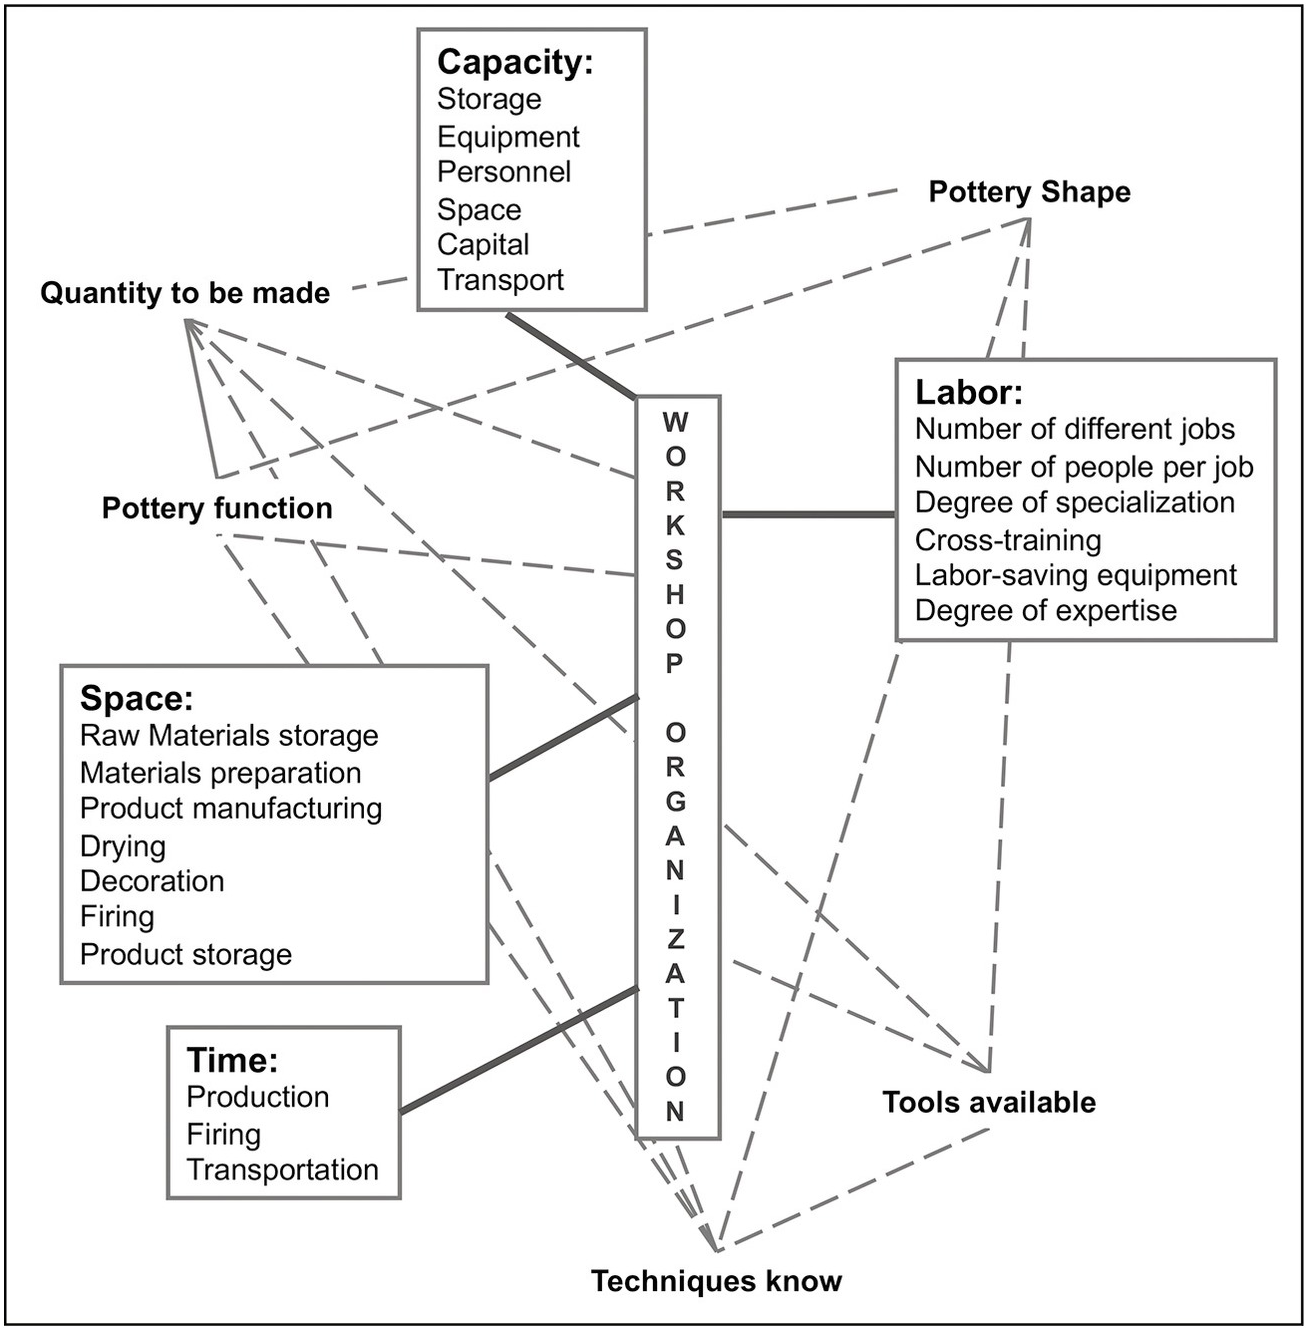
Figure 13.6 The workshop organization determines the overall production capacity, but is itself composed of such elements as the degree of specialization of the functions to be fulfilled, and thus the number of people involved in the workshop. That in turn relates to the family structure and the question whether outside help is hired or not. But it also relates to the competency of the members of the workshop, its spatial organization, and the time involved in firing, for example, which is again related to the means of firing chosen and the length of firing time needed for the products made. Ultimately, of course, the workshop’s capacity greatly impacts on the quantity of pottery produced, and thus on the economics of pottery manufacture in the place of production.
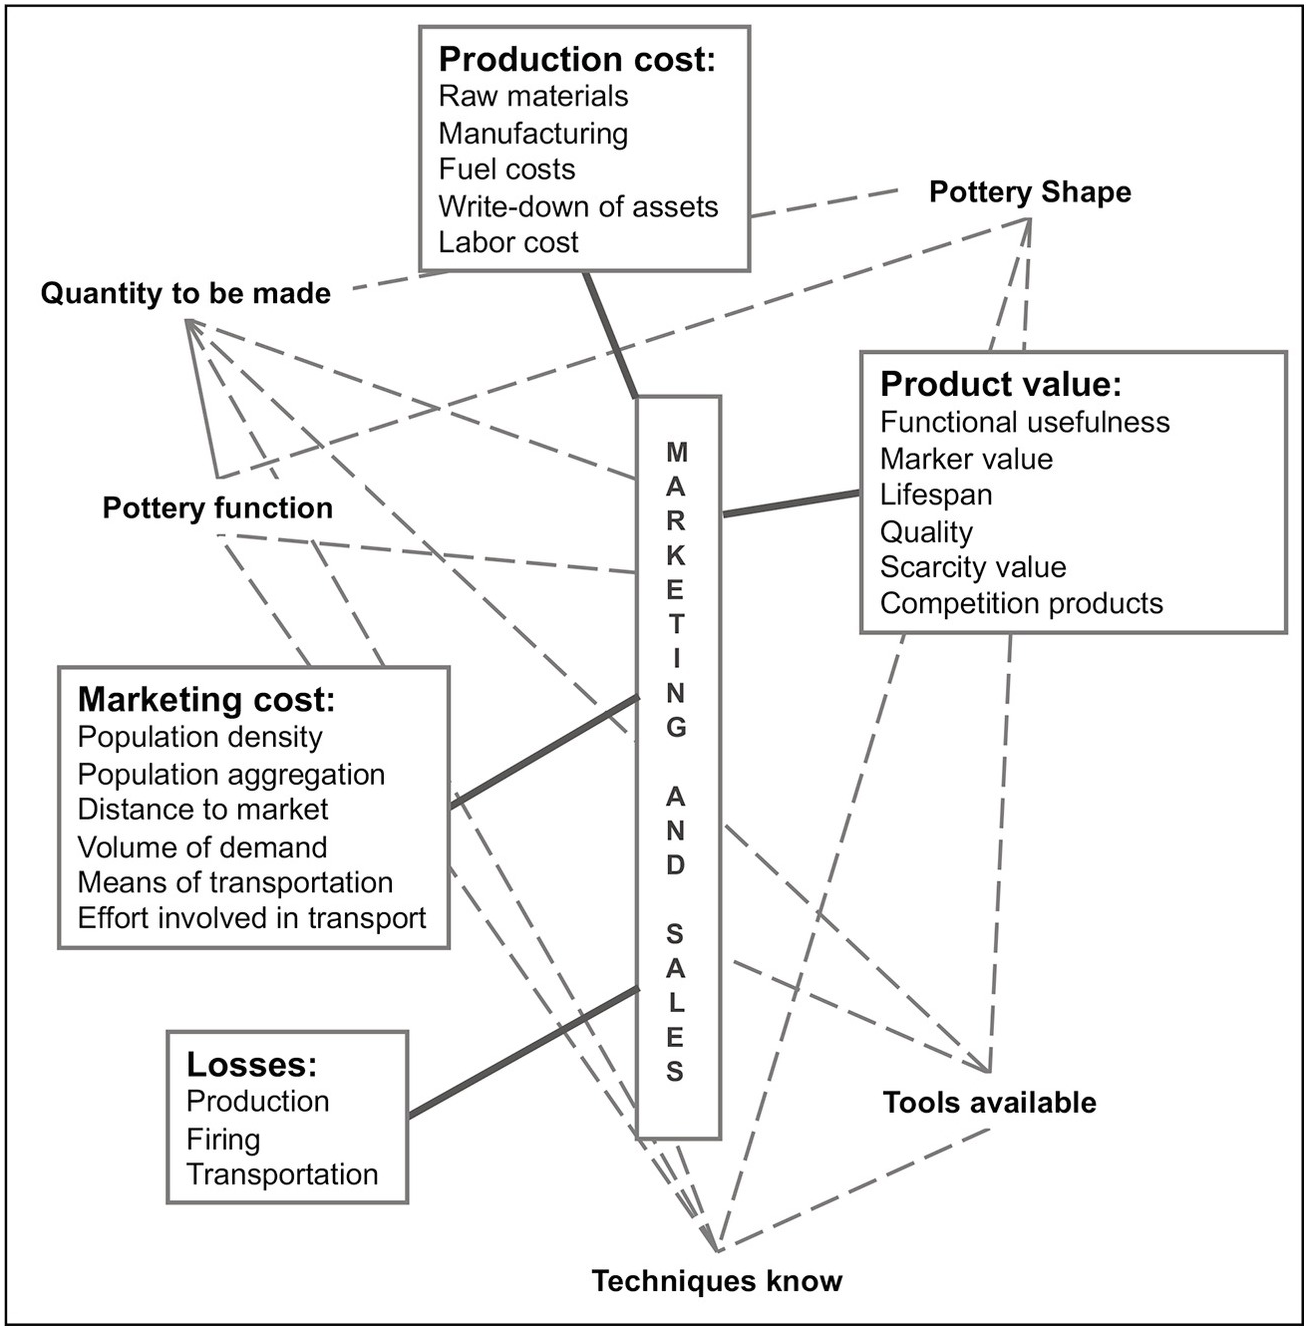
Figure 13.7 Throughout the manufacturing process, in all the phases in which the potter conceives the pottery and makes her choices about how to instantiate it, the marketing of the pottery and the organization of the workshop (Figure 13.6) are domains that are systematically taken into account, as together they determine the quantity and quality of the products to be made.
Table 13.1 The economics, technology and workshop organization of pottery-making articulate as illustrated here. For simplicity’s sake I have distinguished between six different system states that combine these variables. As is clear, these states do not impose the use of specific materials or the manufacture of specific kinds of products, but they constrain the range of manufacturing and firing techniques used as well as the organization of the workshop, depending on the quantity of products to be made and marketed. In general, the larger the number of pots made, the narrower the tolerance for variation, and thus the greater the interdependency between the different variables.
| Variables | Household production | Household industry | Individual industry | Workshop industry | Village industry | Large-scale industry | |
|---|---|---|---|---|---|---|---|
| Economy | Time Number Organization Locality Hired hands Market Raw materials • Clay • Temper • Water • Fuel Investments Seasonality Labor division Time/pot Status | Occasional One None Sedent. or itinerant None Own use Local Local Local Local None Production as needed None High Amateur | Part-time Several None Sedent. or itinerant None Group use Local Local Local Local None Season w/o other work None High Semi-specialist | Full-time One None Itinerant None Regional Local Local Local Local Few All yr. except winter None Medium Specialist | Full-time Several (Guild) Sedentary Some Village/town Neighborhood Neighborhood Local Neighborhood Some All year in good weather Some-considerable Medium-low Specialist | Part/full time Several Certain Sedentary Some Region (wide) Neighborhood Neighborhood Local Neighborhood Some All year in good weather Some-considerable Medium-low Specialist | Full-time Many Certain Sedentary Labor force Regional and ex-port N’hood/distant N’hood/distant Local N’hood/distant Capital All year Detailed Low Narrow specialist |
| Technology | Manuf. technique Tools • Sed. Basin • Wheel • Drying shed • Kiln Raw materials • Clay • Temper • Water • Fuel Range of pots Functions/pot | Hand/sm. tools None None None Open fire Wide range Wide range Any Wide range Narrow Wide range | Hand/sm. tools None None; rot. supp. None Open fire Wide range Wide range Any Wide range Narrow Wide range | Hand/small tools None Turntable None Impermanent Wide range Wide range Any Wide range Wide Wide range | Mold/wheel When needed Various kinds Needed (Semi)permanent Narrower range Narrower range Any Narrower range Narrower or wide Narrower range | Mold/wheel When needed Various kinds Needed (Semi)permanent Narrower range Narrower range Any Narrower range Narrow or wide Narrower | Wheel/cast/press Needed Kickwheel Needed Permanent Narrow range Narrow range Any Narrow range Narrow or wide Narrower |
| Examples | Kabyles, N. Africa | Cameroon, Tanzania | Tibet, Turkey | Bergen-op-Zoom Farnham | Tzintzuntzan Djerba | Wedgwood Delft |
To date, few people have looked intensively at alternatives that might have been open to inventors, nor at the implications of the actual choices made among these alternatives (Pritchard & van der Leeuw Reference Pritchard, van der Leeuw, van der Leeuw and Pritchard1984, 11–12). Rather, most have taken such choices as a given, aiming as they did at describing how things were done rather than investigating why they were done in a certain way and not in others.
We have seen in Chapter 12 that we need to investigate the choices made and those not made together, rather than only those made. Choices apply to the modalities of production, but the sets of alternatives among which they figure are anchored in the much wider realm of the perceptions and conceptualizations of the potter, her mappa mundi (Renfrew Reference Renfrew1982). Within the territory on that map, she will find it easy to adapt herself to the requirements of matter and energy, but the boundaries of that territory are the real limits to her capabilities. The proposed shift in approach therefore also opens up a (potentially rich and heavily underexploited) avenue to the study of changes in cognition. We need to investigate how people choose. What determines their perceptions, their biases, their reasoning? Almost certainly, there are aspects to these questions that are highly cultural, as well as others that are more closely related to the biological mechanisms of human beings.
The sciences that could take the lead in such research are notably cultural and social anthropology. Maybe there is a gap in the market for a more sophisticated kind of ethno-archaeology? Even though a large number of descriptions are available in the ethnographic literature of how a certain potter uses a specific technique to arrive at a distinguishable form, hardly any comparative research has been done on the relationship between technique and form, and abstracted synthetic statements on the topic are virtually absent.1 The basis for research in such a direction has been laid by Krause in his book The Clay Sleeps (Reference Krause1985) and other publications (e.g., Reference Krause, van der Leeuw and Pritchard1984) that rigorously describe the formal logic of pottery making in three entirely different parts of the world.
Challenges Limit Products
If we want to study choices, alternatives, and variations in chaines opératoires, we must also study how, among the many choices that are theoretically open to a person making something, some of these are out of bounds because of specific, material, technical, or other issues.
Let us look at the role form plays in constraining construction techniques in ceramics. Each form poses certain problems of construction to each technique, which can be resolved in a number of ways. I will therefore approach technique and choice comparatively, trying to keep form as constant as possible by concentrating on the techniques involved in making globular or near-globular pots with a simple everted rim. The major constructional problems that such a shape poses are in part those posed by all pottery, in part those related to a specific shape or to a specific technique. Some of those that are relevant to my argument are the following:
1. How to control the shape of the vessel. As the making is a dynamic equilibrium between the potter and the material, control over shape is not self-evident. It is actually one of the most difficult things to achieve as a potter, especially if no tricks are to be used (van der Leeuw Reference van der Leeuw and Renaud1975, Reference van der Leeuw1976).
2. How to avoid the vessel collapsing or becoming deformed during construction (van der Leeuw Reference van der Leeuw1976). This problem is in this case particularly relevant to the base, because any pressure on a rounded base focuses on a very small area, and is thus more difficult to handle without deformation than when the base is flat.
3. How to keep the vessel in a fixed position during manufacture. This is another problem particularly relevant to round-based vessels as they cannot so easily be placed on their base.
4. How to ensure access to various parts of the vessel while it is being shaped. This aspect evidently relates to the mechanics of the human body, as well as to any cultural constraints on motion.
5. The speed with which the vessels may be made and the rhythm of work. If the work requires a number of interruptions during shaping, for example, the total day of the potter may have a very different structure than if it does not.
6. The width of the range of shapes that the technique allows the potter. Certain approaches allow the potter to make a wide range of shapes and sizes with minimal adaptations of the technique, while others do not.
These may all be seen as the nonmaterial dimensions of variability against which to assess the choices made by potters working in different contexts with different techniques.2 How potters’ know-how impacts differentially on these challenges is illustrated in this chapter by taking two examples, from different cultures, on how potters achieve essentially the same shape of (globular) pot.
Comparing Two Pottery-Making Traditions in This Light
In the following examples, I compare different ways of making essentially the same form, a simple globular pot, as found in two different pottery-making traditions. The interesting thing about this comparison is that is shows how in both traditions, and in all cases I found, the same set of challenges (as outlined) has constrained the ways in which the potters were able to produce the pots. Differences in manufacturing methods are therefore essentially differences in “work-arounds.”
Using the Paddle and Anvil on Negros Oriental, Philippines
In fieldwork in 1981 in Negros Oriental in the Philippines, I observed a number of variations on making globular pots that I have described elsewhere in their context (van der Leeuw Reference van der Leeuw1983, Reference van der Leeuw and Picton1984). Here, I will confine my descriptions to the actual shaping of the vessels.
Case 1 (Tanjay, Negros Oriental, Philippines, 1981, Photo 13.8, copyright van der Leeuw). The most traditional (and at the time of fieldwork almost extinct) of these begins with the potter taking a ball of clay, placing it on a simple wooden support that can turn slowly, opening it with a thumb, while the other hand keeps the support turning, and shaping only the rim of the vessel between the thumb and first and second fingers of one hand.
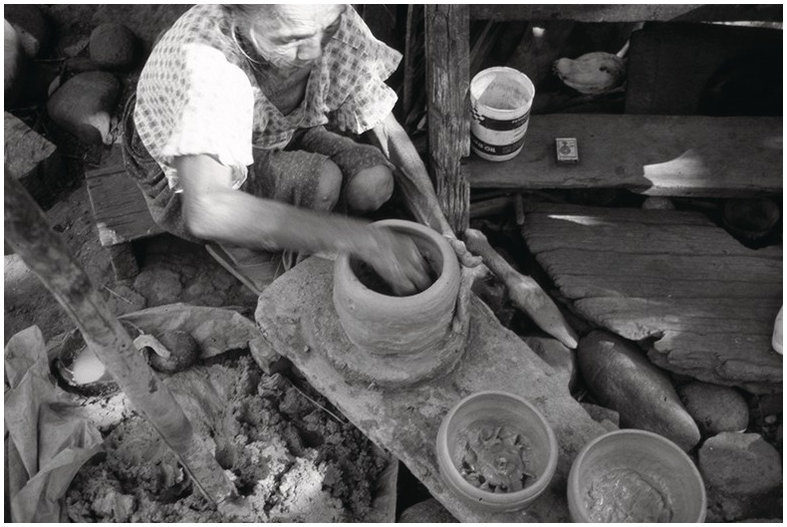
Photo 13.8 A female potter in Tanjay, Negros Oriental, Philippines makes a vessel by rotating a lump of clay on a small turntable. She began by opening the ball and shaping the rim, while leaving the remainder of the pot unshaped (see the two vessels she is not working on). Next, she is thinning out the wall between one hand supporting it on the outside and the other shaping it on the inside. After some drying, she will shape the bottom of the vessels with a hammer-and-anvil technique, then let the vessel dry and fire it.
The body and bottom of the pot are shaped the next day, out of the thick, unshaped lump of clay on which the rim sits, by means of a paddle and anvil technique based around a globular anvil inside the pot. The maximum diameter is shaped first, the shoulder next, and the base last, all the while rotating the vessel around its central axis. After another drying period, the pot is polished with a pebble and left to dry until it is ready for firing.
Case 2 (Zamboanguita, Negros Oriental, Philippines, 1981; Photo 13.9, copyright van der Leeuw). A variant makes the rim out of a coil of moist clay that is placed on the bottom of a fired vessel that stands upside-down (i.e., on its rim) on a flat surface, and which can turn (unpivoted). The pot is turned with one hand, the rim shaped between the thumb and the index finger of the other, which holds a piece of wet cloth. The rim is then set away to dry. Later, the potter fixes a flat “pizza” of clay to the underside of the rim and places the combination back in the sun for some more drying. The next day, the rest of the pot is shaped out of the pizza by means of the same paddle and anvil action. After some more drying, it is polished and prepared for firing.
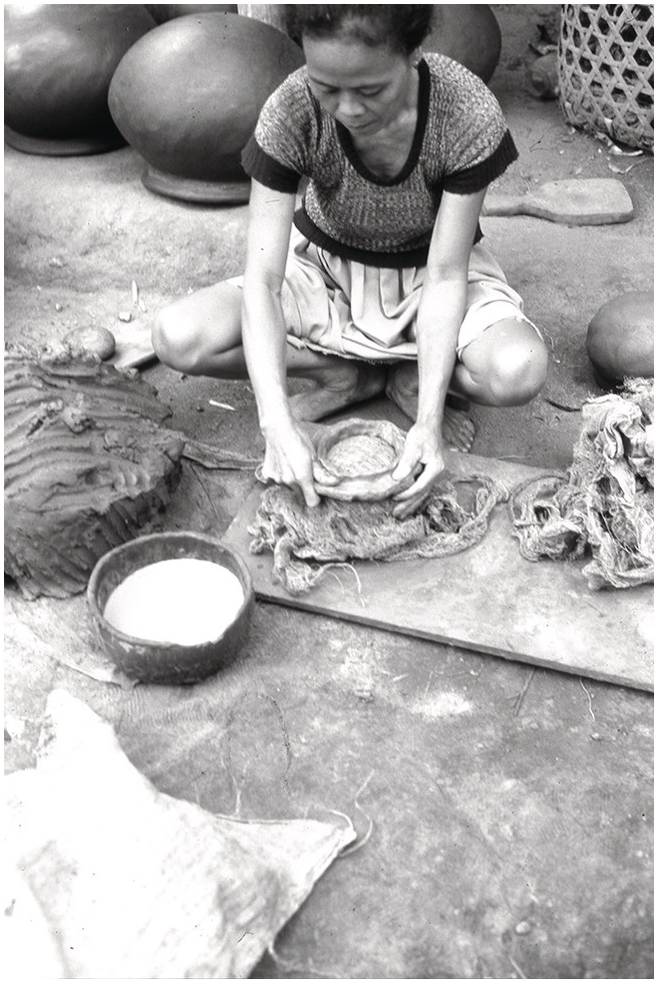
Photo 13.9 Another female potter in Zamboanguita, Negros Oriental, Philippines is shaping a coil of clay on an inverted, fired pot covered by a piece of coarse fabric that serves as a mold. This coil will be shaped into the rim and upper shoulder of the vessel. The fabric serves to ensure that the wet clay does not stick to the inverted pot. Behind her stand some finished pots, and lies a paddle with which the vessels are given their final shape.
Case 3 (Zamboanguita, 1981; Photo 13.10 copyright van der Leeuw). Here, both the upper and the lower part are made separately over an upside-down fired vessel that, as in the last case, can turn unpivoted. The upper part may consist of the rim alone, but more often consists of everything above the maximum diameter. Both the upper and the lower parts are formed by placing one or more coils of paste on a sheet of plastic that covers the mold. The clay is smoothed over the mold both with the hands and with the paddle (so that, sometimes, the mold literally serves as a large anvil). Both parts are left to dry for some time and are then joined. The joint is strengthened by beating it with a paddle on a proper (small) anvil. The vessel is then set away to dry until it can be fired.
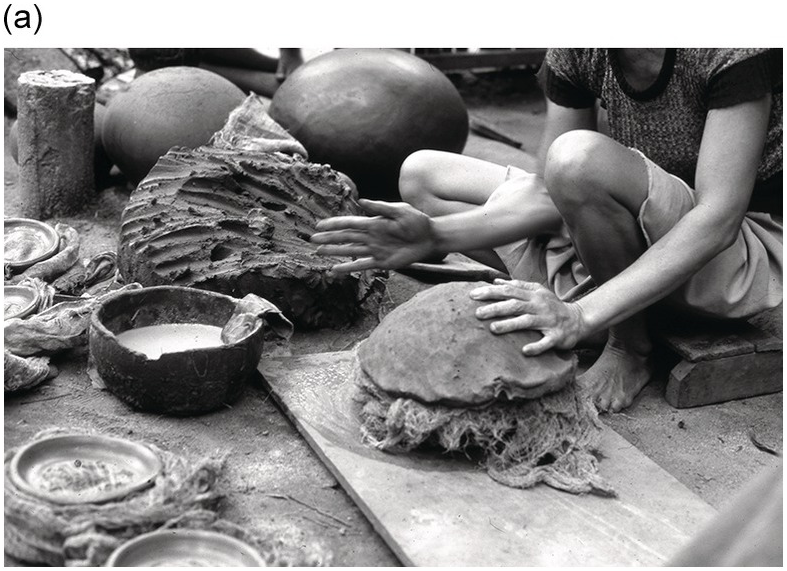
Photo 13.10a The same potter now shapes the base of a vessel over the inverted pot. After some drying, it will be united with one of the pre-shaped rims that lie in front of her, drying in the sun.
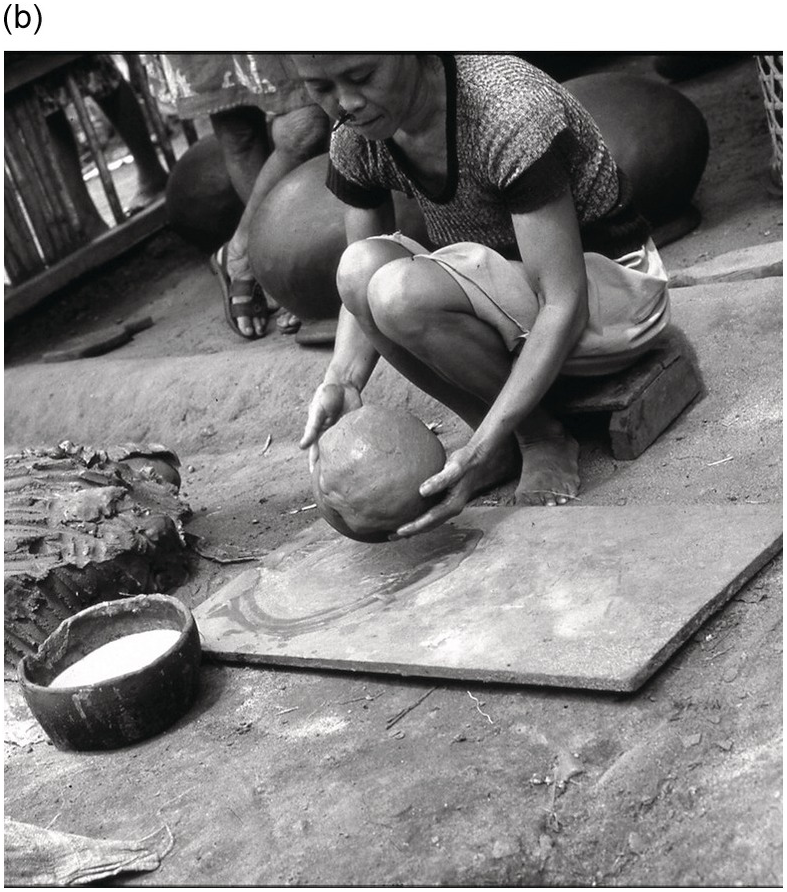
Photo 13.10b Once the two pieces have been joined, as in this photo, and have had some time to dry a little, the potter gives the vessels their final form by thinning their wall between a paddle (as seen in photo 13.9) and a rounded stone or piece of wood that serves as an anvil. Once that is done the vessel can be dried and fired.
Case 4 (San Carlos City, Negros Oriental, Philippines, 1981; Photo 13.11, copyright van der Leeuw). The sequence of steps constituting this production method is essentially the same as in case 1, but many more vessels are produced per unit time and the vessels are much larger. The support is in some cases a large potter’s wheel (made from a truck wheel) that does not differ from that used in thirteenth-century Holland for throwing. But in this case, the wheel is used as a turntable, rather than a true potter’s wheel. It was installed by the potter after he saw on a (Japanese) film of people throwing pots. But when asked he admitted that he had never been able to use it for that purpose. In the end he gave up and used the wheel simply as a turntable for the largest vessels he was making.
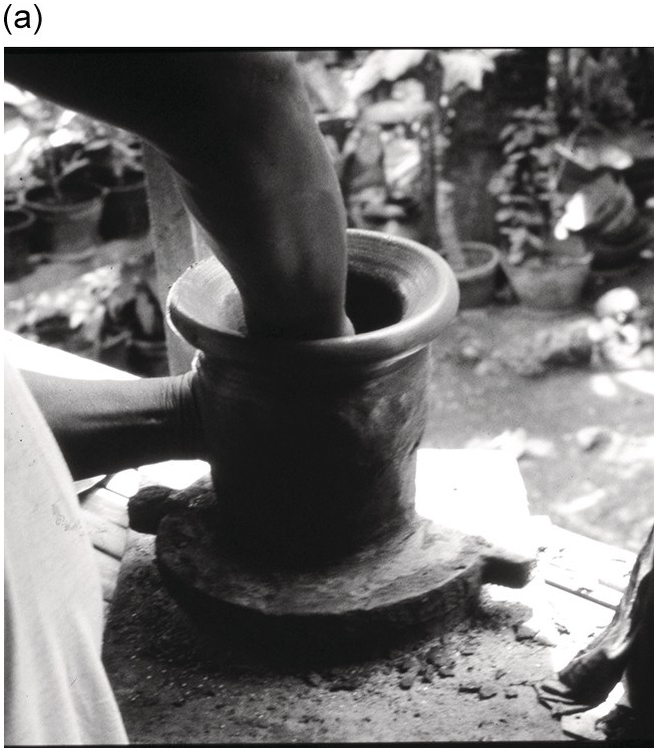
Photo 13.11a An (exceptionally male) potter in San Carlos City, Negros Oriental, Philippines shapes a vessel on a turntable by opening a lump of clay, then shaping the rim and continuing by thinning the rest of the lump somewhat between his hands.
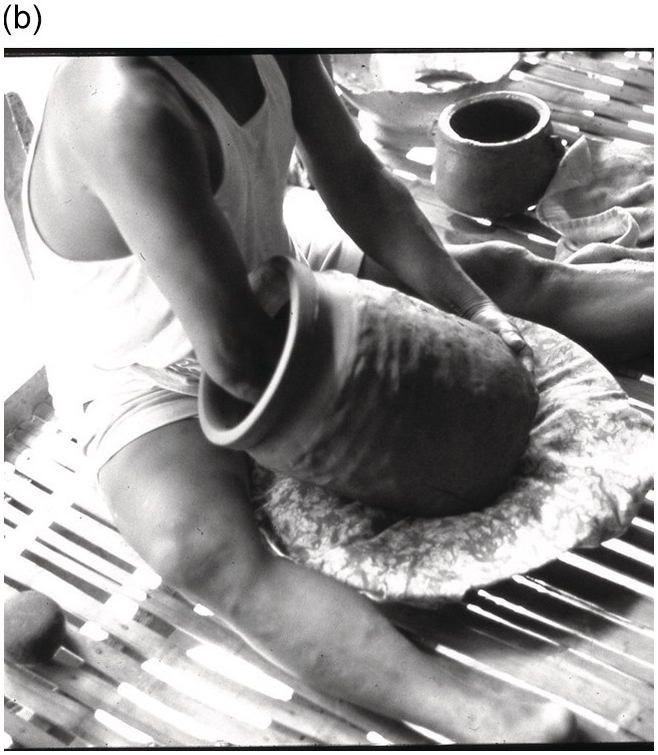
Photo 13.11b The potter then takes the vessel off the turntable, and places it in a fabric-covered basket so that he can start working on the base of the vessel. Ultimately, the vessel wall is thinned and the vessel given its globular shape between a paddle and an anvil.
Case 5 (Dumaguete, 1981; Photo 13.12, copyright van der Leeuw). This case resembles case 3, except that the pot that serves as a mold has been mounted, again upside down, on a pivot that stands in a bamboo so that the mold can turn much more effectively. The vessels made are bigger and the production is much greater. The upper and lower halves of the vessels are made separately in small series, from several thick coils that are smoothed over the mold with the paddle. They are then joined at the maximum diameter, again between paddle and (small) anvil. They are then set apart to dry until they can be fired.
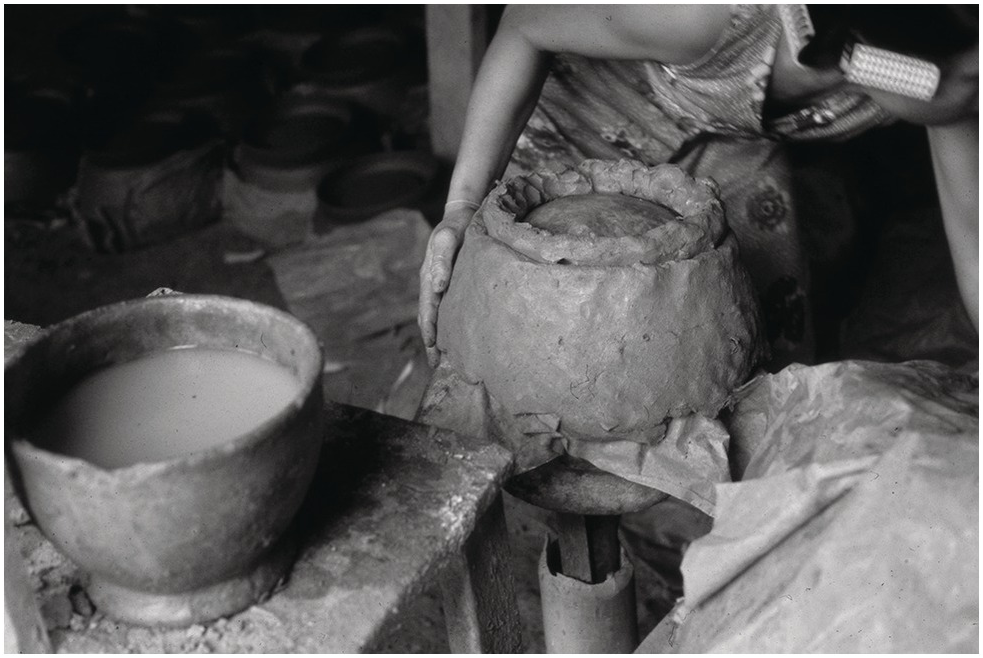
Photo 13.12 Another female potter, in Dumaguete, Negros Oriental, Philippines is shaping large vessels in two halves, by placing coils on a fired, upturned vessel that is fixed on a stick. The stick is placed in a hollow upright bamboo, so that the whole contraption can turn more freely than the turntables in the earlier photos. Three coils are shaped into the base of the vessel, and then another three coils are shaped over the same mold into its shoulder and rim (as on the photo). Finally, after some drying, the two halves are joined and left to dry until the pot can be fired.
Comparison
Comparing these cases, some interesting parallels and differences spring to mind. In all cases the basic sequence is the same: the lips (or upper parts) are made first (always in the same way), the lower parts later. In all cases, we also see the use of rotation around a fixed vertical axis, but the extent of its use varies. In cases 1, 2, and 4 it is only used to facilitate shaping the rim in a continuous motion, while the other parts of the vessel are made by means of discontinuous motions (between hammer and anvil) not strictly speaking around a vertical axis. But in cases 3 and 5 it is also used in shaping other parts of the vessel. In case 3 the pot is rotated while the paddle beats against the clay in an endless series of individual blows that shape the wall, while in case 5 the hand movement that shapes the vessel walls is continuous, against the rotating device.
In all cases, we also see tools used to determine the final (rounded) shape, be they molds (cases 2, 3, and 5) or anvils (cases 1 and 4). In two out of three (3 and 5) cases in the former group, the shaping tool also serves as a support during manufacture, while in cases 1, 2, and 4 that function is not fulfilled by anything. In cases 1 and 4, where the support is flat, the whole pot is made out of one lump, and that lump is worked in two stages: first the rim, made on the support while it is turned, and then the body, made with a paddle and anvil technique. In cases 3 and 5, where the support is a pot placed upside down, the vessel is made in two halves out of a varying number of coils. These halves are then joined. In case 2, the rim is made first, on an upside-down pot, and the body is made separately (a pizza) but is joined to the rim before the whole is shaped all at once between paddle and anvil.
Invariant elements in the manufacture therefore seem to be (a) its sequence, (b) the use of slow rotation, (c) the shaping of the rim, and (d) the shaping of the body (in all cases a paddle is used, while the mold, where used, is none other than a large anvil). Variations are possible in the (e) use which is made of rotation and its speed, (f) the nature, and (g) the timing of the support accorded the vessel during manufacture, (h) in making it out of one lump or out of several pieces of clay, (i) in the point in the procedure in which different parts of the vessel are welded together, and finally (j) in the drying periods needed. These elements seem to vary with the number of vessels produced per unit time (see van der Leeuw Reference van der Leeuw1983, Reference van der Leeuw and Picton1984).
The invariant elements are those that determine how a tradition may develop through time. In this case, for example, we see the introduction of rotation in a form that greatly resembles the potter’s wheel (case 4). But the fact that the Philippine sequence begins with the manufacture of the rim inhibits the discovery that one may indeed, very rapidly, make whole vessels on a wheel. That option is only available if the potter begins his manufacturing sequence with the bottom of the vessel, or with some intermediate part. The potter in this case had the wheel, but did not know how to use it for this purpose.
Mold-Shaping in Michoacán, Mexico
In the Mexican province of Michoacán,3 potters use a technique that, as far as we know, has never been developed in the Old World, i.e., the making of pots by molding in two halves, which each represent either a horizontal or a vertical section of the pot.4
Case 6 (Patamban, Michoacán, Mexico, 1989, Photo 13.13, copyright Coudart-van der Leeuw). The paste is kneaded into balls, which are subsequently beat into flat “tortillas.” One such tortilla is placed in a fired earthenware mold. The inside of these molds represents the right or left side of a complete upstanding pot rather than the bottom or the top half. Thus, between the two of them, they dictate the shape of bottom, shoulder, and rim. After the two molds have been joined, the potter cuts excess clay from the future rim with a wire, by moving it along the outside of the joined molds. She then rubs the joint smooth on the inside and leaves it to dry in the molds for several hours. Next, the molds are taken off and the complete pot emerges. The suture will have left a ridge of clay on the outside, which is removed by scraping with a knife, and is then smoothed with a wet rag. A wide range of forms is thus made in one and the same manner.
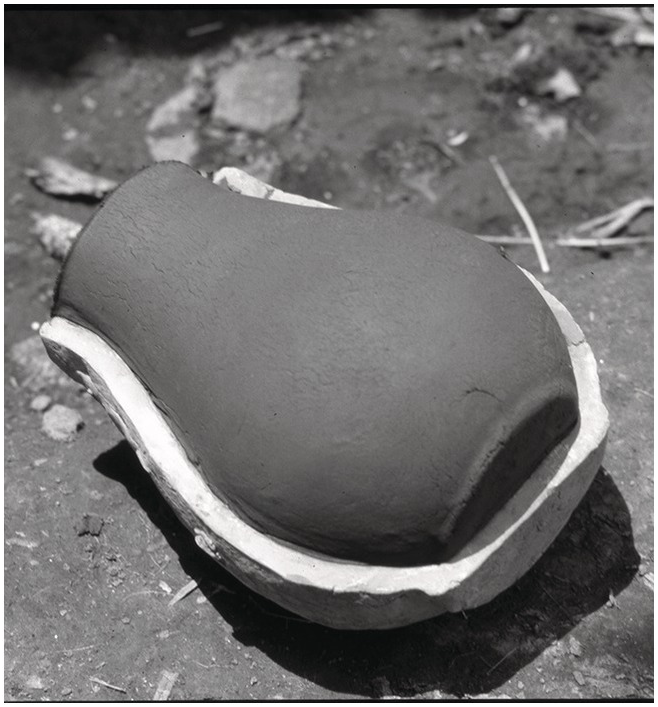
Photo 13.13 In Michoacán, Mexico, vessels are shaped in molds. Here, a closed vessel (with its opening narrower than its belly) is shaped by placing a pancake of clay in one half mold, then doing the same in the accompanying half. Both halves are then joined from the inside of the vessel. The vessel is left to dry, and after a while one half mold can be taken off (as here in the photo). A little later the other half can be takes off, the pot placed upside down on its rim, and the outside of the joint removed with a knife. The pot is then dried until ready for firing.
Case 7 (same location; Photo 13.14, copyright Coudart-van der Leeuw). The manufacture of open dishes, for example, follows a molding technique that is based on the horizontal (asymmetric) plane. Here, the tortilla is draped over a mold that is, like a mushroom, provided with a handle. Once it has been pressed against the mold and smoothed with a wet rag, the potter cuts off the surplus paste at the edges of the tortilla with a wire that is kept between the teeth and one hand, while the other hand rotates the mold against it. If need be, a coil is added to the base to provide a support for the vessel to stand on a flat surface. It, too, is smoothed with a wet rag. The pot is then taken off the mold and left to dry.
Photo 13.14 In Michoacán, Mexico, open vessels (bowls, plates, etc.) are shaped horizontally by placing a pancake of clay over a mushroom-shaped mold made by attaching a handle to an upside-down, fired, bowl. The potter shapes the vessel by hand against the mold, then shapes the rim by removing excess clay with a wire held between the teeth and one hand while rotating the mold. The photo shows two molds for open vessels above the resultant vessels, and one closed vessel in a vertical half-mold.
Case 8 (Huancito et al. 1991, van der Leeuw et al. Reference van der Leeuw, Papousek and Coudart1992). The procedure is the same, but the mushroom-shaped hand-held mold has, for large vessels, been replaced by a tournette that pivots in a hollow bamboo. On it, the potter places the mold over which she then drapes the pizza to be shaped, just as in the hand-held case.
Comparison
In this approach, although the shape of the mold – and thus the pot that results from the molding – may differ considerably, the manufacturing method is essentially identical.5 Invariant are (a) the sequence, making flat pizzas of clay and placing them against a mold, then drying and removing them to let the vessel stand on its own, a sequence that is independent of the shape of the vessel, as it creates no single part of the shape before any other; (b) the fact that for shaping, the usual distinction of continuous or discontinuous motion does not really apply; (c) the use of the mold both as a shaping device and as a support for the clay while it is wet; (d) the fact that the only other shaping tools are a thin nylon wire and a little rag to smooth the pot.
Variations occur in (d) whether one mold is used or more, (e) whether the pizza is placed in or over the mold, (f) whether the mold is rotated around a vertical axis or not, and (g) the shape of the mold. In the Michoacán case, the conceptualization of pottery manufacture thus does not wrestle with a sequentiality that begins with the bottom, the top, or even the shoulder or the middle as we have seen in all cases thus far: either the potter makes the body of the vessel all at once (open vessels) over a horizontal mould or makes it in two to four parts that have nothing to do with such a partonomy, joining vertically instead of horizontally, and vertically asymmetrical in themselves. Indeed, the distinction vertical–horizontal is thus rendered irrelevant within this tradition. It is replaced by the distinction between vessels that, topologically, represent half a (deformed) sphere, or a whole one (van der Leeuw et al. Reference van der Leeuw, Papousek and Coudart1992).
Some Lessons
Clearly, the approach illustrated here is much more difficult to instantiate for modern technologies. I have had to take a relatively simple example, and one I know well as a ceramicist who has observed the making of ceramics in a number of places throughout the world. But I hope it has allowed the reader to understand better how the details of information processing can contribute to creating a specific information processing structure (tradition).
In particular, in Chapter 12 and in this chapter I have tried to show how, in order to grapple productively with the ways in which inventions change our information processing apparatus by designing new ways to deal with emerging challenges. I conclude that we need to change our intellectual approach in instances like this. We need to accept that the same regulatory mechanisms are responsible for both change and its absence, and that, therefore, both need to be studied together.
In particular, we need to invert the relationship in our thinking between objects and data on the one hand, and our interpretations of these on the other. Objects and data are poly-interpretable and our interpretations are not, because they severely reduce the dimensionality of what is observed. Moreover, there are good reasons to assume that ways of seeing and doing things (traditions) outlast individual instances such as material solutions to specific challenges.
Furthermore, we need to look at the process of invention as an interaction between an external perspective on the niche where invention occurs and an internal perspective on the same. The former is constituted in the physical realm of the various factors that are potential influences on production and innovation, whereas the latter is partial and reflects the biases and choices of the person inventing. In this context, the concept of niche creation that has recently been introduced in biology is of great importance. Once a niche has been constructed, it in turn shapes perceptions and choices.
I believe that seeing the process of invention like this from the inside provides us with a much better insight into the dynamics involved, and might thus, when applied to other domains, help us steer innovation, and thereby contribute to a reflection on the unintended consequences of our inventions (by comparing the choices made with those not made) and thus, it is hoped, allow us to make wiser choices.
But an essential element in all this is how potters, and all other inventors, make their decisions. There is now a wide range of approaches from both cognitive sciences and psychology as well as from economics and other disciplines on this topic, but I will not go into these in detail, simply because there is too much to summarize. The essence of those discussions is, however, that such decisions are shaped both by biological and physical constraints and by the social networks within which the deciders function. These networks are determined by geography, social affinity, profession, and numerous other factors that together shape the value systems of the people concerned. In each case, and this is important to remember, the interaction between the dynamics within the system – whether those of an individual human being or of a social collective – and those in the context within which that system operates drives societal change and determines how a system may change. I will pursue this discussion in Chapter 16 when looking more closely at the concepts of value and value space.
The Role of Artifacts and Technology in Society
Thus far, we have looked at the role of information processing in creating novel artifacts, routines, institutions, etc. But once these have been created, they are integrated into the overall information processing toolkit of society. As we have seen, invention and innovation are essential elements in the maintenance of the flow structures that constitute human societies. But what is their precise role?
Artifacts are rarely looked upon as information processing tools, as part of the set of tools for thought and action that societies create and use in their coevolution with their environment. Yet that is an important reason for their invention because, in effect, they enable society to routinize part of its information processing. To perform a certain task that demands relatively considerable information processing if it is performed with rather simple and general-purpose tools, such as felling a tree with a stone ax, inventing a specialized tool that is more closely geared to the exact actions that are needed to perform that task, such as a saw, will reduce the information processing load of the person executing the action concerned because the tool routinizes that action. Rather than ensure that each blow of the ax hits exactly the right spot at the right angle, once the sawing has begun direction and angle are fixed and do not require any further information processing. Only the back and forth action does.
Looking at it like this, the proliferation of artifacts that has grown over time in many cultures has been due to the need to reduce the information-processing load to counterbalance its increase as a result of the growing number of people involved in the interactive groups, societies, and networks concerned. As such, it also helps to fix certain categorizations and ways of doing things materially, and thus to limit the set of options that will readily be chosen by the society.
This is another level at which the options chosen must be evaluated against those not chosen. An example from the Eastern Highlands of Papua New Guinea that my wife and I experienced in 1990 may illustrate this. In a certain village, the inhabitants invented a way to bend a sliver of bamboo upon itself, creating the kind of tweezers that can help grip objects, not unlike the tools we have in our kitchens. In their case, the tool is used to take sweet potatoes and other tubers out of the fireplace once they are cooked. But in the next village, less than half a day’s walk away, they do not have this tool, so they have to find other, more complicated, ways to remove their breakfast from the fire or burn their fingers (which therefore happens regularly). Unfortunately, we do not have enough data to decide between different possible reasons for the difference, but one way to interpret it is that the people in the two villages (who speak different languages) have a different technological worldview. There are many examples of such cultural or traditional differences between nations in the modern world. The Dutch (and South Africans), for example, cut slices of cheese with a very different cheese-knife than the French. Part of the reason is the different consistency of the cheeses, but using a French knife on a Dutch cheese would merely have changed the shape of the pieces that were cut off – not a very fundamental difference, except in the context of differences in worldview about how things should be done.
The ways things are done, including the artifacts used by a society, are part of what binds a society together. Individuals in a society develop habits that are aligned around certain kinds of knowledge. Rather than the objects people use, it is their knowledge about where to find raw materials, how to make artifacts, how to use them, etc., that defines a culture.
The complete set of artifacts that a society uses does indeed to a very substantive extent determine that society’s interaction with the material world because it structures actions in a specific way. A well-studied ethnographic example of this are the two main ways in the world in which rice or cereals are transformed into flour – by pounding with a stick in a (wooden or other) bowl as is done in many parts of East Asia, or by grinding between two stones as is done in much of Latin America. The two different physical actions have a wide range of impacts in other parts of their cultures.
Sometimes these are not immediately observable. John O’Shea once told me that the burial customs of a very small community through time – which he studied for his PhD (1987) – were remarkably stable, even though there were very few burials with long periods in between. He then asked, “How is it possible that people remember the rituals over such long times?” I think the reason is that other aspects of the culture and its activities anchored many aspects of the society’s worldview, such as spatial and ritual aspects of its culture in different ways and at different levels, so that people were guided by these choices in recollecting the burial rituals themselves.
Thus, I would argue that the technology of a particular group or society and, particularly, the ideas behind it that are only partly manifest to the people concerned, constitute the skeleton of the behavioral choices of a society, and an important element in determining its path dependent development. One way to visualize this is by looking at cities. As mentioned in the context of Padgett’s outstanding work in Florence (Reference Padgett, Casella and Rauch2000), for example, the spatial structure of the city, with its many small piazzas, led to the creation, around these piazzas, of financial transactions among neighbors, and thus gave an essential impulse to the emergence of novel inventions in the domains of accounting, banking, and trading.
In the USA, the geography of the early cities (on the coasts) enabled people to move around on foot, and for longer distances by public transportation. The streets can be, but are not necessarily, at right angles. In the mid-west and west, the (later) cities are much wider spaced and therefore depend on cars for transportation. All of us who live in such cities will be fully aware of the extent to which their plan and their amenities actually structure our lives in many, many ways. Because the life expectancy of the material infrastructure of cities exceeds that of individuals or even generations, such behavioral skeletons constrain much of their inhabitants’ behavior over a long time.
And this in turn links my argument to Arthur’s reversal of the roles of the economy and technology, which I referred to in Chapter 12, the technology of a society being in many ways the infrastructure within which both the society and the economy function. The position that he corrects (the economy as the driver of technology (and society) can be linked to the fact that, in the 1830s–1850s western society inverted the respective roles of society and the economy, from one in which the economy served the society as was the case in most premodern societies, to one in which the society served the economy, thereby opening the road for the emergence of our current market-based capitalist (and more recently financial) system (see Polanyi Reference Polanyi1944). I devote more attention to this shift and its consequences in Chapter 18.
“Models are opinions embedded in mathematics.”
Introduction
In Chapter 11 I presented the qualities and limitations of information processing in various kinds of societal configurations under, respectively, universal control, partial control, and no control, and used a very simple percolation model to summarize the overall evolution of societal systems as a spreading activation net. In the second part of that chapter I discussed various aspects of heterarchical systems and the ways in which hierarchical and distributed information processing networks interact. It concluded with an argument to the effect that in such heterarchical systems, diversification of activities contributes substantially to the stability of the system.
This chapter is devoted to the dynamics and processes that occur between rural and urban contexts, engendering the transitions between these system states. The increasing connectivity that involves more and more people in the spreading activation net has major consequences for the structure of the information-processing network involved, and we need to look at them. That argument will be based on a complex systems model applied to the dynamics of information processing. Although this chapter is therefore based on a rather technical construct formulated in mathematical terms, I will initially present the argument as far as possible in non-technical terms. To demonstrate the potential and the relevance of the modeling approach, for readers who might be interested in some of the details, I will restate important elements of the argument in mathematical terms in Appendix B. Those who are not interested in this aspect can follow the overall reasoning of the book without interruption.
Second-Order Dynamics
To begin, we can gain a glimpse of the complex dynamics involved in the emergence of urbanism by identifying the long-term change in change dynamics (what I have called the second-order change dynamic) occurring in that process. This can be done by looking at the rhythms of the various processes that are involved. Whatever the societal form of organization, the human and environmental dynamics in it are interlocked in mutually interacting ways.
In rural situations, the environmental dynamic is the more complex and multilayered of the two, and is thus the slower one to change. The human dynamic, on the other hand, consists of relatively few superimposed rhythms and can change relatively quickly because people can learn. As a result, a faster human dynamic is essentially locked onto a slower environmental (natural) dynamic: humans adapt to the environment, and because the environment is slow to change the combined socioenvironmental system is rather stable.
In urban situations the two kinds of dynamic reverse their rhythms: the societal dynamic becomes more and more complex, and therefore more and more difficult and slow to change, whereas the environmental dynamic, in so far as it directly relates to the societal system, is simplified because humans have locally reduced the environmental complexity and diversity of their environment. The environment can now be adapted according to the needs of the society. But as the more rapid dynamic has now become the dominant one, the socioenvironmental system as a whole has become less stable. As Naveh and Lieberman (Reference Naveh and Lieberman1984) put it, “the environment has become disturbance-dependent [on society].”
The above reversal is the fundamental one that has brought our societies to their current, unsustainable, situation, and it draws our attention to the fact that the temporal dimensions of the rhythms constituting socioenvironmental interaction are crucial in the coevolutionary transitions we are discussing here. I will come back to these later in this chapter in the form of models that show how these temporal differences affect urban–rural interaction.
Mobile and Early Sedentary Societies
Looking now at the first major organizational transition of society, that from mobile gatherer-hunter-fisher societies to sedentary ones (whether based on stable, naturally available resources such as salmon in the Pacific Northwest of the USA, or based on cultivation such as early farming communities in the Near East, East Asia, and the Valley of Mexico), from the perspective we are developing here we must emphasize a difference that has of course been noted but in my opinion not sufficiently emphasized: the change in the way resources are used. Mobile gatherer-hunter-fisher societies collected what nature had to offer – they had a multi-resource subsistence strategy in which they were wholly dependent on the rhythms of nature, and their only way to adapt to challenges was to move to other places with different natural rhythms. They harvested, but did not in any way invest in, their environment. Over the lifespan of individual gatherer-hunter (mobile) groups, once they had mastered sufficient knowledge of the dynamics of their environment they dealt effectively with change at daily and seasonal temporal scales by moving around from resource to resource. But they probably experienced very variable foraging success, and thus at that scale they experienced high levels of uncertainty, but hardly any risks because they had not substantially invested in the environment.
Sedentary societies, on the other hand, developed a reciprocal, interactive, relationship with their environment in which they invested in the latter by clearing spaces, working the soil, sowing, and waiting to harvest. In the process, they reduced the range of resources exploited by focusing much effort on one or more specific ones. They tried to some – very limited – extent to control some aspects of their environment, and their investment carried some risk with it. This was clearly a dynamic in which humans engaged with their environment, but remained essentially beholden to many of the vagaries of the latter, in the form of climate, soil, vegetation, etc. Herding societies also developed an interactive relationship with their environment, managing the natural dynamics of herd reproduction yet (as far as we know) not investing in a particular place, instead following the environmental rhythms of herds and their resources.
Though the information processing in all these cases was essentially under universal control (hunter-gatherer-fisher societies, early agricultural village societies, and herding societies were and are mostly egalitarian), the transition was the beginning of a shift from societies dominated by natural and slow (environmental) rhythms to environments that are being modified by more rapid human societal rhythms. Initially, because human groups were small and their technologies relatively unsophisticated, the human impact on these natural rhythms was limited, and the complex environmental dynamics ensured long-term overall stability of this mode of social organization and information processing.
But once human dynamic rhythms were introduced into the system alongside environmental ones, because people could adapt more quickly the former rhythms grew in importance in step with the growth of the population involved and the consequent growth in complexity and technological capability of societal systems. Ultimately, they took over so much of the Earth system that we now speak of the Anthropocene as the period in the Earth’s history in which humans control (most of) the overall socioenvironmental dynamic on Earth. In the following sections, I will roughly outline how that process followed its course, ultimately leading to the rapid expansion of urban societies that we have seen over the last 150 years.
The Emergence of Hierarchies
How did hierarchies emerge in such societies? An example that I observed in Wiobo village in the Eastern Highlands of Papua New Guinea in 1990 can serve as an illustration. This is a highly isolated area, one of the last areas of Papua New Guinea to be opened up to western observation, this taking place in the 1950s. The society is a horticultural one, in which subsistence is provided locally by exploiting small gardens in which food is grown. When a dwelling for a new couple was being collectively built, a large part of the village came together around a meal prepared in a Polynesian oven. Suddenly an argument broke out between several males, concerning responsibility for a particular task in the village: keeping the landing strip alongside it in a serviceable state (cutting the grass, etc.). After a while, in which different contenders offered different solutions to the challenge, a consensus emerged that one person’s suggestion was the best one, and he was elected to be what one could call the keeper of the landing strip.
From an information processing perspective, what was happening cut two ways. On the one hand this process selected a particular channel that favored a specific set of signals over many others referring to the same topic, relegating the others to the status of noise, and on the other hand the group created a degree of vertical integration by according one person control over a specific part of the information flow in the society, and thereby according that person a degree of responsibility and prestige, as well as the capacity to mobilize others for the task concerned. Both aspects of this action clearly rendered the fulfilling of this specific task more efficient by aligning the information processing of the people involved in it.
By thus “electing” candidates who offered what were considered to be the best solutions to challenges faced by the group, a group could create a number of domain-specific (short) hierarchies that improved the group’s information processing substantively. Ultimately, of course, coordination between a growing number of such hierarchies, and thus between a number of job holders, would be necessary and would in all probability lead to a kind of coordinator function for which another individual was chosen. It is important to note that in the early stages of this development, these responsibilities were assigned ad hominem, were not heritable, and could also be revoked during a person’s tenure.
The First Bifurcation
The next transition is one that sees the expansion of these small, sedentary (or herding) groups. They are still dependent on locally available energy and resources, and their information processing networks are hierarchical within the community. These hierarchies may at this point become more stable, giving rise to so-called great men and big men positions (Godelier Reference Godelier1982; van der Leeuw Reference van der Leeuw, van Bakel, Hagesteijn and van de Velde1986) that ultimately may even become heritable. As the groups grow, the partial control of the different functional hierarchical information-processing networks creates inhomogeneities in the information pool. Those in control of a hierarchy process more information than others, which makes them leaders, but also leads to misunderstandings and potentially to conflicts. One way to deal with this is for the group to institute occasional or periodic group meetings to reduce communication distances between all members, and thus serve to rehomogenize the information pool and readjust it to changing circumstances, whether caused in the environment by human exploitation or by externally triggered fluctuations in the social or natural environment. One would expect these resets to occur more frequently as maladaptations between the state of the environment and the state of environmental information processing grow.
From a dynamic model perspective on information processing, one could characterize such systems as oscillating around a fixed-point attractor. Stability based on a fully shared information pool dominates. But the societal system is subject to an oscillation between an accelerating/structuring phase and a decelerating/destructuring phase. In the former, the system is more deterministic, in the latter more stochastic. In more tangible everyday terms, people alternate between strengthening their system around a core set of ideas, customs, and institutions, and the opposite, widening the range of ideas and behaviors.
As contacts intensify, non-hierarchical distributed connections within groups are strengthened by family relationships maintained through networks of marriages. Owing to the combination of hierarchical and distributed information processing networks, information spreads very quickly, correcting imbalances in the information pool. But these societies are still slow to adapt as they are heavily constrained by slow environmental dynamic rhythms and have very few decision-makers (of limited diversity).
The Second Bifurcation
As societies grow in size, the hierarchical aspect of information processing also grows in depth and size, involving more and more people. As we saw at the end of Chapter 11, it also becomes more and more specific by losing a number of its branches as it focuses more sharply on tasks at hand, and thus becomes less adaptive. The distributed information processing network in the society, being more adaptive, gains in importance. We can thus imagine that at some point there could emerge a second bifurcation between hierarchical and distributed communication modes, in which they are separated spatially. This could for example occur when in some locations a faster adaptation of the socioenvironmental system is required than in others because the system is more dependent on the human dynamic than on the environmental one, whereas in other locations it is the reverse. Poorer environments, or environments that are more likely to be handicapped by certain environmental dynamics (climate, water, erosion) might trigger such more rapid adaptations, and favor distributed information processing.
Initially, this bifurcation might simply be enacted by certain people in a settlement who begin to specialize in communicating with others, for example in terms of exchanges or even trade, while others continue to be focused on immediate subsistence activities and to be linked to a hierarchical information-processing system. This would be one way to look at the prestige goods economy (e.g., Frankenstein & Rowlands Reference Frankenstein and Rowlands1978), which is in some places contemporaneous with emergent proto-urban centers and locally generates a settlement size hierarchy. Physically, this requires a point of connection between the distributed communications network and the hierarchical one. Because it is the point of introduction of new ideas and values, it quickly becomes the apex of the local hierarchy.
Over time, as the community of people linked into a distributed communication network grows, this may lead to the emergence of specialized periodic trading centers, such as the early medieval Northern European trading emporia, examples being Hedeby and Dorestat. These were located in geographical locations that were particularly suitable for communication, such as along rivers (at fords or branching points), along the coast, or at points where other conditions favor them.
In modeling terms, this is an information-processing system in which more permanent and spatially wider-spread communication corridors based on distributed information processing emerge between spatially separated hierarchical islands, structured as stochastic information webs wherever structured and unstructured oscillations form a pattern of interferences (Chernikov et al. Reference Chernikov, Sagdeev, Usikov, Zakharov and Zaslavsky1987). Qualitatively, these webs involve information brokers between different hierarchically organized villages, such as ambulant tradesmen and others who are independent from the village hierarchies. In pre-classical Greece, one could also interpret priests in liminally placed sanctuaries, such as Delphi, as examples of such brokers. Currently, one finds them in very many places in the developing world.
The Third Bifurcation
The third bifurcation could be called preurban smouldering – a situation in which, at a regional level, limited-term and more complex structuring occurs here and there, after a while petering out, then rekindling elsewhere. The existence of long-distance distributed processing corridors that are relatively stable over a period, and sufficiently frequently used to have a sufficient channel capacity (bandwidth) to maintain the information flows involved, permit certain groups of hierarchically organized societies to integrate into a larger system. This has a locally destabilizing effect because the symbiotic, hierarchical systems’ connectivity is enhanced through spatial extension (see White Reference White, Lane, Pumain, van der Leeuw and West2009). Dealing with this requires increased reliance on distributed information processing and energy obtained from elsewhere, and has probably led to instabilities in these systems, as I argue in Appendix B by constructing a set of dynamic models of these interactions.
Such a fluid and essentially discontinuous process of structuring and restructuring is imperfectly captured by any single spatial, all-encompassing, geometric structure as an explanation of societal organization. For example, under the type of dynamic evolution postulated here, territoriality and the societal boundedness of societies must have been subject to constant redefinition; a political tug of war between competing, adjacent polities for control and supremacy in exchange relations, both within the transportation and communication network itself and outside it. Under such circumstances, preeminent societal control by any single social group is unlikely for other than short periods.
Such essentially unstable systems were not confined to the European La Tène period, on which our models have been based. In Europe we see them again after the collapse of the Roman Empire, in the seventh to eleventh centuries CE. But I would surmise that we see them also in the Preclassic Maya (900 BCE–300 CE) area before the hegemony of Tikal and Caracol, in certain phases of Chinese history (such as the period of the warring states, 475–221 BCE), in the Uruk phase in the Near East (c. 4000–3100 BCE), and elsewhere.
An important aspect of the emergence of these long-distance distributed communications is that they infuse local hierarchical systems with new values (materials, objects, technologies, ideas). This enables them to extend the set of values of the community involved, and over time it enables the alignment of more and more people in different local systems into one value system.1 I return to this aspect in Chapter 16.
The Fourth Bifurcation
In many parts of the world, the first real towns emerge as a network of small, more or less equivalent, city states in what has been called peer–polity interaction, invoking a kind of mutual bootstrapping (Renfrew & Cherry Reference Renfrew and Cherry1987, title). This phenomenon resembles in many ways that of convection and might be modeled as an example of Bénard-like convection (see Chapter 7; Nicolis & Prigogine Reference Nicolis and Prigogine1977; Prigogine & Stengers Reference Prigogine and Stengers1984). The peer polity/convection cell model is essentially one of increasing information flow in a local circuit, which has a differentiating and structuring effect on the inhabitants of the cell itself: center–periphery, town–hinterland. The regional and supraregional exchange that takes place is initially effectively stochastic (down the line).
As these cells grow, the cores come to interact more closely and boundary phenomena take over: neighboring cores begin to exchange information on a regular basis, i.e., no longer in a stochastic manner but directionally. In this intermediate phase, long distance exchange becomes hybrid, i.e., between cells it moves stochastically, but once it hits the periphery of a unit, it cannot but go to its center. This entails a major reduction in stochasticity of communication as well as the beginnings of opening up the cells. Once the flows are directional, the cells can become dependent on them; the time delays in communication are drastically reduced, and this enables them to play to each other’s needs.
As more and more individuals participate in the (now) heterarchical channels, long-distance communication becomes more and more directional, meets more and more needs, and eventually connects very large spaces to such a degree that the centers become dependent on their trade networks. Importantly, the way the individual centers developed is highly dependent on minimal differences in initial conditions and on the paths they took. Guérin-Pace (Reference Guérin-Pace1993) sketches this highly variable dynamic at the regional level within a full-grown urban structure. The crucial variable in the transition seems to be the degree of long-distance complementarity.
Eventually, the growth of these large heterarchical systems threatens stability and increases sluggishness in adapting to change. Some degree of separation of interactive spheres may be a response (city states?) as well as internal hierarchization (for example in the early development of Greek city states, in which oscillations took place between tyranny and democracy). The towns eventually become permanent heterarchical systems.
Summary and Conclusion
In this chapter I have tried to outline a trajectory from early egalitarian societies to heterarchical urban ones. In doing so, I have used a conceptual model to link known observations about intermediate stages of this development by assuming several important bifurcation points (transitions, tipping points) between the different states of the information processing system. But I have not discussed the last stage of this evolution, which has led to the current challenging sustainability predicament. That is dealt with in Chapters 15–18. Altogether, it needs to be emphasized that this has no other purpose than to propose a different way to view social evolution from an a priori perspective rather than the existing a posteriori one. Whether such an approach will in the long run help us deal with a number of the issues involved remains to be seen.


 Open access