
Introduction
In the first part of this book (Chapters 3–7) I outlined a personal perspective and approach to the dynamics of human long-term coevolution with the environment, grounded in the evolution of human cognition. In Chapter 8 I have presented a narrative indicating the perspective on the history of human–environmental coevolution that this approach leads to, and in Chapter 9 I presented an outline conception of the interaction between society and its environment in terms of dissipative flow structures. Chapter 10 presented a more detailed case study of the dynamics of long-term evolution in a socioenvironmental system. In Chapter 11 I added a theoretical underpinning to that perspective and Chapters 12 and 13 presented my approach to the process of invention that is at the core of social and technological change. In Chapter 14, I showed how modeling dynamical systems can help us understand the emergence of urbanization.
These chapters have tried to pave the way for a focus on another central theme of the book: the present and its relationship to the future. In this part of the book, I will move our focus from the distant past toward the more recent past, the present, and the future. Chapters 16–18 argue that the information and communications technology revolution is an underestimated accelerator of the sustainability conundrum in which we find ourselves. Chapters 19–21 are dedicated to a discussion of potential futures.
The Rise of Western Europe 600–1900
To prepare the way, I will first present the last 1,500 years or so of western European history from the dissipative flow structure perspective. During that millennium and a half, we see a gradual strengthening of the urban (aggregated) mode of life, but this millennial tendency has its ups and downs and manifests itself in different ways. A second long-term dynamic is that of European expansion and retraction. Both reflect different ways in which the European socioeconomic system strengthened itself vis-à-vis the external dynamics that it confronted. To quantify these attributes, we will emphasize changes in the following proxies, where available:
The demography of the area concerned: relative population increases and decreases;
The spatial extent of European territorial units, as a measure of the area that a system can coherently organize;
The spatial extent and nature of trade flows as a measure of the information-processing potential between the center and the periphery, and thus of the area from which raw resources are brought to the system – its material footprint;
The density and extent of transport (road, rail, water) and communication (telephone, etc.) systems as a proxy for the density of information flows;
The degree and gradient of wealth accumulation in the system, as an indicator of innovation and the value gradients between the center and its periphery;
The innovativeness of particular towns, regions, and periods.
Many of these proxies cannot comparably be measured for each and every historical period and region. Moreover, they operate at different rates of change. But proxies are for the moment all we have if we want to cover the whole period. For subsets of it, interesting datasets are found in Piketty (Reference Piketty, Saez and Stantcheva2013) but also in Le Roy-Ladurie (Reference Le Roy Ladurie1966 [1974], Reference Le Roy Ladurie1967 [1988]), Slicher van Bath (Reference Slicher van Bath1963), and many others involved in agrarian history, particularly represented in the French journal Annales: Économies, Sociétés, Civilisations.
The Dark Ages
After the end of the Roman Empire we observe across Europe a weakening of society’s structure and coherence (e.g., Lopez Reference Lopez1967). Between 600 and 1000 CE, the fabric of society reached a high level of entropy (both in the sense of growing disorder and in the sense of reduced dissipation of the flow structure governing the dynamic) in western Europe, where the traditions of Greco-Roman urban culture were only conserved to a minimal extent. In South-Eastern Europe, under the Byzantine emperors, appropriate decentralization ensured that more of the culture developed for another millennium.
We will in this chapter mainly focus on western Europe. In this period, there was an enormous loss of knowledge, in crafts and trades for example, as well as an abandonment of infrastructure. The flow structures exchanging organization for energy and matter were limited to the immediate environment. Trade and long-distance contact virtually disappeared, towns saw their population dwindle (the city of Arles was for some time reduced to the perimeter of its Roman arena), and most villages were abandoned. Society fell back on local survival strategies and much of Roman culture was lost. Only the Church maintained some of the information-processing skills it had inherited, especially writing and bookkeeping, and a semblance of long-distance interaction.
The First Stirrings: 1000–1200
This was a period of oscillation between different small systems, in which cohesion alternated with entropy even at the lowest levels. In Northern Europe, trade connections forged in the (Viking) period before 1000 CE led to the transformation of certain towns into commercial centers, later loosely federated into the Hanseatic League. But these towns remained essentially isolated islands in the rural countryside, linked by coastal maritime traffic.
Duby’s classic study (Reference Duby1953) shows how, from about 1000 CE, society in Southern France began to rebuild itself from the bottom up. Although the urban backbone of the Roman Empire survived the darkest period, a completely new rural spatial structure emerged, even relatively close to the Mediterranean. There, in a couple of centuries of local competition over access to resources, various minor lords climbed the social ladder by conquering neighboring resources and positions of potential power, leading to the emergence of a new (feudal) social hierarchical structure.
The local leaders with the best (information-processing and military) skills were able to attract followers by providing protection for peasants who bought into the feudal system. The peasants in turn provided surplus matter and energy to support a small army and court. In the process, more wealth accrued to the favored, and we see the resurgence of a (very small and localized) upper class with a courtly culture in the so-called “Renaissance of the twelfth century that included tournaments, troubadours, and other (mostly religious)” artistic expressions in Southern France and adjacent areas. A similar process occurred in the Rhineland, where a separate cultural sphere (Lotharingia, named after Charlemagne’s son Lotharius who inherited this part of his father’s empire) developed on both banks of the river. Further east, in Germany, this period saw the decay of whatever central authority the Holy Roman Empire had and the rural colonization of Eastern Europe. At this time parts of Europe began to look outward: it was the time of the crusades against Islam (1095–1272) that culminated in 1204 in the (short-lived) conquest of Constantinople, which brought large amounts of information to western Europe in a – for the times – very efficient manner.
The Renaissance: 1200–1400
Three major phenomena characterized the next period: (1) the establishment of a durable link between the southern and the northern cultural and economic spheres, (2) the major demographic setback of the Black Death in the fourteenth century, and (3) the beginnings of the Italian Renaissance. The link between south and north was established in the eleventh and twelfth centuries, overland from Italy to the Low Countries via Champagne, and then connecting with the maritime British and Hanseatic trade systems. In the thirteenth century this connection became the main axis of a continent-wide trading and wealth creation network, enabling urban and rural population growth (Spufford Reference Spufford2002) and eventually driving rural exploitation in many areas to the limits of its carrying capacity, as well as pushing farming out toward more distant and less fertile or less convenient areas.
The impact of the bubonic plague was very uneven. Where it hit badly, it profoundly affected both cities and the surrounding countryside, bringing people from the periphery into the traditionally more populous urban areas (where the plague had hit hardest), thus increasing both the degree of aggregation of the population and its average per capita wealth (see Abel Reference Abel1966). Other profound changes occurred in the cultural domain, including a reevaluation of the role of religion, life and death, society and the individual, together shaking society out of its traditional ideas and patterns of behavior. (Some of these are mentioned in Chapter 3.)
These phenomena contributed to a localized era of opportunity in Northern Italian cities, where the interaction of cultural, institutional, technical, and economic inventions led to a uniquely rapid increase in the information-processing gradient between the urban centers and the rest of the continent. In this Renaissance, architecture and the arts flourished, while the foundations were laid for modern trade and banking systems. Padgett (Reference Padgett, Arthur, Durlauf and Lane1997), for example, describes brilliantly how financial and social innovations went hand in hand to transform the Florentine banking system, drawing in more and more resources and investing them in an ever–widening range of commercial and industrial undertakings that, in turn, transformed practices in these domains. Long-distance trade reemerged as a major force in development, for example between Venice and the Levant; the travels of William of Rubruck, John of Montecorvino, and Giovanni ed’ Magnolia are examples of these contacts, from the mid-thirteenth and early fourteenth centuries.
Many of the ideas developed in northern Italy were relatively quickly adopted in the trading centers in the Low Counties, such as Ghent and Bruges, which became rich and powerful based on the wool and cloth trade with England.
The emergence of a bourgeoisie in these places set the scene for systemic change: from this time onward, reaching the top of the heap was limited to geographic areas where urbanization led to concentrations of more – and more diverse – resources, as well as more effective information processing because towns were linked in Europe-wide information flows.
The Birth of the Modern World System: 1400–1600
This period marks the central phase in the continent-wide transition from a rural, often autarchic, barter economy to a monetized economy driven by towns, in which craft specialization and trade set the trend (Wallerstein Reference Wallerstein1974–1989). The transition introduced fundamentally different system dynamics. The dominant cities are increasingly market- and trade-based heterarchical structures, as opposed to the egalitarian and hierarchical ones in the rural landscape. Simon (Reference Simon1969) defines such structures as those emerging, in the absence of hierarchy and overall control, from the interaction of individual and generally independent elements, each involved in the pursuit of separate goals, and with equal access to (incomplete) information; competition for resources characterizes such organizations. As we saw in Chapter 11, contrary to hierarchical systems, heterarchical ones do not strive to optimize behavior; they can link much larger numbers of people, especially if they are organized as networks with nodes, and they are more flexible.
In this first phase of urban dominance, the world of commerce and banking expanded across different political entities, cultures and continents. Much of both southern and northern Europe, including Britain, Scandinavia, and the Baltic, were now integrated into the European world system. Rural areas saw their interaction with towns increase. Cities began to look attractive to farmers in an overpopulated countryside continually disturbed by armies acting out others’ political conflicts, and this led to a wave of rural emigration to towns, relieving the population pressure in the countryside and keeping the urban labor force cheap. That in turn enabled industrial expansion.
This period is the heyday of city power. Urban centers were not controlled by political overlords; rather, they controlled these overlords’ purse strings, as in England (London) and the Netherlands (Amsterdam). Urban elites put to work the enormous gains in information-processing capacity made during the Renaissance. Through relatively unregulated commerce and industry, commercial houses (e.g., the Fuggers) amassed enormous wealth, used it to bankroll the political conflicts and wars that disrupted the continent, and thus extended their economic and political control over much of the continent. To this effect, they created extensive information-gathering networks linking every important commercial, financial, and political center.1
This is also the period of the first voyages to other continents. By investing in these distant parts, European traders added new areas along the information-processing gradient, in which the commonest European product (such as glass beads) had immense value in faraway territories, while the products from those regions (such as spices) had a high value in the traders’ homelands. The huge and immediate profits made up for the risks, and this long-distance trade initiated for the trading houses centuries of control over an increasingly important resource-rich part of the world. As a result, this period has the steepest information gradient from the center of the European World System to its periphery, and the steepest value gradient in the reverse direction. But toward the end of the period that gradient began to level off in the European core, as cities in the hinterland, and eventually territorial overlords, began to seriously play the same game.
The Territorial States and the Trading Empires: 1600–1800
The rulers of Europe had inherited legitimacy, or something approaching it, from the Roman Empire, but that did not pay the bills. Their need to keep up a certain status was a financial handicap until they could leverage their legitimacy against financial support by exchanging loans for taxes as their principal source of income. A degree of territorial integration and unity was achieved in many areas by 1600,2 transforming the heterarchical urban systems into hybrid heterarchical-hierarchical ones including both towns and their hinterlands.
The regions that first achieved this (Holland, England, and Spain) had the most extensive long-distance trade networks providing the steady income necessary to maintain rulers’ armies and bureaucracies. As a result, the city-based economic system was transformed into one that involved the whole of the emerging states’ territory. Inevitably, the value gradient leveled out as the Europeans in the colonies assimilated indigenous knowledge and shared their own knowledge with the local populations, but this was for some time counterbalanced by the discovery of new territories, the introduction of new products in Europe, the improvement of trade and transport, and the extension of the reach of the trading empires. But ultimately the leveling of the information gradient led toward independence, as in the case of the USA, or, as in the East Indies or Africa, to the transformation of the trading networks into colonies under military control. These saw the local production of a wide range of necessities for the colony as well as western-controlled production systems for products needed in Europe, and a degree of immigration from Europe. As a result, the European core and the colonies became economically more dependent upon one another.
The same leveling off occurred in Europe as more people began to share in the production of wealth and its benefits. The profits from long-distance trade enabled an increase in the industrial base of the main European nations, achieved by involving more and more (poor) people in production and transformation of goods. The tentacles of commerce and industry spread into the rural hinterlands, aided by the improvement of the road systems. As a result of both these systemic changes, the flow structure that had driven European expansion became vulnerable to oscillations between rich and poor, separated by a growing wealth gap.
An important milestone in this process, which I consider in Chapter 18, is the Treaty of Westphalia (1648), which established the structure of European international relations for several centuries, until very recently. It was based on the principle that rulers of nations would not interfere in other rulers’ territories, and was thus a way to help stability in “interesting times.”
Using the term that I introduced in Chapter 7, one could say that with this event the European nations solidified themselves as Bénard cells, independent, coterminous units that were each driven by dissipative flows of energy and information.
The Industrial Revolution and its Aftermath: 1750–2000
But as the overall structure of the European system began to fray at the edges, the massive introduction of fossil energy as a resource and the concomitant Industrial Revolution reestablished the information gradient across the European empires and the value gradient between the colonies and the heartland. The resulting shift was profound (Figure 15.1). It gave European dominance a new lease of life, but at the expense of major changes. From a zone in which internal consumption of high-value goods imported from elsewhere generated most of the wealth, Europe became the mass-producer of a wide range of goods for export to the rest of the world.
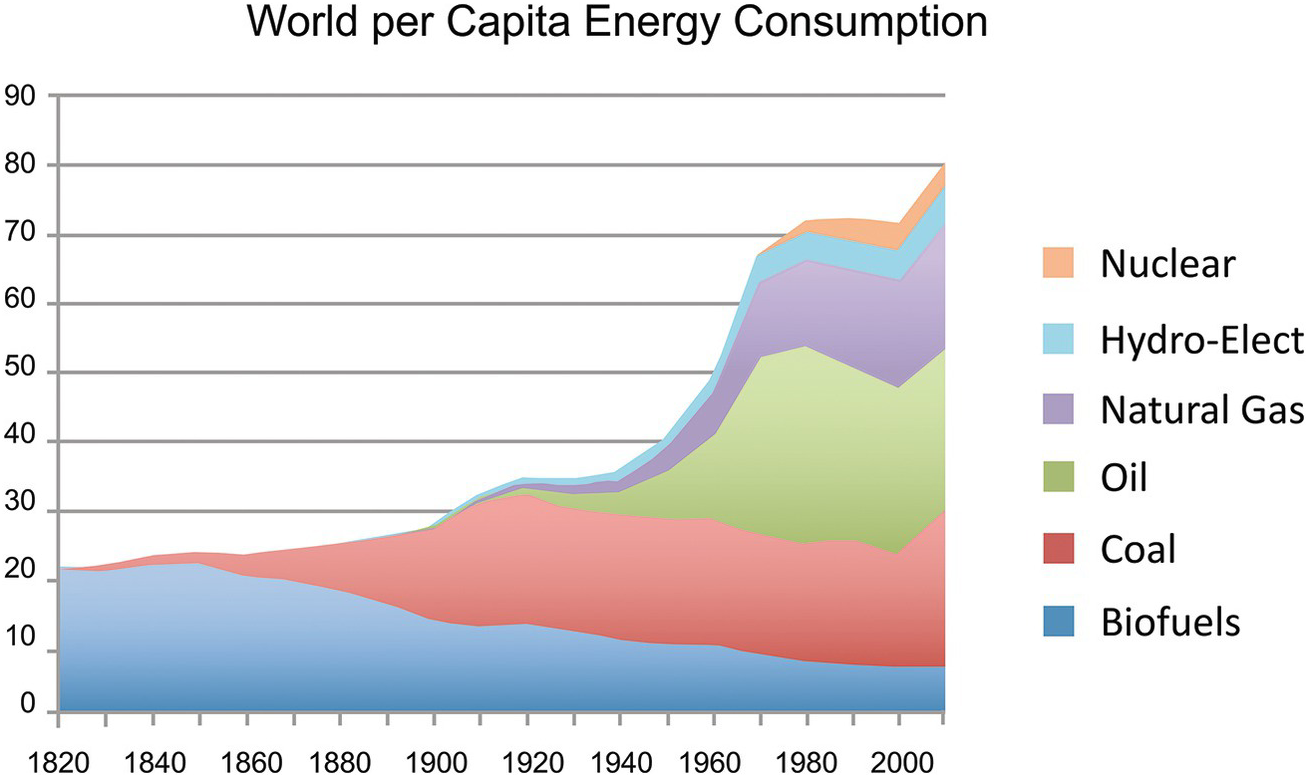
Figure 15.1 With the discovery and use of fossil energy and the Industrial Revolution that followed, our global energy consumption exploded. At present, whereas humans need about 100 Wh for their biological functioning, US per capita energy use is around 11,000 Wh. At present, per capita, an average North American uses 1.5 times the energy of an average Frenchman, 2.2 times the per capita energy of Japan or Britain, 2.6 times the energy of a German, 5 times the energy of a South African, 10 times the energy of a Chinese person.
To maintain this system, it had to create wealth in the periphery that would allow the local populations to acquire European goods. It did so by creating in the colonies large-scale production systems for raw materials that were transformed in Europe into products sold to the same colonies. Thus, the status of these colonies changed – from producers of goods that had relatively little value locally but high value in Europe, to areas mass-producing low value goods for export to Europe and serving as markets for low-value European products. Maintaining this system required improved political control over the colonies concerned, as it brought large numbers of local people into the system as low-paid labor.
In Europe, the invention of new technologies in both the core and the periphery created much wealth, but ultimately undermined the flow structure by disenfranchising large groups of people. Industrialization tied a large working class into (mechanized) production in low-paid, often dangerous, jobs that gave little satisfaction.3 Social movements were quick to emerge in the core (from 1848), and up to World War II. Countries that had not been part of the early flow structure aspired to create similar dynamics. The French thus occupied areas of Africa and Southeast Asia. Italy, Germany, Japan, and Belgium – born as nations in the late nineteenth century – had to satisfy themselves with the leftovers of the colonial banquet. This contributed to the causes of the two world wars: these countries sought expansion in Europe (and in Japan’s case in Asia) because it was denied them elsewhere.
Finally, between 1940 and 2019, the control over large parts of the world that Europe had thus far enjoyed spread to North America, Australia, Japan, South Africa, and more recently to Southeast Asia, China, and India. Europe and the United States are no longer in sole control of the information gradient responsible for the continued wealth creation, innovation, and aggregation of the World System, but have to compete with these other regions. The world has become multipolar.
Summary
I argue here that the European system has undergone three major transformations to date, dividing its history into four phases. In the first phase, after a predominantly flat, entropic, period (c. 800–1000 CE), in which whatever flow structures there were occurred essentially at the scale of individuals’, families’, or villages’ subsistence strategies, we see (roughly between 1000 and 1300) structures that involve information processing by larger (though still small) local units; most of these small rural principalities emerging in Southern Europe, but in northern Europe a few urban ones (the Hanseatic towns) emerged as well. Later in the period, several such rural flow structures were often subsumed under a larger one, leading to feudal hierarchies. But the hierarchical structure of the information networks structurally limited their opportunities of expansion (see van der Leeuw & McGlade Reference van der Leeuw, McGlade, van der Leeuw and McGlade1997).
The second phase (c. 1200–1400), was dominated by the death and later a new aggregation of the population in both old and new towns as a result of the Black Death, which caused innovation to take off. It drove a rapid expansion of the urban interactive sphere through long-distance trade and communication. The resulting urban networks that emerged from c. 1400 were independent of the rural lords and probably had a novel, heterarchical information processing structure (see van der Leeuw & McGlade Reference van der Leeuw, McGlade, van der Leeuw and McGlade1997), facilitating the growth of interactive groups and the systems’ adaptability. In the next two centuries, these cities drove the establishment of colonial trading networks.
But in the sixteenth century that dynamic led to a second tipping point inaugurating a third phase: the beginnings of the European World System, initiated by the discoveries of other continents by European seafarers. New resources were identified in faraway places and fed the accumulation of wealth that was going on. Between c. 1600 and c. 1800, urban and rural systems were forced to merge by rural rulers who needed to acquire in the towns the funds to increase control over their territories. This led to the formation of (systemically hybrid) states and the transformation of the urban trading networks into colonial exploitation systems. Toward the end of this period (c. 1800), these flow structures seemed to reach their limits: innovation stalled in the cities, and the energy and matter flows from the colonies were limited by the structure of their exploitation systems. Europe had reached a third tipping point.
At that point (c. 1800) a new technology inaugurated a fourth phase – the use of fossil fuel to drive steam engines, lifting the energy constraint that had limited the potential of all western societies thus far. The innumerable innovations that followed enabled transformation of the European production system at all levels, rapidly increasing the information-processing and value gradients across the European empires again. Girard (Reference Girard1990) outlines how in that process, the term “innovation” changed its value, from something to be ignored or even despised, to the ultimate goal of our societies. As part of this process, our societies became so dependent on innovation that one may currently speak of an addiction that resembles a Ponzi scheme in that innovation has to happen faster and faster to keep the flow structure intact.
I insist on emphasizing two lessons learned from this history. First, wealth discrepancy may well be a societal counterpart to the environmental planetary boundaries that were highlighted in the paper by Rockström et al. (2009), as it seems that wealth discrepancies were at their widest just before the three major transitions in European history: the Black Death, the discovery of the rest of the world, and the Industrial Revolution.
Secondly, in hindsight the progression from the agricultural societies of the Middle Ages to the trading empires of the early modern world, and ultimately to the industrial and post-industrial economies of the last century or so may seem inevitable, but like any story, or history, it is in effect a post-facto narrative that reduces the dimensionality and complexity of what really happened.
From the ex-ante perspective that we are introducing here, at each of the three transition moments mentioned European societies could potentially have engaged in different trajectories, and this continues to be true for the present. Rome could for example theoretically have followed a different trajectory in the second century CE. History is not inevitable. There are times when processes dominated by strong drivers make change very unlikely, and there are moments when unexpected events or people can indeed change the course of history. It is the thrust of this book that we seem currently to be living a moment in history that opens a window of opportunity for the world to change. Hence there are choices to be made. Making those choices requires that as individuals and as a society we retake responsibility for our collective future, instead of leaving that responsibility to a small group of people who are currently, knowingly or not, misusing it.
Another important thing to conclude from all this is that globalization is not new at all, but has been going on since the sixteenth century. We need to take this fact into account when we think and act in the present. In effect, all that has happened is that we have entered a new stage of globalization; a stage that has interesting parallels with the sixteenth- to eighteenth- century colonization of large parts of the world – in that trade was enabled to expand as the political structure of Europe was very fragmented, allowing nascent trade organizations such as the Dutch and English West and East Indies companies to drive the spread of European ideas worldwide. In some ways, states latched onto these trade organizations to bring wealth into their coffers, for example by issuing permits to pirate vessels of enemy nations.
The Changing Roles of Government and Business
I would like to use this section to look more closely (but still in general terms) at the current phase of globalization from a historical perspective, with an emphasis on the respective roles of government and business. As we have seen, beginning in around 1800, the introduction of ways to massively use fossil energy, and the Industrial Revolution it enabled, changed both the economy of European countries and of their colonies. In a nutshell, as the European countries developed industrial mechanization, they also changed their interaction with their colonies, developing governance, plantations, and markets for European products.
Thus, until around 1800 there was an enterprise-driven low-volume but high value flow from the colonies to Europe, with very little in the way of organizational and information processing capacity flowing toward the colonies. After that date, the flow structure involved national administrations, which triggered a much more important flow of organization and information-processing toward the colonies, transforming the latter into western-administered and -run territories owing to an influx of western-educated men and women.
This system essentially continued and expanded during all of the nineteenth and the first half of the twentieth century, facilitated by the discovery of oil, the spread of electricity, and the invention of new modes of transportation (railroads, steam- and later oil-powered shipping, aviation, etc.) and communication (mail, telegraph, telephone, telex), facilitating larger and larger, faster and faster flows of information between the European countries and their colonies, and thus slowly integrating those colonies into the overall information-processing apparatus of their home countries. It is important to be aware that during the nineteenth century and up to World War II, in the colonies business and government worked together and kept each other in balance.
Decolonization began in the late nineteenth century and the first half of the twentieth century in Latin America, and followed in the forty years after World War II in very large parts of Southeast Asia and Africa. It severed the political link between European countries and their colonies, and cut the ex-colonies off from the information flow that had until then “organized” them. But it did not stop the trade flows between the European countries and their ex-colonies. It merely separated (once more) the governmental and the commercial domains, allowing business a freer hand in the new overseas nations after their independence, while governance was still in its infancy.
At the same time, the USA had achieved military and political dominance over much of the world, and because of its liberal philosophy facilitated, if not encouraged, the concentration of economic power in private hands. The so-called Pax Americana of the second half of the twentieth century enabled corporations – which equaled the economies of many countries in size – to dominate industrial production, trade, and communication, slowly leading to a situation in which they became as powerful, or more so, than most countries. In the process, some countries managed to organize themselves to achieve a rapid rise in wealth and economic power (Germany, Japan, Korea, later China and other countries in the BRICS grouping – Brazil, Russia, India, South Africa), often initiated by government-sponsored, large industrial and business clusters that captured markets owing to the initially much lower salaries than those paid in Europe and the USA. The world thus evolved into a multipolar communication and information flow structure.
For the moment, the main lesson to take away from this brief and superficial history is that we have not only seen balance of power shifts between countries, but also a recurring shift in the balance of power between governments and business, since the Reagan and Thatcher era (the early 1980s) to the advantage of business and finance. That development has also hugely increased the value and wealth differentials between the core and the periphery of the system (the haves and the have-nots), as recently brought to everyone’s attention by Piketty (Reference Piketty, Saez and Stantcheva2013), and thereby reduced the chances that outsiders could become insiders, creating an extraction-to-waste economy (in terms of raw materials, but also human capital) that is close to reaching (or has reached) its limits in the sense that our planet can no longer deal with it.
Because of the territorial limitations of governance, this system’s spread around the globe has enabled, but has also been driven by, the growth of large multinational corporations. The impact of these corporations outside the core of the western world has, slowly but surely, over the last century or so, incorporated regions that were culturally and socially fundamentally different into that extraction-to-waste economy and made that economy truly global – driving individuals, groups, and countries to gradually adopt mindsets, activities, and institutions that are compatible with its underpinning an urban and wealth-driven logic. In the last thirty years, this process has accelerated, and is now reaching the conurbations of China, Indonesia, India, and other countries.
Crises of the Twentieth Century
As part of this process, a number of fields of tension were generated that ultimately caused major crises. The first such to hit western society in the twentieth century was World War I. As we all know by now, it was triggered by a seemingly minor event, the assassination of Archduke Ferdinand, which occurred after a spate of similar assassinations of princes and high nobility. It sparked a release of the tensions that had built up between four major societal configurations in Europe, the Austro-Hungarian, French, German, and British Empires, and inside these empires between rich and poor. The huge destruction it wrought in human and material capital reduced these tensions for a while. The next crisis, however, began not long thereafter in the financial domain, in 1929, being caused by the control of the financial markets by very few people, particularly in the USA. It triggered a major destruction of wealth, increased social tensions in the countries involved, and also coincided, in the USA, with major environmental destruction (the so-called dust bowl). The financial capital lost was not really reconstituted until the run-up to World War II, which was driven (in a revanchist way) by some of the same social tensions that had caused World War I, particularly in Germany.
After the war, a major restructuring of the western world was set in motion, entailing a new financial structure (Bretton Woods, the International Monetary Fund, the World Bank), a new attempt at a global political structure (the United Nations), a new military structure (the North Atlantic Treaty Organization and the Warsaw Pact, the Alliance of South-East Asian Nations, etc.), the opening up of trade flows worldwide (leading to the General Agreement on Tariffs and Trade and the World Trade Organization, and more recently to regional customs unions such as the North American Free Trade Agreement, the European Union, and similar but less integrated regional pacts). Importantly but less visibly, this also caused a shift toward a material wealth model that exported the core of societal tensions from the western world to the rest of the Earth by using human and resource capital in the periphery to accumulate wealth in the western core of the system, thereby minimizing tensions in the western democracies. A large part of this development was driven by the technological innovations facilitated by the plentiful availability of fossil (and later to a limited extent nuclear) energy. These developments ultimately led to the current consumer society and helped create a period of relative social peace in the developed nations.
After about twenty years of rebuilding the parts of the world that had been destroyed by war, in the 1970s and 1980s unintended consequences of the new order, including the dismantling of the colonial empires, began to surface again in the west as well as elsewhere. In the financial domain, dealing with rapid growth in the financial system led to the abolition of the gold standard (1976), which was followed by the “big bang” (1986) that removed (national) policy constraints that had thus far kept the financial markets within bounds, in particular in the USA and Britain. The Reagan and Thatcher regimes contributed to the collapse and the change of regimes in Russia (1989) and in some of the western periphery of the Russian Empire, in countries that had been weakened by the unintended consequences of their communist philosophy of management. In a number of ex-colonies, a revolution of rising expectations led to profound regime changes (e.g., in Indonesia, India, Pakistan, Zimbabwe, and many others; much later South Africa) to the advantage of (small groups among) the original inhabitants.
Underneath all of this, and surfacing particularly from the 1980s onwards, globalization was a major driver of the process, on the one hand increasing trade and the wealth of the core as well as reducing regional risks by subsuming them under global ones, but on the other hand leading to more dependencies between different parts of the world, and thus increasing the chances that minor events in one place could have major consequences for the world system as a whole (the ‘butterfly’ effect).
Conclusion
From our information-processing dissipative flow perspective, globalization is the latest stage in a process driven by an imbalance between our global societies’ capacities to process energetic and material resources on the one hand and information on the other. Information-processing needs over time brought more and more people together, and this required more and more resources. In this process, the information-processing capacity of growing communities increased sublinearly with the number of people owing to the limitations of human short-term working memory and inefficiencies in alignment and communication. But the material and energetic flows increased at first linearly with the number of people, and later maybe even geometrically when the growth of group sizes required increasing investment in infrastructure. As a result, the resource needs of western society drove it to expand its extraction networks across the globe, but without concomitantly expanding the dimensionality of its information processing toolkit. Over an ever-widening area, the globe was exploited in the western way, disregarding the many dimensions of local information processing that were related to local customs, environments, challenges, solutions, and values. Integrating these was beyond the capacity of western societies’ information processing, and thus globalization proceeded on an increasingly narrow dimensional basis, around wealth, ever since the discovery and harnessing of fossil energy in the nineteenth century (coal) and twentieth century (oil and later gas) facilitated innovation and an expansion of the western value space. This expansion was based on an elaboration of the same set of core dimensions that had governed the west’s information processing earlier.
The forcible geographical expansion of western information processing was not able to integrate the very high number of different dimensions inherent in the different ways in which non-western populations processed their information. The western flow structure therefore spread across the world, maintaining its own ways of processing information, facilitated by a few shared languages worldwide: English, Spanish, and French. This rapidly widened the gap, worldwide, between the dominant (western) information processing system and the cultures and environments it confronted, and thus generated a rapidly growing tension between the available information processing and the kind of information processing that would have optimized local (natural and human) resource use, leading to an explosion of unintended and unanticipated consequences that ultimately caused a series of crises (which in my opinion will continue to occur with increasing frequency and amplitude).
Of course, this tension will impact differentially on the vulnerability, resilience, and adaptability of different scales of the system (Young et al. 2006). But the expansion of the western information-processing system will increasingly undermine societal diversity and the diversity in thought and action that has until now characterized the different cultures on Earth and acted as a buffer against their hyper-connectedness. And finally, I think it will limit, if not render impossible, the expansion of the value space that I discuss in Chapter 16.
It is my contention that these dynamics have not sufficiently been explored, in part because they have been looked at from a national or corporate perspective, in which expansion was viewed as an advantage because it increased financial and economic flows and values.4 In order to explore them properly, it is essential to take a global and holistic perspective, to develop a “Global Systems Science” that looks at the causes and effects of globalization at the scale at which the phenomenon happens, rather than only looking at the advantages of globalization for individual countries and companies in competition.
As I outline in Chapter 18, in the current age of big data gathering, the information needed for such an approach is fundamental to the continued existence of our societies, and its importance exceeds that of any national interests. We are beginning to see such collection, but it is essentially in private hands (of Google, Facebook, Tencent, and others like them), while governments do not really seem able to compete on the same scale because (apart from the superpowers who are mainly collecting it for defensive and military purposes) they still maintain a national perspective.
The Present Conundrum
A central theme of the book is the relationship between the present and the future, and in particular the conundrum in which we find ourselves in the modern world with respect to our environment and the survival (or not) of our current ways of life in a globalizing world. Let us therefore take a look at some of the trends that characterize our current societies globally. Doing so will rapidly show us that although greenhouse gas emissions have been targeted by international politics as the focus of our battle against the destruction of our environment, this is woefully insufficient and actually misleading because it ignores the roots of the problem and oversimplifies the challenge.1
If we view the current challenges as societal rather than environmental in origin, there are a number of essentially societal dynamics that are threatening to exceed their own safe operating spaces: demography, food security, financial stability, wealth distribution, urbanization, etc. Fortunately, as part of the efforts of the United Nations (UN) to define sustainable development goals (SDGs) in 2015 and to propose an agenda to reach those goals, the realization has quickly grown in the scientific community that, indeed, the challenge is in large part a societal one (see Chapter 19 for a more detailed discussion of the SDG research effort). Moreover, the recent focus on SDGs has shifted efforts toward viewing the core sustainability challenges through the lens of a multidimensional systemic approach. This is beginning to have an impact on governments as well, with efforts to coordinate ministries and agencies now also including central government functions, such as the ministries of finance, planning, and/or the prime minister’s office. Yet the engagement of the social science community is still in its infancy compared with that of the natural and life sciences. For one, because it was initially called upon to respond to issues that the natural sciences defined, it was as it were backed into its main topic: societal dynamics. As a result, much effort has been spent by social scientists studying such topics as climate and society, water and human needs, food (in)security, rather than focusing on studying the internal dynamics of society that have brought us to the current situation. Moreover, there has to date not been enough of a coordinated effort at developing the results of different sectoral approaches to dynamics in various societal domains into a more holistic, scientifically coherent one, based on intellectual fusion between the efforts of disciplinary communities. Neither have the scientific and the economic, financial, and political communities looked closely at the role of unintended, unanticipated consequences of earlier choices.
Briefly discussing some of the main sustainability challenges just mentioned, this chapter probes the depth to which an analysis of our current multidimensional predicament must go. It emphasizes the complexity of the challenge and the need to begin to view it from a complex systems perspective. Finally, it will emphasize that our current situation is due to the effects of unexpected and unanticipated consequences of earlier choices made by our western societies, which are in my opinion the root cause of tipping points throughout history. With that perspective, a “crisis” or “tipping point” is a (usually temporary) situation in which the information-processing capacity of a society is no longer able to deal with the highly complex dynamics in which the system finds itself owing to the shift in risk spectrum that it has undergone over time.
The Environment
Our actions over many centuries have ultimately transformed our environment to the point that the relative stability of the Earth system dynamics that we have, as humans, enjoyed over some 10,000 years, may be coming to an end within this century. Over the last hundred years or so, many indicators of the expansion of the socioeconomic system, both globally and locally, have gone exponential, and so have indicators of its impact on the environment.
Steffen et al. (Reference Steffen, Sanderson and Tyson2005, Reference Steffen, Richardson, Rockström, Cornell, Fetzer, Bennett, Biggs, Carpenter, de Vries, de Wit, Folke, Gerten, Heinke, Mace, Persson, Ramanathan, Reyers and Sörlin2014) illustrate that transformation in a single figure (Figure 2.1). In the last thirty years, moreover, numerous signs have emerged that our current society is close to hitting, or actually has hit, a series of planetary environmental risk barriers (Rockström et al. 2009) (Figure 2.2). After some thirty years of research on changes in the environment that saw our challenge essentially as an environmental one, awareness is growing that we are in effect dealing with a societal challenge. After all, society defines its environment, identifies environmental challenges, and proposes solutions for them. Societal action is therefore the only kind of action that can have caused, and may change, the current trend.
This leads me to argue that as scientists we may until recently have been looking under the streetlights to find the key that we have lost somewhere in the dark beyond the reach of those streetlights. To determine why this has happened would be a highly interesting and important topic of research in its own right. Instead of mainly looking at socioenvironmental dynamics to see where there are dangers lurking, and how we might mitigate these so that we could retain our current western lifestyle, we should have been looking more closely at the societal dynamics that created the current conundrum and how we might change that lifestyle.
Might some of the signs that Steffen has collected also indicate that we are crossing, or at least approaching, a set of societal planetary boundaries? In this chapter I will try to explore that question. I will briefly enumerate a number of the dimensions in which our societies are threatening their own safe operating space. Most, if not all, of these are known, but because of the disciplinary and sectoral fragmentation of our worldview and our science, many of them have not sufficiently been linked in a holistic perspective to see what they really mean for our future. Others have not been discussed because they derive from such fundamental values and assumptions in our culture that they are our sacred cows.
Global Demography and Health
Figure 16.1 shows three different projections of the demographic tendencies currently observable worldwide. Notwithstanding the fact that it is difficult to predict the demographic evolution over a whole century, it is one of the most solid forecasts of all, even though in the past effective population growth has often tended to attain the higher ranges of the predictions. The predictions take increasing life expectancy in proportions related to wealth and healthcare into account, and also the fact that as populations grow wealthier they reduce their birthrates. But they do not take the potential nonlinearities into account that might be created by quantum jumps in healthcare, such as the healing of cancers, the potential of stem-cell therapy, etc.
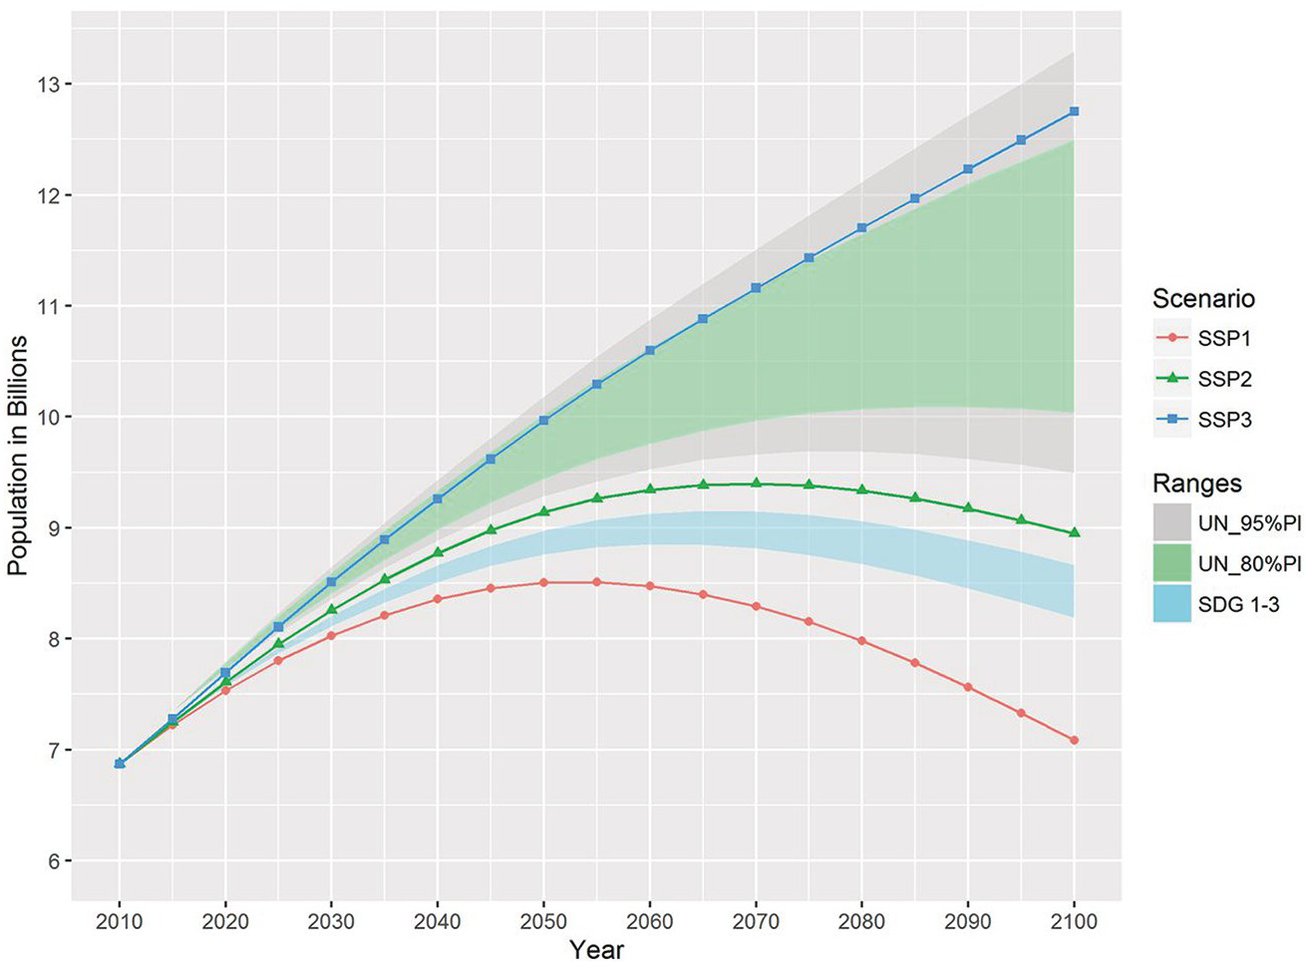
Figure 16.1 Projected global population growth 2000–2100 as projected by the three Shared Socioeconomic Pathways (SSP) scenarios and the probabilistic ranges given by the UN.
The wide divergence between the scenarios in Figure 16.1 clearly illustrates the difficulties of projecting so far into the future.
These population figures are only one part of the picture. Major differences in the distribution of health are the other. As shown in Figure 16.2, health, as represented by life expectancy at birth, is very unevenly distributed across the globe, and its distribution appears to be similar to that of wealth.
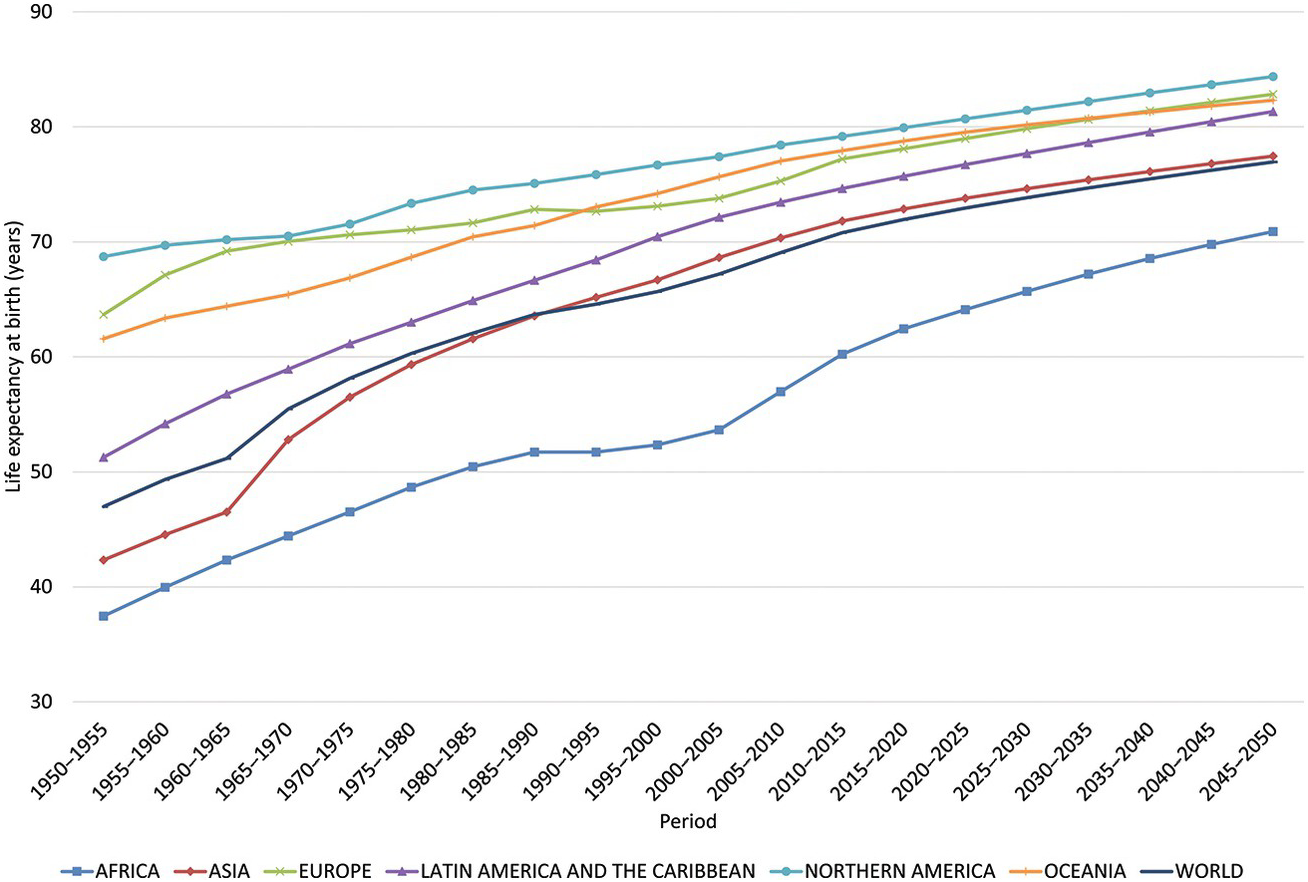
Figure 16.2 Life expectancy at birth (years) by region: estimates 1975–2015 and projections 2015–2050.
This has direct implications for overall global population growth, which in the coming decades is expected to be principally occurring in Africa (Figure 16.3).
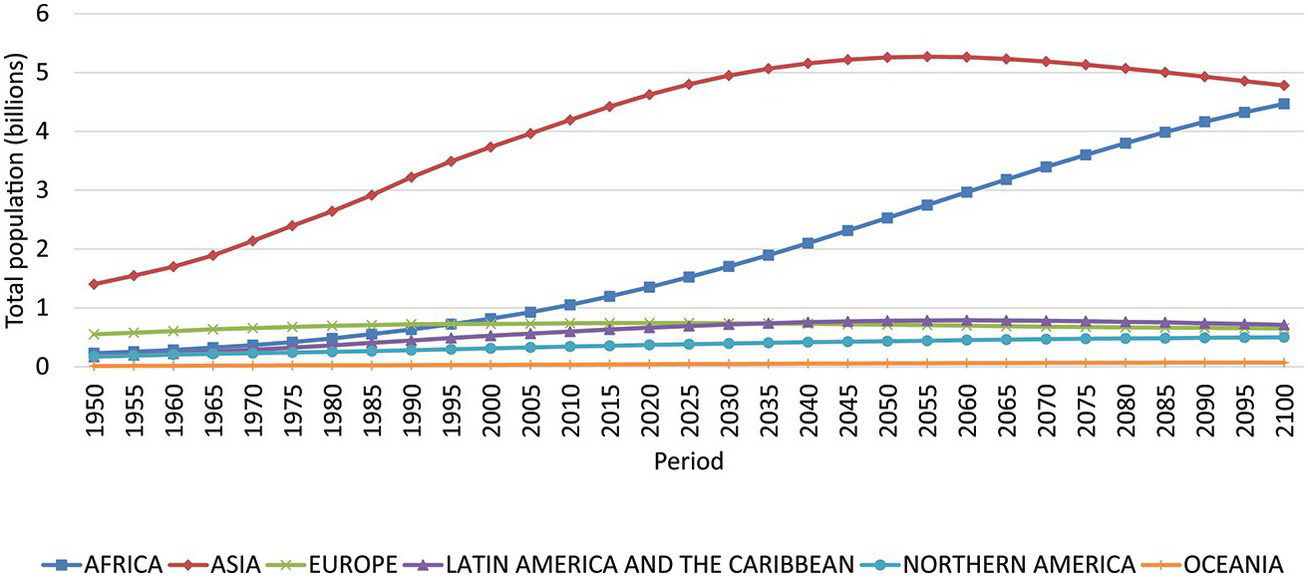
Figure 16.3 Population growth by macro-region. Most population growth is predicted for Africa.
It is generally expected that with growing wealth in the developing world, the crude birth rate will go down as life expectancy increases. In 2018 the population of the world is growing at an average annual rate of 1.1 percent. This rate has been declining since 1965–1970, when it peaked at around 2.1 percent. The fact that world population growth is on the decline can be explained by the Demographic Transition Theory (Notestein Reference Notestein1954). Eventually, according to this theory, all societies evolve from a pretransition situation (stage 1), where fertility and mortality are unchecked and high, thus producing low population growth, to a stationary population (stage 4), when a society reaches low levels of fertility and mortality. This pattern is quite well established and exceptions have so far been of a temporary nature.
The crucial question is, however, whether growth in wealth and decrease in birth rate will manifest themselves at more or less the same rates or not. Another question is how these processes will play out in different parts of the world. No one knows, but it is clear that 200 years of western industrial economy have created important demographic discrepancies that may impact on global sustainability.
Aging
Behind these global figures lurks a potentially major challenge: aging. Generally, it is assumed that growing economies require growing working-age populations. Currently, in a number of developed countries, aging and a low birth rate combine to cause decreasing numbers of inhabitants of working age: Japan, China, Germany. Others still have an expanding population due, for example, to important immigration (the USA, Canada, Australia), but in a general political climate in which immigration is increasingly subject to xenophobia, those fluxes may well decrease. This will have an impact on the size of these economies, not so much from the supply side (where people will probably be replaced by automation), but on the demand side.
The opposite is the case for Southeast Asia and Africa, where birthrates are still higher and the working-age population will be growing for some time. There, the economies will continue to grow, and one of the interesting questions that raises is whether this will also entail a shift in global power balance toward the currently developing countries. That will in part depend on whether, and how far, these countries will be able to develop their technologies and economies, but also their institutions and legal systems. China has shown, over the past few decades, how this can be done.
Global Migration
Another fundamental characteristic of the current world, but with ancient origins, is large-scale migration. It is exceedingly difficult to obtain good quantitative data on the numbers of people involved, and a purely narrative description will have to suffice.
Current research indicates that on a global scale migration has not recently increased substantively, but at local and regional scales it has shifted demographies. According to the UN, during 2005–2050 the net number of international migrants to more developed regions is projected to be 98 million (UNDESA 2017). Such regional migration is likely to further accelerate in the foreseeable future owing to, for instance, climate change, sea level rise, and food and water availability. But there may also be increasing pressure toward migration for societal reasons, such as warfare, failing states, populism, ethnic cleansing, or criminal violence. The rapid spread of information through word of mouth, television and the Internet is contributing to migration in important ways. It triggers widespread “push” reactions in the developing world, driving people living in dangerous or economically difficult circumstances to migrate to the USA, Canada, the EU, and other (mainly developed) countries.
Migration is thus likely to further accelerate in the foreseeable future. The counterpart may be a defensive reaction in developed countries, fed by local populism and identity issues, creating more barriers to migration and globalization such as is currently occurring in Southern Europe and the USA. But then, demographic and economic declines in developed countries may in the end overcome such sentiments. Major environmental disasters and ethnic cleansing will probably further complicate the situation. All in all, we can therefore expect major cultural, social, and economic challenges related to migration in the developed world as well as in the developing world, wherever state control is not willing or able to deal with, or prevent, mass migration.
Food (In-)Security
The importance of these demographic trends becomes clear if one compares them with the evolution of our resource footprint as a global population. One consequence of major innovations in healthcare, and the spread of technologies to make human beings healthier across the world, has been that we are, as Tim Flannery (Reference Flannery2002, n.p.) put it, “eating our future.” We are facing a potential crisis in the provision of water and food for the world population that could very easily trigger major conflicts. Recent increases in food prices due to speculation are early warning signs that food security may, in the not-so-distant future, become a major challenge worldwide (Figure 16.4). No surprise, then, that the topic has in the past five years emerged as a major concern, both scientifically and politically.
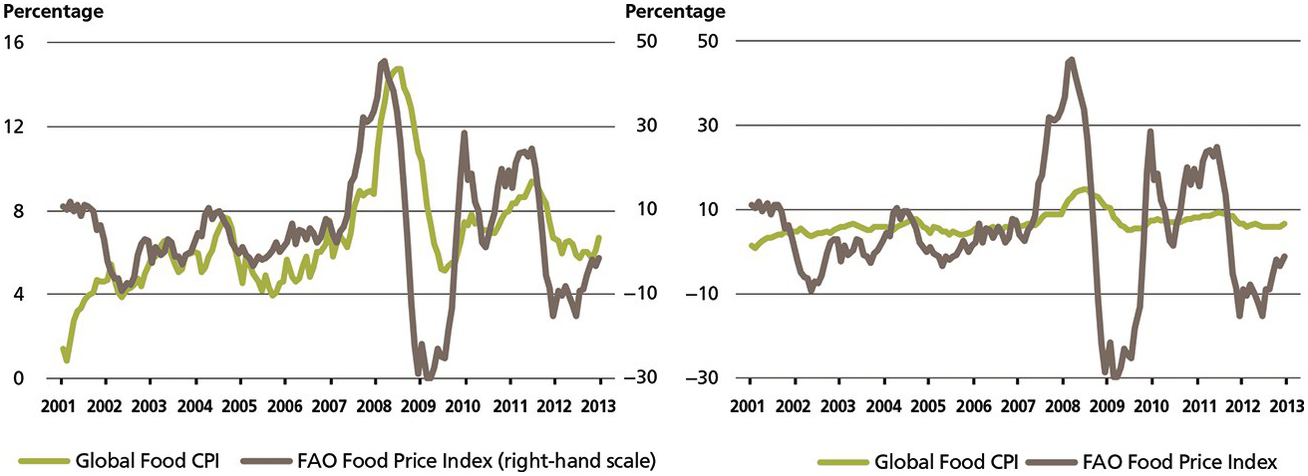
Figure 16.4 Food prices remained relatively stable from the 1980s to 2005 thanks to the green revolution, but have recently spiked partly as a result of speculation and ethanol production
Individual countries are hedging against the possibility that food and water insecurity will threaten their populations, for example by buying large tracts of land in Africa. But as the population of Africa is growing faster than the population of any other area, one has to wonder whether this strategy will in the end be sustainable.
Fossil Energy
Energy has been a constraint on human societal evolution for most of the existence of the species, but that constraint was lifted with the harnessing of fossil energy in around 1800.
Since then, energy use has increased very rapidly, as was seen in Figure 15.1. Basically, the societal dynamics that are driving our societies have increased average global energy consumption from approximately 20 gigajoules (GJ) per capita per year at the beginning of the Industrial Revolution to approximately 80 GJ per capita per year now. Clearly this is very unevenly divided between the developed and the developing world. In the USA, in 2013, average per capita consumption was in the order of 290 GJ equivalent per year, while in India it was only about 25 GJ. Most of that difference is absorbed in building, maintaining, and running our material and institutional infrastructure. A growing need for energy is fundamental to the way in which the world is currently moving, and energy consumption, for political and economic as well as societal reasons, is not likely to decrease in the foreseeable future.
Yet the total quantity of exploitable fossil energy on earth is limited, and this has, since the 1970s, led to the conclusion that at some point in the future oil as a cheap resource will be exhausted. That point may recently have been pushed back owing to exploitation of new oil gas deposits (but see Day & Hall Reference Day and Hall2016), the discovery of large volumes of natural gas, and the expansion of renewable energy use, but traditional gas and oil exploration and exploitation is becoming more and more expensive because the superficial sources in accessible areas are being depleted and replaced by fossil fuel from very deep sources (presal in Brazil) or extreme climates (Arctic). Though there is coal for many more years, the fact that burning it is highly unadvisable from a greenhouse gas and global warming perspective is forcing us globally to reduce its use.
As energy has been an early target in the world’s efforts to reduce global CO2 emissions, major efforts have been deployed to reduce both the use of fossil fuels and of their CO2 emissions. Numerous approaches have been discussed and some of them undertaken. Technologies have been invented and improved, such as the application of digital information processing in grids. In particular, substantive measures have been taken to reduce CO2 emissions (by shifting from coal to oil, then gas, then renewables) and to increase the efficiency of energy use (in electricity generation; insulation of buildings; transport, etc.). But as Figure 16.5 shows, this is still woefully insufficient, partly because only a fraction of total energy ends up being useful (Figure 16.6 in the box below).
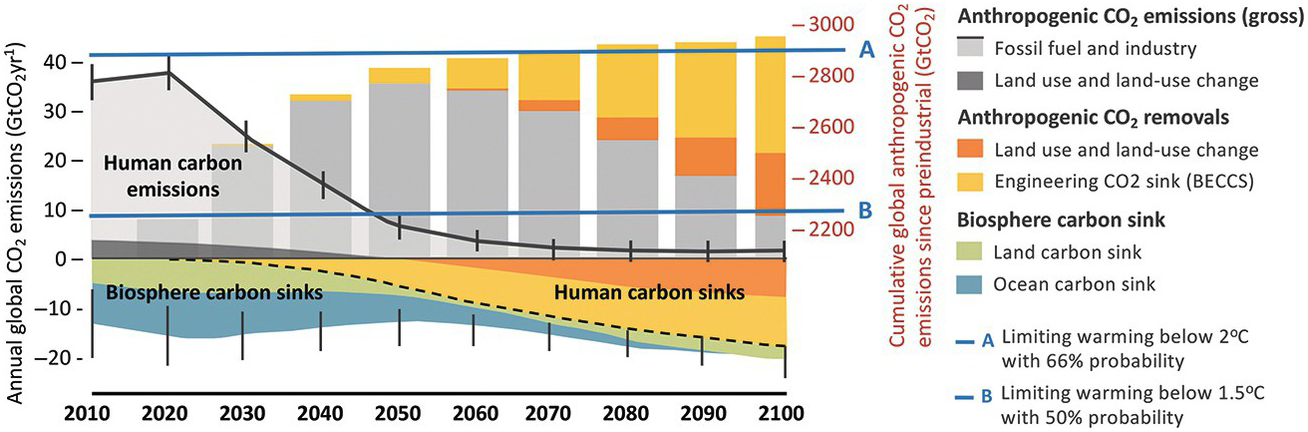
Figure 16.5 Cumulative and annual emissions and sinks of CO2 are shown for stabilizing global climate at below 2ºC and 1.5ºC. Most of the carbon emissions shown in gray are energy-related. Together with land-use emissions they need to decline toward zero by midcentury. The figure is called Carbon Law as a metaphor to Moore’s Law of semiconductors, where a number of transistors on a chip doubled every two and a half years. Carbon Law indicates that global emissions need to be halved every decade. In addition, human carbon sinks need to increase to almost half the magnitude of current positive emissions: This is a tall order. Carbon capture from biomass (bio-energy use with carbon capture and storage – BECCS) and land-use change are here the key. Third, biosphere carbon sinks need to be maintained as atmospheric concentrations decline. The vertical gray bars show cumulative emissions since the beginning of the industrial revolution of some 2,000 billion tons CO2. This budget, or carbon endowment of humanity, will be exhausted shortly as the remaining emissions for achieving stabilization at below 1.5ºC are essentially nil while we still emit some 40 billion tons CO2 per year. Net-negative emissions are needed to stay within this budget. The remaining budget for stabilizing at 2ºC is a bit more generous so that the demand on net-negative emissions can be significantly reduced. The Carbon Law can be seen as a roadmap toward making the Paris Agreement and the SDGs a reality. Pathways shown in this report such as the SSP1 variant focused at the 1.5ºC target or the alternative scenarios portray similar dynamics, whereas the latter is unique among stabilization pathways as it does not need net negative emissions because of vigorous changes in end-use technologies and behaviors.
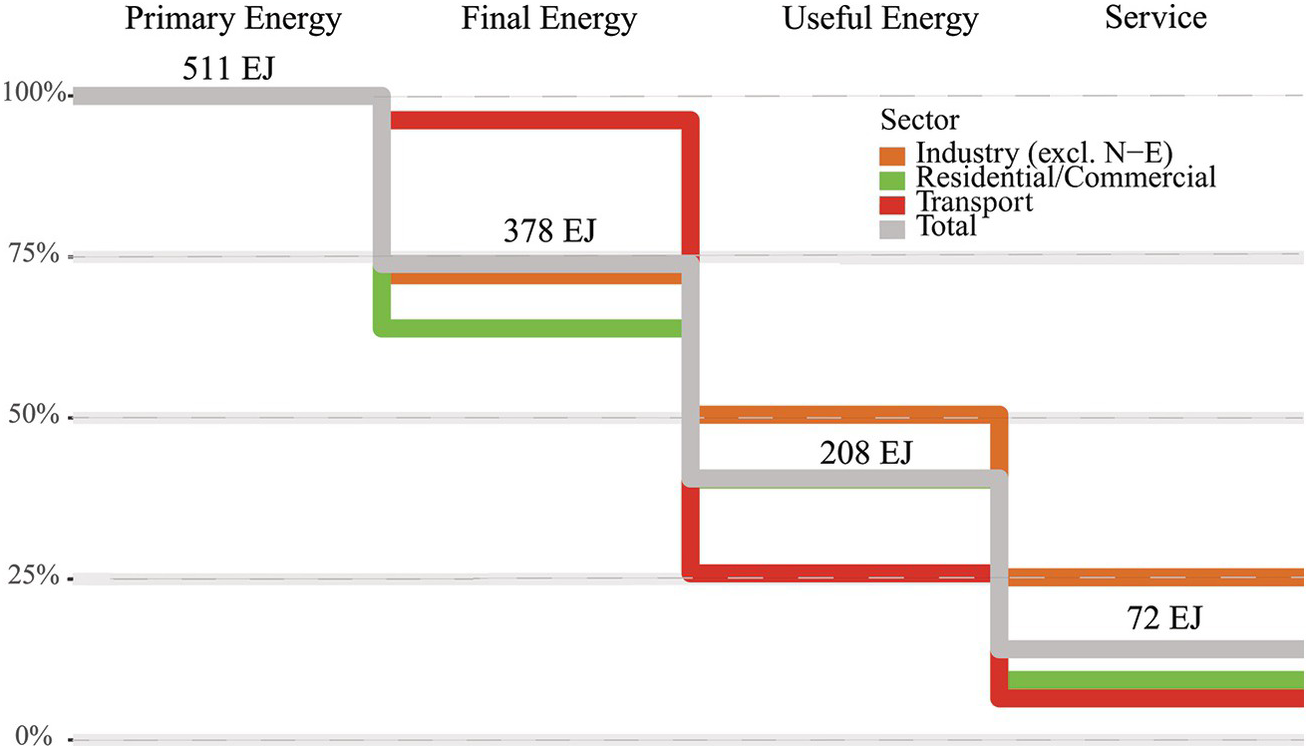
Figure 16.6 Energy conversion cascades in the global energy system. Lines show percentage of extracted primary energy delivered as final energy, useful energy, and services respectively for three end-use sectors (industry, residential and commercial buildings, transport) and totals for the whole energy system in 2020. Energy flows exclude non-energy feedstock uses of energy (labeled as N-E). Total energy flows (EJ) are shown at each stage of the energy conversion cascade. Service efficiencies are first-order (conservative) estimates based on Nakićenović et al. (1990) and Nakićenović et al. (1993).
The world has currently achieved a total global efficiency improvement of about 2 percent per year. But as concluded by the “The World in 2050” team (TWI 2050, 62), all these efforts are quite insufficient to substantively reduce greenhouse gas emissions. As stated by the International Energy Agency (2017): “While carbon emissions have flattened in recent years, the report finds that global energy-related CO2 emissions increase slightly by 2040, but at a slower pace than in last year’s projections. Still, this is far from enough.”
This worrying situation is exacerbated by the fact that the decrease in return on investment in traditional energy capture risks leaving a substantial proportion of the theoretically available (identified) resources in the ground, potentially creating a major financial liability for the institutions that have lent money against those irrecoverable assets (the so-called stranded assets problem). This poses a threat to our current global financial system, as do some of the derived geopolitical risks involved in oil price fluctuations. If countries cannot make enough money on fossil fuels, their political structure becomes unstable (in Venezuela from 2016 to 2019, for example). Moreover, if we continue to reduce global poverty, one can reasonably expect energy needs to continue to grow. For example, in Saudi Arabia the national increase in energy use is such that the country may cease being a net oil exporter by 2032 (Leggett Reference Leggett2014). If we include in the calculations the energy needed to increase the living standard of the whole global population to a level that guarantees a comfortable life (without going into the excesses of the current West), we will clearly exceed all acceptable levels of fossil energy use from an atmospheric pollution perspective because this would almost certainly involve substantive use of coal, which is currently (and will so remain unless major technical innovations change the situation) the worst polluter among the fossil energies. Only renewable energy can avoid this energy squeeze, but though its installation is growing exponentially (it now produces about 20 percent of global energy), that is still not fast enough to compensate for emissions growth from fossil fuel (not to mention land clearance, saturation of the ocean’s absorption capacity, tundra melt leading to methane release, and so forth).
Finance
We can clearly see that in recent years a very important, and growing, proportion of total financial capital is no longer engaged in the production of goods or services, but entirely devoted to what amounts to speculation. Figure 16.7 shows how the proportion of available capital that is subject to capital gains tax and is therefore not productively invested has been increasing in the USA since the late 1940s and has recently in some years constituted close to 40 percent of total financial capital. As such speculative capital moves around with worrying (and increasing) speed, for example between developed and developing countries, but also between sectors, individual institutions, and forms of investment, the basis of our global financial systems is substantially, and increasingly, unstable.
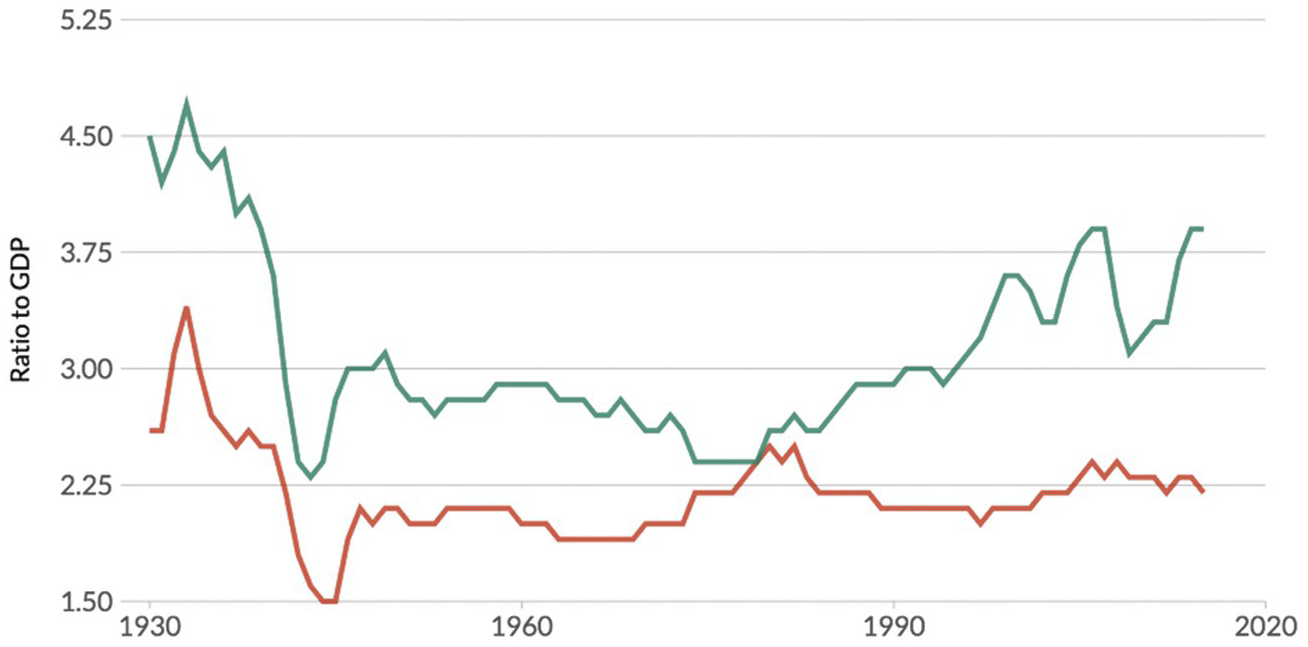
Figure 16.7 Fraction of total gross domestic product (in the USA) invested in production (red line, without capital gains tax) and speculation (green line, with capital gains tax). The global recession of 2008 has depressed both trends, but the relationship is still the same.
The mobility of speculative capital associated with the fact that it is controlled by fewer and fewer people (see below on the “wealth gap”) and institutions (some of which are now considered “too big to fail”) has had the destabilizing effect of contributing to the rapid succession of financial crises that we have seen in the last sixty years (The Economist in 2014 ran the headline “The History of Finance in Five Crises”). There are many different aspects to this trend, but there are several that are so dangerous that we need to include them in our thinking about the future.
Trade, Protectionism, and Investment Flows
Several developed economies are currently moving toward protectionism, under the pretexts of protecting jobs, correcting bilateral trade imbalances, or even national security. This restricts economic growth in the long run, since it inhibits trade in intermediate goods and the creation of value chain niches. It also threatens the existing supply chains in our greatly interwoven global economy. Moreover, the uncertainty produced by the threat of protectionism slows down investment flows in global capital markets, as it generates uncertainty regarding future economic growth (Erokhin Reference Erokhin2017). This is aggravated by trends in international aid, migration, climate change, and geopolitics. Protectionism threatens food sustainability by drastically shifting value chains and forcing replacement of staples and other foods with less sustainable varieties. Trade has a major role in stabilizing food prices, as well as shifting production from areas of high environmental risk to less risky areas (IFPRI 2018). The effects of protectionism in developed countries will be felt most acutely in the least-developed countries (LDCs) (UNDESA et al. 2018). Many LDCs are dependent on external demand for commodity exports, as well as foreign aid for budget support (Timmer et al. Reference Timmer, Dailami, Irving, Hauswald and Masson2011). In a closed world economy, many LDCs will continue to lag behind more developed economies, and this will have important ramifications in other sectors. LDCs will not achieve the economic growth required for sustainable development without a significant increase in investment. However, many of these countries are unable to attract the levels of investment they require owing to institutional deficiencies, an overdependence on commodities subject to fluctuation in prices, and a dearth of basic infrastructure to support fledgling industries.
Debt
The rapid increase in global indebtedness (see Figure 16.8) is directly threatening overall financial and economic stability. Nominal global debt is currently around 250 percent of gross domestic product (GDP). This includes both government and private debt, and the percentage has been rising for most of the last fifty years, after a major deleveraging phase immediately following World War II. This debt is unevenly distributed among countries, and also between public and private debt, with the latter generally growing faster than the former. As long as the world is – and most countries are – on a growth trajectory this is not necessarily a financial problem, as people have enough confidence that much of this debt will in the end be reimbursed, and because inflation reduces the real debt load.
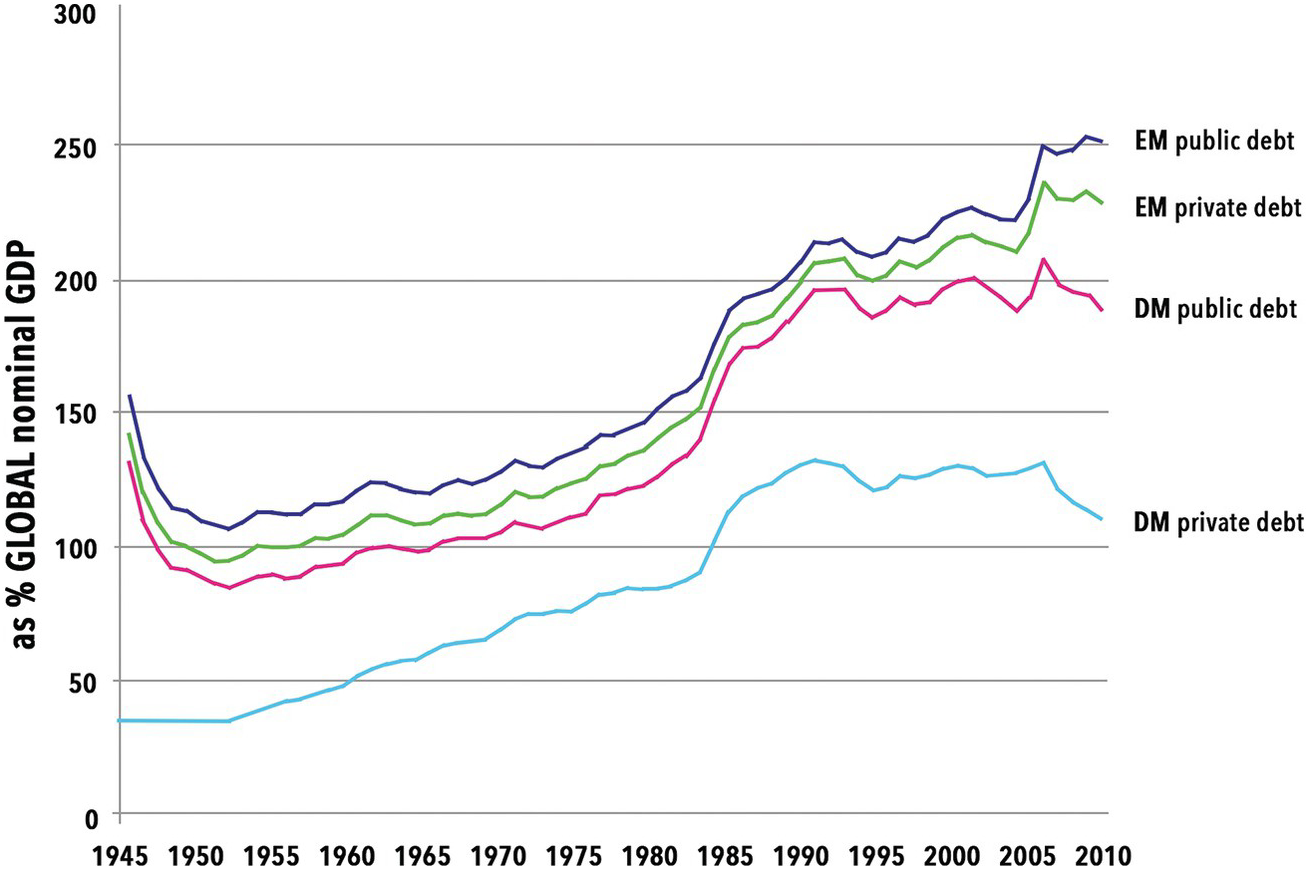
Figure 16.8 Private debt in developed and developing countries exceeds public debt.
We have to remember, though, that this whole system is fiduciary, and that if trust in it is for some reason or other undermined it could collapse very easily, leading to major social unrest. As we saw in the 2007–2008 Great Recession, there are many hair triggers that may cause such a collapse. And because each crisis is countered by central banks with an increase in their debt levels, the underlying instability increases with each such event (Figure 16.9).
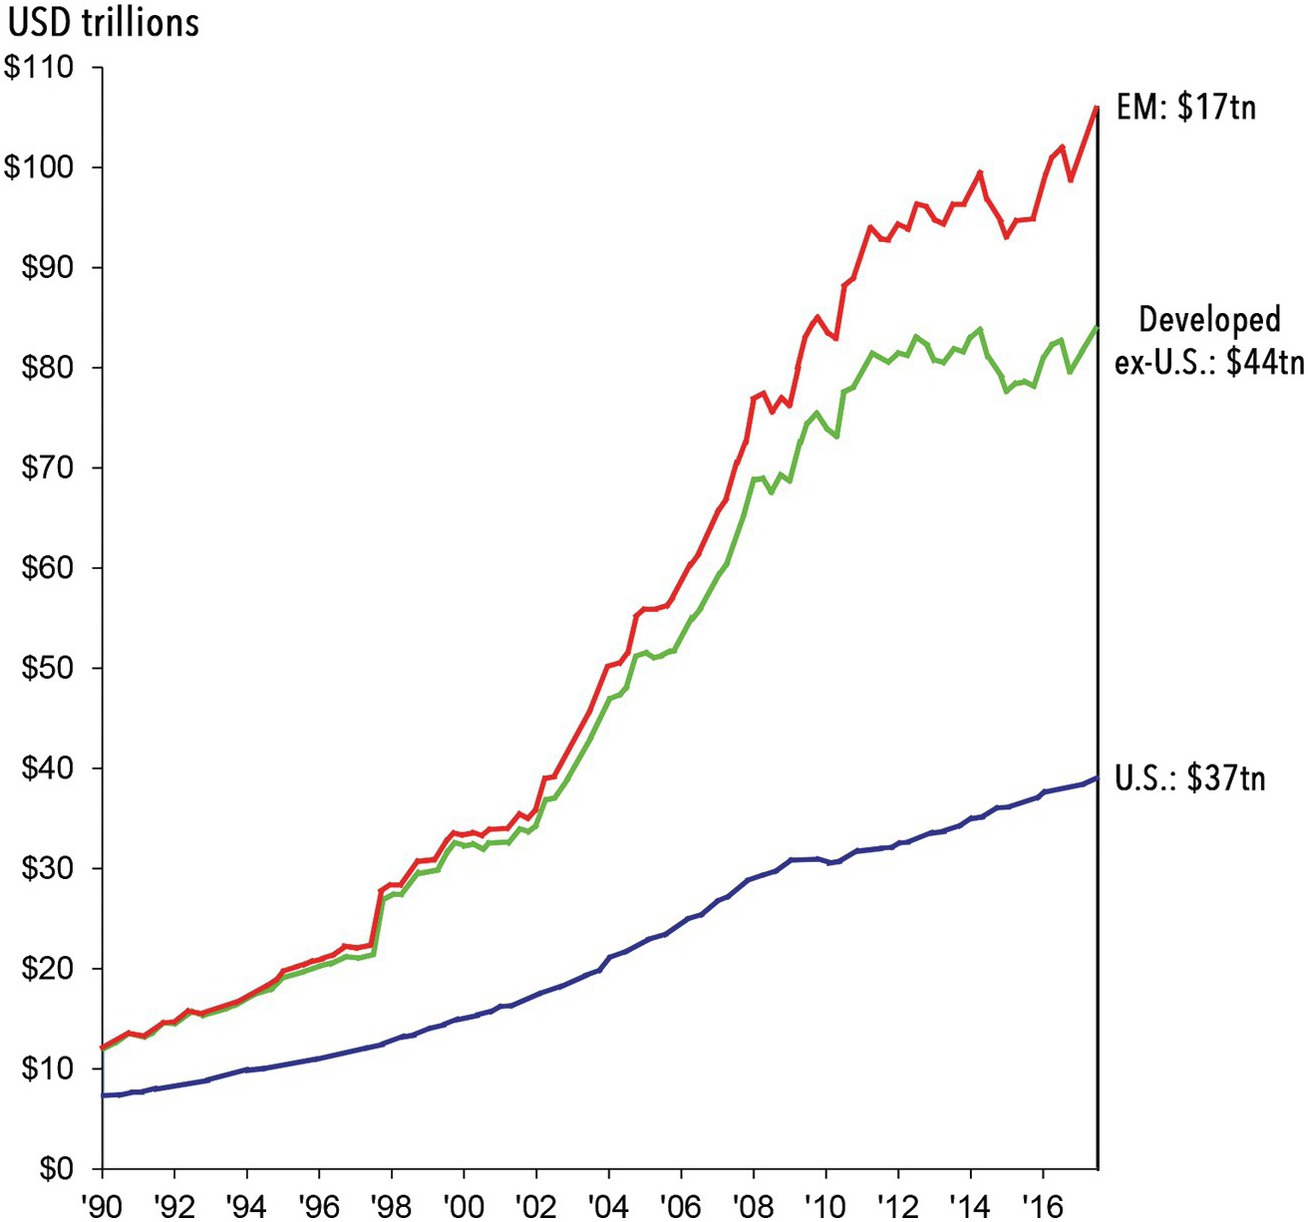
Figure 16.9 Public debt in the USA, other developed countries, and emerging markets. After the 2007 debt crisis, public debt increased rapidly, to level off (except in the USA) after 2010.
In recent years, we have also seen how several individual nations have seen trust in their financial systems collapse owing to mismanagement or actual cheating (Argentina, Greece, Ireland, Turkey).
That is not affecting world financial stability as long as there are other economies that can serve as lenders of last resort because they are bigger and in better shape. However, with the overall increase in debt level among both large and small countries this mechanism may itself be at risk.
Another aspect of the high debt level is the fact that an ever-larger percentage of GDP is devoted, by governments and individuals, to interest payments, which reduces the proportion of GDP that is available for spending. There is thus an incentive to promote a feedback spiral, increasing the debt to be able to both spend as necessary and pay the interest owed.
Ultimately, this may hit the total amount of funds available for investment and lead to reductions, notably, in infrastructure maintenance (as is currently occurring in a number of developed countries). In certain cases, this problem may even limit the potential for further investment in the expansion of productive capacity.
It is easy to see that the information revolution, which has reduced transaction times to milliseconds, and which has linked all financial markets in one large web, contributes further to the potential instability of the global system as a whole.
Aging Populations, Productivity, Savings, Debt, and Pension Systems
I have already mentioned that a major demographic trend is the aging of populations. It has tremendous economic implications that represent a challenge for the sustainability of welfare systems in developed and developing economies. This includes pension and healthcare systems, in addition to a possible decrease in savings and investments (Bosworth et al. Reference Bosworth, Bryant and Burtless2004). In developed countries, an increased burden will be placed on public transfer systems, owing to the concurrent trends of a growing proportion of pensioners and a diminished tax base. However, the majority of the increase in the population above the age of sixty will occur in the Global South (UNDESA 2017), where the elderly are less likely to have retirement savings plans or to be supported by public welfare systems, and instead depend on assets and labor income. Without the means to support themselves in retirement, many of these people are susceptible to poverty. An aging world population also means that the share of non-communicable diseases in the global disease burden will grow, increasing pressure on countries’ health expenditure, adding to the fiscal burden of government budgets.
Low productivity growth in developed economies in recent years has been explained by aging workforces, a slowdown in total factor productivity in the information and communications technology (ICT) sector, declining contributions of trade to economic growth, and stagnation in levels of educational attainment (Adler et al. Reference Adler, Duval, Furceri, Sinem, Koloskova and Poplawski-Ribeiro2017). Between countries, global inequality has decreased in the last decade thanks to the contribution of China and India in their economic development process. As these and other emerging markets continue to grow, the economic hegemony of the United States and its western allies will gradually be replaced by a multipolar world economy, in which India, China, Indonesia, and Brazil become increasingly important economic hubs for financial services, manufacturing, and innovation (Timmer et al. Reference Timmer, Dailami, Irving, Hauswald and Masson2011).
However, this trend does not mean that economic growth will be evenly distributed. Many LDCs are at risk of continued vulnerability to economic shocks for the reasons previously mentioned. Their economic vulnerability is compounded by the fact that many of the LDCs are facing disproportionately high threats from climate change, have rapidly growing populations, and also have weak governments and vulnerable security situations. These trends are inhibiting the ability of LDCs to bridge the gap between themselves and the emerging and developed economies. Without appropriate economic growth and investment, their populations may continue to grow at unsustainable rates, they will not be able to provide adequate education to their youth, and the coverage of health services will remain incomplete and fail to tackle preventable causes of morbidity and mortality (UNDESA 2018).
Innovation and Societal Coherence
The societal implications of the innovation challenge, though major, are much less clearly perceived, and have probably differed across cultures and societies. In the case of the west, I mentioned in Chapter 12 that Girard (Reference Girard1990) argues cogently that between the seventeenth and the twentieth century, society’s perspective has shifted from one directed toward the past and therefore encouraging stability (“the future is more of the present”) to one that favors change and innovation. That is a fundamental change in our (western) values, and should not blind us to the fact that for many societies change may not have been a fundamental value.
Nevertheless, any society will ultimately lose coherence unless its members continue to see an advantage in being a member of the society (van der Leeuw Reference van der Leeuw, Costanza, Graumlich and Steffen2007). This means that the society must maintain a sense of comfort among its members. I would argue that over long-term time, even if ever so infrequently, some degree of innovation is necessary, because when societies reach tipping points in their dynamics, innovation is called upon.
Whether in the material and technical realm or in the socioeconomic one, every innovation requires energy for implementation, whether it is to change the structure of institutions, to change collective behavior, or to create or modify infrastructure. One of the consequences of the harnessing of fossil energy after 1750 has been that, for a considerable amount of time, it was relatively cheap in energy terms to innovate. We have therefore, over the last 250 years, seen an ever-accelerating spate of innovation in the material and technological realms, which has globally brought with it an important population growth (especially in the last seventy years), an emphasis on “progress,” an increase in life expectancy in many places, and a huge increase in trade leading to globalization. It is difficult to point to specific single causes for this very complex coevolution, but one argument that has a certain ring to it is that these phenomena are part of the ideology that capitalism (initially industrial, more recently financial) has developed to ensure profits through growth. I return to this topic in Chapter 18.
Whether this process can continue at a sufficient rate to keep our current societal institutions intact will of course in part depend on whether we continue to meet our society’s growing innovation needs. But there are some early signs that this is not as self-evident as some think.
One observes in the USA an overall decrease in return on invested capital (Figure 16.10) as well as a decline in entrepreneurship (Figure 16.11), which might be linked to an overall decline in the frequency of major innovations.
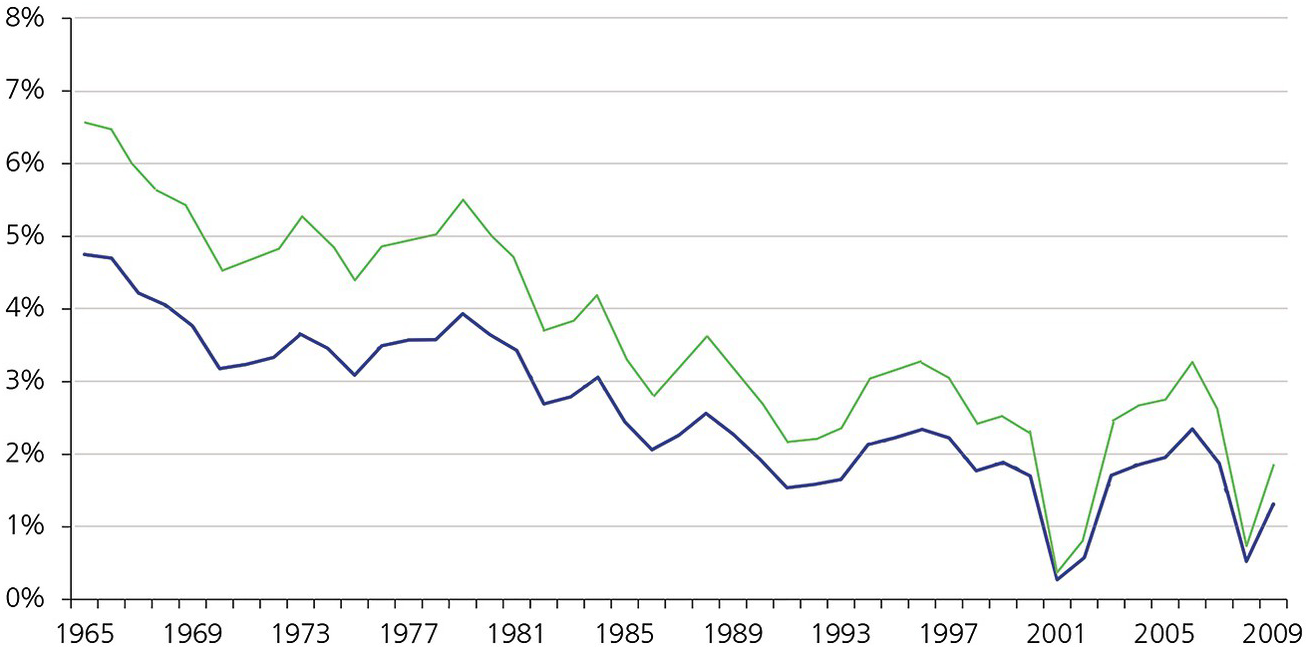
Figure 16.10 Evolution in return on invested capital in the USA, 1965–2011. The blue line represents the evolution of return on assets; the green line that of return on investment.
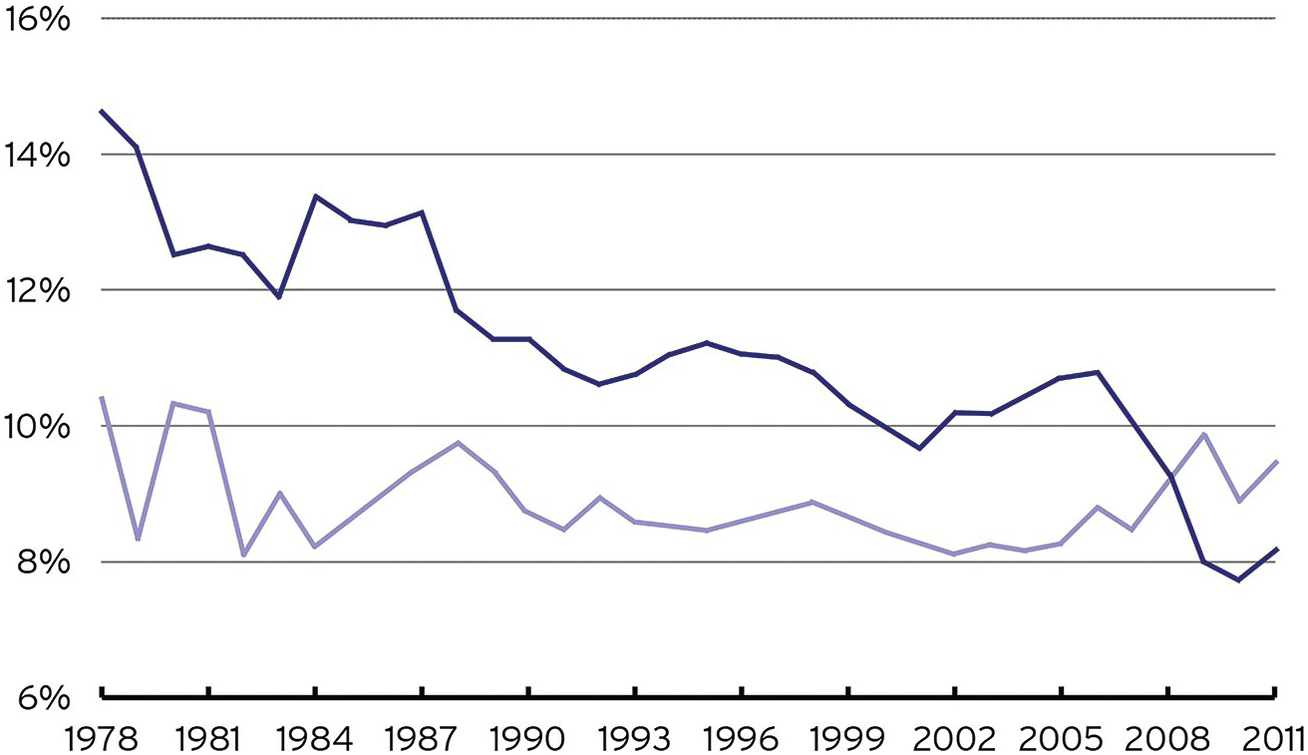
Figure 16.11 Annual new firm creations (dark blue line) and existing firm deaths (light blue line).
If we offset the number of patents per innovator against the growth in size of the teams involved in an innovation, we see that innovation involves more and more domains, and becomes more and more difficult and costly. Research on the wealth created by innovations registered at the US Patent and Trademark Office seems to point to the fact that, in terms of the return on investment on such innovations, their impact on the economy is slowing down (Strumsky & Lobo Reference Strumsky and Lobo2015). This may be because the explosion of patents over the last fifty years has made it more and more difficult to come up with something that is so new that it sets an innovation cascade in motion within or outside our current technologies. Another contributing factor could be that the shift toward short-termism in many industries makes it more difficult to develop innovations with long loss leaders. But there may be a more fundamental reason for this: has our value space (the total set of dimensions to which we accord economic value) reached a limit? I will return to this point in Chapter 17.
Wealth Discrepancy
The global economy has created excessive material wealth differentials by concentrating most such material wealth in the hands of a relatively small, if growing, proportion of the world’s population, almost entirely in the developed countries (Figure 16.12). This causes a steepening of the wealth disparities within and between countries in another very long-term deep trend, as analyzed recently by Scheidel (Reference Scheidel2017), which is very difficult to invert, as his many case studies show.
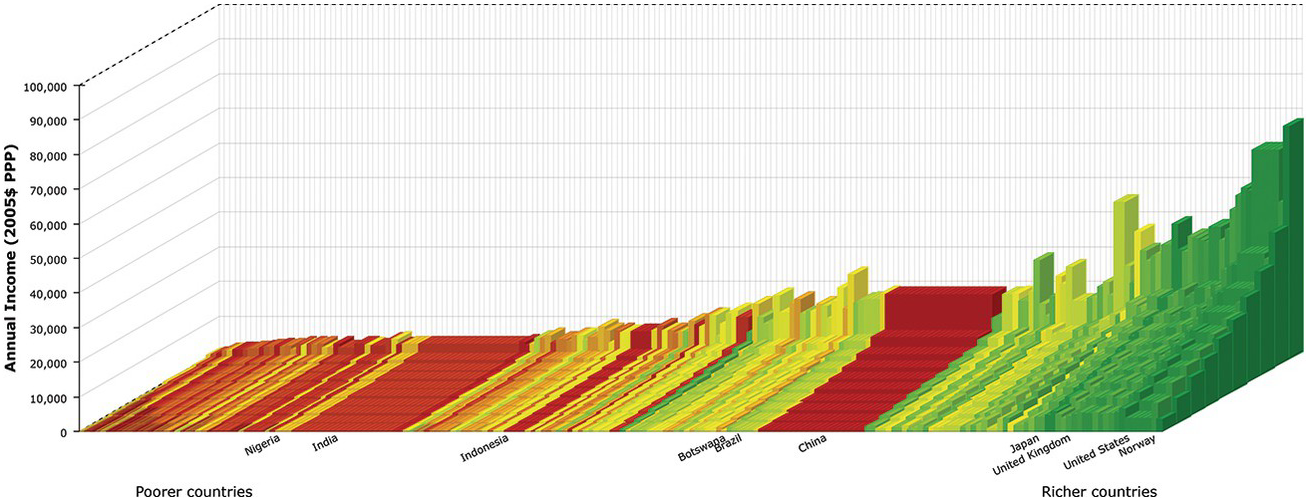
Figure 16.12 Worldwide differences in wealth distribution
Recently, we observe two opposing trends in this dynamic: a leveling off of wealth disparities between developed and developing nations and an increase of wealth disparities within many countries. This is the statistical effect of the rich becoming richer in the developing countries (especially the BRICS countries), while within these countries – as well as in the developed world – the contrast between rich and poor becomes starker.
Recent publications, e.g., Piketty Reference Piketty, Saez and Stantcheva2013,2 have been drawing worldwide attention to this phenomenon, which some see as an early warning sign of major social adjustments – in the developed nations as a protest against the squeeze of the middle classes, and in developing nations as a revolution of rising expectations triggered by the fact that a small proportion of the population is getting (very) rich.
As is now discussed both in academia and in politics, the growing wealth discrepancy seems a manifest case of a societal planetary boundary that we are approaching, or have already crossed. Hence, I will use this section to discuss it at some length. To illustrate the scope of the phenomenon, I will present some statistics.3 In doing so, I use the USA and Europe as examples because there are much better data for the wealth gap here than in many other countries.
Particularly since the 1940s, income inequality in the USA has spectacularly risen, from a situation in which 90 percent of the population collectively made about 66 percent of total US income and the top 10 percent about 33 percent. At the beginning of the 1980s that trend was dramatically inverted, coinciding all too closely with the “big bang” in the New York stock exchange, a major deregulation under the Reagan government. In 2012, the top 10 percent of the population received about half the income of the USA.
Figure 16.13 compares the Anglo-Saxon world with that of continental Europe, and shows how the “big bang” of the 1980s has hugely increased the wealth gap in the English-speaking world, but much less so in (continental) Europe. The most important lesson to learn from these differences in policy between continental Europe and the Anglo-Saxon world is the fact that, indeed, governments do shape markets (Mazzucato 2016), and should be regulating them if they want to preserve social peace. If they abandon that role, and important parts of the population grow apart, they are in for trouble. But of course, part of the responsibility for such growing apart rests upon the voters.
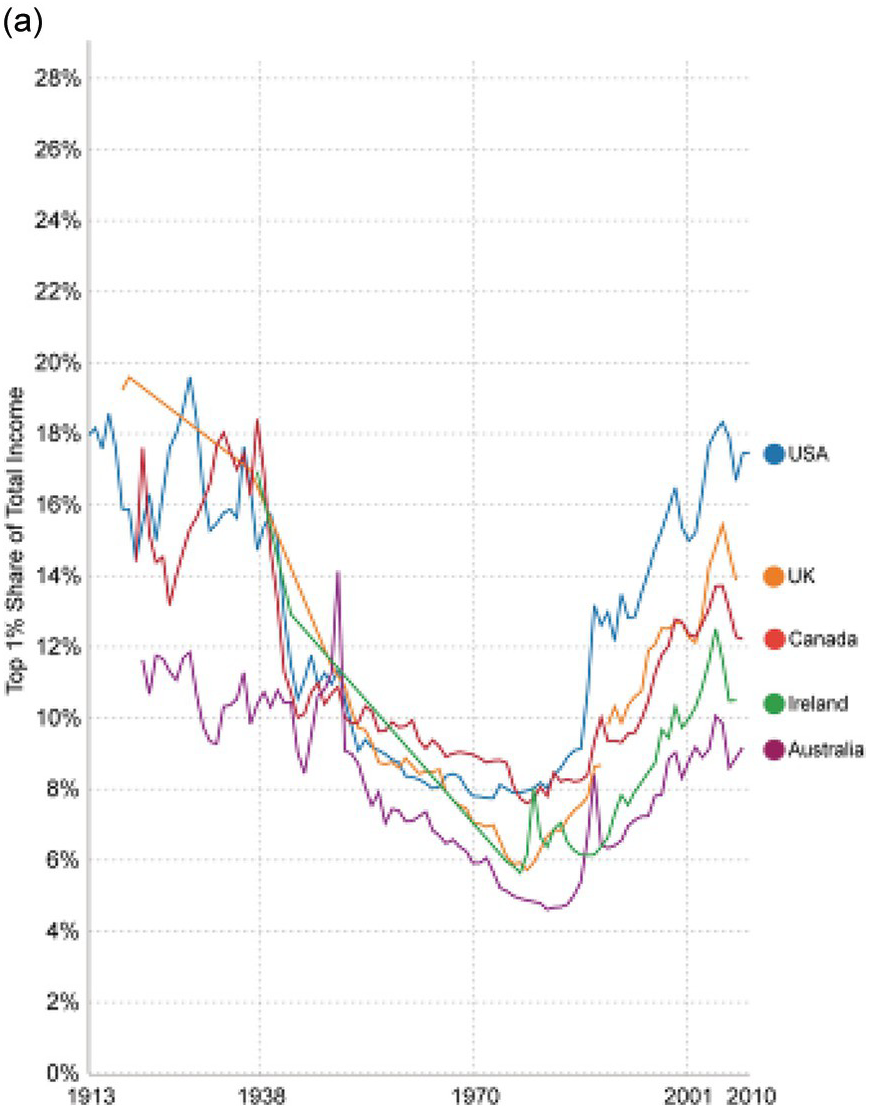
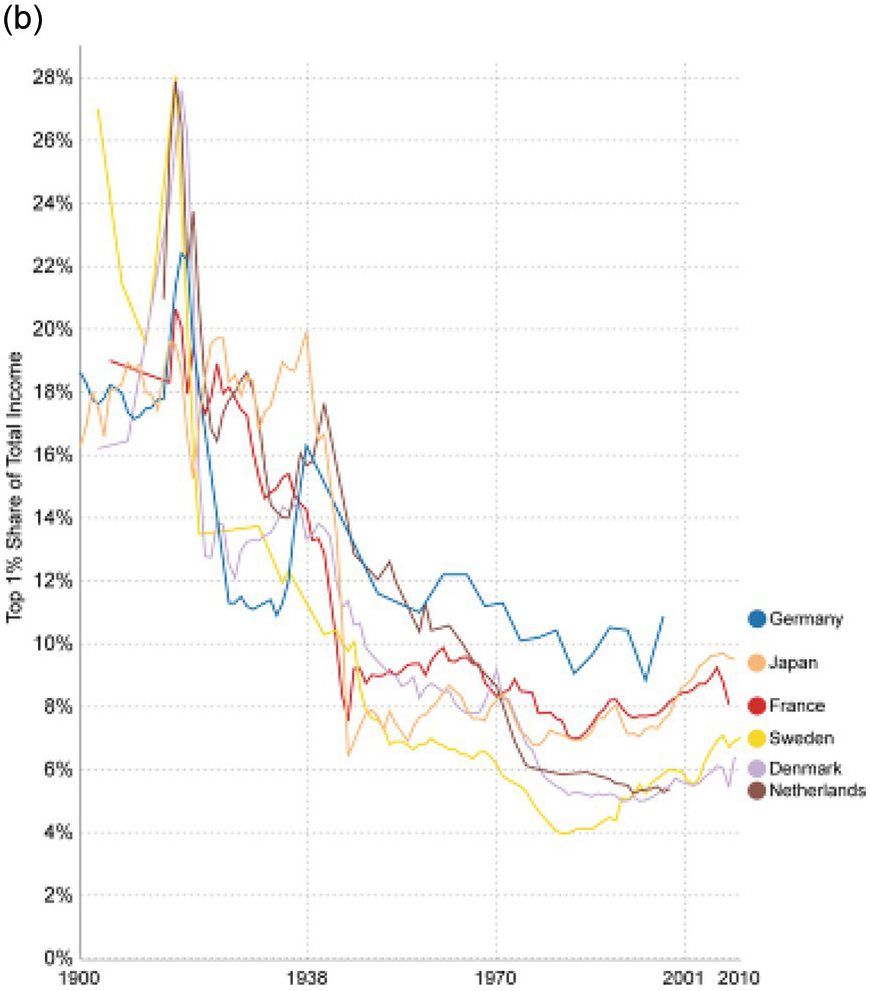
Figure 16.13 The 1980s “big boom” in financial regulation has inverted the reduction of inequality in the English-speaking world, but at least until 2010 not in other parts of Europe.
In the literature, the widening wealth gap in the USA is related to the relative decrease of manufacture – which provided good salaries for production personnel in factories – owing to automation and outsourcing in the developing world. But it is also the case that with the increased reliance of industry and services on automation and ICT, large parts of the economy in developed countries require higher levels of education to deal with more and more complex tasks. This is a dramatic development that will over time pose major challenges to all governments. They will have to find a solution for the large numbers of undereducated, unemployable people that this trend is likely to generate in the next couple of decades. Improving general education, from the primary and secondary school levels to universities, can profit from ICT to drive down the cost of education, but it urgently requires the review of the contents and skills, as well as the ways in which they are acquired. Recent studies argue for a major revision in favor of promoting student-directed learning (Ito and Howe Reference Ito and Howe2016; see also Chapter 4).
The productivity increase has generally not been used to reward the median family in these countries. Automation, offshoring to countries with lower wage levels, as well as the 2008–2010 economic crisis are among the responsible factors. The extra profits have generally gone to major corporations and the rich and super-rich segment of the population – in the USA most extremely owing to the tax system bias, of which Warren Buffett (one of the richest US citizens) famously said (in 2012) that he pays a smaller proportion of his income in taxes (17.4 percent) than his secretary (35.8 percent). It is only in 2018 that tension in the labor market is beginning to force companies in that country to pay higher wages.
If we look at the evolution of wealth globally (see Figure 16.14), the so-called elephant curve (Lakner & Milanovic Reference Lakner and Milanovic2013), representing the growth in average household income of each percentile group worldwide between 1988 and 2008, we see the combined effect of three trends: (1) rapid and substantive income growth for the poorest part of the world population, especially in some developing countries, but starting from a very low base, (2) absent or low income growth for the middle classes in the developed countries, and (3) rapid growth for the richest people in the developed and some developing countries (notably China). Corlett (Reference Corlett2003) shows that differences between countries’ population growth rates and the selection of countries included in the statistics (notably Russia, Japan, and China) accentuates some of the contrasts, but this does not fundamentally change the picture that the middle classes in developed countries have not seen any increase in real income in this period.
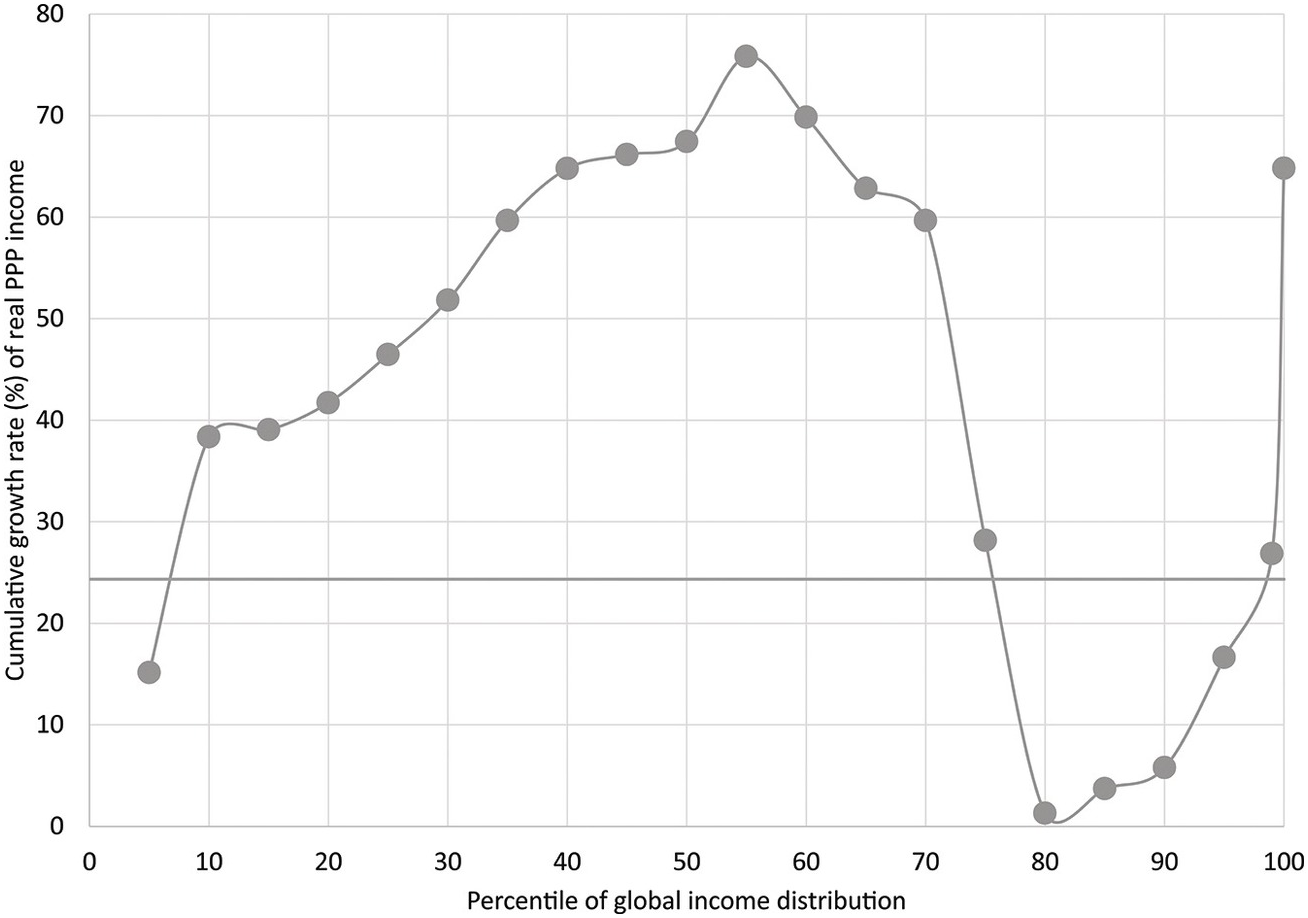
Figure 16.14 Global growth incidence curve, 1988–2008. One sees that below the tenth percentile incomes have grown very strongly, while incomes between the tenth and the fiftieth percentile incomes have grown substantially, whereas from the fiftieth percentile to the eightieth incomes have substantially declined. From the eightieth to the ninety-fifth they have grown some, and beyond the ninety-fifth they have grown exponentially.
Turning now from the phenomenon and some of its causes to some of its consequences, we can look at Figure 16.15, which shows the relationship, in a number of countries, between energy use (as a proxy for wealth) and a composite metric, social progress. This indicator combines life expectancy, education (as measured by proficiency in mathematics and literacy), infant mortality, homicides, imprisonment, teenage births, obesity, mental illness, social mobility, and drug and alcohol addiction. The relationship is quite convincing.
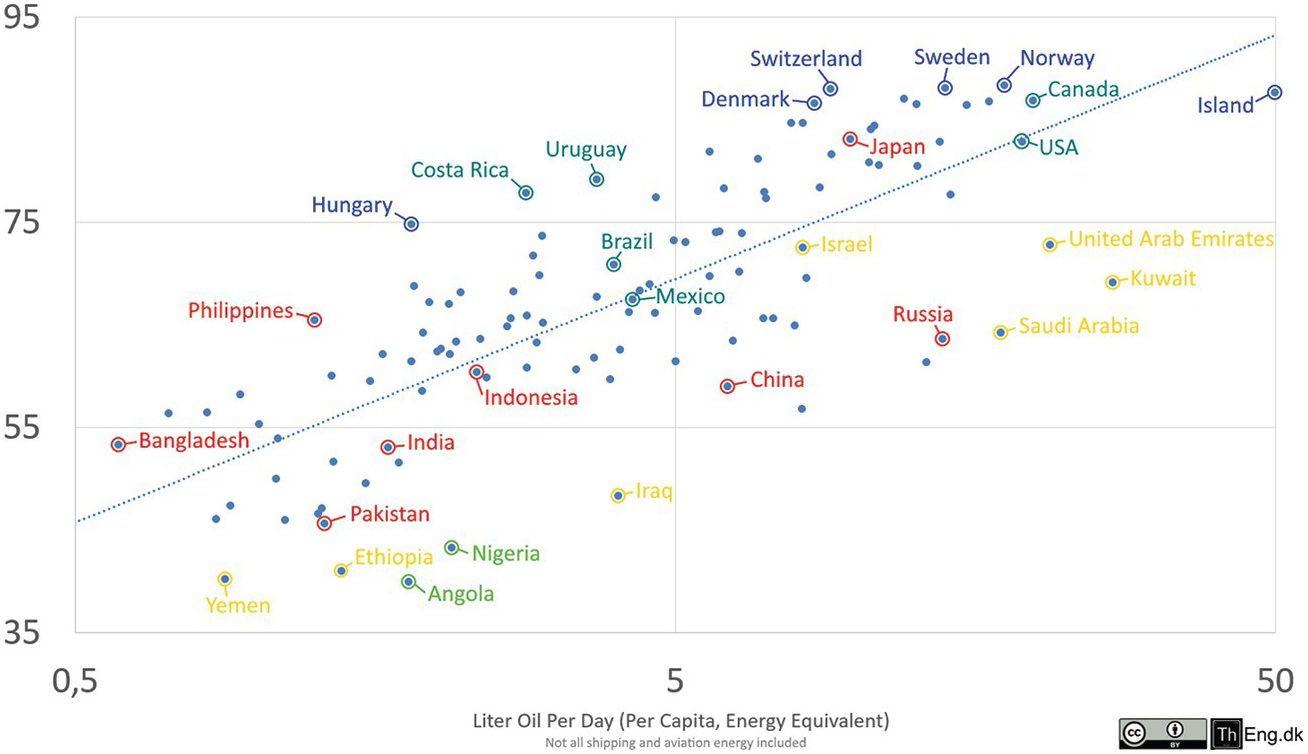
Figure 16.15 Social Progress Index vs. energy per country.
I conclude by repeating that the growing wealth discrepancy seems a manifest case of a societal planetary boundary that we are approaching or have already crossed. Some see it as an early warning sign of major social adjustments – in the developed nations as a protest against the squeeze of the middle classes, and in developing nations as a revolution of rising expectations triggered by the fact that a small proportion of the population is getting (very) rich.
Urbanization
We should include in this series of stresses that current global societies are undergoing the very rapid increase of urbanization. Urbanization is one of the major drivers of societal and environmental change and is a major topic of discussion in the sustainability context (Seto et al. Reference Seto, Güneralp and Hutyra2012, Reference Seto, Golden, Alberti and Turner2017). It is in effect the most long-standing materially observable societal transformation that we know, as it originated around 6,000 years ago. Current projections of the growth of urbanization seem to indicate that by 2050, 68 percent of the global population will live in cities (UNDESA 2018). However, it is not clear that such linear projections are trustworthy, as there are a number of factors (high institutional vulnerability, rising transport costs owing to climate change, food security, and potential changes in governance structure) that may force the drivers of urbanization in a different direction.
Although there are possibly as many explanations for the existence of towns as there are towns (Jacobs Reference Jacobs1961), one recent approach, proposed by Bettencourt et al. (Reference Bettencourt, Lobo, Helbing, Kühnert and West2007) and Bettencourt (Reference Bettencourt2013) relates their existence and many of their features to societal information processing. Based on allometric scaling analyses, it argues that there is a direct relationship between innovation and urban scale, expressed by the fact that with urban scale (as expressed in population numbers), innovation activities grow superlinearly while energy use grows sublinearly (Table 16.1). Population and services, scale, of course, linearly. The authors argue on this basis that while energy is a constraint in the growth of urbanization, information processing, and innovation in particular, is its driver (see also Florida 2014). That would explain why the explosion of urbanization and that of material innovations have gone hand in hand to drive our consumption society to its current heights.
Table 16.1 Allometric scaling relationship between innovation processing (research and its results, in red), population size (in green), and energy use (in blue). All metrics concerning the creative professions scale superlinearly (around 1.25), those related to the size of the population scale linearly (around 1.00), and those related to energy consumption scale sublinearly (around 0.80). The others are either summations (wages, bank deposits, GDP, electrical consumption, etc.) or less dependent (AIDS, crime) upon any of these three categories.
| Y | Beta | 95% CI | Adj-R2 | Observations | Country-Year |
|---|---|---|---|---|---|
| New patents | 1.27 | 1.25, 1.29 | 0.72 | 331 | US; 2001 |
| Inventors | 1.25 | 1.22; 1.27 | 0.76 | 331 | US; 2001 |
| Private R&D employment | 1.34 | 1.29; 1.29 | 0.92 | 266 | US; 2002 |
| “Supercreative employment” | 1.15 | 1.11; 1.18 | 0.89 | 287 | US; 2003 |
| R&D establishments | 1.19 | 1.14; 1.22 | 0.77 | 287 | US; 1997 |
| R&D employment | 1.26 | 1.18; 1.43 | 0.93 | 295 | China 2002 |
| Total wages | 1.12 | 1.09; 1.13 | 0.96 | 361 | US 2002 |
| Total bank deposits | 1.08 | 1.03; 1.11 | 0.91 | 267 | US; 1996 |
| GDP | 1.15 | 1.06; 1.23 | 0.96 | 295 | China 2002 |
| GDP | 1.26 | 1.09; 1.46 | 0.64 | 196 | EU 1999–2003 |
| GDP | 1.13 | 1.03; 1.23 | 0.94 | 37 | Germany 2003 |
| Total electrical consumption | 1.07 | 1.03; 1.11 | 0.88 | 392 | Germany 2002 |
| New AIDS cases | 1.23 | 1.18; 1.29 | 0.76 | 93 | US 2002–2003 |
| Serious crimes | 1.16 | 1.11; 1.18 | 0.89 | 287 | US 2003 |
| Total housing | 1 | 0.99; 1.01 | 0.99 | 316 | US 1990 |
| Total employment | 1.01 | 0.99; 1.02 | 0.98 | 331 | US 2001 |
| Household electricity consumption | 1 | 0.94; 1.06 | 0.88 | 377 | Germany 2002 |
| Household electricity consumption | 1.05 | 0.89; 1.22 | 0.91 | 295 | China 2002 |
| Household water consumption | 1.01 | 0.89; 1.11 | 0.96 | 295 | China 2002 |
| Gasoline stations | 0.77 | 0.74; 0.81 | 0.93 | 318 | US 2001 |
| Gasoline sales | 0.79 | 0.73; 0.80 | 0.94 | 318 | US 2001 |
| Length of electrical cables | 0.87 | 0.82; 0.92 | 0.75 | 380 | Germany 2002 |
| Road surface | 0.83 | 0.74; 0.92 | 0.87 | 29 | Germany 2002 |
That has created a number of major stresses for the urban component of the global system dynamics (UNDESA 2018). Urban systems are costly and highly vulnerable both socially and environmentally. As can be seen in many developing parts of the world, economic inequality, crime, food insecurity, and lack of hygiene all abound in urban systems unless very costly social and infrastructural measures are put in place. The growth of urban systems has hugely increased the (energy-costly) worldwide flows of goods, including foodstuffs and water, as well as an increasingly wide range of other products across the world. It has thus exploded the footprint of the global urban population. The growth of urbanization should also be seen in the perspective of the rural depopulation that is occurring, or has recently occurred, in many parts of the world, uprooting communities, transforming landscapes, and industrializing agricultural production methods in developed and developing areas.
One of the fundamental questions of capital importance for sustainability in all domains of human endeavor is therefore whether the current trend toward further urbanization will continue as is assumed by the linear projections of our current “business-as-usual” scenarios. In view of our assumption that the need for increased communication has over the long term been one of the major drivers of urbanization, it will be particularly interesting to see how the changes wrought by the ICT revolution will affect global urbanization. For some, this may imply that urbanization is at the core of the tensions our world is seeing. But it seems to me that it is merely one of the many manifestations of the fact that our current mode of life (in the developed countries in particular) is butting up against planetary social boundaries.
Globalization
Another long-term trend that we will need to include in our thinking is globalization itself. For five centuries, the European (and later the western) socioeconomic system has spread across the world. Initially this occurred through trade (1500–1800), then (1800–1945) through military and administrative exploitation, and since World War II in the form of economic colonization. But since World War II a countertrend has also been visible, in which colonies gain independence, find their economic footing, and gain self-confidence (in part through learning from developed countries). Now the Euro-American sphere is coming under increasing political and economic pressure. The rise in importance of the BRICS countries is a sign of this; it is bound to be a source of uncertainty for the coming fifty years or so while the world searches for a new political organization. I will discuss ICT’s role in this shift in Chapter 17.
An important underlying trend is that a reduction in the dimensionality of metrics (and awareness) of human wellbeing has emerged. Different cultures and populations have been aligned around the dimension of wealth (GDP) as the one by which they compare themselves and transact exchanges.
Other dimensions such as religion, community solidarity, art, and culture have been decreasing in importance as drivers of decision-making except among focused subsets of societies. This in turn has increased the emphasis on wealth, productivity, and growth, and led to the overexploitation of natural and social capital in many regions.
Current populist movements find their origins at least in part in the need to rediscover those multidimensional communal value sets, as was finely analyzed by Karl Polanyi (Reference Polanyi1944) and members of his school in anthropology (e.g., Graeber Reference Graeber2001; Munck Reference Munck2004). Elites have been able to make the transition toward a globalized society, whereas a very large majority of citizens worldwide has been left behind, focused on their local community and thus resistant to expanding the spatial sphere of their identity. This has shaped another deep (second order) field of tension that will inevitably play a major role in structuring our world over coming decades.
Summary
To summarize, there are a number of indicators that point to the fact that some of the resources, both natural and human, on which our western societies and economies of the last couple of centuries have been based are no longer amply available, and that this is, or will soon be, causing stresses in the planetary societal system. Are our societies currently moving toward a tipping point that will, whether we like it or not, force them to introduce major structural changes in the way they are organized? Changes of a scale and scope that we have not seen for centuries because our societies are close to exceeding the boundaries of a societal safe operating space? In this chapter, I have mentioned some of the phenomena that point in that direction. As in the case of the environmental planetary boundaries, the inherent major risk is that the different kinds of societal dynamics described will ultimately come to interact in such a way that they will destabilize the current global order. It is therefore fundamental that we no longer look at these different aspects of the current situation in isolation, but as a complex of interrelated factors.
In that light, it is in my opinion a great pity that the world’s attention has so far increasingly been focused on CO2 emissions, greenhouse gases, and climate change. Though that is, evidently, an important aspect of what is going on in the Earth system, it is only one aspect, and dealing with it in isolation, however difficult that proves to be, will not fundamentally change the socioenvironmental dynamics in which we find ourselves globally.
This is not the first time that humanity has faced such a challenge. Looking back some 10,000 years, there have been at least two other moments in (relatively) recent human history where such very fundamental transitions have occurred: the emergence of sedentary, cultivating societies around 9,000 BP and the emergence of urban societies around 5,000 BP. In principle, therefore, humans are able to collectively make such major structural changes in their social organization. However, in both cases this occurred in the absence of a threat to stability at a global scale, and in both cases the changes took considerable time (centuries, if not millennia). Will the acceleration of innovation that has been triggered by the exploitation of fossil energy, together with the accelerating effect of the ICT revolution, enable us to reduce the time needed for such structural social change to the extent that we avoid disaster? To answer this, I need first to present my perspective on the causes of the emerging crisis.
A Complex Adaptive Systems Perspective on “Crises”
Let me now try to conceptualize the concept of crisis that I have introduced as an important dynamic. The study of crises has led to many descriptive publications, case studies, and doomsday hypotheses, from Gibbon (Reference Gibbon1776–1788) and Spengler (Reference Spengler and German1918) to Diamond (Reference Diamond2005), but it is only in recent years that elements of a more general scientific theory of socioenvironmental dynamics, including societal crises or even societal collapse, are emerging, combining insights from four research domains. The natural sciences have contributed to the set of ideas that is sometimes called the science (or theory) of complex systems that is introduced in Chapter 7 (e.g., Prigogine Reference Prigogine1977; Kauffmann Reference Kauffmann1993; Bak Reference Bak1996; Levin Reference Levin1999; Mitchell Reference Mitchell2011). Social anthropology has contributed in the area of cultural theory (Thompson et al. 1989) that is at the root of our understanding of the societal reactions to different stages of the resilience dynamic (see Chapter 5), and the sciences of organization and information have contributed to our understanding of the dynamics of organization in social structures extensively discussed in Chapter 11 (e.g., Pattee Reference Pattee1973; Simon Reference Simon1969; Huberman Reference Huberman1988). Some of these ideas on the nature of organizations have been taken up and adapted by ecologists (e.g., Allen & Starr Reference Allen and Starr1982; O’Neill et al. Reference O’Neill, de Angelis, Waide and Allen1986; Allen & Hoekstra Reference Allen and Hoekstra1992). Finally, the first attempt at a synthesis of these different ideas comes from a collaborative effort of ecologists and social scientists (Holling 2001; Gunderson & Holling Reference Gunderson and Holling2002; Walker & Salt Reference Walker and Salt2006). I would like, in this section, to proffer a metadescription of what causes such societal crises.
In looking for causes of major transitions (‘tipping points’) such as the one that we are currently facing, and which all societies have encountered at some point in history, we must move away from any specific external or internal causes such as climate change, epidemics, or political (mis)management. These are of course occurring in certain instances, but one must search at a different level of generality, formulating the dynamics in a different language if one is to move from proximate to ultimate causes; causes that truly take into account that such tipping points occur in the evolution of each and every society, no matter what are their natural environment, their specific internal dynamics, or their external perturbations.
As I will argue in the next section, it seems to me that the crises (tipping points, phase transitions) that we are experiencing might be due to two simultaneous – and related – dynamics that combine to increasingly constrain our societal dynamics, narrowing the range of opportunities for their future and at the same time making management of the present more difficult: (1) the accumulation of unexpected consequences of our past actions and (2) the reduction of our value space. In the remainder of this chapter, I will deal with the former; the latter will get attention in Chapter 17.
Accumulation of Unexpected Consequences
The complexity of the Earth system or any of its subsystems is so generally accepted that it hardly requires demonstration. I have argued earlier (Chapter 7) that we need therefore to conceive of the Earth system and its (natural, social and socionatural) subsystems as a complex adaptive system (CAS) in the theoretical sense of the word; i.e., as fundamentally unstable systems of many active agents, in which both agents and processes mutually affect many other components of such (open) systems. The study of such CAS focuses on the complex, emergent, and macroscopic properties of the system that are due to the interactions of these agents. For all intents and purposes, in practice the number of interactive actors and processes at all scales approaches infinity.
Seen in these terms, the infinite complexity of the Earth system contrasts strongly with the limitations of human perception. We saw in Chapter 8 that experimental research as well as a monitoring of the archaeological record, lead us to conclude that the short-term working memory of modern human individuals limits their perception biologically to at most 7 ± 2 information sources simultaneously (Read & van der Leeuw Reference Read and van der Leeuw2008, Reference Read, van der Leeuw, Renfrew and Malafouris2009). Although over the course of human Holocene history, our species has developed an amazing array of techniques to overcome that handicap, from introducing narratives that symbolically refer to more dimensions to the introduction of many abstract concepts capturing more dimensions and to working together in groups to extend the number of dimensions that can simultaneously be perceived, nevertheless human perception, whether individual or collective, has never been able to capture the virtually infinite number of dimensions that constitute the dynamics of the Earth system, far from it.
I pointed out in Chapters 2 and 5 as well as elsewhere that the consequence of this cognitive constraint is that any human intervention in the environment is based on a very simplified perspective on the processes actually going on in that complex environmental system. On the other hand, human impact on the environment is highly multidimensional, as any human action directly or indirectly affects many of the dimensions of the socioenvironmental system involved, many more than are perceived. As a consequence, any human action upon the environment leads to numerous unexpected or unanticipated consequences (Nowotny Reference Nowotny2015). Over long-term time, although our knowledge about a certain system may increase (linearly or even geometrically), owing to the difference in dimensionality between our (individual and collective) cognitive space on the one hand, and the complexity of the system of which we are part on the other hand, the unexpected consequences of our actions increase exponentially. Or in simpler terms, though we may (correctly) imagine we know more (and are thus able to intervene and control more), in effect we know less and less about the environmental systems we are dealing with, because in the process of learning about them and interacting with them, we have changed them very profoundly in many more dimensions than we are aware of. Hence, in reality we are experiencing loss of control.
In every socioenvironmental system we therefore encounter a number of tipping points that are inherent in the human–environmental interaction itself, although they cannot be predicted a priori. Often, such crises are seen as events that are brought about by extraneous or unexpected disturbances, whether these are triggered inside or outside the socioenvironmental system. I argue, however, that such crises (sudden tipping points, or to use René Thom’s (1989) word catastrophes) are actually the inevitable result of human intervention in the environment and occur whenever a socioenvironmental system is overwhelmed by the unexpected consequences of past actions. One might therefore rephrase the definition of crisis as “A temporary incapacity of a system to process the information needed to respond to keep it coevolving with the context in which it finds itself as a result of its own antecedent actions.”
These unexpected consequences, time and again, lead to the need to make fundamental changes in that relationship – resetting the way in which human societies deal with the environment (see Chapter 10; van der Leeuw Reference van der Leeuw2012), and more specifically how they deal with the relationship between their internal dynamics and those in their environmental context (niches), as formulated by Laublicher and Renn (Reference Laubichler and Renn2015). One way to think of this interaction is illustrated in Figures 16.16a–c. In these figures, the thick line symbolizes in a stylized way the trajectory of the environment of a human system and the thin line the trajectory of the human system’s information processing. The basic idea is that, according to the principle of unexpected consequences, any human interaction with an environment transforms that environment and reduces the capacity of the society to interact with that environment. Hence, after some time, the society needs to “reset” its relations with the environment to regain the capacity to interact with it efficiently. The three figures show (Figure 16.16a) how not resetting – or not resetting in time – definitively loses the society’s capacity to interact with its environment, (Figure 16.16b) how resetting at regular intervals helps maintain the interaction between society and environment for longer, but at some point at the cost of more drastic resets, and (Figure 16.16c) how irregular and frequent resetting enables the society to maintain closer and more effective interactions with its environment.

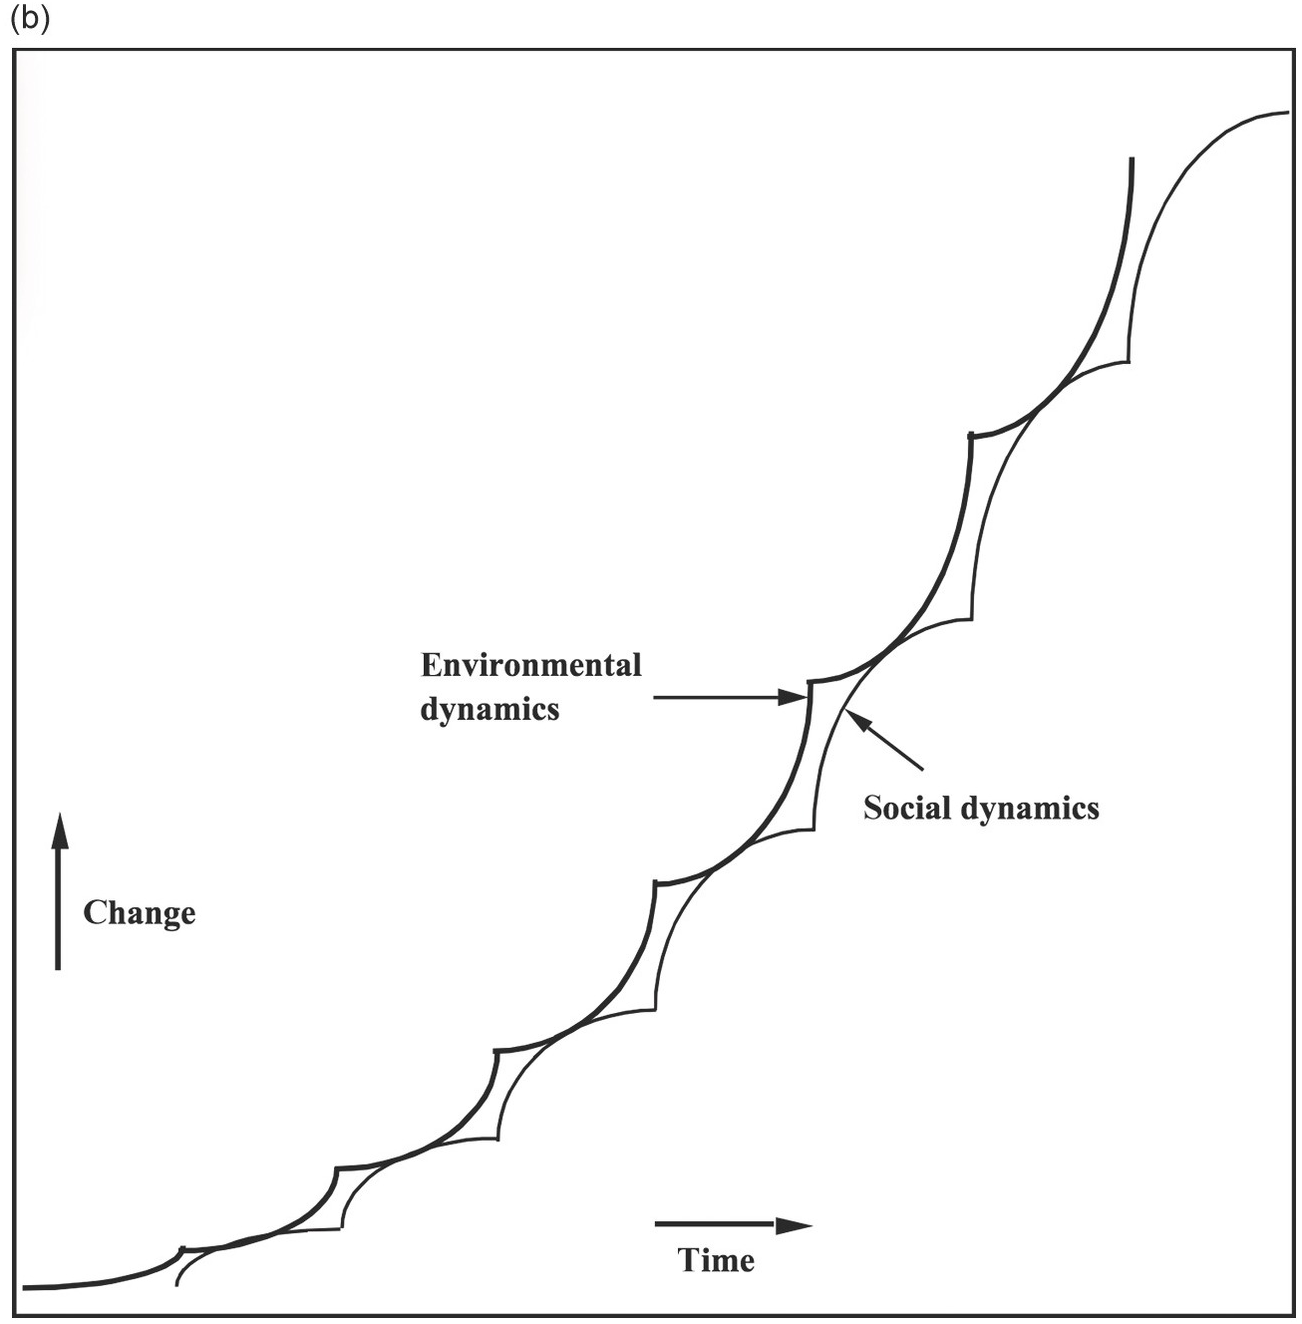
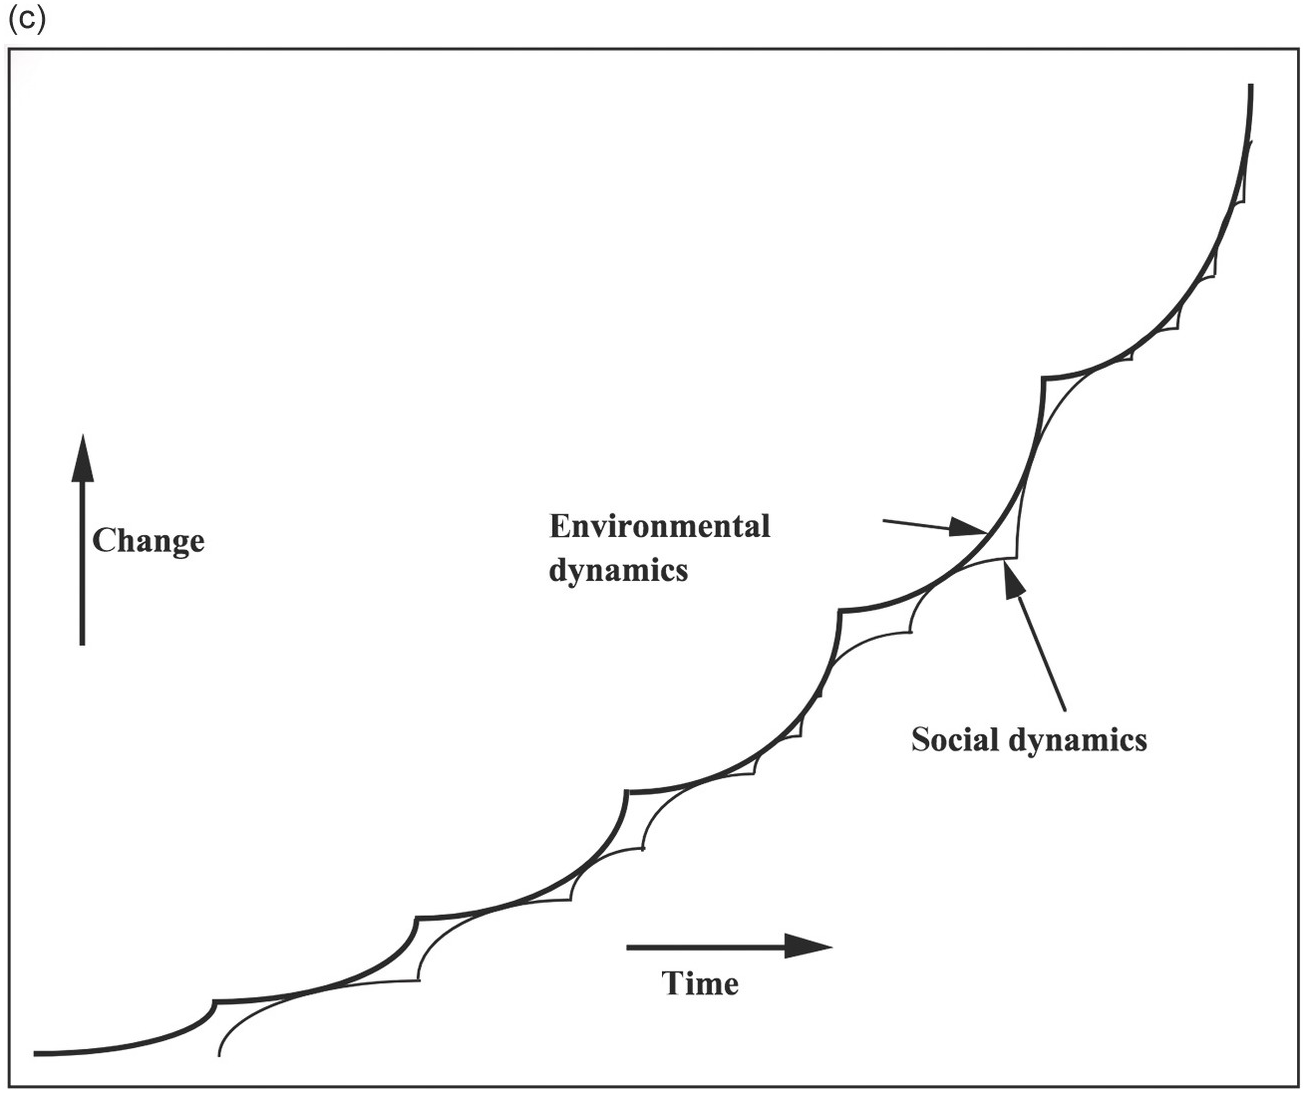
Figure 16.16a–c To stay in tune with the environmental dynamics, the frequency and timing of information-processing resets is crucial.
It should be added that as the group of interactive humans grows, and its social structure becomes more and more complex, the nature of the required resets changes. Initially, in a simple, small society (such as an isolated village), the resets are predominantly a question of adapting the societal component to changes in the natural one, but as the group grows, and societal complexity grows superlinearly with it, the spectrum of the resets shifts toward the social domain, which comes to dominate the environment.
That shift also has consequences for the frequency with which resets occur and the speed with which they happen in order to retain the cohesion of the society’s relations with the environment. Initially, in the simple social situation, the environmental dynamics have a much higher dimensionality and are therefore more complex and slower to change than the societal ones (see Ch 14). The human dynamics, which can potentially be faster (because humans can learn), can adapt to the slower environmental ones. As the societal dynamics grow more complex, and human intervention in the environment has reduced its complexity, the societal dynamics come to dominate the interaction, and societally driven adaptations are likely to follow each other faster and faster. That seems to be the current situation in the Anthropocene.
Finally, I would emphasize that these second order dynamics do not only concern the interaction between societies and their natural environments. Because all human interaction with other human beings, but also with ideas, materials, institutions, and everything else combines the dimensional limitations of human cognition with action upon a system that is much higher in dimensionality, it actually concerns any human perception–action loop, including the ones that play out in the purely societal and social, the technical, and the economic domains.
Referring to the current condition of the world system, I would argue that in the above process we have come now to a point where the gap between our societies and their global societal and natural environments, particularly in the developed nations, has grown so wide that a very major reset has become necessary. The Industrial Revolution is an excellent example of such a reset: the overall growth of European societies led to major societal tensions that were dissolved (after a considerable period of adaptation) into the kind of societal organizations we have nowadays in the western world, including new institutions, new ways of exploiting the environment (particularly in the colonies), new technologies, a huge advance in general education, and so forth. But those nineteenth- and twentieth-century innovations have now served their time, and have become maladaptations in need of a new readjustment (van der Leeuw Reference van der Leeuw, Wilson and Kirman2016). Our societies have (temporarily?) no longer the information processing capacity to deal with the accumulation of unexpected consequences of our earlier actions, and are therefore incapable of constructing effective, durable, relationships with our environment(s). That is one of the dynamics that is constraining our current and future development as global societies – we urgently need to move to a basin of attraction that is not dominated by those unexpected and unanticipated consequences of our earlier actions.
Introduction
It is clear that we are hitting a tipping point, but it is no ordinary tipping point. I will argue in this chapter that this moment of crisis is a mega-mega-tipping point. Actually, taking a long-term perspective, it is one of the three most consequential tipping points in human history. The other two were the mastery of matter (which took, as we saw in Chapter 8, a couple of million years to achieve) and the harnessing of fossil energy (which took about two centuries). This raises a question about how leaders can plan in a system where unintended consequences and extreme nonlinear events become increasingly frequent.
One of the themes of this book is to show how the organization and functioning of human societies has always been shaped by challenges in information processing. An interesting role was played in this process in around 300 BCE in Europe, possibly earlier in China, by tokens and (later) coinage and money, whereby the transmission of information through the mechanism of price indicated a combination of values. In Europe, this became especially relevant in the Renaissance, when a variety of fiduciary financial instruments was developed. Financial values became important indicators of the wellbeing of princes and nations as well as individuals, of the desirability of goods, and the risk involved in acquiring them. Another important early phenomenon that played a major role in this process in Europe and China was the introduction of printing, and the huge transformation that this engendered in spreading information much wider (see Bonifati Reference Bonifati2008).
But until very recently human societies have never been confronted with the isolation of information as one of the three basic commodities of life (alongside matter and energy). Nor have societies found ways in which to divorce information from most of the material and energetic substrates and channels through which it was transmitted. This process began in the late nineteenth century (see Gleick Reference Gleick2011) and has accelerated in the last sixty years or so. It is only some twenty-five years old as a mass, global phenomenon.
This is not the kind of transition that we will be able to cope with by simply becoming more resilient as individuals or as societies, all the while remaining more or less organized as we have been. If you do not believe this, I refer you to the overview of the ongoing changes by Thomas Friedman (Reference Friedman2016). In this book, he sketches the changes that are currently being wrought by acceleration in several domains. Of these, the environmental domain is best known. But other accelerations are playing into the same process, and together they are wreaking the kind of destabilization of our societies that may lead to chaos – in the strict and scientific sense of the word – a drift toward total unpredictability of the behavior of our societal (and therefore our socioenvironmental) systems. The main drivers that Friedman outlines are among those I mentioned in Chapter 16, notably demography, technology, finance, and environment. No doubt governance should be added to these (see Haass Reference Haass2017). I will deal with each of these in turn. But this is not all. The fact is that the interactions between the accelerations in these domains are only beginning to be perceived; they are beyond our collective control, and so far we have no idea how to deal with the second order changes they may be triggering.
Of course it will not surprise any reader when I emphasize that these changes are intimately related and part of one and the same dynamic that seems to be getting out of hand: unintended consequences of earlier actions and decisions that are being reinforced by the acceleration of information processing, driven by increasing interactivity between more and more people who are in possession of more and more complex and effective tools for thought and action. Several centuries of reductionist thought have both linearized complex phenomena to make them more accessible, and compartmentalized knowledge within disciplinary systems. This in turn has reduced the frequency of intuitive insights into such complex, nonlinear systems. While thinking that they gained more knowledge, people have lost an understanding of the socioenvironmental systems they had modified in their attempt to bring parts of them under control. But before I look in some detail at these changes, I would like to put them in perspective.
The Acceleration of Invention and Innovation
For most of human history, inventions by individuals were only transformed into innovations at the societal level if there was, whether consciously or unconsciously, a need for them (and such a need was not necessarily owing to a challenge; it could be an emotional need, such as in the case of jewelry and similar objects) and if there was enough free energy and matter (wealth, in the sense of human, social, and natural capital) available to implement them. The pace of societal change was limited by these two requirements for societal innovation, and so was the change in value differential between society “insiders” who were part of the innovating community and “outsiders” who were not.
We have seen that this changed from around 1800 with the introduction of ways in which to use fossil energy on a massive scale, and the Industrial Revolution that this enabled. As the energy constraint was relaxed and collective human information processing was favored by new innovations (as in transport, communication, finance, urbanization), the last two centuries saw a rapid acceleration in which information processing ultimately replaced energy as the main constraint, and marketing enabled innovators to create demand for their products. In the process, this fostered an important increase in wealth differentials, the exponential growth of cities, our dependency on the fossil energy industry, and globalization driven by the consumption society. On the other hand, it also fostered the emergence of improved education as a fundamental societal need. The acceleration of information processing is accentuating, at least for the moment, these tendencies. This shift has hugely reduced the chances that outsiders become insiders, creating an extraction-to-waste economy (in terms of raw environmental limits (Steffen et al. 2015).
We saw in Chapter 15 how, because of the territorial limitations of national governance, this system’s spread around the globe has enabled – but has also been driven by – growth of the large multinational corporations. Their impact outside the core of the western world has slowly but surely, since 1950, incorporated regions that were culturally and socially fundamentally different into that extraction-to-waste economy and made it truly global. By adopting certain decision criteria in both the economic and the social sphere, they drove individuals, groups, and countries to gradually adopt wealth-directed mindsets, activities, and institutions that are compatible with globalization’s wealth-based urban logic.
In the last thirty years, this process has accelerated, and it is now reaching the conurbations of China, Indonesia, India, and Nigeria, for example. This will not only accelerate global warming, resource shortage, and the material basis of our world’s social systems, but it will also become more accident-prone because more and more of the dynamics of the system are becoming interconnected, ultimately leading to hyper-connectivity and thus becoming unduly sensitive to minor disturbances in one place or one sector or another (Helbing Reference Helbing2013). This will (inevitably and differentially) impact the vulnerability, resilience, and adaptability of different scales of the system (Young et al. Reference Young, Berkhout, Gallopin, Janssen, Ostrom and van der Leeuw2006).
The Acceleration in Information Processing
I have used a dissipative flow structure model that is based on feedback and feedforward loops between perception, knowledge, information processing, growth of communities, increased use of energy, and accumulation of unintended consequences to describe the evolution of societal structures through time in dynamic terms. In this long-term development, increases in human information-processing capacity have been central.
Until the middle of the nineteenth century, matter, energy, and information were closely embedded in each other while being transmitted orally, in language, in writing, in the shape and qualities of artifacts, but also in the structure of organizations and institutions. Oral communication between people embedded information in language and gestures, blinks of an eye, or a smile. Artifacts informed substance and simultaneously substantiated information into tools for action, which thus became essential parts of the information-processing systems of societies.
Writing was a major step in disembedding information by substantiating symbols with informational meaning onto different material substrates, and thus facilitating communication beyond immediate interaction between people and beyond unity in time and space. Printing popularized this means of communication. With the telegraph and telephone, other steps on this trajectory were set, transmitting information in the form of pure (electrical) energy, and thereby hugely reducing the cost of communication. But this electrification did not extend to the processing of information.
At the root of the current tipping point is the fact that presently information is processed in the digital form of 1 or 0 (on or off) in electrical circuits. This fundamental difference from earlier tipping points is profound, as it has enabled the emergence of computing, the Internet, artificial intelligence, and all that has come with it.
This disembedding of information processing is (for the moment) the last stage in the story of societal information processing. For the first time in the development of human societies on Earth it has enabled the (semi-)independent processing of information by machines, and this in turn is the major driver of the transition that current human societies are facing. We all know that this digitization of information processing has changed the world, but looking in more detail at how it has changed the world is worthwhile.
The Information Explosion
In sustainability science, the term “the great acceleration” captures the fact that since the beginnings of the eighteenth century resource use and pollution of the Earth system have exploded. But in the context that we are talking about here, I want to draw attention to the fact that the great acceleration has, since about 1970, been further speeded up by electronic information processing.
Recall for a moment the information-processing feedback loop that is driving societal dynamics and the transformations in them (see Chapter 8):
Problem-solving structures knowledge ––> more knowledge increases the information-processing capacity ––> that in turn allows the cognition of new problems ––> creates new knowledge —> knowledge creation involves more and more people in processing information ––> increases the size of the group involved and its degree of aggregation ––> creates more problems ––> increases need for problem solving ––> problem-solving structures more knowledge … etc.
Until the information and communications technology (ICT) revolution, this feedback was relatively slow – initially it took a very long time to master the processing of matter, then less time to master the use of fossil energy, and lastly even less time to master aspects of information processing by developing electrical and electronic communication systems. But dealing with these tipping points is not the only way in which human information processing has set a limit on the speed with which societies could adapt to change. All our means of information processing, including institutions, economies, languages, and ways of life have all coevolved with information processing over considerable periods of time in which humans were able to change their behavior, adapting to innovations and novel circumstances. In that interaction, information flow and information processing have until recently been the main constraint on the speed of coevolution. Human individual learning, and especially collective learning of groups, accelerated only slowly as long as information processing and communication were constrained by human cognition, which also required domestication of resources, innovation, cultural alignment, building institutions, education, and much more, so that larger and larger groups could become interactive. Interestingly, the groups in society that have generally been more receptive to the importance of accelerated information processing were the Church, some of the nation-states, finance, and the military. The Roman Catholic Church had Europe’s first efficient information acquisition and transmission network, and this was followed by those of the major financiers of European princes and kings (e.g., the Fuggers and later the Rothschilds, who made a fortune by being the first to transmit to London the news of the defeat of Napoleon at Waterloo).
But now technology is reducing the temporal dimension of (digital) information processing to (near) zero by disembedding it from humans, transferring it to machines, and collapsing the change in information processing from a slow long-term process into a nearly instantaneous one. This in turn has created the potential for accelerated change, and because more information is processed, an increase in the overall information diversity, which in turn might lead to more change. This is part of the impact of the forty-odd years of exponential technological acceleration in information processing that is summarized in Moore’s law, which states that computer information-processing power doubles on average every eighteen months (Figure 17.1).

Figure 17.1 Moore’s law: logarithmic representation of the increase in computer information-processing power 1970–2016.
The result is, on a linear scale, an explosion in electronic processing power (Figure 17.2; for details see Brynjolfsson & McAfee Reference Brynjolfsson and McAfee2011).
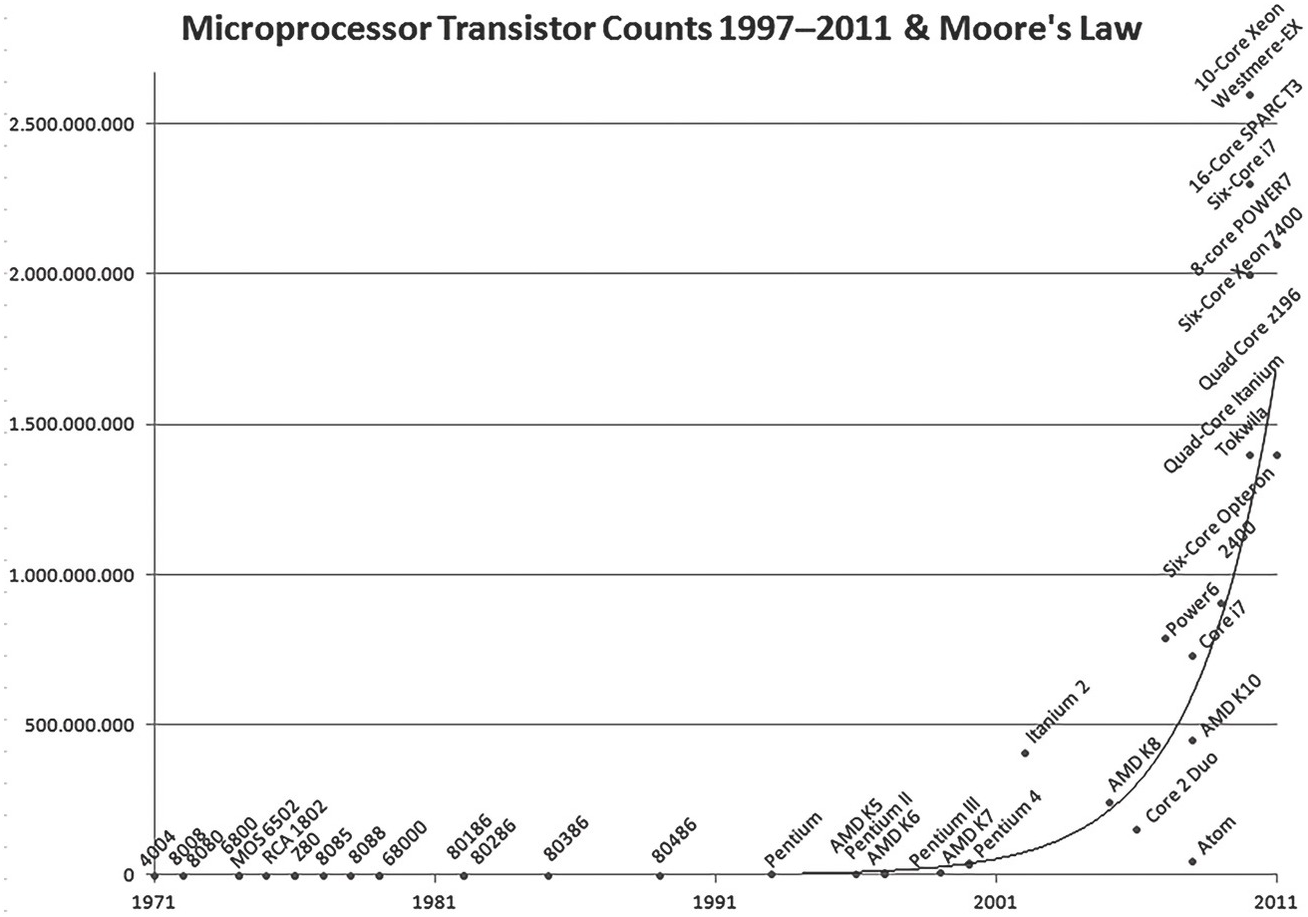
Figure 17.2 Linear representation of Moore’s law – a very rapid explosion of computer information-processing power since around 2006.
But over and beyond this accelerating hardware evolution, the last forty years or so have also seen a very quickly accelerating algorithmic software evolution that has further accelerated our capacity for information processing. Human information processing is no longer able to deal with this acceleration. As roughly calculated by Friedman (Reference Friedman2016), technological generations (periods of relative stability between major changes) last some five to six years, while human information processing takes up to fifteen years to deal with such major changes.
This has resulted in a quickly growing gap between the rapid acceleration in the technology of information processing and the capability of the very large majority (99 percent or more) of human beings to deal with this acceleration. Among the people and machines directly engaged in the coupled information-processing system, we see an explosion in the number of dimensional combinations, and thus of their invention space. The elite group able to cope with this is getting smaller and will continue to decrease as machines overtake specialist knowledge that is based on the mastery of data sets, such as routine legal and medical processes. Those who are not part of this small community will be left behind. The elite group has a greatly enhanced opportunity to accelerate invention, but the adaptation of society as a whole to these inventions is much slower. This situation is profoundly affecting our societies in their capability to absorb change – in ways that have never been observed before. I will come back to the social consequences of that acceleration in Chapter 18. Here I want to outline some of the ways in which the ICT revolution seems to be changing basic assumptions about our social and societal dynamics.
Changing Relationships between Society and Space
To begin with, the ICT revolution is rapidly and fundamentally changing our individual and societal relationships to space and time. Many authors have been noting, for a considerable time, that the world is “getting smaller.” What is going on? On the one hand, since around 1800 the acceleration of our transportation methods (trains, cars, airplanes) has reduced the temporal investment in going to other places and has increased the frequency of such displacements. But the ICT revolution has very rapidly accelerated this development by enabling anyone to share any information immediately all across the world. Cyberwarfare is one way in which this is manifesting itself: interference in the internal dynamics of foreign nation-states at a level until now impossible.
But the consequences of the changing relationship between humans and space go much further. The first anthropologist I know to dedicate some of his work to the profoundly changing role of space and place in the modern world is Marc Augé (Reference Augé1992), whose study is significantly titled Non-lieux: Introduction à une anthropologie de la surmodernité (which may be freely translated as “The absence of place: introduction to the anthropology of hypermodernity”). In particular, Augé focuses on those places where all sense of particularity has been removed so that people move anonymously in them: train stations, airports, etc. One could add many shopping malls in the USA to this category. But Augé draws in part on a more long-standing debate in geography, of which one of the clearest expressions is found in the work of Tuan (Reference Tuan1977) who drills down into how human perception and action create a “place,” a location created by human experience in a wider, non-experienced, space. In emphasizing that in the current world there are locations where that dimension of human experience has been removed to facilitate movement, flow, and anonymity, Augé in my opinion hits on a core aspect of the impact that ICT will have on our lives.
At a very different level, this development is what I think might ultimately undermine the current reliance on defined territories, such as municipalities, provinces, states, and nations. All of these are in effect administrative entities created to deal with localized, multipurpose information processing. They grew from the bottom up, as political and economic power was spatially extended by subsuming smaller entities into larger ones. This is easiest to follow in France, Germany, and Italy, where unification happened as described in Chapter 14. This led, in France in the seventeenth century and in Germany and Italy in the nineteenth, to the creation of the current European nation-states.
Not all power has always been territorially distributed and limited. In Europe, in the Carolingian era, in case of conflict people were not judged by the rules of the location where they found themselves, but by the laws and customs that were traditional for the tribe or people to which they belonged (Faulkner Reference Faulkner2013). The rules and customs of these tribes survive to this day, such as the Lex Baiuwariorum (concerning the Bavarians) and the Lex Francorum (concerning the Franks). For a long time, well into the Renaissance, foreigners visiting or living in one of the Italian cities were subject to the oversight of the head of their “Fondaco” the entrepôt in which they had to store their wares and which they used as a basis for their trading. All members of a nation were required to reside in the Fondaco allotted to them. Thus, again, they were judged not according to the place where they were, but according to the customs of their nation or tribe. The same is true of the concessions established in Shanghai (China) after the Opium Wars (1830–60): these were extraterritorial colonies granted by the Chinese authorities to groups of foreigners belonging to one of the western colonial powers. Territoriality is not a natural state of affairs, but one created by specific circumstances. It is interesting to note in this respect that the USA is one of the few developed countries that maintains some extraterritorial aspects in its legal system, in particular in taxation (US citizens pay tax on their worldwide income), financial transactions (when they are in US dollars, anywhere in the world, the USA assumes that they are subject to US laws), and the fight against corruption (forbidden by US law wherever it occurs).
The question facing us now is whether, as distance is shrunk to the extreme by the ICT revolution and people are increasingly placeless, other, non-territorial modes of organization might emerge. An interesting example of this is the current policy of Estonia, which accepts applications for e-residency from anywhere in the world. E-residency creates an information technological identity in Estonia, which is valid for any transaction in the world but is governed by Estonian rules, without the need for the parties concerned to be resident in the country. Thus, a global virtual entity and community are being created for transactional purposes, in which location no longer plays any role. Were other countries to follow the Estonian example, location would no longer define the laws and statutes governing a person or firm’s transactions; instead, the organization that guarantees the transactions, wherever in the world it is based, would do so. One can imagine many other examples that would give individuals the facility to work globally, not unlike the way in which multinationals have done for a long time, enabled by their financial and legal firepower.
The Impact of ICT on Time and Its Societal Management
The concept of time and its perception constitute a booming research field in psychology, philosophy, and related disciplines, as is clear from the remarkable publications of the International Society for the Study of Time (www.studyoftime.org/), which since 1966 has met once every three years, often in very exclusive locations, but also from numerous papers in a wide range of journals. An interesting summary is presented in Wikipedia (https://en.wikipedia.org/wiki/Time_perception, consulted June 3, 2019). I do not want to explore the many theories and explanations proffered, beyond accepting that time perception is subjective and individual. What interests me here is the evolution of the relationship between the subjective and relative individual perception of time and the societal management of that perception, which requires that people to some extent share, at least for certain purposes such as meeting each other, a sense of time as well as location (but not place in the sense used above). In our society, that is the role of clocks – external, mechanical devices that offer an objective measurement of time, and in doing so control to some extent human behavior. Among the simplest of such devices are sundials, in which a stick projecting a shadow on a calibrated surface indicates time as a function of the path of the sun. It indicates time relatively roughly, at intervals of one hour between calibrations. Another such simple device is the hourglass, in which the flow of water or fine sand between the upper and lower half of the glass is regulated (by defining the size of the hole through which the sand or water moves) so as to empty one half (and fill the other) within a specified amount of time. Its advantage is that it also works at night, which is important on ships, for example. Moreover, the length of the interval can be varied, so that such a device can measure very different units of time. But its disadvantage is that one has to turn the glass every time the flow has stopped, so that the process can begin again.
How have we, in our society, come from such relatively simple, local devices to clocks that measure time in milliseconds or even finer, such as the atomic clocks that now regulate time across the world? Mechanical clocks, introduced in fourteenth-century Europe, had the advantage that they worked day and night, had to be reset less frequently than hourglasses, but initially also had only one indicator calibrating hours. Over the centuries, clock- and watchmakers managed to calibrate time measurement in finer and finer units (minutes, seconds), and related their time measurement also to the motion of the sun, the moon, and certain planets. The core process seems to be that larger and larger communities have delegated their time management to mechanical devices of increasing precision, so that transactions can be managed more and more precisely. In that context, individuals voluntarily suppress their personal, internal experience of time to the societally agreed external time management metrics.
How is the ICT revolution likely to affect this long-term trend? We can imagine this by placing the evolution of time management precision in the context of the wider evolution of our information-processing systems, and in particular the growth of the volume of information that we, as humans, process. The rapid increase in knowledge and the increasing size of networks of interactive people that is concomitant with this increase point to the fact that the amount of information processed by each individual in our societies has grown very rapidly, as has the overall information flow that is managed societally. One wonders whether there might be a dynamic relationship between the size of the flow of information processed by an individual and that individual’s time perception on the other. This would seem to be confirmed by everyday experience: the fact that when an individual is very busy (processing a lot of information) time seems to be flying, whereas if information processing falls below a certain level, time is perceived to be moving very slowly. If we adopt such a relationship as a working hypothesis, then the growing volume of information processed by each individual in society would seem to relate to the increasing subdivision of temporal intervals in individual time perception and in societal temporal management. As the ICT revolution is likely to further increase the volume of information processed individually and societally, this would further reduce the size of units of human time management, possibly to the point that only closer integration between people and computers can deal with it.
Exploding Connectivity among Tools for Thought and Action
The acceleration in digital information processing has changed our relationship to information itself in many ways. To begin with, it becomes much easier to deal with very large volumes of information. This has been captured under the term “big data,” which has been closely tied to the fact that more and cheaper sensors, increased processing capacity, and cloud memory have exponentially inflated the total volume of information that we can collectively process. But a closer look at this increase also shows that the ICT revolution has engendered an even more rapid increase in the connectivity between different dimensions of the information processed and different information signals.
In the technological domain, for example, the number of recombinant innovations (innovations that link existing novelties in different domains) has been increasing for at least forty years (Strumsky & Lobo Reference Strumsky and Lobo2015). But the ubiquitous availability of information from across the globe, and the improvement in ways to search for, and identify, complementary components is accelerating this process even further. It has enabled an important shift in the economics of innovation in our societies, from reliance on originating (rare) innovations that open up a completely new technology) toward reliance on such recombinant innovations (see Brynjolfsson & McAgee Reference Brynjolfsson and McAfee2011).
This also affects our individual and social lives, through such innovations as search engines and social networks. For those who can connect to the Internet, linking disparate pieces of information has become much easier, and this in turn impacts in major ways on our intellectual and social lives. We can keep up with the detail of one another’s lives and can trace the whereabouts and history of people with whom we have lost contact as much as forty or more years ago through social media, and we can quickly explore and link diverse intellectual ideas by using search engines, and thus generate (recombinant) intellectual novelty. Moreover, this capacity can recycle existing information that has thus far been ignored or overlooked.
Reduction of Control over Information Processing
We can now communicate instantly with many people in the world (though about 3 billion are still excluded from this), and at an infinitesimal additional cost in energy, even though the investments in human, financial and material capital to achieve this are very considerable. Those investments have completely changed the human interaction model that has driven societal dynamics up to this point. The fact that anyone can instantly transmit information to anyone, whether one on one, one on many or many on many, and that such information can then be processed individually by all concerned, has created such a huge amount of potential redundancy in the information processing of societies that everyone is instantly informed of everything happening elsewhere on the globe unless they protect themselves against this.
This development is progressively, at least for the moment, transforming information processing without central control (see Chapter 11) into information processing without any control. In distributed and heterarchical information-processing systems there have always been nodes that controlled some of the information processed, whether through enforcement, through institutionalization, through incentives, or otherwise. These nodes were the basis on which current nation-states were managing the large numbers of members of these societies, as well as keeping non-members out. Each of these nodes involved only a limited number of people, and there were barriers to the flow of information between them, whether in the form of spatial isolation, differences in culture, identity, or administrative organization and other means. This enabled such nodes to organize themselves, to maintain their (different) organizations over time, and to align their members on certain basic values, procedures, and institutions.
Currently (the early twenty-first century), the spread in information processing that culminated in the Internet and its many applications is removing such voids and barriers. We are witnessing an explosive increase in horizontal information processing, at all levels of society. This has a wide range of consequences. For example, it has further facilitated the imposition of the values of developed nations on other parts of the world, a process that was (slowly) set in motion in around 1800 CE by the spread of colonial administrations and multinational corporations. In most cases where a preexisting non-western approach to information processing was confronted with the western one, the result has been a fusion at the level of the lowest common denominator – material culture, consumerism, and, even more basically, money. Other domains, and other values, were not so easily integrated, and in many instances differences between cultures have now become a source of friction. This focus on a global lowest common denominator has in many places contributed to the relegation of other values (many of which constitute the deeper meaning of wellbeing) to “noise.”
Blurring the Boundary between Information and Noise
On a more fundamental level, the loss of control over information processing has changed the status of information itself, which is of course dependent on a distinction between signal and noise. Numerous Internet sites that proclaim to provide news can and do launch egregious information that has little or no relationship with commonly experienced social, political, economic, or environmental realities. For many people, it is difficult to separate such information from that provided by trusted institutions that adhere, more or less, to certain collective standards, and at the collective level this is undermining the distinction between signal and noise – and the alignment of people around sets of values as embodied in (sub)cultures at every level.
In due course, this results in changes in the relationship between data and observations on the one hand, and knowledge or understanding on the other. As I emphasized earlier in Chapter 8, information processing is dependent on a reciprocal, interactive, and self-referential relationship between these two (Luhmann Reference Luhmann1989). That interaction is responsible for the distinction between signals and noise. Knowledge or understanding enables someone to interpret patterned data and observations, relating them to ideas, but the fact that the data never completely fit the extant ideas exactly allows the person interpreting them to enhance his or her knowledge and understanding. Over time, this has enabled individual societies to develop, path dependently, different relationships between observations and knowledge or understanding, leading to different cultures. But the reciprocity between phenomena and ideas also facilitates the reverse: to use personal insights or opinions to elaborate presumed data and observations.
In our societies (and our sciences) we have thus far generally adopted the first of these interactions, gaining knowledge and understanding by observing patterns in the realm of phenomena. Now, however, there are people and places on the Internet where the reverse is done, whether deliberately or by default. They present data or factoids that are constructed based on their worldview. In itself this is nothing new – the rumor mill has always, in every society, had this effect. But in the global information society it is often much more difficult, or even impossible, to find out how any piece of information has emerged, and what its relationship to the realm of phenomena is. Over time that could fundamentally undermine the existence of all social institutions, and of the societies that have created them, because it obfuscates the boundaries between the dissipative flows that structure our societal interactions (and give meaning to the information processed by them) and the surrounding stochastic chaos. Individuals would lose their alignment and direction, feel lost and immobilized by indecision, or try to create their own dissipative flow structures based on their own values. Many of these structures are ephemeral, closely aligning insufficient numbers of individuals, and are thus doomed (see Chapter 11), but others gain a wide enough audience to persist and become important in our lives (such as, for example, the Breitbart alt-right website).
A Society’s Value Space Determines Signals and Noise
In the relationship between observations, information, and knowledge or understanding, values play an essential role, as they are the basis of what distinguishes between signal and noise. They are, in effect, intangible instantiations of our information-processing structures, and play an essential role in determining or constraining the path dependency of socioevolutionary trajectories. In that sense, they play a role similar to that of artifacts and the technologies underpinning them.
I will now try to delve a little deeper into their importance. My starting point is that a society’s values are of fundamental importance for its existence. They align its members around certain information and resource flows, enable them to distinguish between signals and noise, and to communicate, collaborate, and express differing opinions. Communication, collaboration, and differences of opinion are all anchored within a set of – usually partly implicit – values that the members of a society share and the relative priorities they accord them. We could call this the society’s value space. I define this neologism as including the total set of dimensions according to which a society attributes value to ideas, actions, institutions, material goods, etc.
Sharing such a value space does not mean that all members of the society have exactly the same conception of these values – it merely means that their conceptions are sufficiently close to facilitate frequent constructive interaction. We could say (with Binford Reference Binford and Leone1965) that people partake in their culture. Their differences are the result of the fact that each person acquires, during his or her lifetime, an individual cognitive system (worldview) that emphasizes certain dimensions of the shared values of a society more than others. Following the extended evolution approach of Laublichler and Renn (Reference Laubichler and Renn2015), one might say that the values of individuals are effectively determined by the socioenvironmental network of which they are a part, and this network, of course, varies for everyone, even if minimally. As a result, all but the smallest social groups that have lived together for a long time in isolation have value differences between their members. (In the term I used in Chapter 11, such societies have more or less heterogeneous information pools.) Those value differences play important roles in a society. For one, they allow individual members or groups within it to create an identity that distinguishes them from other members or groups in the society. That differentiation also drives continued communication and information exchange between individuals. (In the purely theoretical case that all individuals were identical, there would of course be no reason to exchange information, and thus no reason to interact.) Such exchange of information in turn drives societal change and is thus responsible for societies’ coevolution with their environments. Observing value differences between individuals, groups, or societies, for example, can give rise to the desire for change and lead to anticipation, while the exchange of information promotes the emergence of novel ideas and values, and thus stimulates invention and innovation. Partaking in a society’s information exchange necessitates acquiring knowledge of the society’s language, categories, symbol systems, and other aspects of its tools for thought and action, including its organization, its institutions (again, in the widest sense), and its belief systems. As individuals and groups adopt these, in essence they align their ideas among themselves. The interaction between shared values and value differences within a value space is thus responsible for the coherence of groups of individuals within whole societies.
Value differences are also the drivers of material exchanges. Among other things, they can be due to individual or group preferences, to local environmental conditions, to the availability of certain resources, or to the cost (in energy terms) of acquiring them, adapting them to one or more particular (desired) functions, or transporting them. The differences will prompt people to interact, and to exchange both information and material resources and objects. This is the basis of trade, and of our economies.
The Dynamics of Value Spaces
In all societies, values are given according to a wide range of criteria and in a wide range of dimensions, dependent on the networks in which individuals and groups partake. Anthropology can be seen as the study of the different values of different groups, communities, or societies. As such, it focuses on their diversity, and thus on the diversity of worldviews, and has established the fact that, indeed, different societies have very different value spaces. Economic anthropology studies how these different value systems (or value spaces) categorize and accord different values to resources, materials, objects, institutions, and customs, and has developed approaches to explain exchange systems in terms of their value spaces. It has thus emphasized the diversity of exchange systems that results from different worldviews.
When a society is engaged in a growth process, and therefore appropriates more and more matter and energy, it does so by extending its information-processing capacity to more and more people and resources, aligning them but also incorporating in the value space of the society more and more knowledge, so that it can access the necessary matter and energy. It is a corollary, therefore, of any growing society that it expands its value space by innovating, generating new ideas and ways to do things, and thus transforming its organization. Such innovation is fundamental to the survival and growth of any society, path dependently building upon and developing, the core values that anchor the development.
But there are limits to the extent to which the organization can be transformed because another particular aspect of human cognitive systems eventually comes to play a major role. This is the fact that our theories (including our categories and the perceived relations between phenomena) are in effect under-determined by our observations. This is nicely illustrated by Atlan (Reference Atlan1992). He takes as example a set of five traffic lights that can each assume three states (red, orange, green). The total number of states of this system is 35 or 243. But the number of potential connections between these states, which could explain their dynamics, is actually 325, or 847,288,609,443. To decide which of these is the “right” one would require a number of observations close to the number of possibilities – something humans never achieve in real life. The corollary of this phenomenon is that our theories and actions are generally over-determined by those among our prior experiences that we consider relevant. As a result, the trajectories our socioenvironmental systems follow are path dependent in the sense that ‘change is hard’: it is very difficult to deviate from a particular trajectory once one has invested substantive thought and material, institutional, or financial means or efforts in it (let alone emotions). In times of crisis this affects both the speed and the extent of changes that may be implemented.
As I argued in Chapter 9, our current sociocultural and economic structure has been elaborated over time in an interactive process of problem-solving, generating new (unanticipated) problems, solving these problems, encountering new problems, etc.. Structurally, those new elements have been grafted onto an existing information-processing structure every time it was necessary to deal with a challenge.
One sees this most clearly in the inherent development of bureaucracies, but this process is not limited to such organizations – it permeates all we do as humans, including our mental structures. In the course of this process of grafting, certain aspects of our society’s mental and practical functioning are smoothed or rendered more efficient, but because every intervention has unintended consequences, such actions also cause unintended (and often unperceived) inefficiencies that emerge with time, again hindering any efforts to deal efficiently with the dynamics that the system is involved in. The accumulation of such maladaptations causes the structure to become less and less efficient, and thus more and more costly to operate.
Simultaneously, as the structure evolves, it merges functions or otherwise simplifies certain parts of its structure to deal with the most frequently occurring kind of information processing that it is called upon to undertake. The combined effect of these two tendencies is that the information-processing structure becomes more and more robust, focused on fulfilling a precise, well-defined set of functions, and resistant to change. Inevitably, in that process, the mental and organizational structure becomes more and more coherent and narrowly path dependent, and it becomes more and more difficult to add new values to the value space. More and more dimensions that are compatible with the structure of the value space will be discovered and exploited by innovation, but ultimately there comes a moment that this becomes increasingly difficult.
To put it differently, a core value system will inevitably lead to the construction of a set of utility functions. Initially these may be relatively loose, representing diversity within a group. Over time, experience and complexity will expand them but also harden them to increase their efficiency. Continued hardening leads to the dominance of a few terms and an effective loss of dimensionality. Eventually the functions can no longer adequately adapt and become brittle. This is what I mean by reaching the limits of a value space. It results in an important increase in unintended consequences of earlier actions (see Chapter 15), and in a reduction of the potential of the value space to facilitate the implementation of new inventions.
This in turn creates an increasing incompatibility of the value space with the environment it is created to deal with. This leads to a tipping point, when the existing value space is opened up, so that the definitions of categories and theories, but also of institutions and customs, are weakened by the reduction of their dimensionalities. They can thus ultimately be destroyed or replaced by other structures that constitute a novel value space.1
Wealth as the Predominant Global Metric
From my anthropological perspective, it is astonishing to see the extent to which in our own western culture the dimensionality of the value space has shrunk, leading to an increasing focus on productivity, gross domestic product (GDP), and technology. This has emerged since World War II under the impact of the growing power and influence of free market economics worldwide.
I think this development must be emphasized as an important corollary of globalization. The process began at the time of colonization and has intensified in phases. The first of these began in around 1800 when the European trading colonies became occupied territories producing raw materials for their occupying nations. Over the past seventy years, what we now call globalization further reduced the dimensionality of metrics (and awareness) of human wellbeing as the counterpart of the global growth of interaction between groups and populations from different backgrounds, as it reduced the total information-processing capacity needed to align these different populations. Different cultures and populations, with different values and customs, were progressively aligned along one single dimension, their lowest common denominator: wealth.
Without that reduction in dimensionality, globalization would not have been possible. Imagine that we had to implement global information processing based on the many, many dimensions that different cultures considered important before globalization took hold. That would have overwhelmed our global information-processing system completely. We would not have been able to isolate the relevant dimensions on which to base interaction and around which to create alignment.
Instead, as part of globalization, different populations were slowly but surely accustomed to considering a narrowing set of dimensions as important for them, centered around the wealth dimension, this being the one by which they could compare themselves and transact exchanges. The impact of this is nicely illustrated by Maruyama (Reference Maruyama1963, Reference Maruyama1977, Reference Maruyama1980): “If,” he once told me, “one reduces the dimensionality of a system to one, people’s need to differentiate themselves will be reduced to that dimension. That explains why, on a highway, people tend to distinguish themselves in the speed with which they drive.”
Wealth and its metrics, notably GDP, have thus become a dominant dimension of interactive information processing between many different individuals, groups, societies, and cultures around the globe. Although other dimensions are still important, such as religion, community solidarity, art, and culture, there is an increasing tendency toward a reduction in the dimensionality of value sets. Wealth is becoming in certain circles the most important common denominator. In the process, the holistic basis of social interaction is reduced. Fewer and fewer other dimensions of human wellbeing are generally considered worth thinking about, except among smaller, focused subsets of societies. This in turn has moved our global societies toward an increased emphasis on productivity, and led to the over-exploitation of the natural capital of the environment, as well as of the human capital of many regions and groups. The ICT revolution has accelerated and exacerbated this trend by according control over information processing to a smaller and smaller proportion of humanity, giving it the opportunity to accumulate riches and leave the rest of the population behind. The full impact of this development was brought home to me in 2013, when I gave a lecture on sustainability for a business audience in Tempe, Arizona. The speaker after me had only one message: “We need to replace family life with corporate life!”
This trend also has direct implications for the concept of fairness in negotiations. In many societies, in order to count as moral or fair, a reason, principle, or posture toward the world must traditionally reflect a concern with the (multidimensional) wellbeing of the group generally; that is, a concern with the wellbeing of everyone (McMahon Reference McMahon2010). But increasingly, fairness in reciprocal arrangements has become monetized, so that money and wealth are the medium through which equity in reciprocal relations is expressed. As a result, the degree to which monetization of reciprocal concerns – for example, the fact that insurance corporations calculate the value of human life – has impinged on our world is startling.
We saw in Chapter 16 that another negative consequence of this trend is that it has skewed the whole global value system toward increasing wealth differentials between the haves and the have-nots. Initially, this was not very noticeable, because limited communication between these groups constrained the extent to which people could compare themselves with others in these terms. As the growing wealth differences are now more and more effectively communicated (by television, tourism, and now the Internet), this creates new challenges and conflicts. Increasing wealth discrepancy is rapidly becoming a societal planetary boundary alongside the demographic explosion (from 2 to almost 7 billion people in sixty years), and the acceleration of information processing and the changes it entails.
Our Western Value Space seems to Be Reaching a Boundary
Did shrinking the dimensionality of our society’s value space contribute to the reduction in the rate of return on investment in innovation that we saw in Chapter 16? That is difficult to determine, but if that is the case it could in turn explain why more and more available funds are being diverted from the productive to the speculative sector. In macroeconomic terms, it might even to some extent explain the leveling off of the growth of our (western) economies that has been reinstated on the scientific agenda by Summers (Reference Summers2016).
Importantly, at a more fundamental level, the progressive closure of our value space and the increase in unanticipated consequences of our actions seems to be related to an observable shift from long-term strategic thinking to short-term tactical thinking. It has shifted the focus of our collective efforts to the immediate, and thus causes us to be caught in a kind of historical myopia that limits and biases our understanding of the second order dynamics that have driven us to this point, as well as our perspective on potential ways to find an exit from the current dilemma. Thus, we are looking for solutions within our current given structure, rather than stepping out of that structure and thinking outside the box.
This is of particular relevance to economics – with policy the most important lever through which one may attempt to change our societal dynamics. In this community there is an emphasis on continuity, rather than the facilitation of change at a time when digital information processing is accelerating change in all aspects of our societies’ dynamics. Much of the macroeconomics community in particular lacks a conceptual (and mathematical) tool to conceive of endogenous, discontinuous change. As became disconcertingly clear at the beginning of the recent financial crisis (2007), the dynamic equilibrium models that link supply and demand are traditionally formulated in terms of differential equations and therefore focus on marginal changes of aggregate measures. Therefore they cannot help us to anticipate tipping points or help us think about making structural changes in our current socioeconomic system.
One potential contribution to overcoming this would be to develop the mathematics of discontinuous change, in which supply and demand are not balanced and the market does not always work best. This would open the way for a less productivity- and efficiency-based perspective on economics, which could include value dimensions other than cost and price, and thereby enable a new expansion of our existing value space.
Introduction
In this chapter, I will place the information and communications technology (ICT) revolution and some of the changing patterns of information processing and communication in our current societies in their historical and socioeconomic context. Considering these longer-term developments must, in my opinion, be an integral part of any attempt to consider the socioenvironmental transition needed to mitigate or (in part, maybe) avoid exceeding too many of the planetary societal and environmental boundaries and causing a disintegration of our current societies.
To devise ways to avoid that disintegration of our current societies might appear to some as impossible as trying to avoid, in 500 CE, the disintegration of the Roman Empire. The rationale for avoiding such a disintegration in our own future is without doubt exceedingly difficult to construct, particularly from a complex systems point of view. Yet that is exactly what we are being urged to do, both as scientists and as citizens. It seems essential to attain some form of sustainability. The crucial questions are whether we love our current societies enough to want to try; and if so whether we have the tools to do it and which changes we are willing to accept.
Answering these positively implies we have to think outside the box, and in this chapter, and Chapters 19 and 20, I will make a beginning with that. In doing so, not being a specialist in either information technology or economics, I will lean heavily on others, in particular Friedman (Reference Friedman2016), Brynjolfsson and McAfee (Reference Brynjolfsson and McAfee2011), Haass (Reference Haass2017), Ito and Howe (Reference Ito and Howe2016), and a range of other authors whose work underpins or relates to their approaches, without necessarily referring to them in each instance. Others will be cited as I proceed.
My main thesis is that the digital revolution has fundamentally accelerated a number of longer-term ongoing dynamic trends in our societies, with both positive and negative effects for different parts of our communities. These new dynamics must therefore be taken into consideration in trying to find a way out of the current sustainability conundrum.
The Race of the Red Queen
To begin with, we have to look again at the impact of the Industrial Revolution, and notably the virtually unlimited availability of relatively cheap energy. As mentioned in Chapter 14, in around 1800 a combination of mining fossil energy and inventing the equipment to exploit it set in motion a long-term trend in which it became ever cheaper (in energy terms) to innovate, lifting a major constraint on innovation and enlarging our knowledge and the value space that maintained society in a more or less coherent form. The process that emerged, following the feedback loop responsible for the coevolution of population, knowledge, and cognition driven by innovation, engendered multiple profound systemic changes, institutional and financial for example, ultimately improving overall health, wealth, knowledge, and resource use, but only in a limited number of places on Earth, where the social conditions were favorable.
A second transition began in the early twentieth century, when mass-production met the newly emerging field of psychology as applied to advertising, triggering a fundamental change in the development of capitalism, toward ever more competition on price, quality, and novelty by exploiting the potential of advertising. The focus of many industries shifted toward mass production and mass marketing, and that drove companies to lower prices further and further, increasing productivity, lowering cost, and gaining larger and larger parts of their markets. Ultimately this produced the consumerist society that we currently see in many parts of the world.
From our theoretical perspective, that development is part of the expansion of the value space necessary to keep a rapidly growing population interested in being part of the European (and later western) socioeconomic system. The competition involved drove innumerable inventions and innovations in all domains of our society, and in the process mechanized a large part of our daily life and its information-processing by creating – even before the impact of information technology – a very large array of technologies, artifacts, procedures, and institutions that were dedicated to particular kinds of tasks. This development began the acceleration of innovation in western societies that we are currently experiencing.
The ICT revolution is in this sense nothing new. It removed a major remaining constraint on innovation by enabling computational information-processing. It is (for the moment) the culmination of a process that began when humans took up the challenge of creating artifacts. But the feedback loops between knowledge, innovation, population increase, and resource use have accelerated to the point that one of my colleagues referred in this context to “The Race of the Red Queen” (Carroll Reference Carroll1999, chapter 2). We have to innovate faster and faster simply to keep the current socioeconomic dynamics more or less on track. As part of that process, major multinational corporations have grown in size to the point that their turnover now equals that of small and medium-sized nation-states, and that in turn has enabled these corporations to cross the borders of many such states and insert themselves in their socioeconomic fabric, creating a powerful transnational economic and political web. I discussed some unintended aspects of this process in Chapter 15.
The Growing Dissolution of Our Global Governance System
One of the corollaries of the growing extent and power of corporations is the dissolution of the power of nation-states when faced with a very different, often equally powerful, kind of player. But there, too, the dynamic is partly a longer-term one, independent of the multinationals or the ICT revolution.
Political scientists and diplomats, such as Bull (Reference Bull1977), Kissinger (Reference Kissinger2014), and Haass (Reference Haass2017), describe a longer-term development that passed a tipping point in 1991, just after the Cold War. To understand this development, it is relevant to go back a further few centuries, to the Treaty of Westphalia (1648) and the Congress of Vienna (1815), which laid the foundations for the current organization of the European nation-states as well as for the general philosophy that shaped it. These two events, and particularly the Treaty of Westphalia, had many consequences that are often overlooked. They created, for example, the conditions for the development of large-scale industry and business by laying the foundations for national systems of justice that could arbitrate in conflicts.
Up to and including the period of the Cold War (1945–1991), Haass argues, relations between nation-states were governed by a set of rules that were more or less generally accepted. Foremost among them is the idea that governments are sovereign, free to act as they see fit within their territories (states), and that other governments accept this without interference. International political history is about the interaction between this principle and the moments that it led to disagreement, friction, and aggression. Such moments were very often triggered within the nation-states concerned, and it is fundamental for our understanding to keep that interaction between processes within and between nation-states in mind. Just as fundamental is the fact that such a system would not have worked without a degree of balance of power between states. Together, the rules and the balance of power created a kind of order that governed Europe throughout much of the eighteenth and nineteenth centuries, but collapsed in the twentieth century when individual states started pushing the system out of balance, leading to the two world wars and the collapse of several major empires (Russia, the Ottoman Empire, and the Austro-Hungarian Empire after World War I, and the British, Dutch, and French (colonial) empires after World War II). In the process, the “rules” that had governed the interactions between states were sacrificed, presumably without regrets.
After World War II, all efforts on both sides of the Atlantic (i.e. the “Western world”) were directed toward reestablishing stability, reinforced by institutions such as the United Nations and its many agencies, the International Monetary Fund, the World Bank and the Development Banks for the Americas and Asia, but also the International Court of Justice and later the European Coal and Steel Community (which evolved into the European Community and the European Union, EU), as well as the General Agreement on Tariffs and Trade (GATT) and the World Trade Organization (WTO). Whether miraculously or not, this effort ensured the survival of a more or less stable geopolitical order for another forty years, mainly thanks to the Cold War between the USSR and the USA, including the threat of so-called mutual assured destruction and the interaction between the North Atlantic Treaty Organization and the Warsaw Pact. With the collapse of the USSR, this order began to fall apart, both between states and within them. As a result, since about 1990, we have seen a growing dissolution of the power and coherence of nation-states.
What happened after the disintegration of the Soviet Union? How did that event trigger changes that destabilized the global order? What were the underlying dynamics, and why is it that on the surface this destabilization was not immediately tangible?
First of all, the collapse of the USSR led to readjustments in the relationships between the USA, Russia, and China, with Russia taking a step down and China one or more steps up on the global power scene.1 These adjustments of course engendered numerous tensions, but Haass argues (Reference Haass2017) convincingly that in circumstances where the US military completely dominated the scene, competitive activity shifted to the economic sphere, where the BRICS nations in particular (Brazil, Russia, India, China, South Africa), but other nations as well, focused on internal economic development. That in turn required economic interdependence between nations, including the fostering of closer and closer trading relationships. Global increases in wealth became the major goal, rather than territorial conquest; that was where win-win opportunities emerged. As a result, much of the friction between states also shifted to the economic domain, where they could more or less peacefully be negotiated in the context of the GATT, its successor the WTO, and a number of bilateral and multilateral trade agreements.
With the growing interaction and interdependency between nations, the relationship between domestic and international dynamics came to the fore, and this created other potential points of friction, as it increasingly eroded the basis of the Westphalia and Vienna systems – the principle that no nation should interfere in the internal dynamics of other nations. At the same time, many other players, not just large multinational corporations, became involved in international relations, such as the major international non-governmental organizations. They had both ideals and networks within many states, and therefore became players that crossed borders. This hugely complicated the diplomatic system, and helped transform it from a bipolar to a multipolar one as more and more parties gained the wealth and self-confidence to play their own roles.
We see this in the emergence of a number of regional hotspots, such as the Near and Middle East (including parts of North Africa), South Asia (India, Kashmir, Pakistan, and Afghanistan), East Asia (China, the Koreas, Japan, and more recently other countries bordering the East and South China Seas), East Africa (Ethiopia, Somalia and Sudan), as well as Eastern Europe (the Balkans and now Ukraine). In each of these, competition between important regional players led to (potentially) explosive tensions of a mixed economic, nationalist, religious, ethnic, and tribal nature. In some cases these were aggravated by attempts to shape societies along western, democratic, lines where that was clearly highly unlikely to succeed, such as in Iraq.
What was the role of ICT in this transformation? Even before the emergence of the Internet, the ease with which telecommunications such as press, radio, television, and now cellphones crosses boundaries, as well as – in certain areas – the huge explosion in tourism, acquainted people with lifestyles they had often not even dreamt of, and thus created visions and desires that were in many ways unattainable in a short time frame because of their geographic, economic, and social situation. This inevitably accelerated the emergence of many tensions, on the one hand facilitating globalization and on the other generating substantive reactions against it. In my own work in Southern Europe this became evident as soon as we realized that much of the increase in unused, eroded, surfaces was not so much due to environmental factors as it was due to the desire of the traditional farmers in those areas to adopt a different, urban lifestyle (van der Leeuw 1998). The recent ICT revolution, by facilitating horizontal communication across regions, borders, social classes, and various other divides has further accelerated this tendency.
The Spectacularization of Experience
Within individual states, radio and television are among the earlier precursors of full information technology, driven by electronic transmission of information. Their impact on communications had some dimensions that I think are of relevance here. The first of these is that they enabled one-to-many communication, thereby providing a powerful tool to control values and opinions, and thus to align very large numbers of people, many more than could have been reached until then. For one, people did not have to be literate to peruse them, and secondly their visual nature greatly enhanced their impact. In their imagery, they continued a tradition that had its origins in photography and film, greatly enhancing their efficiency because these were now detached from any material substrate.
Another dimension of their spread is the fact that they hugely widened people’s capacity to listen to and see fiction, thus enabling people to escape from their everyday existence and live, albeit for a short moment, in a fantasy world.
An early visionary of the challenges this would pose in our societies was Guy Debord, a French author who as early as 1967 argued that “All that once was directly lived has become mere representation” (Debord Reference Debord1967, thesis 1) and that the history of social life can be understood as “the decline of being into having, and having into merely appearing” (Debord Reference Debord1967, thesis 17). In doing so, he pointed to the fact that these media promoted confusing sincerity with authenticity, and substituting emotional images for emotions.
Initially film, radio, and television had as their main goal making people laugh, feel happy, or at least forget their sorrows by watching song and dance, or experiencing a wealthier world in which dramas always end happily. But as the tele-amusement industry developed, it slowly but surely began to address more complicated situations and a wider range of different worlds, some of which were frightening, dystopian, or completely unrealistic. Altogether, this tendency habituated more and more people to live, at least in part, in a fantasy world – a world, moreover, where the consequences of one’s decisions and actions could be avoided simply by switching off the electricity.
Economically, this trend was driven by the need to advertise more and more, to create the demand for new products. Over the past half-century or so, this combination of economic necessity and artistic potential has thus led to a blurring of the boundaries between fantasy and reality, as is evidenced in the infomercials that were deliberately intended to associate those two worlds, initially principally in the minds of small children watching early-morning television to allow their parents a couple of hours of rest, but increasingly also by adults who were watching later in the day. More recently this trend has come full circle in the “reality shows” on television that attempt to imitate real-life situations in the media that are traditionally devoted to the world of fantasy. The computer games industry is in some ways a continuation of this trend, but with one major difference: the opportunity to escape into a fantasy world is no longer centrally controlled, nor is the way in which individuals interact with the fantasies thus created.
In that sense, this recent development is part of the overall trend at individuation that ICT has enabled, which many people experience as freedom without realizing that, when an unforeseen calamity occurs, they are dependent on each other and the communities in which they function – and that they thus must operate within the norms of their community to be able to call upon its support when they need it.
Another aspect of this trend is the emergence of the twenty-four-hour news cycle, which presents major events in an abbreviated, simplified, “bite-size” form that is easily digestible. Initiated by CNN in the 1980s, it has now spread around the world and throughout electronic media. The setup of most websites follows the same pattern, leaving it up to the user/reader whether he or she is ready to digest the full message or only a highly simplified form of it, potentially leaving much to the peruser’s fantasy.
To summarize, and again referring to Debord, everything that people have thus far experienced directly – in their relations with the natural and social world – has been analyzed, chewed upon, and converted to images. In the process, many of the hidden dimensions of reality have been removed, so that the consumer is presented with a simplified image that has been created according to the vision of the originator of the images concerned. This process has created a growing distance between “real life” experiences and Debord’s “spectacularized” experiences.2
But there has also occurred another trend, driven by the interaction between the media and the capitalist system based on competition. Since World War II, we have seen the proliferation of different sources of mass communication. In the 1950s and 1960s, each country had just a few television channels. In many countries, these were controlled by government (France and the UK, for example), in others by private organizations with different religious perspectives (the Netherlands), and in yet others by private for-profit organizations (Italy, the USA). Beginning in the 1980s the number of sources of information multiplied, initially by means of cable and satellite TV, leading to a situation in which people could choose between hundreds of channels, many of which were dedicated to a particular kind of information (geography, history, mystery, science fiction, etc.). In the 2000s this proliferation of sources was further facilitated by the emergence of websites. In effect, everyone can now be a source of information for everyone else, on a global scale.
Although this process seems at first sight to be innocuous and directed at providing freedom of information to everyone, it has in recent years contributed to the fragmentation of our worldview and our society by creating and reinforcing different visions of just about any socioeconomic or political issue. In a later section, I will return to the social significance of this phenomenon. For the moment, suffice it to signal that this is another element in the process of effacing the alignment of societies’ values, and the distinction between signal and noise that I mentioned in Chapter 17.
Democracy under Pressure
In many developed countries, at least since World War II, the basis of the governance system has been democratic – the population periodically elects representatives who constitute the government. These systems differ. In Switzerland, for example, the government must consult the population by referendum on every important issue. In most other western countries, elections determine the composition and the power to be distributed among a number of parties, ranging from two (in the USA), to three (the UK), or several more of which only the top two have real impact (France), or up to ten or fifteen who then form a coalition that governs according to a compact (The Netherlands). In essence, whatever the system, and whatever the level at which democracy is practiced, individuals delegate their political power to an elected elite, who make decisions for a limited amount of time.
This system works well, once it is institutionalized, as long as the internal tensions in the society are such that they can be worked through by discussion, debate, or vote. If this is not the case, the system is in trouble. I would argue that over the last sixty years or so, in most Western countries, this has worked in part because the inhabitants experienced an increase in comfort and wealth. There seems to have been a connection between the adequate functioning of the democratic system over that period and the rise of the consumer society, including the huge increases in use of raw materials, energy, and human capital not only in the countries concerned, but also in those other parts of the world from which the natural and human resources were extracted to serve these “developed” countries.
This relationship between democracy and exceeding planetary boundaries clearly needs to be investigated and taken into account when looking for ways to deal with our sustainability challenges. Randers (Reference Randers2012) and others have suggested that sustainability is difficult to achieve for democracies because when they have to deal with conflicting interests, decision-making is very controversial and complex. This raises the question whether one could implement a democratic system that did not have an expanding consumerist context.
But there is also an information-processing aspect to the functioning of our democracies: the fact that information flows were to some extent controlled through the media, which limited the diversity of opinions among the population of a country or smaller democratic unit. I referred to this briefly in the last section. The ICT revolution changed that fundamentally, by facilitating communications bypassing any state-related institutions and media. As a result, the Internet is now threatening our democratic institutions, and that threat is accentuated by growing wealth differentials inside and across regions and countries. Edsall (Reference Edsall2017) recently drew attention to this phenomenon, quoting Hindman (Reference Hindman2008) as saying that the USA may be “transitioning towards a hybrid democratic regime which would keep the trappings of democracy, including seemingly free elections, while leaders would control the election process, the media and the scope of permissible debate by electronic means.”
We are seeing this in China, Russia, Turkey, Hungary, and other countries. The recent Brexit referendum and election campaigns in Europe and the USA also demonstrate that the mainstream media and political party organizations have lost much of their power. The vacuum has been filled by populist organizations that find their base in social networks, such as the Five Star movement in Italy or the alt-right movement around the Breitbart website in the USA. Samuel Issacharoff, an authority in this domain, is quoted by Edsall (Reference Edsall2017) as pointing to four processes already going on before the impact of the ICT revolution:
The current moment of democratic uncertainty draws from four central institutional challenges, each one a compromise of how democracy was consolidated over the past few centuries. First, the accelerated decline of political parties and other institutional forms of engagement; second, the weakness of the legislative branches; third, the loss of a sense of social cohesion; and fourth, the decline in democratic state competence. […] Technology has overtaken one of the basic functions you needed political parties for in the past, communication with voters, […] Social media has changed all of that; candidates now have direct access through email, blogs and Twitter, along with Facebook, Instagram, Snapchat and other platforms.
But the decay of the role of political parties and the traditional media is only one part of the story. As I write this (early 2017), one of the most salient implications of the information revolution that has suddenly come to light is the issue of “alternative truths,” as highlighted in the Brexit and Trump campaigns. This seems to be a direct consequence of the multiplication of sources of information, including websites, television stations, and radio talk shows, as well as of the blurring of the boundary between signal and noise. We have seen that the distinction between the latter two has a direct relationship to the value space of a society, group, or culture. As subsets of the members of that society or group increasingly focus on a narrow set of sources for their information, this leads to different conceptions of truth, signal, and information, in effect fracturing the overall alignment of a society on a specific value space. Hence, as so elegantly formulated by one of President Trump’s team (Kelly-Anne Conway), “We [i.e. the Trump team] merely offer alternative truths” (in an interview on NBC television’s “Meet the Press” in the USA on January 22, 2017). It is not surprising therefore that the Trump team considers the media their principal opposition. For them, documenting and corroborating “facts” is no longer a prerequisite for presenting them; the conviction and charisma of the person who presents them, coupled with reference to a particular subset of information sources, appears to be enough. If unchecked, this sets in motion a tendency toward fragmentation and polarization of a society around different categories and values. (This phenomenon is currently summarized under the idea that people live in different information bubbles).
This also raises a question about whether the tendencies presented in the last section, including the spread of interactive computer games, have had an effect on the capacity of the younger generations to distinguish between reality and fantasy. Would living for many hours a day in artificial worlds where the interaction between people’s decisions and actions on the one hand and their consequences on the other is artificially enabled and constrained favor a reduction in the capacity to distinguish between fiction and reality? And finally, we need to consider the impact of globalization on our democracies. Recently, Reno (Reference Reno2017) expressed this as follows:
Globalism poses a threat to the future of democracy because it disenfranchises the vast majority and empowers a technocratic elite. It’s a telling paradox that the most ardent supporters of a “borderless world” live in gated communities and channel their children toward a narrow set of elite educational institutions with stiff admissions standards that do the work of “border control.” The airport executive lounges are not open and inclusive.
In effect, here we see the result of the fact that a small, and now increasingly narrow, elite in our societies has been able to make the transition toward a (partly ICT-based) globalized society, whereas a very large majority of citizens worldwide has been left behind, focused on their local community and thus resistant to expanding the spatial extent of their identity to communities elsewhere. Here again, the roots of one of the ICT-accelerated processes have been laid long before, in our case in the form of democratic systems in which a small bourgeoisie directed the society as a whole. But the ICT revolution is exacerbating the inherent tension between the governing and the governed by the rapid acceleration of information processing itself.
The Deconstruction of Communities
Now let us look at the next scalar level – that of communities. To introduce this topic, I will go back to a series of classic works in the anthropological and economic literature. First are those of Karl Polanyi, the anthropologist who first developed the substantivist approach to economic anthropology. According to Polanyi, the modern market-driven society was not an inevitable stage in the evolution of western societies, but was planned. He came to this conclusion because he did not see economics as a subject closed off from other fields of enquiry. He saw economic and social dynamics as inherently linked, and noted a major transformation in their relationship as part of the Industrial Revolution. In his The Great Transformation (Reference Polanyi1944, 2001) he makes the distinction between “markets” as an auxiliary tool for ease of exchange of goods in many small-scale societies – in which, generally, exchange is a mechanism to maintain social relations – on the one hand and “market societies” on the other, which are those societies in which markets are the paramount institution for the exchange of goods through price mechanisms, to the point that the substance of society itself becomes subject to the laws of the market. According to Polanyi, roughly from the 1830s in the UK the market began to subordinate the substance of society itself to the laws of the market’s “invisible hand.” This led to the separation of society into economic and political realms, and the subjection of societies’ dynamics and requirements to those of money and the economy. This, he argues, resulted in massive social dislocation and spontaneous moves by society to protect itself. In effect, Polanyi argues that once the “free” market is disembedded from the fabric of society, social protectionism is society’s natural response, a spontaneous reaction to the social dislocation imposed by an unrestrained “free” market. To rephrase this in terms I introduced in Chapter 16, it is in the emergence and evolution of the free market that a financial, unidimensional logic was progressively disembedded from the wider, multidimensional, sociocultural logic. Similar arguments have been made by such economists as Keynes (Reference Keynes1930) and Frieden (Reference Frieden2006).3
David Graeber, another economic anthropologist, builds upon these ideas (which were anathema to most macroeconomists, but found wide support in anthropology, sociology, and related disciplines) in his researches into the theory of value (which I referred to in Chapter 16). Graeber (Reference Graeber2001) contrasts the multidimensional conception of value among many small-scale societies (Tobrianders, Malagasy, Kwakiutl, Iroquois) with the unidimensional conception of value in economics in the modern world. In his opinion, “The market was a creation of governments and has always remained so” (Graeber Reference Graeber2001,10; Mazzucato Reference Mazzucato2015). Modern economics, in its emphasis on modeling the value-driven behavior of the (modern) individual, “…relies on trying to make anything that smacks of “society” disappear. But even if one does manage to reduce every social relation to things […] one is still left to puzzle over why individuals feel some objects will afford them more pleasure than others.” (Graeber Reference Graeber2001, 9)
It is implicit in this argument that the formalist economists’ approach, which only distinguishes individuals and populations, cannot grasp the concept of value because values are accorded according to the social networks in which people participate. We have seen earlier that “value” is a social creation, shaped by the social context of individuals – the ideas shared by the network(s) in which an individual is active. It is therefore generally determined at a different scale than that of the whole population. To include values in our approach, we must move from a population perspective, which treats individuals as statistical units in a population, to an organization perspective, in which the different configurations of relationships between individuals are taken into account (Lane et al. Reference Lane, Maxfield, Read, van der Leeuw, Lane, Pumain, van der Leeuw and West2009), as can be done in a multilayered network approach to society (White & Johansen 2004; White Reference White, Lane, Pumain, van der Leeuw and West2009).
Ronaldo Munck (Reference Munck2004) contributes the third step in this argument when he posits that globalization is at the root of the destruction of social communities as it undermines the multidimensional spectrum of values that keep communities together. In doing so he echoes Polanyi’s original assertion that it was the imposition of one-dimensional economic thinking in finance, in the form of the gold standard, that ultimately drove nations to competition, colonization, an arms race in Europe, and finally the world wars. Munck sees globalization as an extension of the attempt at financial global unification that drove the imposition of the gold standard to a number of other economic domains. We are thus reminded of Maruyama’s statement (Chapter 16) that on a highway cars can only compete in terms of speed. If wealth is the dominant standard, competition between individuals, groups, and nations tends to be measured mainly in wealth.
But we have to emphasize that, important as it is, the slide toward wealth as an increasingly dominant standard by which people, groups, and nations measure their performance and identity is only one trend among many others. The others have of course also been in existence for a very long time, and continue to play an important role in our societies through the many other values that societies and individuals embrace. Yet they have in some way been eclipsed in public attention by economic values. The important question is whether this is temporary or will be of longer duration. However this may be, an important task ahead is to look more closely into the noneconomic dimensions of the dynamics that are driving societies.
The Transformation of Globalization
In an interesting book, Richard Baldwin (2017) links the transformations in globalization to changes in the movement of goods, information, and people. In the 1880s globalization first emerged, he argues, in the form of (increasingly bulk) trade in raw materials and industrial goods owing to the availability of novel, relatively cheap, and dependable modes of transportation (railroads and steamships). The resulting fall in trade cost enabled the geographic separation of production and consumption, leading to the global expansion of markets while industry grew locally. This fueled a feedback loop of trade, industrialization, and growth that boosted the western (mechanizing) nations’ economies in contrast to the economies of other parts of the world. It is the source of the west’s huge wealth and the income differences between the north and the south.
From the 1970s, the West’s share of global manufacturing declined, and this trend accelerated in the 1990s. Baldwin points to the fact that owing to the ICT revolution there was a sudden decrease in the cost of moving information, and he argues that the ensuing increased facility to coordinate complex activities from a distance facilitated the spread of production into global supply chains. In the process, manufacturing was outsourced from the developed to the developing countries. As this involved the transfer of important know-how, it led to what Baldwin (2017, 5) calls “the global value chain revolution,” redefining the international boundaries of knowledge. In particular, it closely linked developed nations’ know-how with developing nations’ labor into the core of commercial competition and moved industrial organization from a territorial to a network organization.
Baldwin attributes the fact that this shift remained confined to six developing nations (China, Korea, India, Poland, Indonesia, and Thailand) to the still high cost of moving people, and in particular the time-cost of moving relatively well-paid personnel. By concentrating production in a few low-wage countries the cost of moving personnel could be contained, and the more so if the new production countries were relatively close to the older ones. This reorganization led to an industrial expansion that created a huge demand for raw materials and thus caused rapid increases in income and wealth both in the new production countries and in the countries that provided the raw materials.
In the future, Baldwin argues, facilitating people movement by promoting the virtual presence of people at a distance, through improved telepresence and telerobotics technologies, could cause a third fundamental shift, leading to virtual immigration and telecontrol of production, thus further blurring the spatial boundaries between nations. The potential consequences of such a shift are yet to be examined.
The Emergence of the Developing World
I also need to point here to the impact of the emergence of the developing nations on the globalized scene. They are undergoing many of the developments referred to in this chapter without the institutional framework within which they are occurring in the developed world.
Until the 1980s, in most of the developing world, the political and economic systems were still predominantly neocolonial, geared toward furthering the interests of the colonial powers on which the countries involved had depended (Nederveen Pieterse Reference Nederveen Pieterse1989). But from the 1990s several of these countries, profiting from the new wave of globalization just mentioned, could develop their respective economies in ways that challenged the hegemony of their colonial masters and the post-World War II international agencies. This led to the emergence of a wide range of different postcolonial development strategies, based on the natural and social capital of the countries themselves.
East Asia (Japan, South Korea, the Philippines, China, now also Vietnam) was the earliest region in which this happened, followed by some countries in Latin America (Mexico, Brazil, Chile, Venezuela), South Asia (India), and finally Africa (in particular Nigeria and South Africa). This transition can profitably be looked at from the perspective developed by Wallerstein (Reference Wallerstein1974–1989), referred to in Chapter 14. Some countries, in which for political reasons these developments began first (Japan, South Korea), have managed to join the exclusive club of developed nations, while others are on the way (China, Brazil, Turkey, South Africa, Indonesia).
It is clearly outside the scope of this section to go into any detail on these developments, but from the 2000s ICT played an important role in them, and I will try to briefly summarize some of the factors favoring that role, as well as some of the difficulties the development of ICT encounters in these countries. A first difference with the developed world is that whereas wireless telecom and web markets in the developed part of the world are approaching saturation, this is not the case in developing countries. In effect, 2014 data show that the developing countries substantively lag behind ICT impacts in the developed world.
Part of this difference is a question of investment capacity and national choice (wireless or wired), but an important other aspect is the lack of ability to use the opportunities offered by ICT. Thus, in large parts of Africa, notably, mobile phones are mainly used as a means of telephoning and text messaging, rather than to access the web. This difference in use of ICT is particularly tangible between cities and the countryside, as a result of linguistic and educational differences. According to a report to the European Parliament (STOA 2015), the economic and social returns of ICT in developed and developing countries alike are high, as telecommunications allow a mitigation of the negative effects of dysfunctional markets. Countries with good information technology (IT) infrastructures and abundant IT-skilled labor forces benefit most from the ICT revolution in terms of increased national production, export, domestic and foreign investment, and new employment opportunities.
However, there seems to be insufficient evidence that such wealth creation is contributing to poverty reduction. Here, technical, political, educational, and cultural factors seem to play a role. For one, as long as mobile phone use is limited to communication, it does not necessarily move people out of poverty (STOA 2015). Access to the mobile Internet, on the other hand, does make a difference. Evidence shows that high penetration of modern ICT is an effective driver of socioeconomic development, but this is only the case in a very limited number of countries (e.g., Tunisia, South Africa). Moreover, Africa has the largest number of worst performing countries in terms of establishing regulatory frameworks for ICTs and often has slow, unreliable, insufficient, and expensive telecommunication services.
Basic computer literacy is still not part of the primary education curriculum in most developing countries. The development of local content and of applications designed to address the needs of the poor has also progressed relatively slowly. The nature of ownership of ICT is relevant as it makes developing countries that own their ICT infrastructure more active in introducing technologies that are tailored to the needs of their populations. Notably, as far as internet service providers remain in developed countries, the benefits of ICT to developing countries are limited, because this creates a divide between producers and users of technologies to the advantage of the former. Most of the ICT potential thus remains to be fully exploited, especially for the advantage of lowest income groups. There are of course exceptions, in particular in developing countries where ICT is not owned by corporations in developed nations, and in sectors such as finance, insurance, agriculture, and health, where they do indeed rapidly remove barriers.
To conclude, penetration of ICT can in theory be seen as an unprecedented opportunity to reshape the political and institutional landscape of many developing countries, promising to improve accountability and transparency of governmental actions, and to increase participation in political decisions. But in reality the processes involved in democratic participation are so complex, and driven by societal dynamics of which communication is only a – poorly understood – part, that much more needs to happen. And in view of the prevalent regimes, one has to be aware of the fact that in many countries, for the time being, there is at best the kind of hybrid democratic regime that “keeps the trappings of democracy, including seemingly free elections, while leaders control the election process, the media and the scope of permissible debate by electronic means” (Edsall Reference Edsall2017).
Big Data and Individuation
I will now return to the novel capability to collect, store, and process “big data” that is one of the major technical transitions in information processing. First of all, it has led to huge concentrations of information, and processing tools, in the hands of a very small number of corporations, such as (notably) Tencent, Weibo, Apple, Facebook, Google, Amazon, Ebay, and Yahoo. These corporations were the first to see the huge advantages, both for their prospective clients and for themselves, of facilitating information access and collecting vast amounts of behavioral information from their customers. For a few years, there was a lag in tools to process such information, but the number of tools to do so is currently (2019) exploding. They enable, for example, the identification and analysis of patterns that have thus far been difficult to observe because the statistical samples that could be collected and analyzed were too small. Such analyses have led to customized web-mediated advertising, highly efficient mobilization of relevant voters in elections, automated scrutiny of job applications, monitoring of billions of communications in the search for terrorists, and many more applications, too many to list here. Manikya et al. mapped this process as early as 2011, and their guide, while quickly outdated in terms of details, remains relevant in terms of its general description of the dynamic. Somewhat more forward-looking is a collective work published by the BBVA Foundation in 2013, and to keep abreast of these developments one can rely on magazines such as Wired. As an overall trend, the capacity for processing huge amounts of information in great detail is transforming many aspects of our lives – wherever until now calculations were based on generalization from (limited) statistical samples – because we now have the capacity to enhance resolution to deal with each individual entity directly and separately. This not only impacts the insurance industry, but also medicine in its trend toward individualized diagnosing and treatment, and elections in the way one can now determine individual voting patterns by means of big data analysis, etc. Ultimately this development may well have an effect on economics by enabling the use of much more detailed data in its models, or even agriculture by enabling such detailed spatial analysis that techniques of exploitation can be better suited to local circumstance. The examples are plentiful, but they all share the fact that drilling down to the level of the individual, the smallest possible spatial or temporal entity, the individual instance of a phenomenon or process, will improve our understanding of societal and environmental phenomena at the cost of hugely (exponentially?) increasing the need for processing power. This is one of the major trends driving the computer industry toward high-performance computing (aggregating computer power to deliver much higher performance). To give the reader a sense of how quickly this trend is growing, I cite the French newspaper Le Monde (June 7, 2017): “the [European] data economy (from e-commerce to traffic management to personalized medicine) was worth 272 billion euros in 2015, and could increase to more than 640 billion by 2020.”
We should never forget that this trend enables a major concentration of information processing, and thus political and financial power, in the hands of a very small elite, aided by sophisticated software and major computerized information processing capacity. The fact that these corporations use these data in completely opaque ways has favored a backlash in the domain of privacy protection, prompting the European Commission to adopt in 2018 a completely new legal and institutional framework, the General Regulation of Data Protection, intended to create full transparency and thus reestablish trust. Its efficiency remains to be demonstrated.
Mass data treatment also stimulates the development of the capability to automate many structured, repetitive tasks, from the very simple ones, such as maintaining bank accounts, to more complicated ones, such as the work of paralegals in lawyers’ offices (routine document production and processing). As usual, this novel capability can serve constructive as well as deconstructive purposes, depending on the slant that the users of such information desire to give to their interpretations. Friedman (Reference Friedman2016) gives both constructive and deconstructive examples of “big data” processing as resource. O’Neill (Reference O’Neill2016) gives numerous examples of socially deconstructive uses, in particular when automated, algorithm-based data analysis uses criteria that exclude parts of society (for example from jobs).
Much attention has recently been drawn to the consequences that these (and subsequent) innovations might have for employment, as automated information processing and manufacturing reduce the need for certain kinds of labor (Brynjolfsson & McAfee Reference Brynjolfsson and McAfee2011; Purdy & Daugherty Reference Purdy and Daugherty2014; White House 2014; The Economist 2016).
Automation and Artificial Intelligence
Robots have long been a favorite science-fiction topic, as in the work of Isaac Asimov (Reference Asimov1950) and others. But the last sixty years have seen such advances in information processing that increasingly complex mechanical tasks in industry are being automated to reduce labor costs, for example in car manufacture. As long as information-processing capacity was limited, these robots were very specifically designed to perform relatively simple, monotonously repetitive tasks. But that, too, is changing, notably by means of the introduction of machine learning in automation.
Artificial intelligence has been another dream, this time of informatics enthusiasts, for at least fifty years, but over much of that period computing power was still insufficient to instantiate it in a meaningful way. Over a period of just a few years, in the early 2010s, that situation changed dramatically as a consequence of developments just mentioned, and in particular the “cloud.” Yet there was little success until an intellectual change in perspective made a fundamental contribution. Most early work, for example on languages and on chess, programmed sets of rules derived from expert opinions, according to which meanings and moves were to be construed. This worked to a reasonable extent for chess. Language, however, is too flexible and fluid, as well as complex, to assign meaning based on such rules. Contemporary artificial intelligence (AI) is based on one or other form of machine learning, which requires the computer to learn from the ways in which language is used by analyzing very large numbers of texts in ways that resemble “fuzzy set” approaches – in which initial approximations of meaning are refined many times until they come close to correct understanding (Zadeh Reference Zadeh1965, Reference Zadeh1975). This is the approach that transformed Google Translator from being a crutch to a more or less efficient and smooth translation machine (the story behind this is nicely told by Friedman Reference Friedman2016). It is reasonable to expect that this breakthrough – reflexive learning based on analysis of very large datasets – will enable computers to conquer important other domains of information processing, including sophisticated moving robots capable of nonroutine tasks, many relatively complex analytical tasks, etc. A summary of developments leading to the current state of AI and some ideas about its future impact can be found in a report recently issued under the Obama administration by the (US) White House Office for Science and Technology (2016a).4
In thinking about the future of AI it is important to distinguish between different ways of applying its basic principles. On the one hand, one can distinguish between narrow and general AI. The former is increasingly widely available now, and is used to address specific application areas, such as playing strategic games, language translation, self-driving vehicles, and image recognition. Narrow AI also underpins many commercial services, such as trip planning, shopper recommendation systems, and advertisement targeting, and is finding important applications in medical diagnosis, education, and scientific research. Narrow AI is not a single technical approach, but rather a set of solutions for discrete problems that relies on a toolkit of specific methods along with problem-specific algorithms.
The White House report (OST 2016a) defines as general AI systems that exhibit apparently intelligent behavior at least as advanced as a human being across a full range of cognitive tasks. It argues that it will be at least several decades before this can be achieved. The diversity of narrow AI problems and solutions, and the apparent need to develop specific methods for each narrow AI application, has made it unfeasible to “generalize” a single narrow AI solution to produce intelligent behavior of general applicability. Hence, attempts to reach general AI by expanding narrow AI solutions have made little headway over many decades of research.
In considering the societal impact of AI it is also important to distinguish between the three different roles that AI can (and does) play: (1) automation, (2) autonomy, and (3) human–machine teaming, which have different impacts on society. Automation occurs when a machine does work that might previously have been done by a person. The term relates to both physical work and mental or cognitive work that might be replaced by AI. This is a long-standing trend that has already permeated very many economic and social activities in our societies. Autonomy refers to the ability of a system to operate and adapt to changing circumstances with reduced or even without human control. An autonomous car, for example, can drive itself to its destination without detailed human control. Autonomy is, of course, a more recent trend that is in many ways still under development.
In contrast to automation and autonomy, human–machine teaming refers to cases in which a machine complements human work. In many cases, a human–machine team can be more effective than either one alone, using the strengths of one to compensate for the weaknesses of the other. This is a particularly important recent development that opens the road to employment opportunities that are not likely to disappear in the next few years. But filling these slots requires a focus on training people who have the specific skills to deal with electronic information processing and the capability to fully use their broad spectrum human information processing capacity.
From Production to Distribution
In the current economic system, the focus is on a production economy that derives its profitability from the gap between cost of production and perceived value of the product in the eyes of the consumer. This drove the European colonial trading system and its sequel, large-scale agricultural and industrial production in the colonies profiting from very low wages. It has also driven the search for ever-cheaper production methods worldwide over the last century or so, adopting ever more efficiency in all aspects of production: human, financial, logistical, technological, organizational, etc.
Yet a potentially important horizon is looming: worldwide limits to cheap labor enabling large-scale industrial production. Although there remain pockets of relatively low labor cost (Bangladesh, India, Indonesia, Africa), the wage advantage is globally eroding. The profitability of the traditional production economy, and thereby its existence under the current market-based regime, may well come under increasing stress. Major industries are beginning to see that this will affect them in the future, especially if they have to weigh the cost of labor against the risk of social instability, corruption, investment, etc.
Automation will no doubt mitigate some of this as robotics and AI replace human activities. Whereas until now human thinking directed machine information processing, machines can increasingly associate information into patterns, which enables them to figure out an appropriate response to changing circumstances. Hence, the use of information is now increasingly becoming external to human beings, rather than internal, and this will lead to yet another quantum jump in information processing in which many more – economic and other – activities are managed by computers.
Economist and technologist Arthur (Reference Arthur2017) has summarized his view of what this might do to the economy as follows. Once it is possible to produce enough goods and services for everyone by automated means (if we can do so in environmentally sustainable ways], we are about to witness a major shift from an economy in which production is the bottleneck to one in which the next challenge is to ensure general access to what can be produced. Arthur argues that this will bring about the following major changes:
The criteria for developing and evaluating policies will change. Gross domestic product and productivity are relatively good measures of the physical economy, but are much less effective in measuring the virtual economy;
The free-market philosophy will be less suitable to the new situation because the focus shifts to more or less equitable distribution of value, away from the idea that the more is produced, the better it is;
The new era will not be an economic, but a political one. The paradigm of society at the service of the economy, which has increasingly dominated since the 1840s and 1850s, will have to be inverted (again) to place the economy at the service of society, at least if we are to avoid major societal upheaval.
The transition to the distribution economy is likely to cause a period of major upheaval, in which a number of social questions need to be answered. How will we find meaning in a society where jobs no longer provide it? How will we deal with privacy in a society where every bit of information about everyone is concentrated in databases? Will we abdicate individual learning in favor of computer data and algorithms? The changes and the upheaval, Arthur concludes, will be as important as those that accompanied the Industrial Revolution, and may well take as long. Who knows?
Our Perception of the World
One of the intriguing aspects of the ICT revolution is how it changes our perception of the world. In dealing with that topic, we have to distinguish two different, almost contradictory, trends: complexification and simplification.
In the pursuit of knowledge, the mass of new data and the development of AI enable us to scrutinize in much greater detail many of the dynamics that we have thus far only been able to perceive in relatively general terms. In that sense, the ICT revolution will in many ways have the same kind of effect as the discovery of lenses in the second half of the seventeenth century, which enabled scientists to begin studying the world of the very small and that of the very distant.
Current developments enable us to develop ever finer scales of measurement, from the subatomic on the one hand to distant galaxies on the other, but also to focus on relationships rather than entities, and take a much wider set of contextual dimensions into account. The recent emergence of network approaches is one result of that, and so is the emergence of modeling as a technique to explore dynamics in a wide range of domains, from the environmental to the societal and the extraterrestrial. These developments have been fundamental in enabling the emergence of complex systems thinking as a practicable approach to conceiving the dynamics of the world around us. But they have, for example, also contributed vastly to our understanding and intervention in biological phenomena, whether through microsurgery or genomics. Such developments are in the process of changing our scientific and scholarly worldview from static to systemic and dynamic. In the natural and life sciences that perspective is now generally accepted, but in many of the social sciences and humanities this is not yet the case.
A second impact of the ICT revolution has been, and continues to be, the global unlocking of very large stores of data in all kinds of domains to research that is happening in all parts of the world. This creates a kind of transparency in science that is novel in many domains, but also allows for stretching the timeframes studied, for example through the opening of archival and archaeological data.
Third, the ICT revolution has fundamentally changed the ways in which we practice science and scholarship, enabling us to do so collectively across wide distances in space and time, and moving us from individual science and scholarship to collective, team-based, and interactive approaches to discovery and understanding, This has vastly accelerated the development of new knowledge by mobilizing more brain power and more tools for thought and action on specific challenges, but also by making it much easier to delve into the global store of knowledge across as many disciplines as is desirable. Hence, collective science is now mobilizing hundreds or thousands of scientists around the main themes, for example climate change and its interactions with our societies. No discoveries are nowadays accepted unless corroborated by several independent teams working on the data concerned.
When we look at the reverse of this trend, the increase in simplification that is directly linked to mass consumption of information, one is struck by the huge, and rapidly increasing, gap between the scientific understanding of very complex phenomena that the new methods are facilitating and the oversimplification of such phenomena that is ultimately communicated to the general public. This is clearly related to Debord’s spectacularization and the mediatization of our perceptions of the world that I discussed in Chapter 17, as well as to the growing discrepancy between those who have been trained to understand the complexity involved and those who do no more than consume the images and simplified narratives that they have been presented with in the media. In a world that is increasingly divided into “information bubbles,” it raises the question whether scientific endeavor will not, at some point, simply be drowned out by other perspectives. In that context, it is ominous to note that in December 2017 the US administration forbade the Centers for Disease Control and Prevention from using the terms “science-based” and “evidence-based” in any budget justification.
How These Trends Are Developing
How will these developments impact our daily lives? That is hard to know in the long run, but every day brings news that is relevant to this question in the form of large or small changes that have to do with ICT. Among the major changes that are now being discussed everywhere are of course “alternative truths,” the hacking by foreign nations and others of databases and websites to steal information, or the use of social media to plant it. Other news concerns the evolution of the capabilities of IA, such as the battle between one of IBM’s machines and the top player of the game of Go (Koch Reference Koch2016). But there are many more, seemingly innocuous, changes that illustrate some of these recent developments in information technology. I will briefly refer to some papers I noted recently (January 11–15, 2017). The first of these (Reuters, January 15, 2017 by Suzanne Barleyn) summarizes how insurers are beginning to collect microdata (for the moment on a voluntary basis) of individuals’ daily habits, such as the length of time they brush their teeth, the things they buy at the grocery store (and presumably eat), their daily exercise regime, their driving, and much more, all presented as an opportunity to reduce the cost of their insurance. But underlying such efforts is ultimately the opportunity to charge certain individuals much more for their insurance if they do not behave “appropriately.” In this manner, the information revolution is destroying the statistical basis of insurance thinking – that one person’s good fortune compensates for another’s misfortune in what is essentially a collective approach.
The second example is less visible, but certainly of great importance. It is raised in an article in the Japan Times of January 14, 2017 by David Howell, and concerns the fact that development of the digital economy since the 1980s has on the one hand caused the emergence of millions of small companies, with the result that traditional measures of the economy are no longer adequate, while on the other hand the large information giants can no longer be controlled because they are essentially global, so that no government has the capacity to constrain them. As a result, the traditional ways to steer an economy are becoming less and less effective. The same incapacity to apply the results of opinion polls to the management of the political process is currently hampering any top-down governance because the samples on which these polls were based are too narrow to reflect opinions in an interactive digital society. Howell concludes: “and where data and facts about the world become either unreliable and misleading or unascertainable, a new phenomenon steps into the vacuum. Enter the age of fake facts, bogus statistics and dud forecasts…”
The third case, by Noah Barkin, also published by Reuters (January 15, 2017), concerns the fact that the top leaders of the developed and developing worlds, congregated in Davos in early 2017, were thrown into disarray by the unexpected political developments of 2016, including the UK vote to leave the EU, the US election of Donald Trump as president, the unreliability of elections owing to cyberwarfare, etc. Barkin cites Moises Naim of the Carnegie Endowment for International Peace: “There is a consensus that something huge is going on, global and in many respects unprecedented. But we don’t know what the causes are, nor how to deal with it.”
This seems a prime example of a crisis due to an accumulation of unintended consequences that creates a groundswell in favor of change.
In an opinion page in the New York Times a few days earlier (January 11, 2017), Friedman summarizes the situation as he sees it:
“And so it came to pass that in the winter of 2016 the world hit a tipping point that was revealed by the most unlikely collection of actors: Vladimir Putin, Jeff Bezos, Donald Trump, Mark Zuckerberg and the Macy’s department store. Who’d have thunk [sic] it? And what was this tipping point? It was the moment when we realized that a critical mass of our lives and work had shifted away from the terrestrial world to a realm known as “cyberspace.” That is to say, a critical mass of our interactions had moved to a realm where we’re all connected but no one’s in charge.
In explaining the tipping point, he cites Alan S. Cohen, chief commercial officer of the cyber security firm Illumio, saying that:
…the reason this tipping point tipped now was because so many companies, governments, universities, political parties and individuals have concentrated a critical mass of their data in enterprise data centers and cloud computing environments. […] As more creative tools like big data and artificial intelligence get “weaponized” this will become an even bigger problem. It’s a huge legal, moral and strategic problem, […] and it will require a new social compact to defuse.
His conclusion is all the more important because in our current and future world, policies, whether economic, political or social, will be more and more decided on the basis of information in the major databases that are emerging in the cloud.
Conclusion
In this chapter I have presented some among the many examples of how ICT is impacting on our societies and their information processing. A more complete overview, which is nevertheless compact (but of course already out of date), is found in Hanna (Reference Hanna2010). My aim is to drive home the fact that in considering ways to meet some of our sustainability challenges, we must take the present and future impact of ICT into account. What we nowadays call the ICT revolution is the continuation of a number of trends in our global societies that have caused these challenges, but it is adding new, important, and unintended consequences to the predicament in which we find ourselves.
These consequences are often ambiguous, and can both contribute to sustainability or hinder it. Many of them are not generally taken into account in sustainability-related discussions, and certainly not in the detail and with the knowledge that is required. That is in my opinion one of the major challenges for the sustainability community in the coming years!
In meeting that challenge, we have to remember that the instances of the impact of the ICT revolution that I have given above are only a few of the popularly known ones; every day brings new examples, such as the following I found on October 6, 2017: AI can predict suicidal tendencies in people with 80–90 percent accuracy, much better than trained professionals (Walsh, Ribeiro & Franklin Reference Walsh, Ribeiro and Franklin2017). We are only in the very first stages of the changes the ICT revolution will bring to our societies.
Ut desint vires, tamen est laudanda voluntas. (Even when the forces are lacking, one must still praise the will.) (A Roman saying)
Introduction
In thinking about ways out of the current sustainability conundrum, we need to acknowledge that there are information-processing dynamics, such as the dominance of past tools for thought and action and the shift in focus toward shorter-term tactical solutions (rather than longer-term strategic ones), under the impact of unintended consequences that have brought us to this point because they are fundamental to human behavior, and therefore difficult to ignore. They have been discussed in Chapters 5 and 16 as major factors behind the path-dependent trajectories of all cultures and worldviews of individuals, groups, and societies. Changing these path-dependent trajectories and their current instantiations is well-nigh impossible in the absence of a set of external values and norms against which we can leverage them. Rather than try to change the values that underpin the current socionatural system in the western world, which are anchored so deeply and have been in existence for such a long time, it might be better to try and redirect them. Instead of initiating change by trying to frontally attack mindsets or worldviews that are closely related to people’s and groups’ identities, I think we would do better to focus on changing behaviors in the broadest sense; not limiting change to such things as “fly less, save energy,” but rethinking all aspects of our behaviors, institutions, and investments from a practical point of view.
How do we change relevant behavior patterns? First of all, it seems that as we have collectively dug ourselves into a huge hole, we have to stop digging. In a literal sense, this effectively means finding ways to redirect the current extraction-to-waste socioeconomic system in time for us to conserve at least part of the Earth’s resources and the cultural diversity that humans have built up over many millennia. A crucial part of this is that we must slow down the innovation revolution that is so closely tied to the plentiful availability of energy worldwide, and in particular its information and communications technology (ICT) component, which risks, as we have seen, creating a profound disconnect between the technical developments involved and the societal dynamics to deal with them, as it will result in an acceleration in the emergence of unanticipated and unintended consequences for all aspects of our society. We must thus change behavior simultaneously on a wide range of scales and fronts. In the next few pages, I will look at some of these behavior changes bottom up, from the individual to the group, society, nations, and finally the globe as a whole.
Individuals must Reengage in the Management of our Society
Overall, democratic governance and participation in it seem to be increasing, as new nations open up to it.1 Yet in a number of developed and developing nations there is a trend toward reduced active participation of the wider population in governance. In developed societies this has recently (since about 1980) manifested itself in the fact that an ever-smaller percentage of the population participates in national elections, and an even lower proportion of people in local, regional, or (in the European case) European elections.2 This is interpreted as the result of people losing the belief that participation will actually change anything in their everyday lives. In developing nations, but also in some developed ones, the lack of participation may also be the intended result of an absence of freedom of speech, press, and meeting, enforced to varying degrees but generally structured to maintain existing power structures. In other countries, the culture of individual expression on political topics is less widespread, so that voting is not a good barometer of the extent of participation in governance.
Whatever the causes, non-participation in elections has one major effect – people who do not vote are relinquishing control of their destinies. Many of them lead a relatively comfortable life and have not known anything else. They assume that this will more or less continue, and that governance is in the hands of a relatively small group of people who have a solid grip on it. Others think that the people in charge will never improve their lives, and ignore elections because of that.
By not exercising greater control over decision-making in our societies, many of us in the developed countries have, almost imperceptibly, handed such control over to very small groups of people and institutions: large businesses, government bureaucracies, and elected representatives at all levels, from our village or town to our national government. Democratic structures that began as a way to enable a society to achieve necessary and important, societally accepted, goals by according large numbers of people (ideally everyone) a vote in societal decisions, are being transformed into a way in which small minorities can gain control over what happens in the society and bend it to their own advantage. Enabling power has turned into controlling power. Only a few small developed nations such as Switzerland and Sweden have so far escaped this trend.
In this context, I am often reminded of a phrase of Archbishop Desmond Tutu of South Africa: “When white missionaries came to Africa, they brought the bible and we had the land. They said: “let us pray.” So we closed our eyes and prayed … and when we opened our eyes, we had the bible and they had the land …” (Retrieved August 5, 2017 from: www.brainyquote.com/quotes/quotes/d/desmondtut107531.html)
But elections are only part of the story. If we are to redirect collective behavior in our societies, our starting point should be to reinvest ourselves in the sociopolitical and economic dynamics of our own immediate environments by spending time to familiarize ourselves with the issues and the options facing us and exercise not only our right to vote, but also to actively participate in the management of our communities and environments. If we are to stop digging the hole in which we find ourselves we have to plan a different future – by first asking a question about the kind of future we actually want as a think-outside-the-box-challenge, and then designing a roadmap that may get us there. This needs to be done locally, regionally, and nationally as well as globally. An interesting example of how to organize this is developed by Saijo (2017) and colleagues of Kochi University of Technology for the Japanese towns of Yahaba (Iwate prefecture) and Matsumoto (Nagano prefecture), as well as in both urban (Dhaka) and rural environments in Bangladesh.
Designing a Plausible and Desirable Future
Calling for innovation is not enough if we do not first consider where such innovation should lead us. After all, we must regularly remind ourselves that the last 250 years of unbridled innovation in every direction have led to our supply-driven materialist and consumerist innovation culture and to our current sustainability challenges. If we want to do better, we must also learn to better understand and steer invention and innovation. It may be worth repeating here that we hardly know enough about the dynamics that drive the processes of invention and innovation, mainly because these have to do with the emergence of new ideas (objects, routines, institutions), and emergence is not very easy to study in our traditional reductionist, ex post scientific approach that focuses on providing and proving explanations of currently observed phenomena, and thus inevitably links their present with their past (learning from the past) by means of a cause-and-effect narrative. As a result, we know quite a bit about the conditions under which inventions and innovations flourish and the ways in which they affect the economy, but have much less scientific, procedural knowledge about invention in particular that could help us focus or steer invention and innovation effectively. We must among other things come to understand how invention and innovation dynamics work, and how they affect outcomes. I point to some ideas that might promote such understanding in Chapters 12 and 13.
But more generally, we have to develop ways to promote thinking constructively about the future. One way to do this is by developing the academic discipline of Future Studies. Currently, the development of models, scenarios, and forecasts is widespread among major corporations, governments, and supragovernmental institutions. But there is no independent academic community of a reasonable size that can critically look at the results of such exercises and help develop such efforts. To cite Alan AtKisson: ““Future studies” seems to me a kind of academic ghetto, marginalized from mainstream sustainability studies (and even farther removed from mainstream politics and economics)! (personal communication January 8, 2018).”
Repeating the gist of Chapter 6, if we are to plan our future we must adopt an ex ante perspective, linking learning from the past to learning about the present and to learning for the future. We should more directly focus on the processes that generate new phenomena, on the emergence of phenomena rather than on explaining existing ones.
A major barrier to asking about the kind of future we want seems to be that we often view our current predicament as the result of a quasi-inevitable evolution toward progress. This is a very deep and ancient tradition in our western cultures, but it is also a needless and distorting simplification of the reality of our history. On the contrary, at many times in our history there have been moments in which our societies’ trajectory was determined by choice (in the sense of systemic choice) involving the actions of an individual or a small group of individuals. Choice is important, whether systemic, local, or individual!
The situation in Europe in around 1750–1850 which I referred to in Chapter 12 is a case in point. Revolutions (France), near-revolutions (Germany), and war (Europe and North America) show that the structure of European society at the time was approaching a tipping point. Major structural changes occurred as a result of these events, but in particular the harnessing of fossil energy by means of the steam engine and the reorganization of Europe’s colonial empires from trade empires to production and marketing empires gave European societies a new lease of life. That said, things could have gone a different way, and European societies could have disintegrated. Choice is important, whether systemic, local or individual. The lesson is that if we are, as we think, at a similar point in our history, facing a tipping point, we must not succumb to an incremental (or worse a passive) perspective, but we must actively stimulate choice by collectively thinking about the kind of future we want, while being fully aware that unanticipated and unintended consequences of past systemic decisions may also limit the extent to which we can influence the future.
A fundamental question at this point is whether we actually struggle to achieve a chosen (more or less distant) ideal, or whether we accept that the future is ontologically uncertain and cannot be determined, so that our main efforts should be to optimize the path that we follow in our everyday actions, choices, and relationships. This dilemma is in some ways reflected in the difference between our western (European/American) approach and the traditional Asian approach to life (Puett & Gross-Loh Reference Puett and Gross-Loh2016). Investigating that difference, as is done brilliantly by these authors, highlights a wide range of other differences that one may need to consider, of which in my opinion the most important one is between the western focus on entities (objects, individuals) versus the traditional eastern focus on patterns, relationships, and, in an abstract sense, systems. Do we strive for individual success, in competition, or do we strive for the success of the community? What is success: behaving like an ideal person, as is the case in the Judeo-Christian and Muslim tradition, or behaving like “ordinary” human beings with all their idiosyncrasies?3 Do we strive for the realization of our individual potential or for that of the group? Ultimately these questions touch on the puzzling question of the existence and role of free will. How independent are individuals and their thoughts and actions from their context? Is the context, and are our relationships with our surroundings (including our social networks), dominant in determining our behavior, or are we as individuals? From the complex systems perspective, contexts and relationships seem to shape decisions and actions to an important extent, but what the role is of individual and collective desires in that process is still an open question. Are such desires fully shaped by contexts and networks, or is there a (genetically or otherwise determined) individual factor that plays a role in them? These are the kinds of questions we need to raise, discuss, and form opinions about as part of our efforts to outline our future actions.
From my perspective, one of the major thrusts should be to strive for an increased multidimensionality of our individual and collective value spaces. I outlined in Chapters 17 and 18 that in my opinion the relative reduction of our value space, individually, nationally, and globally to fewer and fewer dimensions, dominated by the lowest common denominator of wealth, has been a major contributor to the increasing wealth discrepancy we observe in the current world, but also to the destruction of many local, regional, and national social networks, thereby undermining the strength and resilience of communities worldwide, resulting in the urbanization and individuation of our societies. This has in turn facilitated the emergence of growing power over societies on the part of small elites. In the next couple of sections, I will discuss this process in some more detail.
The reduction in the dimensionality of our human experience in the West is also driven by another powerful, and relatively underinvestigated, set of drivers – individual and societal emotional desires. Over the last century, with roots in the works of Freud and his colleagues in different branches of psychiatry, motivational research in advertising has slowly but surely accorded desires a much larger place in human decision-making (see the classic work of Packard Reference Packard1957). In the last twenty or so years, this has again led to a major development in the scientific study of the role of human desires in decision-making in general, with certain authors according desires a more important role than any kind of scientific or other rational reasoning. It would take me too far from the main subject at hand to summarize this literature, but in the next section I will outline how one might see desires at work in creating narratives that drive our decisions as individuals and societies.
The Role of Narratives
Narratives and memes have in recent years been recognized as important potential agents of change. They can serve multiple functions, some of which are tied to the identity of people or groups. They have been seen to help anchor culture and society around certain basic ideas, myths, or defining moments in history. But it is interesting, in the present context, to drill down into the underlying dynamics.
To that effect, I am adopting the thesis that, in a process of increasing focus on the future in European (and later other western) societies (Girard Reference Girard1990), our visions of the future have slowly but surely become a major structuring factor in our behavior and decision-making. This process has been going on since the mid-eighteenth century and coincides with the beginnings of the “Great Acceleration.”
Beckert (2017) argues that the underlying difference between our current western conception of the future, and that of pre-1750 days is that in medieval and Renaissance times the future was conceived as more of the same, whereas since then it is increasingly viewed as open – subject to uncertainty and unpredictable change. He argues that this has set in motion a (uniquely western) cognitive feedforward loop that creates in our minds “imagined futures” and then develops “fictional expectations” that motivate people toward realizing them. In his words, “expectations of the unforeseeable future inhabit the mind not as foreknowledge but as contingent imaginaries” (Beckert 2017, 9); “they create a world of their own into which actors can (and do) project themselves” (Beckert 2017, 10).
Of course, these fictional expectations are continually adapted to present circumstances. For Beckert, this exchange between imagined futures and present conditions drives our decision-making. “Fictionality, far from being a lamentable but inconsequential moment of the future’s fundamental uncertainty, is a constitutive element of capitalist dynamics, including economic crises” (Beckert 2017, 12). He illustrates that in detail for the four main pillars of any economy: money, credit, investments, and innovation.
The implications of the role of such imagined narrative futures stretch far beyond the economy. First, they imply that the cultural, institutional, and social embeddedness of decision-making is based on imagined futures. Decisions reflect the value systems of the people concerned; they are shaped in the interaction networks of these people. Much of our current thinking about the future, for example, is in essence based on a western imagined future that, as part of globalization, has been projected onto other cultures. In other parts of the world, one finds underneath that global projection very different imagined futures. Part of our task is to identify some of these, particularly in parts of the world that might replace the current western-dominated political system.
Secondly, imagined futures are constructed by comparing the present to an imagined future, and they are maintained only as long as there is confidence in that future. In the absence of such confidence, a degradation of people’s circumstances or a crisis is experienced. The anticipatory loop can then very rapidly be turned in a negative direction, toward uncertainty, as in the case of recent financial crises. But that is not confined to such crises – it can slowly undermine the totality of our confidence in the future and result in hesitations, contradictory actions, and general loss of self-confidence.
Thirdly, our concern with sustainability can also be seen as the construction of an imagined tipping point for our world. By implication, the current imagined future that drives our present global socioeconomic and environmental system is less solidly anchored and stable than many people currently expect, and in projecting futures for the world we need to take this into account.
Fourthly, we need to consider the relationship between our imagined futures and the real world out there. That interaction is clearly an open-ended one that is not fully controllable, subject as it is to “ontological uncertainty” (Lane & Maxfield Reference Lane and Maxfield2005). As the imagined futures are confronted with the material and social “real” world, it is impossible to predict the outcome of such confrontations, especially over the longer term, owing to changes in the second order dynamics of the context in which shorter-term decisions are made. That confrontation is a major element in any process of invention and innovation (Lane & Maxfield Reference Lane and Maxfield2005, 15).
To conclude this section, we need to remember that the driving force of many desires, whether sexual, esthetic, intellectual, or emotional, is a strong and permanent challenge to our current economic, wealth-based, logic. While currently this dominates and is a major factor in globalization, one can envisage a future in which individual and societal desires, as expressed in different cultures, will gain in importance and contribute to the fragmentation of our world.
Reconstructing Communities
Back to the role of information processing. I argued in Chapter 18 that the global and rapid transformation in information processing is further weakening our existing central processing structures and institutions by strengthening horizontal communications worldwide. This clearly has important consequences for our current societal structures and the values that they hold, as it weakens the top-down element in the already fragile equilibrium between people, their institutions, and their governments, as well as the distinction between signal and noise that is dependent on the value space of a group or society.
It does not seem to me that a new social structure can emerge entirely top-down from this weakened power structure. Around the climate change discussions, we have seen that nation-states have major difficulties aligning themselves with a set of goals, and that any attempts to do so cause major friction within and among them. Although idealists have argued for many kinds of international governance, this has remained a very elusive goal; witness the difficulties the European Union (EU) has had to set up and maintain such a governance structure, and the difficulties that the United Nations has in striving to become a strong political player. As we see in Chapter 18, the novel impact of ICT is only making it more difficult to come to some kind of overarching goal in this domain.
I conclude that any fundamental restructuration will be shaped by the intrinsic properties of the complex adaptive system involved. Such a (re)structuration takes time, in the case of the Roman Empire some eight centuries or more. But that is no reason not to think about that process, as we do not currently have a choice. From the perspective of this book, it seems that for a time we will slide further and further into a phase of chaos, but ultimately this phase will generate a new form of societal organization, new values, and new tools for thought and action. Moreover, the ICT revolution may actually help us achieve such reorganization much more rapidly than in the Roman case (see Chapter 20).
How to go about such a restructuration is difficult to outline in a situation in which the ICT revolution is only beginning and is likely to rapidly change. But there are some elements that seem crucial, and the first signs of them are on the way.
One possible trajectory is that of community (re)creation based on the (re)activation of multidimensional value spaces. One example is presented by the transition towns movement that started in the UK. Focused on reducing greenhouse gases, and in the absence of sufficient progress at national level, many towns are taking their own grassroots initiatives, based on collaborations among and between one or more sectors of civil society: local government, business, non-governmental organizations, or less structured groups of citizens. Initiated in Totnes in 2006, in September 2013 there were 462 officially registered transition settlements in the UK, Ireland, Canada, Australia, New Zealand, the USA , Italy, and Chile. In the USA, transition initiatives have been started in many communities. Their stated national aim is “that every community in the United States will have engaged its collective creativity to unleash an extraordinary and historic transition to a future beyond fossil fuels; a future that is more vibrant, abundant and resilient; one that is ultimately preferable to the present.”4
Networks established between the transition towns are a resource and catalyst for building resilient communities that are able to withstand severe energy, climate, or economic shocks while creating a better quality of life in the process. They are accomplishing this mission by inspiring, encouraging, supporting, networking, and training individuals and their communities as they consider, adopt, adapt, and implement the transition approach to community empowerment and change, focusing on reducing and cleaning energy use, transportation, food, waste and recycling, economics, and psychology (Hopkins Reference Hopkins2008, Reference Hopkins2011, Reference Hopkins2013).
This kind of community-building activity is also beginning to spread to rural areas. In developed countries, this trend is notably expressed through the organic agriculture and horticulture movements. In China, I am following a related effort in the village of ShiShou in Hubei province, and in Japan I have been able to observe efforts to revitalize rural communities in various parts of the country that have suffered from rural depopulation. Often these efforts are initiated by individuals who have managed successful careers in towns, but want to live in a rural environment and give back to the community of their youth. In Europe, I am involved in studying the efforts of a small community in the Venice lagoon to attain the same, against very heavy odds, in a largely globalized semi-urban society.5
Another aspect of the erosion of societal resilience is that such resilience is in large measure derived from the codependency of individuals in groups. Over the last fifty years, many risks that kept people together as communities have been shifted to the level of the city, the province, or the nation, and in some cases the EU – for example, social security, health care, education, and infrastructure. This has helped many people to climb the social ladder but it has also eroded the codependency of people in communities. The real question is therefore how we find a balance. And in order to do that, I think we must have individuals and communities regain a sense of their own risks and how to cope with them.
Rebuilding communities, and in larger cities socially rebuilding neighborhoods, is absolutely fundamental to any effort to deal with the combined impact of the ICT revolution and the closure of our value space on the resilience of our communities, and thus on our overall sustainability. However much the ICT revolution facilitates making contact with everyone, the combined effect of globalization and commodification over the past few decades has so heavily eroded the trust and alignment on specific sets of values in each community that this trust and alignment need to be rebuilt, and this needs to be done face to face and will take considerable amounts of time (see Friedman Reference Friedman2016, chapter 12, for an example in Minnesota). The reopening of our individual and group value spaces that it engenders is fundamental to a successful emergence from our current sustainability challenges.
I also conclude from these examples – and the many others that I could have adduced – that we must as scientists be more humble and shed any pretense of being able to steer the future or innovate to make it happen in one specific way or another. Except in very rare circumstances, such as the Manhattan Project, no scientist of any kind can successfully try to change the world or the transformational trajectory it is on. This is a dangerous, outdated illusion that derives from our linear perspective on science, and is incompatible with a complex systems vision of society. Society changes itself. Scientists can contribute two kinds of things. First, they can tinker experimentally in the margins of the major societal dynamics, and secondly (and maybe more usefully) they can try and alert our societies to the kinds of changes that are coming, so that people can begin to prepare themselves for these changes.
The Future Role and Management of Cities
Cities are a special case, and merit some additional discussion. Their characteristic that concerns us here is the relationship between the communities living in them and the infrastructure in which they are living. The relatively long-term infrastructure in which urban dwellers live in many places complicates making changes to their social and information-processing configuration, and slows them down. This explains why urbanization so far has been the most persistent societal dynamic known to mankind. Individual cities have disappeared, but urbanization as a phenomenon has not disappeared. The fundamental drivers – aggregation and innovation – have remained intact throughout the last 6,000 or 7,000 years.
However, currently the energy–information balance that is at the root of the recent explosion in urbanization has been changing. Energy is becoming rather more expensive than it has been for the last couple of centuries, and information processing is becoming much less expensive, and less location-dependent. Hence one important question is whether the dynamic that drives urbanization – getting more people closer together so that information processing becomes easier at the cost of increasing the need for energy – is actually going to continue. Might the ICT revolution actually offer an opportunity to change an urban dynamic that has led to poverty, crime, and other undesired consequences of aggregating such a large number of people in limited space? Or would the spread of alternative, renewable energies in the longer run reduce the price of energy again? And if so, would that promote the regrowth of urban centers in the presence of the information-processing facilities now available?
Cities are growing faster and faster, and so are innovation and wealth differentials. Members of our communities and societies have increasing difficulties in keeping up with technological change. This means that societal risks have increased. Owing to the concentration of the population one finds there, this phenomenon is particularly important in cities. Hence, I would argue that cities are in the current context very vulnerable systems. They have a very costly infrastructure, they are dependent on a very large footprint, and in view of the dynamics I have just mentioned they are no longer necessarily the most persistent social dynamic that we have known.
Most of the predictions about urbanization, and in particular that we will have about 80 percent of people living in urban situations by 2100, are based on a linear extrapolation of the current dynamics, including political trend analyses. But in the case of urbanization we are actually dealing with a complex system that has many unintended consequences, and such a linear scenario will not necessarily come about. The ICT revolution, which is only beginning and will change the world much more dramatically than anything we have seen before, undermines the need for spatial concentration in innovation and therefore undermines the need to actually build cities. Climate change will exert pressure to increase transport costs and to reduce the use of bulk transportation, so that we may have to develop economies that are more regional, more local. The food/water/energy nexus, I would argue, may well hit us long before the heaviest impact of climate change (Roberts Reference Roberts2009).
Together, these dynamics may constrain the business-as-usual scenario for urban development. ICT may shift the dynamic toward dispersed settlement when information exchange no longer requires proximity. This saves energy and improves resilience because it keeps mutually dependent social groups together that are therefore more resilient. Mega-cities, as a result, may lose some of their predominance, and this will lead to an adjustment of national rank–size curves under globalization. Individual cities may gain in autonomy because the very large national and supranational units of governance may become more and more difficult to manage. But cities must find effective ways to manage focused change and stability, forcing them to invent novel ways to solve social challenges. But what these are, and how they are implemented, will differ from case to case and cannot in any way be predicted.
Innovation, as it is currently practiced, is putting our societies at risk because of the acceleration that process is undergoing. As mentioned in Chapter 2, when politicians and other people talk about innovating our way out of the sustainability conundrum, I respond that the last two-and-a-half centuries of undirected innovation in every domain of our lives has actually been a major cause of our present predicament. If we want to deal with the problem, we need to rethink the mechanisms that both foster innovation and suppress it. In that process, (mega-)cities, rather than designing change when they think it is necessary, will need to start designing for permanent change so as to accommodate the increased speeds with which urban communities change.
They will have to start integrating top-down and bottom-up codesign. What does that mean for urban architecture? In Haarlemmermeer, a little town just south of Amsterdam in the Netherlands, the Delta Development Group has been implementing the circular economy in buildings.6 Every building is designed for disassembly and reassembly whenever that may be needed. The “owner” (in actual fact the user, rather than the owner) of the building rents the building materials, and when they are no longer needed he gives them back to their owners. By that point, these materials will have become scarcer and pricier so that the owners of the materials make a profit. Everything is either composted or recycled back into industry. Of course, this requires new business models for architects, builders, and building users, and a new legal, contractual, and possibly institutional framework. But I think this is nevertheless one of the ways forward that we need to start exploring much more effectively.
What about urban planning? In general, action is taken too late owing to slow, multilevel bureaucratic decision-making. Existing and well-known political systems are the standard and determine how we plan the future. People inside the system often become immune to signals from the outside, so that these systems tend to reproduce themselves and become more robust owing to external threats. As a result, urban planning takes longer than the dynamics that are inspiring it, and the actual results of the planning last even longer. To adapt to newly emerging challenges, we have to look further forward in planning, with a horizon of thirty, forty, or even fifty years, and we have to find faster ways to adapt cities.
Swarm Planning, developed by a Dutch urban planner working in Australia, Rob Roggema, might offer a tool to achieve this. Roggema (Reference Roggema and Roggema2013) argues that two things are essential for planning: the spatial characteristics of the area and region concerned, and the availability of extraordinary ideas. When there is a large group of individual elements – people, buildings, connections, high-quality relationships in a network – and enough diversity, one may be able to design several coexisting patterns and coexisting ideas for further development, in which small groups of people will engender creative jumps, and new structures and information will evolve. But rather than focus on one future, multiple scenarios are prepared and multiple pathways are put in place, so that when the city is faced with the need for change, it actually can and does implement such changes much more quickly, much as a swarm of birds can very suddenly change direction based on almost invisible signals.
Dealing with the Acceleration in Information Processing
In this section I want to move from the national level to that of human societies in general, crossing all levels from the individual to the national. A directly ICT-related societal planetary boundary is that of differences within and among societies in the speed of information processing. In Chapter 16 I cited Friedman’s idea that ICT technology revolutions occur every five years or so, while societies need between ten and fifteen years to adapt to them. I now want to look at this in more detail to improve our understanding of what it actually means.
I think we need to distinguish between two aspects of this general statement. The first is the fact that the increasingly smaller community that is involved in generating the technical revolutions in ICT is indeed learning and inventing very fast, thus distancing itself increasingly from the wider population. Under current financial and legal circumstances, this contributes to the wealth gap because information is power, is wealth, and there is a substantive lag in enabling others in the population to catch up in information-processing capacity because that involves transfer of knowledge and education, which both need to be organized. The second aspect is that as part of the innovation concerned, our societies have to adapt in the widest sense, changing their behavior, their customs, their policies, and their institutions, and that takes a lot of time because it involves aligning large numbers of people around changes in the value space of which they are part.
Before I try to point to some ways to deal with this growing gap, I’d like to point out that many, if not most, people – whether politicians, business people, or citizens – assume that the ICT revolution must run its course. That is, again, assuming that history is an inevitability that is beyond human control or interference. Throughout this book I have tried to point out that this is not necessarily true – that individual or collective decisions do indeed impact on events and history in many, sometimes decisive, ways. In Chapter 16, I used the arguments of Polanyi and his students to make the point that the “invisible hand” of the market was not inevitable, but was created by the governing institutions of the time; and that when left to proceed on its own, it ultimately leads to societal reactions that can foster protectionism, trade (and possibly other) wars, and the like.
What could we do about the growing information gap? As is often the case, the opportunity to deal with this is also offered by the ICT revolution. In Chapter 18, we see that human mastery in processing information has only just set in motion a major revolution in our social, economic, and environmental organization. We should profit from that unique occasion to transform our society into one that aims for profound and accelerated restructuring. This implies that we need to collectively take a hold of the directions in which the ICT revolution may transform our society. At the moment, this is not the case – the private ICT companies are leading the development, and steering society in ways that are profitable to them. Part of such a reorientation can be achieved through the democratic process, by strengthening the constraints imposed on the companies involved, but much more can be achieved when individuals take responsibility for their own actions, strengthen their communities, and actively strive to focus on common values and goals.7
To begin with, we could – and should – slow down current development so that its speed is more closely in tune with what society can deal with. Here is a clear role for government. The current policy to let these developments accelerate is the result of the Red Queen race inherent in the feedback loop between the growth of the aggregates of population, notably in cities, and the need to develop new values in order to integrate them. But this feedback loop is not inevitable – downscaling population aggregates by devolving societal coherence into a multipolar world might well have the desired effect.
On the other hand, we could coherently and structurally improve the integration between general human and electronic information processing, so that most humans are back in control of the overall information-processing system. That is the essence of the book Whiplash by Ito and Howe (Reference Ito and Howe2016) that I will discuss in the next chapter.8 This is clearly a process that is ongoing, in which exploiting the capacity of ICT to reach out and create horizontal networks of information processing worldwide can become of major importance to drastically improve the total information-processing capacity of our societies. But to achieve that, we have to direct the restructuring of our societies’ information-processing capabilities in a different direction from the current one.
One measure that could in my opinion contribute to accelerating such a restructuring is the introduction of computational thinking everywhere in society by deploying major efforts in education in this domain at all school levels and ages, coupled with the introduction of generalized information society thinking in computer science. As part of that effort, we could be developing the generative (ex ante) approach to science that we think is essential, including in the historical sciences.
Another important contribution would be to replace the existing top-down and bottom-up information architectures with a more interactive approach, including improving continuous real-time communication and reducing response times.
Thirdly, ICT could be developed to enable us to overcome human cognitive limitations and biases. First and foremost, collectively we could try to overcome the limitations of the human short-term working memory. To this effect, we would need to develop more intensive sharing of human mental capabilities by continuing to invent better tools to communicate and work together as humans, but also make widespread use of electronic information-processing tools. As part of this, we would have to develop new ontologies and the software to apply them. In the scientific domain that would entail such things as developing improved transdisciplinary databases, tools for “Synthesis 2.0” (new software that allows larger groups in different locations to work together in real-time based on multi-site mirroring of content), serious, focused games to understand tacit knowledge, improved tools to study decision-making under uncertainty, open-science platforms involving people with non-academic backgrounds by crowd-solving, as well as more and better virtual experiments, in particular when studying societal phenomena. These should be based on much larger samples of data, enabled by high performance computing and “big data” processing, which must be analyzed in the greatest detail.
Our societies should also use the potential of new ICT developments to overcome the limitations of our thinking habits more widely, for example by further developing problem-based, change-focused tools that favor dynamic understanding over static knowledge. This would greatly contribute to the ability to overcome the current cultural and scientific emphasis on linking present and past in order to explain the present, rather than thinking about the future. To achieve this, emphasizing in education as well as in action the ex ante perspective alongside the ex post perspective that is currently dominant is essential, striving to learn from the past about the present, but with an emphasis on learning for the future. This could be initiated at kindergarten level and maintained throughout the whole curriculum, emphasizing the fact that there are always choices (and that such choices have both beneficial and potentially negative consequences), instead of presenting young children with “truths” in the form of cause-and-consequence narratives. So-called serious games may be a major asset to achieve this goal, as they stimulate such ex ante thinking.
But developing such an approach will also require new thinking about the role of computing. Currently, many approaches using the big data revolution are still based on statistics, and therefore on a reductionist approach to distilling information from data, studying past trajectories and present situations. Some such approaches are discovering thus far unobserved patterns and using them to extrapolate toward the immediate future. But if we want to think about the future out of the box, ICT could be developed to move from a limited number of observed dimensions to generate as many other potential dimensions as possible, and then test those out for feasibility by combining forecasting and backcasting. This would in effect contradict Occam’s razor by making the assumption that the world is complex and that, therefore, ideas need to embrace that complexity rather than simplify it away. The first, small, steps in this direction are being set by people such as Belnap (e.g., Reference Belnap2003, Reference Belnap, Brown and Lepage2005, Reference Belnap, Müller and Newen2007) and Fontana (Reference Fontana2012). Another interesting move toward such an approach is presented in the AlphaGo approach developed by René Coulom (Coulom Reference Coulom and van den Herik2006, cited in Ito & Howe 2017) that is able to deal with challenges in very high numbers of dimensions, based on machine learning and statistical sampling techniques (the so-called Monte Carlo Tree Search algorithms).
Such efforts could also reduce, and on occasion overcome, the underdetermination of ideas by observations (see Chapter 16). Massive ICT-based data gathering is an essential step to achieve this, and more will no doubt develop in this field, in particular as sensors rapidly become cheaper and spread to many more domains.
Identifying better ways to deal with the disciplinary and sectoral biases of human decision-making toward theories, ideas, and behavior that are principally based on successful past responses is another major ingredient of such an improved approach. Any such efforts create major challenges for the integration of different kinds of data into the necessary major databases.
But above all, we scientists should organize ourselves as socially and politically engaged individuals to influence, and where necessary control, the direction in which the ICT revolution leads us if we want to avoid a future such as I will try to sketch in Chapter 20, on the basis of the work of Dirk Helbing.
Our Role as Scientists in the Community
Over the past century or so, in some of our western societies science has to some extent lost the most precious gift of all, the trust of the population – without realizing it – owing to the unchecked instrumentation of science by industry and government for purposes of innovation and/or governance. In this process, science was a willing partner and became increasingly dependent on both for funding. In certain regions and certain domains, therefore, science and scientists are either seen as too distant from the concerns of civil society or too much under the influence (if not control) of government and industry – defending interests that are not those of the wider population. The loss of appreciation for, and trust in, science shows in some countries (such as the USA and, to a lesser degree, the UK and European countries) as a reduction in funding for basic science and/or acceptance of scientific ideas. The recent push of the Trump government in the USA to seriously reduce federal funding for research shows that this distrust has reached such proportions that even a government that has thus far used and promoted the role of scientists now bends to the popular view that science, and especially social science, is suspect.
As a result of that development, as I argued in Chapter 3, we must review the relationship between science and society, make it more open and transparent, be more realistic in the expectations we raise, and be more aware of the potential unintended consequences of our actions. We must listen more, think more broadly in terms of alternatives rather than narrow causal explanations, and use what remains of society’s trust in science to influence the political debate, as well as rebuild that trust where it has been eroded.
A first essential ingredient in this context is the wider spread of the complex adaptive systems approach and the thinking behind it. The second is humbleness among scientists about their role in determining the directions our society will take. I will deal with each of these in turn.
In Chapter 7, I outlined some of the differences between the complex adaptive systems (CAS) approach and the traditional, linear, scientific cause-and-effect approach, and I have argued the scientific need to think in CAS terms. There are, however, some political and social aspects of that approach which are important in the current context, but which I did not emphasize in that chapter. A major one is that admitting the nonlinear dynamics of most socioenvironmental and economic phenomena, and their ensuing unpredictability, helps reset our position as scientists in the world. It moves us away from projecting ourselves as “experts” who have “solutions” (which in many cases have not worked or have had unintended consequences, and thus have contributed to the loss of trust in science) to admitting that there is much that we do not know. This would also help us think in more appropriate terms about a future that we are not able to anticipate, but in which we can contribute to the many experiments that finding our way as societies will require. Thirdly, it seems to me that the CAS approach contributes to a convergence between the natural and the social sciences because it reintroduces irreversibility and history in the conceptualizations of the former. Both these conceptual tools have always remained integral parts of thinking in the life and social sciences, but have for a considerable time not been part of the (Newtonian) natural science toolkit that is still widespread in science thinking. An interesting fourth aspect to this is the hypothesis that CAS thinking is able to help bridge the gap between western and eastern approaches to understanding the world, as was proposed by Capra (Reference Capra1975) and others at the time. A team in Singapore is working on this issue, led by Sim and Vasbinder (Sim & Vasbinder, unpublished Reference Sim and Vasbinder2015).
How far should scientists refrain from, or actively participate in, societal debates about the way forward? Here, sustainability is a good case in point. If, as scientists, we see a disaster such as a train wreck coming, should we limit ourselves (as many have) to impartially outlining the scientific conclusions, or should we go as far as warning society, or even engage in promoting what we see as necessary measures to avoid the disaster? The scientific community has not been able to develop a consensus on this point, torn between the idea that articulating a specific position in this debate beyond simply presenting “the scientific facts” will weaken trust in science (as expressed by Merton in Reference Merton1942), and the idea that if you can be sure that two trains are set to collide you have to take action.
In many ways, this debate is about whether a scientist views him- or herself first and foremost as a scientist and only secondarily as a citizen, or the reverse. Clearly, scientists just like any other people are complex systems and parts of wider systems. However, as actors, the way they view themselves and act upon that perspective is relevant to the ecology in which they function as individuals. My personal opinion is that as society pays for our education and our professional activities, we are first and foremost (educated) citizens, and it is therefore our role to choose among pathways for society and to promote our vision with due reference to the scientific underpinnings of our ideas, and clearly acknowledge where the science stops and our personal choices begin. The world has become so complicated and complex that the overwhelming majority of citizens can no longer identify ongoing dynamics clearly. As educated scientists, we must therefore accept our role in an intelligent manner.
A special aspect of this position is our attitude with respect to education. As I have argued earlier, if our societies (or their successors) are to survive as such, an emphasis on improving the education of our children and ourselves is fundamental. As scientists, we have a huge responsibility in that domain, but because, while we are paid by society to educate, our career structures are predominantly determined by research, that is not always sufficiently acknowledged. Reevaluating our role in this respect is part of what needs to be done.
Introduction
In this chapter, I want to give some examples of a few of the many long-term visions for the future of humanity and its societies that are emerging. I choose not to go into those that could be labeled science fiction, nor is it my aim to present a coherent overview of the literature. I will limit myself to visions that are likely either to have or have had scientific or political impact: the Steady-State Economy movement, the Sustainable Development Goals adopted by the United Nations (UN), Farewell to Growth, a more politicized version of the steady-state argument, and two visions on the long-term impact that information and communications technology (ICT) will have on our societies, one theoretical, the other more practical.
In my opinion no one can make realistic assessments of where our world will be in 2050, let alone 2100. What follows are summaries of some current visions, simply meant to indicate some of the issues involved.
Why choose the label green growth for this chapter? What do I understand by this phrase? It is defined by Wikipedia (https://en.wikipedia.org/wiki/Green_growth, consulted June 5, 2019) as a path of economic growth that uses natural resources in a sustainable manner. It is used globally to provide an alternative concept to typical industrial economic growth. A number of national and international institutions have adopted this approach or a closely similar one (e.g., the United Nations Economic and Social Commission for Asia and the Pacific, the Organisation for Economic Co-operation and Development, the World Bank, and the Global Green Growth Institute). Most of these see green growth as a way forward with respect to the current sustainability predicament, but within the current socioeconomic free market paradigm.
The reasons for my choices are in part theoretical, in part practical. I am convinced that the climate change debate has from the start been formulated by the scientific community in a way that has precluded general acceptance and consensus – as a threat to our societies, rather than as an opportunity for change. Hence it came to be associated with burden sharing, with limits to growth, and thus with regression; with a way back rather than with a way forward (AtKisson Reference AtKisson2010).
The concept of green growth was first introduced under pressure from the business community to make the concept of growth compatible with environmental challenges, as growth is essential for profit in the current capitalist system. It has been adopted more widely as a term that emphasizes transformation rather than regression or danger and accepts that growth is necessary to improve the lot of billions of people in the developing world.
As was the case with its predecessors, sustainability and resilience, the term green growth is ill defined. For me, it implies in effect a profound restructuring of global society that will, in the long run, change the roles and ways of each and every one of us as individuals, as well as the design and functioning of our customs, institutions, and laws, much as earlier structural changes in society (sedentism, urbanization, and the Industrial Revolution) did in the now distant past. As part of that, it is expected to substantively reduce the human use of environmental resources, waste production, and the differences in wealth and wellbeing between north and south, as well as between and within individual countries. But it will, if successful, go beyond that and affect many aspects and sectors of our societies worldwide. Of course, it is impossible to envisage how this will play out – but we need to think seriously about the kinds of dynamics that we should set in motion, why, and how. This is what I would like to consider in this chapter by looking, in the first instance, at some of the futures that others in the sustainability business have (or have had) in mind. In presenting these, I also raise a question about whether growth and its cousin progress have a place in the kind of fundamental change that is required to deal with our sustainability conundrum.
Steady-State Economics
To initiate this topic, I want to go back to a groundbreaking book published many years ago. Herman Daly (Reference Daly1973) is one of the earliest to envisage a world that goes no further down the path of progress and growth. He was of course not the first to mention that human development may ultimately hit limits. Antecedents of Daly’s ideas are found in Smith (Reference Smith1776), Malthus (Reference Malthus1798), Ricardo (Reference Ricardo1817), Mill (Reference Mill1848), and Keynes (Reference Keynes1930), to mention but a few. Moreover, Daly’s book is part of a cluster of works on the same theme that were published at more or less the same time, including Boulding (Reference Boulding and Jarrett1966), Georgescu-Roegen (Reference Georgescu-Roegen1971), Meadows et al. (1972), Schumacher (Reference Schumacher1973), and others. But no one has argued the case of a steady-state economics as convincingly (and untechnically) as Daly.
In evaluating his very strong and in some places emotional plea, the reader is reminded that it was written at a time that information, information processing, and complex systems did not yet figure in our arsenal of intellectual tools. His work is therefore entirely based on energy- and matter-related arguments, and does not in any way consider societies as complex systems. His solution of a steady state still characterizes a linear cause-to-effect kind of thinking.
Yet there are still some interesting lessons for us in his analysis. I present them here in the form of a set of questions meant to promote a critical consideration of the fundamental societal choices that are to be faced in an era in which our global environmental footprint (Wackernagel et al. Reference Wackernagel, Rees and Testemale1998) far exceeds the sustainable.
Daly’s critique of the idea of progress and its role in the world is essentially value-based, in the absence of the ideas that are the foundation of this book, concerning information processing as part of the driving feedback loop that pushes our societies to include ever more people, more technology, more wealth, more power, and better health for (part of) the world population. Thus, he grounds his argument in the western value system, stating: “Once we have replaced the basic premise [sic] of ‘more is better’ with ‘enough is best’,1 the social and technical problems of moving to a steady state become solvable, perhaps even trivial” (Reference Daly1973, 2). He thus brings the argument back from economics to political and social philosophy, where it started in the nineteenth century with Malthus, Marx, and many others: “Only by returning to its moral and biophysical foundations and shoring them up, will economic thinking be able to avoid a permanent commitment to misplaced concreteness and crackpot rigor.”2
For Daly, therefore, “the challenge is to develop a political economics that recognizes both ecological and existential scarcity and develops its propositions at a low to intermediate level of abstraction, understandable by the layman or average citizen…” That is indeed the kind of narrative that needs to be, and in part has been, developed to promote the change in mindset that is necessary to achieve sustainability.
Underpinning all this is a particularly critical vision of the role of science and technology in our societies, which is worth thinking about in view of what is happening in the early twenty-first century. He cites a phrase from the 1933 Chicago World’s Fair Guidebook: “Science discovers, industry applies, and man adapts himself to, or is molded by, new things … Individuals, groups, entire races of men fall into step with Science and Industry” (cited in Dubos Reference Dubos1974–1975, 8). In other words, in how far have we, the scientists, contributed to the spiraling out of control of society’s relationship with the environment? Whether we see technology as shaped by the economy or the other way around (Arthur Reference Arthur2009), this is certainly worth thinking about. I raised this issue in a related form in Chapter 3 and in the last section of Chapter 18.
To what extent has the free market ideology, with its “invisible hand” inversion of the relative roles of society and the economy (Polanyi Reference Polanyi1944; Chapter 18), and the ensuing systemic acceleration of innovation sucked science and technology into its vortex? If this is indeed the case, can society regain control over the runaway dynamics thus triggered? Daly’s kind of steady-state economics would channel technical progress in the socially benign directions of small-scale decentralization, increased durability of products, and increased long-term efficiency in the use of scarce resources. It would thus respond (at least in part) to the issue raised in Chapter 12 – that scientists must better understand invention so that they can focus it on the most important needs of society, rather than let it continue to run rampant in every conceivable direction (as has happened so far).
All this also raises another important issue that has not received enough attention: demographics. In principle, this is the part of the information processing–knowledge acquisition–population growth feedback loop driving our present predicament that we could indeed individually control. Yet in the sustainability debate the issue plays the role of the, often invisible, elephant in the room, being avoided in discussions for two reasons: the western ethic about life being sacrosanct (which does not necessarily apply to the same extent in other cultures), and the ample evidence that in the current system it is impossible to achieve economic growth without population growth.
But the latter may be about to change, as a result of automation. If automation and artificial intelligence (AI), as predicted, cause widespread unemployment, the question of demographic growth is reduced to an (essentially western) ethical issue: the inviolability of human life and the desire to improve health and lengthen individuals’ lives. We need to urgently question whether this value set is compatible with the sustainability of our societies, and if so how we will deal with the resultant increase in the global population, which has thus far in many places been accepted in an almost axiomatic way (except in China and India). Daly states:
Growth of the human household within a finite physical environment is eventually bound to result in both a food crisis and an energy crisis and in increasingly severe problems of resource depletion and pollution […] Technological adaptation has been the dominant reaction […] We need, however, to shift the emphasis toward ecological adaptation, that is to accept the natural limits to the size and dominion of the human household. To concentrate on moral growth and qualitative improvement […]
By implication, we should be “back-casting,” working from a future in which those environmental and resource limits apply, toward a roadmap that can achieve the necessary changes, rather than taking the present as a starting point and forecasting from there into the future to create our roadmap.
In this process, as the human mind, as well as the coherence of society, require ever more information processing and acquisition of knowledge, we have to turn to the realm of the mind and the spirit for satisfying that need, rather than to the material and energetic realms. We need to enrich, rather than impoverish, the dimensionality of our value systems by developing the mental, normative, and ethical dimensions that have (in part at least) been jettisoned as part of (one-dimensional, wealth-directed) globalization (see Chapters 14 and 16).
Daly thus initiated a movement toward no growth (steady-state) economics. I want to briefly present and discuss some of the core ideas of this movement as I am not sure it offers a realistic solution to our predicament. A compact treatment of the subject, which places it in its historical context, is found on Wikipedia (https://en.wikipedia.org/wiki/Steady-state_economy, consulted April 28, 2017). First, to avoid a frequent misunderstanding, it is worth pointing out that a steady-state economy (or a degrowth economy) is not the same as a stagnant economy. Whereas the latter is an (undesired) regressive phase in a growth economy, the former is a deliberately politically motivated and implemented economy that is geared to the absence of growth. Critics of the steady-state economy usually object to it by arguing that resource decoupling, technological development, and the unrestrained operation of market mechanisms are fully capable of overcoming any resource scarcity, any rampant pollution, or any overpopulation ever to be encountered. It will be clear to the reader that I do not agree with that thesis unless it encompasses major societal changes, some of which will be discussed in a later section of this chapter. A core driver toward a steady-state economy should be that invention and innovation are, as far as possible by stimuli, by legal means, and a better understanding of the process of invention and innovation itself, directed toward achieving such a goal, while all efforts should be focused on stopping further digging the hole we are in; i.e., slowing down the feedback loop that is responsible for the current acceleration of information processing and its material and environmental consequences. That in turn requires us to review the role of economy and technology as drivers of society and to consider reinventing that relationship by reengineering societal control over the economy. As I mentioned in Chapter 12, our current predicament is due to 250 years of unbridled and undirected invention and innovation, and as Einstein (n.d.) famously said: “We cannot solve our problems with the same thinking we used when we created them.”
Proponents of the steady-state economy, on the other hand, argue that these objections remain insubstantial and mistaken – and that the case for a steady-state economy is gaining leverage every day with the power of new technologies and, in particular, ICT. In my opinion, this is not really a better solution as long as we have large proportions of the global population living in abject poverty and lacking even the basic resources that are available to the developed world. Not only is this ethically unacceptable, but it triggers major societal disruptions both within and between nations, of the kind currently manifest in the Near East.
Sustainable Development Goals
One recent attempt to address the current global inequality, while remaining within a safe planetary operating space from an environmental perspective by adopting limited and directed growth, is the UN effort to promote Sustainable Development Goals (SDGs). These goals are – from a political perspective correctly, if from a scientific point of view maybe too sectorally – formulated in terms of seventeen practical challenges to solve in the near future (Figure 19.1). In this section I will briefly present them, and the way in which a major, global project (The World in 2050) is trying to concretize them.3 My reason for doing this is that the SDG movement is the most recent global attempt to move in the opposite direction from the steady-state and degrowth economy movements.
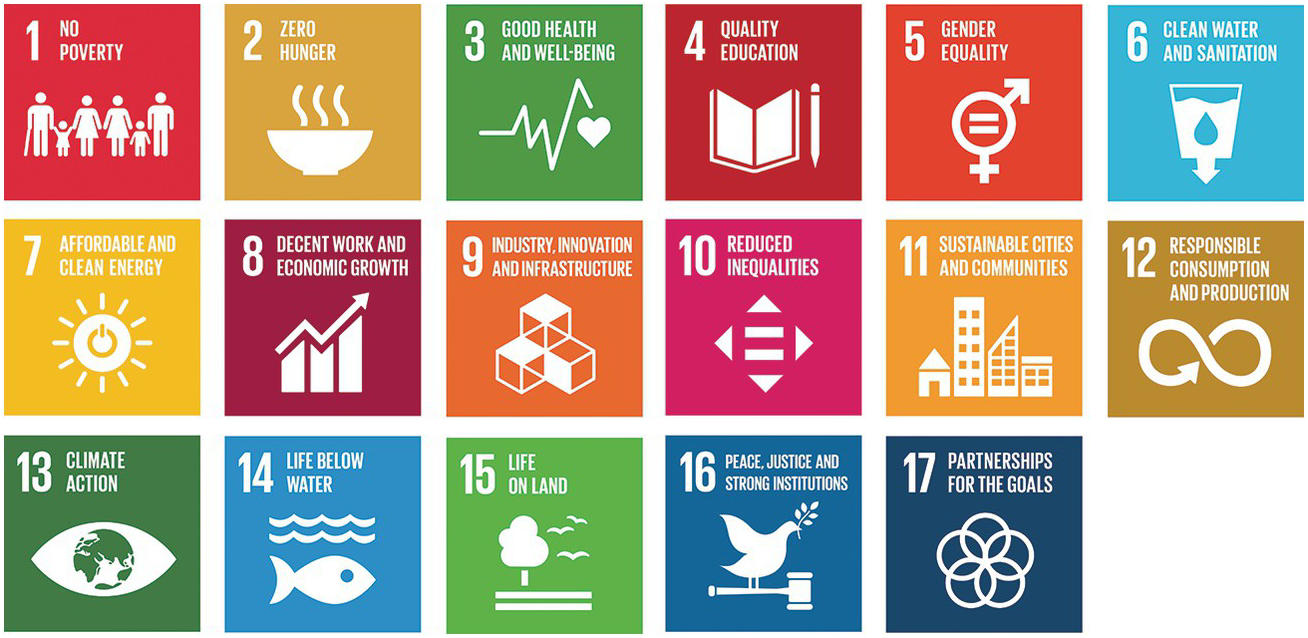
Figure 20.1 The UN’s Sustainable Development Goals
The SDGs are defined in a UN resolution that was adopted in 2015, aiming at, in summary, the following (a more extensive description is found in Wikipedia at https://en.wikipedia.org/wiki/Sustainable_Development_Goals, consulted June 6, 2019):
To end poverty and hunger, in all their forms and dimensions, and to ensure that all human beings can fulfill their potential in dignity and equality and in a healthy environment.
To protect the planet from degradation, including through sustainable consumption and production, sustainably managing its natural resources and taking urgent action on climate change, so that it can support the needs of present and future generations.
To ensure that all human beings can enjoy prosperous and fulfilling lives and that economic, social, and technological progress occurs in harmony with nature.
To foster peaceful, just, and inclusive societies that are free from fear and violence. There can be no sustainable development without peace and no peace without sustainable development.
To mobilize the means required to implement this agenda through a revitalized Global Partnership for Sustainable Development, based on a spirit of strengthened global solidarity, focused in particular on the needs of the poorest and most vulnerable and with the participation of all countries, all stakeholders, and all people.
The approach reflects Ban Ki-moon’s statement that “We don’t have [a] plan B because there is no planet B” (https://news.un.org/en/story/2014/09/477962-feature-no-plan-b-climate-action-there-no-planet-b-says-un-chief, consulted June 6, 2019). Though adopted by all the nations represented in the General Assembly of the UN as “Transforming Our World: The 2030 Agenda for Sustainable Development,” the approach represents a very specific perspective on the future of Earth and its societies, which is dominated by the idea of progress – the assumption that things will on the whole always tend to become (or should be made) better (whatever that may mean) (https://en.wikipedia.org/wiki/Idea_of_progress, consulted April 14, 2017).
The approach is heavily goal oriented, and attempts to define 168 specific improvements in the seventeen domains, such as: “By 2030, ensure that all girls and boys complete free, equitable and quality primary and secondary education leading to relevant and […] effective learning outcomes.” But most importantly, the SDGs seem to adopt at the global level a more or less linear projection into a future based on current trends, focused on achieving a state of “no one left behind” for the whole of the world’s population by attaining a modicum of material comfort for all.4 As such, it clearly goes against the grain of traditional western liberal capitalism, while adopting the western idea of progress.
As it concerns goals for a possibly foreseeable – but certainly not predictable – future, achieving them could easily be derailed, because of the fundamental uncertainties inherent in the long-term projections of the multidimensional dynamics involved, or because of newly emerging scientific, economic, or political issues.
Moreover, we are all aware of the difficulties and limitations of current social science and humanities research on the topic of global change. While there is considerable scientific knowledge concerning the physical dynamics of the Earth’s system, there is much less knowledge of the societal dynamics involved, and little insight into the second order dynamics involved in socioenvironmental coevolution. A major effort in this domain is essential, especially if one views the sustainability challenge as a socioenvironmental rather than an environmental one.
Another question is whether, or to what extent, the linear progress approach is one that all communities involved can subscribe to. Clearly, the SDGs have been negotiated between national representatives principally belonging to their countries’ elites, who have, to a certain extent, been brought up with the western ideas involved. It is not clear to what degree the populations of the world would ultimately subscribe to these ideas or be prepared for the effort needed to implement them. Here, again, Polanyi’s, Graeber’s, and Munck’s warnings (Chapter 18) seem relevant; i.e., that the more forcefully one attempts to make large, culturally different, populations converge, the greater the risk that such a trend gives rise to identity challenges and defensive tensions in the societies concerned. Current developments in Europe and the USA seem to point in that direction, not to mention trends in the world of Islam.
I would therefore argue that the top-down approach developed by the UN is an important step forward as it gives researchers, politicians, and others a mandate to search for various paths forward; but that it is also risky. From the complex systems perspective, it would be wiser to develop a wider plurality of futures and trajectories rather than just progress-based ones, taking different contextual developments and different worldviews into account,5 in different locations, experienced by different societies that think fundamentally differently, have different cultures, different values, and live in different environmental circumstances.
Alongside the very important efforts currently under way to use advanced modeling techniques to try and define a number of trajectories to attain a sustainable SDG future, such as is being undertaken by the World in 2050 project,6 there are therefore very good reasons to study a much wider set of potential scenarios for our various futures by adopting a complex systems approach and engaging different societies in discussions about which kind of environment and what kind of society they might want to strive for. It would more realistically represent the true nature of the challenge ahead, something that is not fully done justice to in the UN’s linear, compromise-driven, approach.
Such an effort could begin by collecting a wide array of narratives about the future of the Earth from different perspectives and different parts of the world. It would improve our understanding of global and regional socioenvironmental dynamics, would yield a number of alternative pathways for the future, including those that will help us achieve the SDGs and others that might offer different futures for our planet and our societies, and would allow a wider global participation in the discussions about the future of our societies; one that is more representative of the cultural diversity of our planet’s population.7
In summary, contrasting the SDG goals with the arguments of the steady-state and degrowth movements highlights the fact that we are on the one hand urged (top-down) to live within our environmental means, and on the other hand see the need to generate novel kinds of resource use and economic development across the world so that all of the world’s populations may share in basic human comforts. That kind of innovation is inevitably to a large extent local and bottom-up.
The question we are faced with is therefore how we can sail between Scylla and Charybdis, between unsustainable resource use and continued imbalances in development, and at the same time between top-down steering of world development and bottom-up encouragement and development of networks of local communities. In Chapter 19, I mentioned various movements and experiments striving to do just that, which have emerged in recent years. But much more remains to be done.
Toward a Mindset Change
As an example of the more recent degrowth version of Daly’s general argument, I will take the work of Serge Latouche. In his book Farewell to Growth (2007), in language that is no less emotional than Daly’s but much more political, he emphasizes and treats in more detail what it takes to abandon the unidimensional growth and progress ideology that drives the current world system, and focuses on the mindset change that this requires. His goal is to: “build a society in which we can live better lives whilst working less and consuming less. That is an essential proposition if we are to open up a space for the inventiveness and creativity of the imagination, which has been blocked by economistic, developmentalist and progressive totalitarianism.” (2007, 9)
In striving for that goal, Latouche delves deeply into the political economy that is responsible for the current situation. Thus, he clearly distances himself from sustainability and sustainable development:
Sustainable development has now found the perfect way to square the circle: “clean development mechanisms” [sic].8 The expression refers to technologies that save energy or carbon and that are described as being eco-efficient. This is more verbal diplomacy. The undeniable and desirable advances that have been made in technology do nothing to challenge the suicidal logic of development. This is another way of patching things up so as to avoid having to change them.
Instead, he builds on the tradition of the social sciences that is exemplified by such scholars as Emile Durkheim, Marcel Mauss, Karl Polanyi, Marshall Sahlins, Erich Fromm, and Gregory Bateson, who maintain that the economy is to serve society instead of the other way around (Chapter 16). As pointed out by Georgescu-Roegen (Reference Georgescu-Roegen1971[2014]), in adopting a Newtonian paradigm that ignores the second law of thermodynamics and the inevitability of entropy, neoclassical economics creates a formally elegant, closed system model that has little relation to a real world economy that is embedded in an open physical, chemical, and biological as well as social world. It can therefore only be realistically dealt with in a complex flow structure approach, as applied here.
The main aim of Latouche’s book is thus to exchange the current extraction-to-waste economy for a (novel) economy of opportunity creation, in which innovation is necessity-driven (Chapter 13; van der Leeuw & Zhang Reference van der Leeuw and Zhang2014).
In the context of the earlier discussion about demography, it is interesting to see that for Latouche a reduction in the population is a lazy solution that is not realistic. It would not in itself transform the dynamic driving our economies, and would thus at best cause a temporary slowdown. In his vision only a profound dematerialization of our hypergrowth-driven developed and developing societies will have the desired effect, and the main issue is then how the reduced quantities of resources are to be spread across the world. He tends here toward the kind of distribution economy also proffered by Arthur (Chapter 18).
The desired restructuring of our societies, Latouche argues (Reference Latouche2007, 33), can be synthesized into a virtuous circle of eight Rs: reevaluate, reconceptualize, restructure, redistribute, relocalize, reduce, reuse, and recycle. These eight interdependent goals, he argues, can together trigger a process of degrowth that will be serene, convivial, and sustainable. It is of necessity a local, bottom-up process that aims for a renewed focus on community, equity, sobriety, taking less and giving more, and using local resources:
The pleasure of leisure and the ethos of play should replace the obsession with work. The importance of social life should take precedence over endless consumerism, the local over the global, autonomy over heteronomy, an appreciation of good craftsmanship over productivist efficiency, the rational over the material, and so on. A concern for truth, a sense of justice, responsibility, respect for democracy, the celebration of differences, the duty of solidarity and the life of the mind: these are the values we must win back at all cost, as it is those values that will allow us to flourish and to safeguard our future.
In invoking the need to move in this direction, he clearly converges with many moral philosophers (such as John Dewey, see Stanford Encyclopedia of Philosophy (https://plato.stanford.edu/entries/dewey-political/, consulted July 27, 2017), environmentalists such as Gilles Clément (Clément et al. Reference Clément, Rahm and Borasi2007; Clément Reference Clément2015), and a very large number of Christian ecologists for whom the eleventh commandment is “Respect nature because it is God’s creation.”
I do not have the space here to go into the eight processes that Latouche argues for in detail. Among them, he sees a strategic role for reevaluation, reduction, and relocalization. The process to achieve these is a bottom-up one, in which local ecological democracies are created that satisfy needs for identity and control over everyday life. Though he does not cite her, his ideas are in this respect very close to Ostrom’s (Reference Ostrom1990). One of the interesting things in his work is that he refers to many ongoing local initiatives that are effectively moving in this direction, striving for environmental and economic autonomy (including but not limited to renewable energy, locally valid vouchers instead of national currencies, and organic, small-scale agriculture), focusing on the management of local and regional common-pool resources that, importantly, involve active citizen participation in the governance process.
A detailed discussion of the way this approach might play out in the global south is included, and here Latouche emphasizes that local communities should not be forced or seduced to adopt northern ideas, but helped (or left alone) to define their own futures and develop ways to attain them.
For me, an important contribution here is that this would enlarge our global value space and thereby open new ways for harmonious and appreciative interaction between multidimensional communities. The Development Research Centre (DRC – of the State Council of the People’s Republic of China) project in ShiShou in China in which ASU is participating (Chapter 18) is an interesting example, where a local community is being given support to develop from a preindustrial agricultural community to a postindustrial one without transitioning through an industrial stage, and along lines the community itself defines. As part of the project, the community is revived and begins attracting back some of the inhabitants who earlier went to the city.
In contrasting this approach with the SDG initiative discussed in the last section, the difference is not so much in the ultimate goal, a better life and a better local or regional balance between resources and consumption, but in the other dimension of our trip between Scylla and Charybdis – top-down versus bottom-up. The bottom-up choice represented here allows for many more, and very different, ways forward. It enhances the dimensionality of our human experience and favors diversity. And after all, isn’t it from the bottom up that humanity has created all forms of durable societal organization, including hierarchies?
Pluri-Polarity
In this context Elinor Ostrom (Reference Ostrom1990) tackles the problem of finding the most appropriate form of governance to achieve long-term stability. Having undertaken numerous case studies, both in the USA and in many parts of the developing world (Asia and Africa) with a very wide network of excellent scholars, Ostrom comes to the conclusion (Reference Ostrom1990) that (1) relatively small communities are demonstrably able to find effective long-term solutions to managing their complex environments, and in particular what she calls their “common pool resources”(Reference Ostrom1990, xiii) such as water, vegetation, herds of animals, but also knowledge and other such resources as are essentially the basis for the maintenance of society; and that (2) above a certain size of community, governance becomes less effective, more subject to various kinds of endogenous vulnerabilities, and in general less stable. She therefore makes the case for a multipolar world in which relatively small-scale societies govern themselves and their environments, in interaction with each other.
From the perspective that has been presented in this book, her work has several noteworthy aspects. The first of these is expressed in Chapter 10, where I try to show the interaction between institutions and individuals: at times individuals undermine institutions, while at other times individuals create novel institutions to deal with issues at hand. The difference between Ostrom’s work and mine is that I have been able to look at a much longer period, so that both the successes and the failures of small-scale governance that Ostrom mentions might be interpreted as due to a second order dynamic that accounts both for phases of institutional continuity and for variation and change in the system.
Another element in Ostrom’s work that resonates with me is the importance of system size in relation to governance. In an era in which much effort is spent on working toward top-down global governance, I believe that this is an unattainable goal that may seriously threaten the effectiveness of governance. Part of my argument is based on the fact that any optimization of resource use necessarily requires intimate knowledge of the detailed spatial and resource structure of the environment. The modern tendency to mechanize and optimally rely on economies of scale, whatever its merits are, is based on a statistical approach to the environment that ignores considerable relevant detail and can thus never achieve optimal results. And in the domain of societal governance, I would argue that governance systems organize themselves to manage a certain number of potentially discordant sources of information, as we saw in Chapter 11. Instead of top-down global governance, strengthening global bottom-up awareness and cultural commitment to sustainability may therefore be a better means to achieve our goals.
Possible Future Roles for ICT
As the reader of this chapter will be aware, neither the steady-state and degrowth movements nor the SDGs explicitly take into account a number of potentially very important ongoing dynamics that are related to the rapid pace of the ICT revolution. Might ICT be able eventually to help us set a course between Scylla and Charybdis? In the next few pages, I present two visions of the impact of the ICT revolution on our societies that illustrate some of the issues concerned.
One of the many protagonists of the “ICT society” is Helbing. In his publications, he adopts the point of view that the ICT revolution will lead to a society that will largely depend for its information processing on distributed networks of computers. In Helbing (2015), he first renders plausible the assumption that within the next twenty to thirty years AI based on “big data” and sophisticated machine learning will make it technically possible that most of human behavior will be impacted, if not steered, by electronic information processing. In doing so, he echoes the work of many others, such as Kurzweill (Reference Kurzweill2005) and Brynjolfsson & McAfee (Reference Brynjolfsson and McAfee2011), as well as the authors of the two reports published by the White House (Executive Office of the President of the United States 2016a, 2016b) on the advances of AI (Chapter 19).
Helbing then poses that this evolution could proceed either toward top-down control of society by computers (the Hobbes model), or bottom-up free-market development (the Smith model) of a self-organizing society that relies on computing for its information processing. The core question to ask is how will the technological capabilities be used. The central issue in responding to this question is that of the coordination capacity of our systems – by increasing central information processing capability (following the Hobbes model) into a Leviathan (a true, huge and unmanageable top-down organization), our social and life support systems may well become hypercoherent, and therefore increasingly unstable, whereas reducing the centrality of information processing (in the sense of the Smith model) we may find that insufficient coordination creates dysfunctionalities such as climate change or tragedies of the commons, and cannot be relied upon either.
With this dilemma in mind, Helbing first discusses the top-down approach, beginning with a well-documented and rather detailed summary of steps that have already been achieved in collecting and using big data centrally by major corporations such as Google, Facebook, the US Central Intelligence Agency and National Security Administration and others such as the World Health Organization, but also a large number of startups that are beginning to crowd this domain. This summary convinced me that, in principle, it is now possible to know so much (5,000+ attributes of every individual in the USA) about every person on Earth that it would – given enough data storage and treatment capacity – be possible to create various ways to monitor, understand, and to some extent predict and influence certain aspects of the behavior of large numbers of individual people. As this trend is accelerating, and the behavioral models involved improve owing to machine learning based on studying very large datasets, certain individuals and institutions are tempted to infer that it will be possible for a central authority (a wise king or benevolent dictator) to know, regulate, and control social life, and thus socioenvironmental dynamics, globally, creating what Helbing has called the Leviathan approach of top-down regulation.
Helbing then proceeds to argue very effectively why this might be advantageous; for example, if it were possible to avoid major events such as the financial crisis, or improve the efficiency of a wide range of processes. But societal predictions – the basis for such management – would immediately lead to social reactions once they became known. Such reflexivity would make judiciously acting on them extremely difficult, and could all too easily lead to a form of totalitarian technocracy (a Big Brother society) in which the predictive policing that is currently being used in combating crime would be extended. In the process, the fundamental assumption that people are innocent until proven guilty would be abandoned in favor of the opposite.
Alternatively, systematic use could be made of nudging our decisions in certain directions, as is currently done through inserting appropriate advertisements into our cellphones or computers, or even through subliminal messaging. The current worries about foreign interference in elections in Europe and the USA reflect this train of thought. As discussed in Chapter 19, this process is enabled by the blurring of the boundary between noise and signal that is inherent in the ICT revolution, and the resulting fuzziness makes it very difficult to come to clear decisions.
But Helbing concludes – for a number of theoretical as well as practical reasons – that this approach can never achieve its intended goal. A fundamental barrier to “managing” society is the difficulty of distinguishing good and bad solutions. As we saw in Chapter 10, all solutions ultimately lead to unanticipated problems, and thus to ontological uncertainty. Another challenge is the margin of error in the statistical analyses that leads to decisions.9 The same challenge would be faced by the use of inappropriate models to separate positive from negative courses of action, which would distort the actual risks involved in certain decisions.
A final and convincing limitation is in my opinion the fact that complex systems such as the ones we are dealing with cannot, as Helbing says, “be driven like a bus” (Helbing & Lämmer Reference Helbing, Lämmer and Helbing2008, 7). One can never expect to have all the information needed to make the correct decision. As the past to an extent determines both the present and the future, in order to make the right decision, one would need to know the past in detail – an impossibility that seriously limits our decision-making in systems that are subject to the butterfly effect or to some Rayleigh-Bénard effect that structures subsets of society in unpredictable ways.
But over and beyond that, the variability inherent in the behavior of social systems is so great, and their algorithmic complexity so huge, that the computing power needed to deal with the behavior of social systems will always be insufficient.
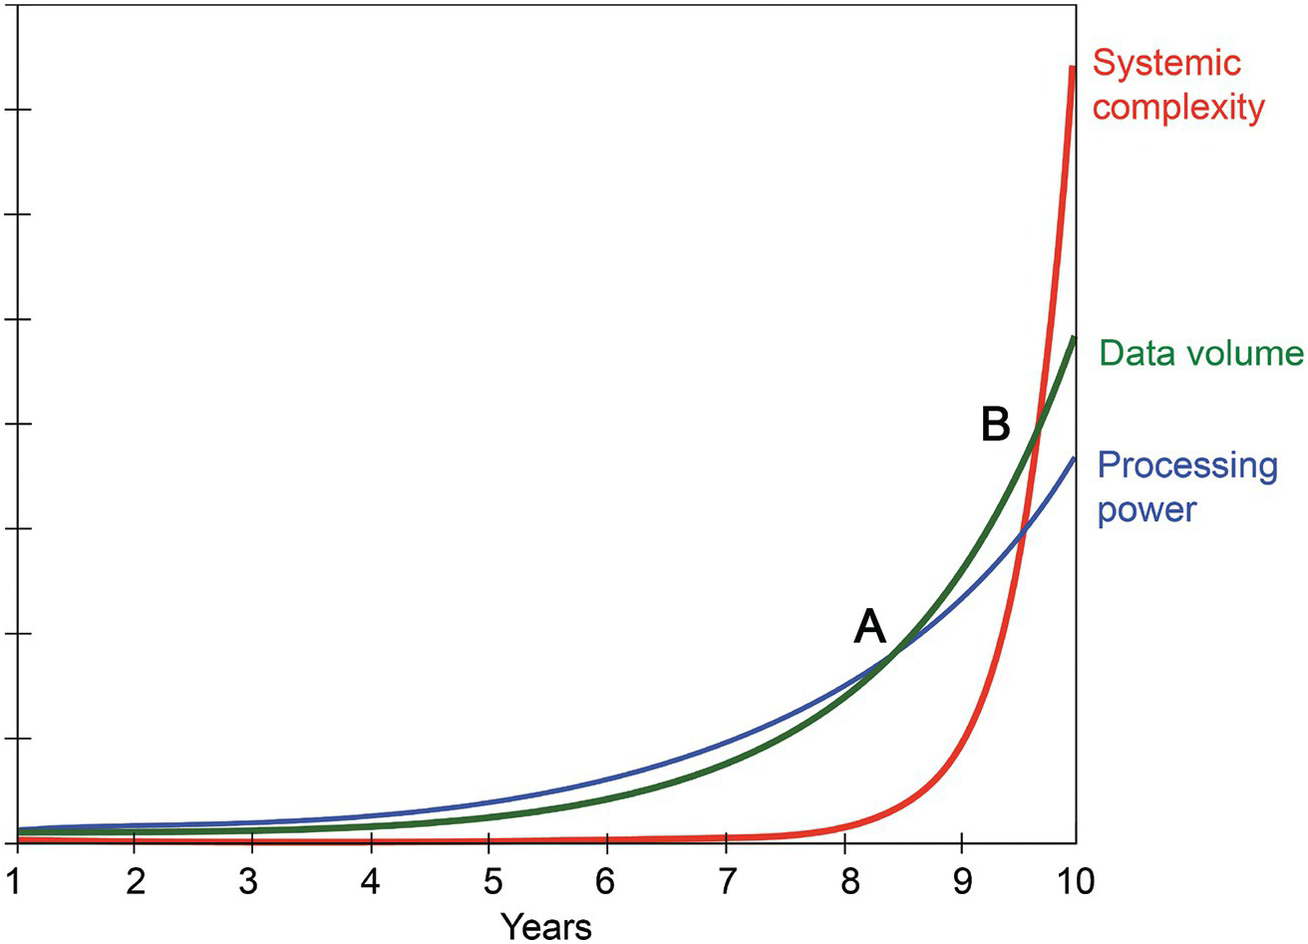
Figure 20.2 Relationship between the increase in processing power, data volume, and systemic complexity.
The reason is that both the data volume generated by our societies and the (combined) system complexity (owing to human intervention in the system, see Chapter 15) are increasing at rates far in excess of the increase in processing power that follows Moore’s law (Figure 19.2). Even with the increase in information processing that it predicts, unintended, unknowable consequences would therefore still overwhelm the system.
Helbing therefore argues that instead of a top-down, centrally managed society, a bottom-up, self-organizing society can be developed based on a combination of big data, the Internet of Things, and AI, which will transform the economy, and through it, society.10
How would that work? A fundamental change in approach is a necessary part of this process, from a focus on entities and system components to a focus on relations and interactions.11 Another difference is that rather than force or nudge a system in an a priori determined direction, it would use the fact that forces within a system structure it very efficiently (but in ways not predictable a priori). The resultant dynamic structures tend to be more stable, he argues, than structures shaped from the outside. Our research would thus have to focus primarily on identifying the forces operating dynamically in a system, and on how change is driven by the system itself. And rather than adapt the system to desirable outcomes, we would have to shape desirability around the outcomes of the inherent dynamics. Helbing’s core thesis in this respect is that one can, however, let different outcomes emerge by slightly changing the interactions between components (in what he calls “assisted self-organization”). Contrary to the Hobbes approach, these interventions would be local and minimal (involving distributed control). In these circumstances, Helbing argues, such systems would not be totally unpredictable, as they would tend toward a limited number of dynamic attractors, and in many instances would return to them after a disruption. Though formulated in the context of a future under the impact of the ICT revolution, these characteristics are of course inherent in any bottom-up structuring of our future societies.
What is the role of ICT in this context? One would have to be able to identify composite patterns made up of elementary entities by not focusing on improving the condition of individual entities as we commonly do, but on obtaining system-wide benefits. And that would, in Helbing’s world, be enabled by the Internet of Things, direct communication between the objects that determine such an important part of our human behavior, allowing them to make their own decisions unimpeded by human beings and to take many dimensions into account that humans cannot at any time relate interactively because of the limitations of their short-term working memory (Chapter 8).
A very interesting conclusion of his dynamic (traffic) modeling studies is that optimization of local collective benefits does not seem to lead to large-scale coordination when the interactions between the system’s components are strong. This restates the thesis of Granovetter (Reference Granovetter1973) that weak ties are more important in structuring a system than strong ones. And that conclusion in turn reinforces the multicentric approach to societal regulation proposed by Ostrom and her students that I discussed in the last section (Ostrom Reference Ostrom1990; Ostrom et al. Reference Ostrom, Gardner and Walker1994), while at the same time pointing to the instability of hypercoherent systems, and reinforcing the arguments of Polanyi and others (Chapter 18) that reducing the dimensionality of community values too strongly generates strong social instabilities.
This general approach raises the very interesting, and hotly debated, question of humans’ tendency to often collectively balance the advantages of the individual and those of the group in favor of the latter. I do not want to enter that debate, but I do want to point out a couple of interesting things about it.
First, it turns out in the simulations that Helbing presents that random interactions in an open space or network, between (1) people favoring cooperation, (2) people avoiding cooperation (“free riders”), (3) people sanctioning the avoiders, and (4) people not sanctioning the avoiders, results rather easily in a tragedy of the commons (individual behavior undermining the collective good), but within a confined space or cluster in a social network, the opposite happens and the common good prevails.
Another interesting result is that when it is possible for individuals to move around between different networks, this leads to cooperative clusters that emerge during the spatial organization of the population, because the behavior of individuals is determined by the behavior in the individuals’ surroundings. Thus, when people can move around freely, this promotes cooperation when the individuals can be integrated effectively in groups.
Clearly, these are results of a number of modeling exercises, and as such have yet to be scrutinized and should for the moment be taken as hypotheses. But it is interesting to associate these results with those mentioned in Chapter 11 concerning the emergence of social networks as a function of percolation theory. Together, they seem to indicate that there are limits to the extent of cooperation that can be achieved as a network grows in size.
Based on these results, as well as those of Elinor Ostrom about the management of common pool resources (Ostrom et al. Reference Ostrom, Gardner and Walker1994), Helbing comes to the conclusion that bottom-up coordination of self-organizing societies is indeed possible, and (in his eyes) preferable to top-down controlling of such societies, but that when the groups become too large, and interact with too many random participants, there comes a tipping point where cooperation in the group decreases.
In the remainder of his book, Helbing outlines a number of properties and developments that would enhance the stability and scope of such bottom-up cooperative systems. I mentioned those that are in my opinion the most relevant in Chapter 18, based on my own vision rather than Helbing’s. Here, these concern me less than the general conclusion that bottom-up-based self-organizing systems can more realistically integrate ICT-based tools than top-down-based control systems. For our purposes, this means – I cannot repeat this enough – that to achieve some kind of resilient future for our societies we must actively promote bottom-up approaches to gain a more balanced development than is currently under way top-down, driven by the large ICT companies.
The New World: How Might the ICT Revolution Impact on Society?
In 2016 the director of MIT’s Media Lab (Ito) and one of his colleagues (Howe) published what is to my knowledge the first inside story, written for non-technical people like myself, of the fundamental cognitive, intellectual, societal, and practical changes the ICT revolution is currently driving and imposing (Ito & Howe Reference Ito and Howe2016). Clearly, this is done from a perspective that the ICT revolution is unstoppable and that its progress will transform the world. I have argued in Chapter 19 that that is an assumption that in theory need not be either true or positive for our societies. But for the moment their assumption is certainly interesting, and I have therefore decided to end this part of the book with a critical examination of their perspective, following the nine different fields of tension that they expose.
Emergence and Authority
I argued in Chapter 6 that we need to complement an a posteriori, linear perspective on the past and the origins of the present with an a priori one that is focused on the emergence of the present in a multidimensional space. Ito and Howe take this as a starting point of their argument, but add an important element to it: the fact that the linear perspective is anchored in a hierarchical worldview that is, in turn, deeply anchored in our Judeo-Christian tradition: we are supposed to lead a life that is designed and prescribed by a religious authority or, in its modern form, anchored in ethics ultimately derived from that authority. The newly developing approach they are writing about, anchored in – or at least strongly favored by – the ICT revolution, will enable the opinions of the many to complement, and possibly overcome, those of the few that have until now set the ways in which our societies were evolving. From a world driven by the information processing of the few, we are crossing a tipping point and moving into a world of collective information processing that will be able to deal with much larger information loads than our societies have managed thus far. By implication, the transition that is currently going on is seen as a consequence of the fact that our means of collective information processing are inadequate for the rapid rise in the global population of the last half-century. If this development continues, Ito and Howe argue, one can expect humanity to develop into one (or several?) meta-organism(s), which represents a further step in the percolation approach I described in Chapter 11.
Ito and Howe (Reference Ito and Howe2016, 37) call this new form of collective information processing “emergent democracy,” and expect that it will ultimately replace what we currently call our (representative) democracies. In Chapter 18 I signaled the beginnings of this process: the traditional role of political parties (and representation) is no longer needed in the context of politicians reaching out directly to their electorates. It is based on the fact that no individual or small group has ever been able to fully impose a particular kind of behavior or decision-making by controlling the information that is available to others in a society. In the current information-processing regime this is even less true than it has ever been before. Rather, in such an “emergent democracy” (or maybe better a “democracy of emergence”) the behavior of the collective emerges from the interactions of all its members.
Individuals’ “power over” is replaced by the collective “power to” of the society as a whole (see Foucault Reference Foucault, Dreyfus and Rabinow1983). Such emergent systems presume that every individual within a group possesses unique intelligence that would benefit the group.
In the process of bundling that collective intelligence, a much wider value space and innovation space are opened up. Ito and Howe present the contrast between the Encyclopedia Britannica and Wikipedia as a good example of this kind of transition, which is also widely documented in many biological systems. Such information-processing tools as Wikipedia are enabled by the huge reduction in the cost of innovation processing achieved by (almost completely) separating information from its energetic and material substrates.
Pull and Push
Part of our hierarchical (authoritarian) approach to governance and (more widely) instantiation of ideas is the fact that ideas are “pushed down” from the top of a hierarchy to the level where they hit the real world. In Whiplash (2016, chapter 2, 61–81), the authors argue for the importance of “pull”; that is, allowing ideas to emerge from the bottom to the top. On this theme, they substantially draw on the work of John Seely Brown et al. (Reference Brown, Davidson and Hagel2012), but give the example of the way in which a worldwide network of people with different skills responded to the Fukushima earthquake much faster and more efficiently than either the business world (in the form of TEPCO, the company responsible for much of the disaster) or the Japanese government.
The essence of this idea derives directly from the last one: the wider world has more ideas than any organization, and mobilizing these ideas is therefore a more effective way of reacting to events than the traditional, hierarchical approach or any other organized one. It is more flexible, demands less investment, can respond to a much wider range of events, and, above all, is not limited to anticipated events and responses, but adapts to the real needs of the moment. It mobilizes resources just in time, only for the time necessary, and relinquishes them as they are no longer needed. I argued (in Chapter 16) that under the impact of the Industrial Revolution and its reduction in the cost of energy our current society has hugely accelerated invention and innovation, and, in the process, also increased the speed with which markets are able to create and meet the need for any innovation. The complex dynamic driving these developments has created our current resource-to-waste societies and the sustainability conundrum. Returning, as Ito and Howe argue, to need-based innovation would in my opinion be a major step forward toward global sustainability.
Another aspect of this change in approach concerns motivation. Although our current western system strongly attaches motivation to financial reward, this is certainly not the only motivation that counts for many people. Much of what has happened in the Internet-based Open Source movement, including Wikipedia, Twitter, and Bitcoin, as well as in the non-governmental organization movement, is based on the fact that people are in search of a personal identity that is satisfied by performance, or in a wider sense making a contribution to a collective goal. In that context, bundling the efforts of many people into a collective achievement, as proposed by “pull over push,” is a very strong driver of innovation. This is also demonstrated by the recent emergence of both crowd-funding and crowd-sourcing as major movements strengthening what is happening in cyberspace in terms of innovation. The authors of Whiplash conclude:
As the cost of innovation continues to fall, entire communities that have been sidelined by those in power will be able to organize themselves and become active participants in society and government. The culture of emergent innovation will allow everyone to feel a sense of both ownership and responsibility to each other and to the rest of the world, which will empower them to create more lasting change than the authorities who write policy and the law.
And in that process, as Granovetter (Reference Granovetter1973) mentioned, one’s acquaintances often end up playing a more important role than one’s friends. But to enable that to happen, one needs to combine creating a network with many such weak ties, and a vision that is reactive to the kinds of occasions that can put such a network to good use.
Compasses and Maps
Innovation is fundamentally open ended and ontologically uncertain. One never knows what the result will be of the emergence of the new, as that engages in a dynamic with novel attractors and new dimensions of perception and action. Hence, Ito and Howe argue that a precise roadmap is less valuable than a compass that shows one the direction in which one can move, but does not fix the path or the endpoint of an innovative trajectory. In their terms:
A map implies a detailed knowledge of the terrain, and the existence of a [known] optimum route; the compass is a far more flexible tool and requires the user to employ creativity and autonomy in discovering his or her own path. The decision to forfeit the map in favor of the compass recognizes that in an increasingly unpredictable world moving ever more quickly, a detailed map may lead you deep into the woods at unnecessarily high cost. (Ito & Howe Reference Ito and Howe2016, 89)
In business, as in academia, this distinction is commonly discussed as that between a vision and a plan. A vision is a long-term general idea of where one would like one’s effort to lead, whereas a plan is a fixed way of achieving a particular goal. Both have their uses, but when the goal is emergence of novelty and the means is bundling the ideas of many to deal with an uncertain future, the vision is more useful in guiding the effort than the plan because it directly reflects values, which provide a better, more profound, and more flexible compass than the plan.
One can also express this as the distinction between exploration and exploitation. It is essential that a system or a group of people has both capabilities. But at present, in our society, the core is essentially focused on exploitation (even as, in the oil industry, this includes major exploratory efforts that are directed toward creating the possibility to continue exploiting the same resource). Academia, government, and business are essentially (and increasingly) focused on finding new ways to exploit known resources, techniques, values, and knowledge. This is one of the implications of the “closure of our value space,” which I mentioned extensively in Chapter 16. It is only in the margins of our societies that true exploration takes place, such as occurs at the Media Lab of MIT, in corporations such as Google for example, and increasingly in many, many small startups. In that context, it is relevant to look at the arts as a major domain of experiment and innovation.
We saw in Chapter 6 that to think about the future we must enhance the number of dimensions we consider. Rather than start reasoning from a fixed end-point (ex post), we should start reasoning ex ante, with the arrow of time and focused on the emergence of novelty.
To imagine the simultaneous interaction between several dimensions is difficult in an oral or written (linear) mode but is much easier by means of images or other forms of art. Therefore, I think art is essential to help scientists develop this kind of emergence perspective.
Moreover, as scientists we have been notoriously bad at communicating our ideas to the nonscientific world. Sustainability science has for thirty years been predicting doomsday, but little collective action has been taken. I think that this is in part because we did not engage the wider public. As scientists we were talking at people, rather than interacting with people. It is now urgent to promote a change of general mindset that can avert disaster. To do so, we need to have a message that is easy to understand. In some cases, this can be a narrative that appeals to underlying values, but in other cases, this is better done with art.
As a consequence of “freeing the animal spirits” (Keynes Reference Keynes1936, 161–162) in the way Ito and Howe propose, our societies would greatly enhance the dimensionality of their value space and thereby enable themselves to change direction in a constructive, environment-conscious way. Without such an increase in dimensionality, that seems impossible because the path dependency of our current system has created a situation of hypercoherence that makes it very difficult to conceive of changing its current direction.
And this brings me back to a point that I raise a number of times in this book: the need to drastically change our education systems by emphasizing learning over teaching. For professional educators, that also includes learning to listen rather than to talk, respecting the opinions of students (and the wider population), rather than imposing their own ideas, etc. To begin with, it also means allowing, or even creating, diversity of opinions in class, and reinforcing the idea that there are always alternatives and different ways to achieve a vision.
One of the core ideas Ito and Howe develop is that computers allow humans to deal with much more complicated ideas and models than the human mind can, whether individually or collectively. That capability further enhances the dimensionality of our societies’ value spaces and the range of tools for thought and action that our societies can develop. Rather than functioning as tools that execute human instructions according to a map, computers can become interactive partners with humans in developing new ways forward with the help of a compass. In that light, one can see the (huge) impact of a program such as Scratch, “which, rather than teaching young children to code, leads them to code in order to learn” (Siegel Reference Siegel2016, quoted in Ito & Howe Reference Ito and Howe2016, 106).
Risk and Safety
I argued in Chapter 12 that our current societies have a tendency to assume stability and study or bring about change. Rather than adopt this approach as the only perspective (following Aristotle), I argue that we should complement it with the Heraclitan approach that change is omnipresent in nature, and stability is (temporarily) imposed by human beings. In effect, both approaches are necessary to understand the complex regulatory dynamics that are responsible for all socioenvironmental interaction, as such interactions generally follow a punctuated equilibrium dynamic.
Risk and risk perception play a crucial role in such a shift. Following Atlan (Reference Allen and Hoekstra1992), I have attributed the risk-adverse tendency in our societies to limitations of our human cognitive system, which biases human information processing toward underdetermination of ideas by observations and their overdetermination by past experience. Ito and Howe argue that the ICT revolution is changing that. They argue (2016, 116) that different risk calculations are at the root of favoring a perception assuming stability or one assuming change, and that the ICT revolution has changed the risk calculus in our society. Their argument runs like this. With a high cost to bring a novel product to market, for example because a large integrated company has to be geared to making the product, it makes sense to favor safety over risk and thus move more cautiously. But with the huge decrease in the cost of innovation that is triggered by the ICT revolution, it makes more sense not to do so, but to outsource the production by quickly assembling an effective supply chain, and thus beat the competition on speed. Hence the ICT revolution favors rapid change, taking risks, and using or developing very light and often temporary organizations.
Clearly, any risk is dependent on the material and social investment made, as well as on the uncertainty involved, so if the investment is small the risk is too. The greater the investment in a cognitive, social, and/or material structure, the greater the risk taken, and the stronger the tendency toward conservatism. If, on the other hand, the investment is small, so is the risk, and it is easy to favor risk-taking and change. An important implication is that rather than see change as a challenge, we are inverting our perception, accepting change as the norm. Indeed, we are living in a period characterized by rapidly increasing volumes of available information and unbridled, accelerating change. This favors creating an intellectual and organizational climate that allows people to overcome the inertia involved in a relationship between information and knowledge that is underdetermined by observation and overdetermined by routines that were successful in the past. That climate is the most important asset of the Media Lab of MIT.
I accept Ito and Howe’s argument about the risk calculus, but I still maintain that for the moment at least – pending huge steps forward in dealing with the big data revolution – Atlan’s argument is valid for human societies at large, and that there is thus a long-term bias toward continuing on existing trajectories. That raises a question about whether our societies will at some point need to slow down again, as argued by Daly and others. If so, we would have to deal with stability rather than change as the challenge, finding ways to favor it and to slow down the current, ICT-driven acceleration. In today’s neoliberal capitalist system that seems far-fetched, but then the historian in me says “We’ve seen more drastic changes in history.”
Disobedience and Compliance
Ito and Howe begin chapter 5 of their book (Reference Ito and Howe2016) with a reference to Kuhn’s Structure of Scientific Revolutions (Reference Kuhn1962), and argue with him that fundamental changes in approach (so-called paradigm changes) are due to people not following the rules of their community, whether these are scientific, civil, cultural, or legal. They illustrate this extensively with examples from their domains: business, industry, and research. The ICT revolution has currently indeed put an emphasis on innovation and disruption, and on creating a climate of not following the rules. But interestingly, fifteen years later Kuhn published a volume called The Essential Tension (Reference Kuhn1977), in which, in the form of several essays, he emphasized the complementarity of disobedience and compliance. Neither can exist without the other. There are times when disobedience is fundamental for a society and others when compliance is. The Resilience Alliance’s lemniscate (Chapter 5) symbolizes this by pointing to the fact that as the information and energy flows reach a point where they cannot further expand in a socioenvironmental structure, a phase occurs in which the system falls apart into component, much smaller, elements that begin experimenting with different organizational forms. Elsewhere I have linked the transition between an expansive and a fragmenting phase in the resilience cycle to the explosion of unintended consequences that is the result of the system’s earlier decisions (Chapter 15). But whichever explanation one favors, over time socioenvironmental systems tend to (re)structure after a phase of exploration and fragmentation and, for a while at least, tend toward stability (see Monod Reference Monod1971). I presented the history of the Western Netherlands in this light in Chapter 10. Thus, while I agree with Ito and Howe that we currently experience a transition in which disobedience is particularly valued, from the long-term perspective that is mine as an archaeologist and historian, unless the ICT revolution fundamentally changes that pattern I would expect that over time our societies will again find ways to deal with the overwhelming amount of new data and new ways to process information that they are currently encountering, and thus shape a new information-processing structure that is stable for some time. What that will look like is anyone’s guess, but it will probably involve a closer integration between human and electronic information processing.
That being said, I agree that at this point in our trajectories, to free up the “animal spirits” is fundamental. Our current education systems in developed as well as many developing countries – apart from exceptions such as Dalton or Montessori that favor learning over teaching – are probably the most important institutional barrier to doing so. In the domain of education, from start to finish – that is from kindergarten to, and including, adult education – we need to make better use of the many other ways of learning that abound in the world. A massive effort is needed to bring human information processing in tune with its electronic counterpart. From their earliest years, our children are brought together in groups with two purposes that are at right angles to each other: socialization and development of learning. Teachers mostly vector these two goals by socializing the children around a set of externally derived values (“truths”) that reduce the natural diversity of their thought, favoring conformity above creativity. Once children enter primary schools, tests and exams continue that process of alignment, which is suitable when one lives in a period of relative stability but which is not adapted to the contemporary ICT revolution. Later in life, career structures in most places in developed countries effectively maintain the pressure to conform.
To transform this situation, one should emphasize that in any situation there are always alternatives, and to stimulate learners to explore and compare those before making decisions. Informal learning as it occurs everywhere in the world is a major asset to achieve this, and this is insufficiently recognized by formal educational institutions.12 A much closer link between formal and informal learning would quickly enrich the experience of millions all over the world, both among those who are now subject to mainly formal education and for those who have had no such training, but have educated themselves in real life. The current KLASICA project (https://klasica.org/about-us/) is an important effort in that direction.
Practice and Theory
Chapter 6 of Ito and Howe (Reference Ito and Howe2016) is essentially an argument in favor of learning by doing, rather than learning through theory, by reading or otherwise. “Putting practice over theory means recognizing that in a faster future, in which change has become a new constant, there is often a higher cost to waiting and planning than there is to doing and then improvising” (Ito & Howe Reference Ito and Howe2016,158). Of course, that enhances the chance of failures, but rather than consider them as such one tends nowadays to see failures as learning opportunities, removing the opprobrium that failing used to have and replacing it by learning or experimenting, which both have positive connotations.
This chapter of Ito and Howe (Reference Ito and Howe2016) echoes a number of the assumptions I have outlined elsewhere in this book. Referring to Chapter 12, it implies an emphasis on the high-dimensional polyinterpretability of phenomena and things against the reduced dimensionality of theories.
Even at best, learning in theory only relates the mind to a subset of the dimensions of reality, and is thus less effective in gaining insight into the complex patterns of relationships that make up reality.
Their chapter also relates to the section in Chapter 17 that deals with the progressive distancing from the real world that is driven by our media and computer games and, finally, it relates to the core of the cognitive dynamic that drives socioenvironmental coevolution in which reality and practice never completely project onto knowledge, so that knowledge is enhanced by its interaction with practice (Chapter 9).
One very important aspect of learning by doing that I have not emphasized before is that it trains the mind to see relational patterns that place the subject one is learning about in a wider context. Rather than create clarity by excluding all but a small number of observed dimensions of phenomena as “noise” – as happens often in the development of scientific theories – learning by doing trains us to first of all observe the multidimensional patterns of relationships among phenomena as they are manifest in the real world, and then to proceed to build our understanding upon those observations instead of isolating entities in our observations and our thinking as we do in our western scientific approaches. Training the capability to see things as complex relational patterns is precious in the context of the dynamics needed to cope with the ICT revolution. It is that relational perspective that naturally leads us to develop the multidimensional “pull over push” attitude that Ito and Howe emphasize, as well as the emphases on diversity over ability, resilience over strength, and systems over objects that are the subjects of the next paragraphs.
Diversity and Ability
Much of our social structure in science, business, and other domains is currently based on an assessment of people’s ability. We give Nobel (and other) prizes to people because they innovated, but we attach to those prizes the label that these people are the most intelligent, the best performers, people able to deal successfully with the most difficult topics, etc. Remuneration is based on ability, and so is social recognition. Hence, the role of individuals is emphasized in many domains in our society – whether in business or in the arts or in academia.
In their chapter 7, Ito and Howe (Reference Ito and Howe2016) propose a very different approach. They argue that whatever a person’s ideas or capabilities are, in large measure they are determined by the network in which he or she functions.
The difficulty of maintaining secrecy in the Internet society has prompted a debate on the validity of assigning intellectual property rights to individuals or teams without taking into account that the interactions of those people or teams with others, over long periods of time, have contributed to their achievements. According to Ito and Howe, once one adopts a relational perspective, emphasizing teamwork and the contribution of everyone’s actions and ideas in the network in which people are functioning, as well as spreading information for collective benefit rather than hoarding information for private benefit, the diversity of the participants in an effort becomes more important than the ability of individuals. This is a direct implication of the fact that the network approach inherently emphasizes a highly multidimensional approach to thinking and acting, which is essential for communities to function well. The basis of this approach is that every individual develops his or her own distinctive ways of thinking, and that bringing these together (bottom-up) is a more effective way to guarantee success than relying on a small number of selected individuals, even if they are considered to have particular abilities. In the ICT community, this approach has led to the successful implementation of crowd-sourcing, for example in scientific domains such as microbiology (see the FoldIt experiment to request participation of the gaming community in solving a challenge that was escaping the scientists and their computers), and in crowd-funding, where many startups now prefer to gather their first funds by soliciting small contributions from numerous participants, rather than depending on venture capitalists and becoming beholden to one or a few individuals or companies.
The ICT revolution has opened the possibility that many individuals can contribute to, and also share in, the results of, collective efforts based on their individual capabilities and wishes. It has proven itself to be a powerful tool to harness ideas, but also to spread wealth rather than allow it to accumulate in the possession of a few individuals. In my opinion this is therefore a very interesting potential antidote to the reduction of our value space to a single lowest common denominator (wealth), which we have identified as the corollary of globalization. It rewards people’s identity, stimulates their interest and creativity, and thus adds very different rewards to participation than mere wealth, while maintaining people’s independence. It would in all probability also reduce the wealth gap that is hanging over our global societies. It is an excellent example of Granovetter’s (Reference Granovetter1973) theory about the importance of weak ties. As a result, “the best way to match talent to tasks […] is not to assign the fanciest degrees to the toughest jobs, but rather to observe the behavior of thousands of people and identify those who show the greatest aptitude for the cognitive skills that the task requires” (Ito & How Reference Ito and Howe2016, 179).
Resilience and Strength
Chapter 8 of Ito and Howe (Reference Ito and Howe2016) argues that opening up the value space of communities is exactly what contributes to their coherence and resilience – the higher the dimensionality of the value space, the wider the range of potential ways to absorb any negative impact on a society and then rebound. Building strong organizations was a very effective way to ensure survival in a relatively stable system, but in the current very rapidly changing system flexibility is a more effective survival strategy. That has been facilitated, argue Ito and Howe, by the important reduction in the outlay required for change that is the result of the ICT revolution, so that rapid changes, even if they entail a loss, can be overcome rather than sinking the enterprise.
This argument clearly resonates closely with the one they present in their chapter 4, risk over safety, but it allows me to draw attention to another aspect of the shift in attitudes that is triggered by the ICT revolution: a shift from building on an a posteriori perspective in dealing with the future of a company, thus striving toward continuity, toward developing a number of potential a priori perspectives by generating multiple future projects (of which a substantive number are sure to fail, but some might succeed). In the process, feedforward (anticipation) and out-of-the-box thinking are given more important roles alongside the omnipresent idea of feedback, and as a result the way is open for change. I placed the importance of this shift in perspective in Chapter 6.
Systems and Objects
Under this heading, Ito and Howe (Reference Ito and Howe2016, chapter 9, 214–231) return from a different angle to the distinction between the focused, subject- and entity-directed perspective versus the context- and relation-based perspective that was one of their earlier topics, stressing the importance of gaining from the outset a high-dimensional grasp of complex real life patterns, rather than (as the western empirical tradition does) decomposing that complexity into simpler subsets, and then hoping that the understanding thus gained provides an insight into the overall complex phenomenon.
Here it is not the perspective itself that is discussed, but its consequences. The authors draw attention to some of the issues involved in trying to solve what they call intractable problems – which others have called hairy or wicked problems – where it seems necessary to discover all the building blocks in a complex system (Chapter 2). Very important “is the subtle but incredibly important distinction between inter-disciplinary and anti-disciplinary approaches […] that requires the reconstruction of the sciences entirely, the creation of new disciplines or pioneering an approach that eschews disciplines altogether” (Ito & Howe Reference Ito and Howe2016, 219). The fundamental trait of such an approach is that it does away with objects of study – that it studies phenomena in vivo, focuses on processes rather than products, uses a high-dimensional conceptualization that goes against the reductionist trend of western science, and focuses on the systems studied as part of larger systems.
Ito and Howe illustrate this with the example of designing appropriate street lighting in Detroit, emphasizing that any innovation is bound to change the system in which it is embedded (Ito & Howe Reference Ito and Howe2016, 225), and that therefore we should shift from design to codesign to ensure that any innovation is compatible with the socioenvironmental system of which it is to be part.
Conclusion
In this chapter, selecting specific works of earlier scholars, I have tried to make the argument for the need of a different approach to our common future and to outline various authors’ ideas about how to achieve that. The main purpose of the first part of the chapter was to raise the kinds of questions we have to take into account in making decisions about the way forward. My main personal conclusions are that:
a. It is not realistic to expect that we could achieve a zero-growth or degrowth dynamic in the short term. The only way to come to that point would be to slowly but surely redirect our present (and thus our longer-term future) toward green growth – growth of a completely different kind: dematerialized and based on a fundamental change in the structure of our value space.
b. It seems that efforts to further globalize the scale of our economies and/or our governance structure (for example by using ICT) will increasingly butt up against identity and other issues that are related to the difficulty of maintaining for large groups the combination of high-dimensional value systems and the frequency of communication that is necessary for the creation and maintenance of flourishing, highly resilient communities. A tendency toward polycentrism is the result. The top of our governance levels are likely to lose control over many dimensions in favor of lower levels. In the European Union this has been going on under the label of subsidiarity. It is also likely to occur in the USA, with a shift away from federal to state authority, while China will continue to operate a semi-decentralized structure with high autonomy for its regions. This devolution of power might ultimately make (large) cities the most cohesive governance units.
c. Nobody can predict with any certainty how the coevolution of ICT and our societies will evolve and will affect their sustainability. Major transformations in both are a certainty. But one thing becomes clear: there is an important potential for the ICT revolution to help us deal with some of the major issues involved, but that will minimally require (1) gaining more insight in the societal dynamics involved, (2) exercising political and technical control over the ICT development, (3) improving the integration between human and electronic information processing, and (4) undertaking the complete restructuring of our education systems and their curricula, including universities and research organizations, to promote undisciplinarity. That is where some of these developments must, and can, begin.
d. Last but not least, it is the responsibility of the current crop of sustainability scientists to finally acknowledge that our sustainability conundrum is not an environmental one, but a societal one (see Dyer Reference Dyer, Jones and Murphy2009). Social scientists should take the lead in this, and reconceptualize the current approach to sustainability issues accordingly, looking not only at greenhouse gases, but taking the whole of the socioenvironmental system dynamics and their coevolution into account.
What Is the Message Thus Far?
The main message of this book is that we need to bring together a Complex Systems approach, a focus on Information Theory and the dynamics of information processing, and the long-term study of invention and innovation as seen from an emergent, ex-ante, perspective to study system trajectories from the past to the present, instead of explaining the present by invoking the past. This perspective avoids the trap of much current science, which presents linear arguments about cause and effect in a limited number of dimensions. The dynamic socioenvironmental system of which we humans are a part is in the true sense of the phrase a complex system and should be studied within a theoretical framework that is appropriate for such phenomena. Hence, I have tried throughout this book to emphasize that approach, which enables us to develop a much more intricate, holistic perspective that intellectually fuses information obtained in a wide range of disciplines.
Another important and encompassing message of the book is the fact that our sustainability conundrum is a societal one and not an environmental one. Our societies have created the current degradation of the environment, from CO2 emissions to waste dispersal around the world. They have defined what they considered their environments, what they thought they could extract from them and dump in them, and later what they saw as their environmental problems. They currently try and find solutions for these challenges by mitigating the impacts they have on that environment, but often (though certainly not always) without a more fundamental analysis of the dynamics involved, so that many solutions remain relatively superficial.
Moreover, the disciplinary and reductionist nature of much of our current science means that we look at the challenges and potential solutions in a disciplinary manner without being able to transcend the different disciplinary approaches and develop a holistic perspective. In particular, sustainability has for a considerable time been predominantly investigated and researched by the natural and life sciences without any contribution from the social sciences. In more recent years, the latter have now been solicited to make a contribution, but in many instances the questions they were asked to respond to were ultimately defined in terms of those natural and life sciences, rather than encouraging the social sciences to develop their own perspective. That is beginning to change, and this book hopes to contribute to that change, in particular by defining sustainability as a societal challenge rather than an environmental one, and thus subject to the societal, political, economic and commercial dynamics occurring globally.
Indeed, once one adopts such a societal perspective on the great acceleration of resource depletion, pollution and destruction of, for example, the world’s biodiversity, another great acceleration hits our radar screens – that of the rapid increase in technological innovation that is currently manifesting itself, after two and a half centuries, in the material and energetic domains – notably in the domain of information processing. It is my contention that this acceleration – called the information and communications technology (ICT) revolution throughout this book – will so rapidly and drastically change our current societies and their institutions that it needs to be seen and investigated alongside the environmental challenges we are facing, because the latter will have to be dealt with by future societies very different from our current ones.
In order to put this ICT acceleration in a proper perspective I have argued for combining a number of different, or at least infrequently used, perspectives on the topic. These include a different role for science in the current social and political context, in which science risks losing some of the trust it gained in the middle of the last century. Another part of this novel scientific perspective is using a Complex Adaptive Systems approach that looks at the history of our societies and environments from an a priori perspective, searching for the emergence of change as it occurred and occurs through time, rather than an a posteriori perspective that looks at the origins of the present against the arrow of time.
I have further argued that one must apply a long-term perspective to the evolution of our socioenvironmental systems for three reasons. The first of these is because some of the dynamics, both natural and societal, are very slow and only perceptible over millennia. Secondly, a short-term view of such long-term socioenvironmental processes is like looking at a very ill patient (our Earth system) without any inkling of what the patient looked like when it was healthy. Thirdly and importantly, because without adopting the long-term perspective one is not able to observe the “change of change,” the second order change that transforms the first-order dynamics over time. One therefore misses a major set of transformative drivers that play an important role, one that is only observable over many centuries.
Developing a long-term, global, and transdisciplinary complex systems perspective led me to search for ultimate rather than proximate causes for the emergence and decline of a wide range of societal phenomena – formulating a theoretical model that could indeed help me understand the dynamics of change in very different socioenvironmental systems, from past and present small-scale, local hunter-gatherer, and tribal societies to the incredibly complex globe-spanning societies of the present day. I found such an ultimate explanation when I realized that every society on Earth has always been an information society, because information is the only one of the three basic commodities known to humanity that can actually be shared among the members of a society. Neither energy nor matter can be shared because they are subject to the conservation principle.
Hence, I view human societal evolution as a feedback loop of the following kind:
Problem-solving structures knowledge —> more knowledge increases the information-processing capacity ––> that in turn allows the cognition of new problems ––> creates new knowledge —> knowledge creation involves more and more people in processing information ––> increases the size of the group involved and its degree of aggregation –> creates more problems ––> increases need for problem-solving ––> problem-solving structures more knowledge … etc.
For a major part of human evolution this dynamic was physically constrained by the capacity of the human brain’s short-term working memory (STWM) to deal with more than a few sources of information simultaneously. However, around 50,000 BP, roughly speaking, the human brain had evolved to a point where its STWM could deal with 7 ± 2 sources of information, and that set in motion a relatively quick expansion of the complexity of the challenges that humans could deal with, which I have here described as the (relatively rapid, and accelerating) development of tools for thought and action. These tools enabled human societies to organize their thoughts, their social organization, and their environment in ever more complex ways.
Taking this approach a step further, to the development of the relationship of human societies with their environments, I have then adapted Prigogine’s concept of dissipative flow structures (1977), defining them as dynamic structures in which a flow of information-processing (organizational) capability outward from a group or society is complemented by an inward flow of matter and energy that enables the society’s individuals to physically thrive. In the process, the feedback cycle driving such dissipative flow structures transforms the uncognized environment (chaos) into cognized knowledge (information-processing capacity).
I illustrated this by outlining how one may understand human socioenvironmental evolution on two different timescales, first the long-term of human cognitive and social coevolution over millions, and later tens of thousands, thousands, and hundreds of years, and then in more detail focusing on the succession of social, technical, and economic changes occurring over a couple of millennia in a particular region.
I then shifted back to theory and used simple models to clarify how I saw socioenvironmental evolution as driven by changes in information-processing structure within societies, leading to major institutional transformations. To begin with, I drew heavily on ideas developed by organization scientists about different forms of information-processing control structures: processing under universal control (in anthropology termed egalitarian), processing under partial control (also called hierarchical), and processing without central control (here called market-based). From a long-term perspective, the transitions between these kinds of information-processing systems are of particular interest, and I therefore looked at some of their affordances and limitations, which may have engendered transitions between these general kinds of structures. Initially, I did so from a percolation perspective, looking at communication in growing networks of interacting people. The networks involved are determined by two parameters, connectivity and interactivity (activation). Different proportions of both these parameters give rise to several states of the system, from highly localized and temporary interactions to localized permanent interactions, to a wider, but highly variable, activation of the network beyond the initial localized areas, and finally to the very sudden emergence of a network in which interactions can affect each other over very large areas.
Next, I have argued that this might be a way to look at the transitions between mobile small-scale societies, spatially fixed small-scale societies, a highly variable range of larger societies, and finally very large-scale (clustered) societies. Of course, this model is very abstract, but it merits attention in so far as it leads to further, more detailed, study of information-processing system state transitions that have occurred throughout human history. Within these variously sized societies, one can then observe some of the characteristics of the organization of information processing – and in particular the role of information processing under universal, partial, or no control. Looking at the characteristics of such systems independent of the nature of the nodes or the connections between them, we can outline how combining hierarchical and market-based systems (i.e., systems without overall control, in which actors only have partial knowledge) may have interacted to generate clusters of nodes that one could interpret as networks of towns. One can thus make a coherent argument for considering the major societal transformations that we know from archaeology, history, and anthropology as due to an increase in knowledge and understanding, and thus an increase in the information-processing needs and capabilities of human societies.
It follows from this basic model of information processing that invention and innovation are at the core of what has driven our societies’ coevolution between cognition, technology, institutions, economy, and environmental impact. I therefore next elaborated my perspective on invention and innovation, and in particular emphasized that our reductionist science has never really been able to deal with the process of emergence of new phenomena that is the main characteristic of invention and innovation. I have developed the argument that invention is a process of interaction between the realm of ideas (tools for thought and action) and the realm of the physical world and its phenomena. The centrality of my emphasis on information processing leads me to invert the traditional, positivist conception of the relationship between phenomena and ideas: objects are polyinterpretable and ideas give our perceptions of those phenomena temporal continuity and path dependency. The fundamental conceptual structure of tools for thought and action, and thus of ways of doing things, outlives objects and technologies even if in detail they are modified. Ideas determine how we look at things, what we see, and what we do not see. In the field of tension between ideas and phenomena, inventions occur owing to the interaction between both spheres that is fundamental to our basic assumption about the interaction between acquired knowledge and the observations in the real world that resonate with them, between the reality of the world out there and our perception of it, much in the way in which Laubichler and Renn, in their “extended evolution” (Reference Laubichler and Renn2015), outline the interaction between evolutionary control mechanisms and the niches with which they articulate. This is illustrated with an example from (traditional) ceramic manufacture.
One of the implications of this approach for our overall understanding of cultural dynamics is that we also need to change our perspective on change and its absence. Rather than assume stability and explain change, as we regularly do in our current scientific practice, we have to view both change and stability (innovation and its absence) as two states of the same regulatory system, and to understand technical or cultural traditions as circumscribed by the things people have never thought about, rather than defined by the tools for thought and action they have conceived.
To cap the theoretical chapters that I have summarized above, I have elaborated a dynamical model of the different transitions that may have led from a simple, egalitarian, rural, and isolated village society to a (proto-)urban network, with an emphasis on how the temporalities of environmental dynamics have slowly but surely been invaded and overtaken by the faster dynamics of the societies interacting with them. The transitions involved have at different times driven the members of those societies to make clear de facto choices about whether or not to participate in the novel dynamics driven by the spreading of activation nets. This was an occasion to emphasize the importance of the second order dynamics that can be understood if one considers a sufficiently long period of societal change, but that are often not taken into account because our models are confined to a century or two. But it also serves to demonstrate that one can in effect model these kinds of transitions as bifurcations occurring in mathematical models that are themselves content-neutral.
The remainder of the book is devoted to the coevolution of western societies from the Roman Empire to the present, and to the challenges that the present state of that coevolution poses for the continued existence of our current global mode of life, mainly from an information-processing point of view. This begins with a quick and very sketchy summary of the long-term coevolution of European society and its global environment, essentially viewed from the dissipative flow structure perspective, emphasizing that this history was not a continual progressive evolution of society, but a process in which phases of relatively uninterrupted, apparently stable dynamics alternated with clear tipping points at which novel resources, institutions, ideas, and societal dynamics emerged. At each of these tipping points we can identify the end of an era in which the existing mode of living outlived its optimal usefulness in dealing with an environment that had been changed to an important extent by the unintended and unanticipated consequences of its exploitation by a growing population. Whether the tipping point was triggered by environmental or societal dynamics, society had to shift from exploiting existing resources and adopted ways of thinking and doing to exploring novel approaches to interact with its environment and organize itself.
Although in the sustainability and global environmental change communities we have for some time now acknowledged that we are either close to, or at, a major environmental tipping point that threatens the continuity of our current way of life on Earth, we have not very often looked at some of the concomitant societal trends that may be driving our societies to their own tipping points, in the domains of demography, health, food and water, economy, finance, and others. I have tried to present some of these dimensions of our current predicament in an equally summary but poignant manner and attributed all of these so-called crises to one and the same second-order dynamic, the fact that our societal information processing apparatus has been overwhelmed by the unintended consequences of earlier (systemic or societal, unconscious or conscious) decisions.
Looking more closely at our incapacity to process the information necessary to deal with what is going on around us, I developed an argument about the drivers behind the acceleration we are currently living through. It seems to me that the discovery and harnessing of fossil energy during the Industrial Revolution removed the main constraint that had thus far limited the introduction of new inventions in society: the high cost in energy of implementing them. As more (fossil) energy became available, innovation in western societies accelerated. In the process, it affected the fundamental cognitive feedback loop that I have posited as responsible for the coevolution of society, technology, economy, and the exploitation of environmental resources. Early in that process, in the mid-nineteenth century, this acceleration also inverted the balance between our societies and their economies, from one in which the economy (in the form of exchange and trade) served society to one in which society became subservient to the economy, leading to the current free-market, capitalist approach.
Thus far, the speed of information processing in society had been limited by the need for society to adapt to novelty, and as that involved very large numbers of people, and network activation was for most of the nineteenth century limited to face-to-face and written communication, such adaptation was still relatively slow. That changed with the introduction of electrical means of communication (telegraph, telephone, etc.), setting in motion a wide range of inventions that ultimately also included the electronic processing of information, thereby enabling another quantum jump in the speed and efficiency of our societies’ information processing capacity and reducing its cost, paving the way for the developments that we now call the ICT revolution, and hugely accelerating invention and innovation in our societies as well as generating an overwhelming quantity of information. Not only did this development change the relationship we have as humans with space and time, but it also accelerated change in a number of societal processes that had been fundamental stabilizers to the existing societal order.
One of the important dynamics set in motion was the total loss of control over information processing, which in the heterarchical mode of communication that prevailed until the middle of the twentieth century, had ensured a degree of alignment of the members of any society around a set of values and ways to think and act. Now, anyone in the world can communicate with everyone. As a result, there is an exponential increase in different perspectives and values that are being transmitted. Hence, the boundary between signal and noise is to an extent disappearing, both nationally and globally. This in turn leads to increasing confusion and undermines the national and international orders among developed nations that, until now, have been based on (1) shared sets of values within each nation, (2) non-interference in internal matters between different nation-states, and (3) balance of power between nations or blocks of nations. We observe this currently in the emergence of alternative truths and international cyber-warfare.
An important aspect of this is the reduction of the dimensionality of our societies’ “value spaces” (the totality of the shared dimensions along which a society measures value), under the impact of globalization, to a single dominant dimension – the lowest common denominator shared by different cultures and societies: wealth. This global trend is rapidly accelerating wealth differentials both within and between societies, while at the same time so reducing the diversity of ways in which members of a society can affirm their identity that it is leading to the intra-societal conflicts we witness today with the rise of populist, extremist movements in many countries.
An interesting model of the situation in which we find ourselves as a result of all this is the lemniscate that summarizes the approach of the resilience community (see Chapter 5). After a phase in which both the energy and information flows increased continuously, and thus kept our societies more or less on track, we seem to be approaching a point where these flows no longer grow in tandem, and their growth no longer involves the whole of the members of society, creates fracture lines, and may ultimately be driving societies to the point where the highest levels of global organization may fragment into smaller entities.
To illustrate this fragmentation, I have briefly (and again summarily) described some of the processes that we can observe. First of all, there was the disintegration of the European political order that since the mid-seventeenth century was based on balance of power between nation-states and non-interference in the internal affairs of others. Next, political parties’ most important role – connecting people in power to their power base in the population – is usurped by social networks, with important consequences for the functioning of our democratic systems. Third is what I have called “the spectacularization of experience.” This process is slowly but surely detaching many people from the experience of reality, initially through increasingly intensive viewing of the media, and more recently by their spending large amounts of time on computer games.
The impact of the “big data” revolution is a fourth case in point. On the one hand, it has led to a huge concentration of power in the hands of a very small number of institutions, most of which are in private hands and can do with the information they gather more or less whatever they wish. But on the other hand, the collection of much more detailed data moves us away from the statistical approach to many domains such as insurance, medicine, agriculture, and others, where economies of scale prevail over detailed, adapted, small-scale information treatment. The issue here is that there is no government control over the use of these data to ensure that they are used to the benefit of all.
And finally, I have devoted some attention to the rapid emergence of automation, artificial intelligence and especially machine learning, which are clearly going to wreak havoc at some time in the future with our labor-based societies, creating important unemployment and annihilating the negotiating power of labor in the relations of production – if we do not in time find solutions to greatly elevate the level of general education in ways that promote human–machine collaborative problem-solving.
The fundamental and accelerating shift in information-processing structures that potentially risks overtaking societies’ speed of adaptation makes it likely that we are approaching a fundamental transformation of societal organizations. It seems on a collision course with the existing value space of our western societies and those cultures and nations elsewhere that are following the globalization trajectory. That value space, firmly anchored in the structure of a world that goes back to the Enlightenment, has not really evolved to the point that it can deal with the increase in information processing capacity that we have been seeing since 2000. This trend shall ultimately – and probably quicker that we expect – reach the developing world, where the technology is quickly having a growing impact. But in many parts of it, for example in sub-Saharan Africa, rural Latin America, and Asia, the local modes of human information processing are (fortunately?) still a barrier.
A major issue in thinking about the future is whether we should, or even could, slow down (or stop?) the current acceleration of technological and societal innovation. This would in my opinion either require an external constraint, such as a reduction in the availability of energy or an important increase in its cost, or an internal constraint, such as a move away from the idea that progress underpins all societal developments. Although the former may indeed occur at some unknown time, we cannot currently depend on it to change the course of our trajectory. This leaves us with the option to change both our western conception of the role of human beings and our idea that technological progress is unstoppable. But as this approach is very deeply anchored in our culture, changing it in a relatively short time would seem to be very difficult. Hence, I propose redirecting development in a more practical sense. This is not an original suggestion, far from it. I am here asserting my position in this field, and emphasizing the importance of the work already being done in this direction!
The process begins, in my opinion, with individuals in the developed world reengaging in the everyday dynamics of their societies, instead of leaving the management of these societies to delegates to whom they have essentially relinquished a very large proportion of their societies’ decision power. As part of that process, we need individually and collectively to conceive of plausible and desirable futures for our societies, and because of the current speed of societal change, in choosing between such futures we need to shift our attention from assuming stability and explaining change to the inverse: assuming and designing for change and studying how to achieve (temporary) stability.
The next level up concerns the rebuilding of local and regional communities that have been deconstructed and individualized by globalization and the concomitant reduction of the dimensionality of our societies’ value spaces. As part of that reconstruction, we need to correct the wealth discrepancies that are currently tearing many societies apart. In the case of cities, in which the articulation between the ideas and behavior of societies is constrained by material construction, this may also mean that designing for change takes a larger place in their governance and material structure.
And finally, at the global level, we will have to find ways to harness the added information-processing capacity rather than let it dictate the future of our societies. That can only be achieved by a closer interaction between human and electronic information processing, and by using the power of electronic processing in novel ways, rather than to simply accelerate current, precomputer kinds of procedures. For example, we could move away from the reductionist statistical approach to interpreting massive data and gear our computers to truly predict rather than explain.
All this leaves us with a question about our role as scientists. First of all, I think we have to accept that the trust in science, in many of our societies, has suffered and is declining because of overpromising on the part of scientists, unintended negative consequences of certain inventions, and in a more general sense the harnessing of science by industry (for innovation) and government (to justify unpopular decisions). To counter this, we have to reconsider the institutional context of science, its engagement with civil society, and its presumed – but fake – neutrality. After all, our methods may be objective, but the questions we ask are subjective and culturally determined. We have to shift focus from a posteriori science (focused on origins and ex-post explanations of how we got to this point) to a priori science (focused on emergence of new phenomena in the past, in the present, and in the future), and this entails a shift to Complex Systems Science, with the implications outlined in Chapter 7.
Finally, a last but essential point on this issue. As scientists, we must be ready to engage in society. We are citizens trained in science but citizens above all. Hence, we should play our role in guiding society. Rather than limit ourselves to presenting the conclusions of our analyses in the most balanced detail – for and against – we can, and must, share with society our ideas about possible challenges and solutions to the problems it faces. But we must separate the presentation of our science from that of our conclusions and opinions, so that it is crystal clear what is what.
In Chapter 20, I presented some examples of the very wide range of visions for our future that are extant in the literature. The main purpose of those presentations was to draw the reader’s attention to:
1 The challenges and issues involved in trying to stop the frantic race of our society to the destruction of our environment since developed societies have become subservient to economies, let alone any efforts to turn the clock back on the recent history of our societies.
2 The strong western cultural (“progress”) bias involved in such projects as implementing the United Nations’ Sustainable Development Goals (SDGs), a bias that might endanger the project itself because by the time (2030 or 2050) that the work is supposed to be done, many major societies in our world possibly will have very different cultural values than those on which the SDG project is based. The SDGs remain framed around traditional conceptions of economic growth, which are in turn embedded in the western economic progress vision, which has been adopted by most of the world’s governments. But underlying value conflicts are sure to impede their implementation, and top-down implementation may exacerbate those value conflicts, cause conservative cultural backlashes, etc.
3 The observation that continuing to globalize large parts of the world is in all probability not an effective way to try and master the challenges our socioenvironmental systems are facing, even if it sometimes seems as if the rapid developments in information processing would enable a global government. On the contrary, ICT developments seem to point to a fragmentation of world regulation and governance into a multipolar system, thus avoiding hyper-coherence and introducing a flexibility that takes local circumstances and cultural values into account.
4 A range of innovations in our ways of thinking and organizing ourselves that are the result of intensive interaction between human and electronic means of information processing. One of the interesting things is that these proposed changes, outlined in a recent volume by Ito and Howe (Reference Ito and Howe2016), converge substantially with the earlier chapters of the book, which were developed and written before I was alerted to it.
What Are the Chances of Success?
After lectures on the topics at the core of this book, I am often asked whether I am an optimist or a pessimist about the chance that human societies will survive the sustainability challenge. The question can be answered in many different ways. One of the simplest, which I often use after a long meeting, is that I am a long-term optimist as well as a short-term pessimist. The long-term perspective that is mine as an archaeologist shows that, until now, humanity has always been able to change its ways of thinking and acting when it has been forced to do so. But in the process of implementing those changes, there has often been considerable short-term collateral damage (as my US colleagues and friends would put it).
What brings me to this conclusion? If I begin with the short-term pessimism, it is rooted in the extent to which the global market-based system, and more importantly its ideology, ethics, institutions, and attitudes, have rolled over much of the world and are embedded in very powerful social and economic structures. The struggle to reduce CO2 and other greenhouse gases in the atmosphere, which is only one of the many consequences – rather than a cause – of the sustainability predicament we are in, shows us how difficult it is to change the course of our mammoth current socioeconomic (or should I say econosocial?) thinking and its institutional structure. If we succeed (and there are increasingly many signs pointing in that direction) it will have taken the world some sixty or more years, and yet we have not in any way dealt with the root causes of the problem. These may manifest themselves in a plethora of different crises to come, in virtually any domain we can think of: health pandemics, resource shortages, deterioration of the quantity and quality of the basic necessities of life such as food, clean air, and water, economic and financial crises, political instability, and so on. Unanticipated consequences of the increasingly rapid rate of innovation we have seen since c. 1750 in all domains is likely to overwhelm us in each of these – and many other – areas because our current global dynamic flow structure is simply unsustainable. Add to this the completely unpredictable but profound consequences of the ICT revolution, and it is easy to see that our global system has been at the edge of chaos, and is likely to be overwhelmed, if we let it continue on its current trajectory.
We effectively have to move our focus from progress, growth, competition, and individual satisfaction to community building, stimulating social (group) coherence, and multidimensional wellbeing. As expressed by Quinn in his magnificent novel Ishmael, we have to move globally from a taking to a leaving philosophy (Reference Quinn1995). Many authors, including Daly and Latouche who were extensively discussed in Chapter 20, have been proposing this for some time, ever since Malthus raised the underlying issue – the positive feedback cycle between demography and food production. But we have thus far set hardly any steps in that direction, except at the level of individuals and some small communities.
This move implies breaking the fundamental feedback loop that I have put forward as the driver of human coevolution, linking information, cognition, innovation, energy, and population size. There seem to me at present several ways in which such a break could theoretically occur, but only a few that have a realistic chance to occur during this century. I will look at the potential of each of these in turn.
Breaking the Fundamental Feedback Loop of Coevolution
Now let us look at potential reasons for long-term optimism. Clearly, a voluntary reduction in population increase worldwide is difficult to put in place and has a number of consequences that are contrary to our current western (and increasingly dominant) value systems. Governments in China and India have tried to reduce the rate of population increase, in China forcibly and in India by a mixture of enticement and enforcement, but with mixed results. In both cases the greatest challenge seems to be the emphasis on economic growth, as growing economies generally require demographic growth in order to sustain themselves. The only other road to reduction of population that has been widely discussed is a major increase in per capita wealth in the developing countries, which, according to demographers, would reduce the birthrate in those countries. But one may question whether that would indeed have the desired long-term effect if one looks closely at what has happened in the developed countries, where, over centuries and millennia the population has seen major increases, interrupted by relatively short periods of stagnation or depopulation. Moreover, population reduction is a kind of “sacred cow” in developed countries – a basic infraction on a fundamental individual freedom that is not often publicly discussed. Convincing people to voluntarily reduce the number of their children requires convincing them to fundamentally change many of their values. This leaves involuntary reduction of the population owing to environmental or natural factors, such as pandemics, famines, and similar drastic events, which while deplorable are highly likely to continue. But these are also in disagreement with the philosophy of developed societies and are therefore likely to be resisted (owing to efforts in the domain of health) or mitigated (by means of food transfers). Viewed over the long term, this poses the question whether the wealth accrued by the developed nations will continue to be sufficient to keep successfully fighting off such events. Wealth, we must remind ourselves, that is accrued by exploiting the resources of the developing world.
Another way to interrupt the fundamental positive feedback loop that drives the current socioenvironmental coevolution is by limiting the energy flow through society that, as we have seen, is the inherent counterpart of the information flow. The acceleration of innovation and information flow that was triggered by the discovery and harnessing of fossil energy could conceivably be slowed down or even inverted by a lack of energy. However, one of the consequences of the greenhouse gas debate has been the shift to solar and wind energy that, once complete, ensures the long-term availability of plentiful energy.
This leaves other material flows as potential interruptors of the basic feedback loop. In discussing the topic, we have to distinguish between the availability of the means to meet basic human needs such as food and water and the availability of other raw materials, as used in industry or for shelter. Certain of the latter are, at one point or another, likely to run out: rare earth minerals, such as coltan, etc. But it would seem that human ingenuity and a sufficient investment in research will find solutions for such shortages by substitution.
Potential global shortages of food and water are more difficult to deal with, and until food security has been dealt with as a global challenge we do not know whether human ingenuity and will can solve this. One of the important constraints to increasing the total global quantity of food is the fact that human beings have a limited range of foodstuffs that they digest and use. Shifting the emphasis of production from meat and fish to vegetarian foodstuffs can reduce the risk of global food shortages for a (considerable) time, but some proteins are needed for human health.
Fresh water is another commodity that is basic to human subsistence. It, too, is limited in overall quantity available, especially if climate change leads to a reduction in the amounts of frozen fresh water available worldwide. Although it can be created from salt water (and there is enough of that), this is costly in energy, and there has so far been no major breakthrough in the water–food–energy nexus that I know of. Hence these two commodities may well turn out to limit the fundamental feedback loop unless per capita water use can be drastically reduced, particularly in agriculture (the heaviest consumer of fresh water), or water recycling can be improved and spread to the extent necessary to rely on available water resources. But this again is costly in (renewable) energy.
That leaves only one other potential human-engineered interruption in the basic feedback cycle: the information flow itself. Can we intervene in the data–information–knowledge cycle that is at the core of the flow structure that is driving societal coevolution? In the light of the ICT revolution this seems an intriguing option that we need to consider in some more detail. One major difference with the other elements in the flow structure is that this one is driven by a very small, though growing, number of people worldwide. One question is whether that community could be convinced of the need to redirect its efforts in a different direction, and another whether it is not already too late to do so in a way that will convince others to take up their torch. But convincing a relatively small community seems easier to do than convincing a substantive part of the world population. I argued in Chapter 19 that to redirect the development of ICT away from a very small and powerful component of the world’s business community, people in the developed nations need to reassert their individual and collective power to determine their future and control the development of information technology. Is that feasible? Will enough people come to see and accept the changes that this development is imposing on our social lives if nothing is done to wrest the control over it from those who have it at present?
A similar, relatively small but hugely controlling group that could at least theoretically be convinced to steer society in a different direction is the world of finance. The same questions will need to be asked and answered for this group, but at the present time there is more of a reaction to its supremacy than to that of the information technology (IT) community.
The next question is in which directions the current rapid developments in IT and/or finance could be reoriented to have a positive effect. The answer is in part the same: by strengthening public governance, they could be slowed down and then transformed so that large numbers of people across the world are empowered to use them in alternative ways. Widening out our value space with the values of the “developing” or “underdeveloped” world would not only enrich our experience, but also set in motion new dissipative flows, ultimately possibly balancing the existing inward flows of matter and energy, and thus spreading wealth rather than concentrating it.
How might this work? The ICT revolution will continue to impact on our society in very many ways that we can only glimpse at present. We must look at these both from the ICT perspective itself, and from that of its impact on our societies. From the ICT perspective, the technology offers the opportunity to mitigate at least to some extent the main cognitive limitations that we have mentioned earlier as driving societal information processing to date. ICT may improve the integration between human and electronic information processing. This is clearly an ongoing process, in which exploiting the capacity of ICT to reach out and create horizontal networks of information processing worldwide is of major importance if we are to drastically improve the total information processing capacity of our societies. That will no doubt lead to different perspectives on our past, present, and future trajectories and, we may hope, a more realistic assessment of the long-term affordances and constraints of societal development. It will in my opinion also be one of the drivers of the enlargement of our global value space, and therefore an important driver of the transition from a resource-to-waste economy to an economy of opportunity that finds a better balance between “takers” and “leavers” (Quinn Reference Quinn1995).
ICT may also enable us to deal with the bias of human decision-making toward theories, ideas, and behavior that is principally based on successful past responses, owing to the underdetermination of our ideas by our observations. The big data revolution may enhance the role of observations in decision-making and therefore loosen the path dependency of our current societal evolution, paving the way for a very different kind of decision-making. Currently, techniques and methods to deal with that big data revolution are still insufficiently available, but the development of machine leaning is likely to remedy that.
In order to facilitate thinking about the future, ICT may help us develop a kind of informatics that, rather than reducing the dimensionality of big data into simpler concepts, does the reverse: moving from a limited number of observed dimensions to generate as many other dimensions as possible, and then testing those for feasibility, in effect reversing Occam’s razor and assuming that the world is complex; and that, therefore, ideas need to embrace that complexity rather than simplify it away.
From a perspective of societal change, at least four different dimensions of the future impact of ICT seem important to me. ICT might (1) substantially increase transaction efficiency and (2) trigger structural changes in the division of labor, including increasing specialization in the functions and tasks fulfilled by individuals, groups, and institutions. As part of that process it may well render large parts of the population unemployed and therefore restless for change. That might in turn (3) change the configuration of our institutions, including firms and markets, as well as their roles and shapes. And, as importantly, (4) the fact that fewer resources might be devoted to maintaining the current structure would free up resources for implementing innovations.
These profound changes may in my opinion offer an occasion to move the long-term dynamics of human development in a different direction. The ICT revolution is already in the process of leveling information-processing and wealth differentials by enabling the strengthening of horizontal networks, as opposed to the vertical ones that have dominated our human information processing for so many centuries and created the current wealth-centered world and its material imbalances between different strata of the population and between different parts of the Earth.
Rather than accumulation, spreading of information is becoming, and should become much more, the main driver of the economy, and the tool to create wealth in other parts than the current developed world. This trend is the reason for the high current valuations of the social networks, which have discovered a fundamentally different, novel, way to profit from the existing information-processing differentials – rather than increasing them, they are making their profit from decreasing them. This favors an inversion from the current, predominantly extraction-to-waste economy (in terms of raw materials, but also human capital) into an economy of opportunity creation and spreading wealth, and substantively enlarges the total value space of the global community involved.
But, and I cannot emphasize this enough, we need to grasp the opportunities offered by the ICT revolution and not let them slip by uncontrolled. The enlarging of the value space is not going to happen if the spreading of information is used to propagate the current, narrow, material-, gross domestic product-, and consumption-focused western value system across the entirety of the planet. Indeed, we must use this occasion to do the inverse – to enhance the global value space by developing the many other values that are current among non-western societies: actively stimulating the emergence of novel dimensions of value from the embryonic state in which they currently exist, often (but not only) among small-scale societies. Certainly, biodiversity is an important aspect of sustainability, but so is cultural (value) diversity. Without cultural diversity to grow our value system, we will not be able to find ways to durably live peacefully with billions of people on Earth. Only by increasing the information-processing capacity, education, and wealth of the underprivileged can we redirect the current trend so as to approximate a more stable equilibrium.
We can distinguish two main kinds of information processing that currently link the developed and the developing world. The first aims for direct information transfer from the developed to the developing world and does not directly contribute to the expansion of our global value space, even though the confrontation between the ideas spread and local knowledge may generate innovation and new values. The second approach, on the other hand, enables the development of local knowledge and the expansion of local wealth creation. Examples of the first are the facilitation of distant access to information from many different sources that was initiated by the search engines (Yahoo, Google, etc.), and then led to the development of specialized online encyclopedias such as Wikipedia, which not only assemble but also synthesize information. It is now entering a different stage with the emergence of online degrees at many universities and the Massive Open Online Courses (MOOCs) driven by major institutions such as MIT and Stanford. These enable anyone to study free of charge, or at lower cost than is traditional, anywhere in the world. They are spreading as ways are found to return to the educating institution a small percentage of the proceeds ultimately generated by the people thus educated. They are part of the “online revolution,” which will in the next thirty years fundamentally transform the worldwide educational and societal landscape at all levels. In addition, there are many e-based tools that, even though they do not deliberately aim to educate, have very important educational components. These range from blogs to social networks to “serious” games that promote certain learning skills. In this domain, we may expect many more innovations that contribute to the transformation of the information-processing landscape.
Examples of the second kind abound, and have been spreading for fifty years under the impact of those non-governmental organizations that saw that providing local populations in poor countries with western knowledge or infrastructure was not always effective in enhancing their happiness, wealth, or autonomy, and did not have as immediate and long-lasting an effect as helping local populations use their existing talents. Developing the local recycling economies of the developing world is a good example. These use materials such as empty oil drums and crates, used tires, and the like to create pipelines, furniture, and baskets. They are a fundamental part of the local economy, providing jobs, spreading or accumulating knowledge, and reducing waste. Giving them access to world markets has been one way to promote them, as in the case of the South African production of decorative baskets from telephone wire. Another example of this kind of promotion of local developments has been the spread of microcredit to provide for the initial investments needed for local enterprises (which are doing things that are not done in the west) to emerge. This has been so successful that more recently microcredit lending has spread to poor areas in the developed world, such as parts of New York City.
This trend is positive, but it would greatly gain in importance if non-western societies would try to move in the direction of implementing their traditional values, directed at leaving in Quinn’s sense, rather than western (taking) approaches, increasing their level of education and innovative capability in independent innovative ways. One characteristic of many indigenous leaving societies is that they have not developed an externalized, material-based value system to maintain their coherence, but have, as far as we can see, very intricate and subtle, high-dimensional, internalized, mental value systems. Dematerializing our western value systems might be an interesting way to proceed.
Decentralization, Disruption, and Chaos
Whether as a result of one of the potential top-down reorganizations proposed in the last sections, or as a result of a bottom-up societal change driven by social unrest owing to the tension between globalization and social exclusion (Munck Reference Munck2004), the changes are likely to trigger major disruptions in our societies. This is where my short-term pessimism comes in again.
It is one of the tenets of the resilience community (Gunderson & Holling Reference Gunderson and Holling2002) that the kind of longer-term development that we have seen over the last sixty or more years ultimately leads to rapidly increasing vulnerability to shocks. Once such shocks begin to generate cracks in the dynamic structure of the system, novel values and ideas, which could not previously express themselves, emerge. I would argue that that is in effect what we are beginning to see worldwide, as our world fragments from a bipolar into a multipolar one at all levels. This fragmentation is nothing but another manifestation of the fact that people are beginning to assume an increased responsibility for their own actions because they no longer feel comfortable with the current system. As this feeling spreads, their actions will increasingly be based on awareness of different sets of values, and deviate from the kind of “rational decisions” proposed by the free-market economics that only takes a very limited number of value dimensions into account. This is exactly the kind of development that favors the growth of the global value space that I have been arguing for. But in the process it may well dismantle at least the upper part of the current institutional structure that governs our societies, limiting the size of coherent, stable, social entities. The European Union for example, might disintegrate into its constituent nation-states, and the USA might deconstruct much of its federal superstructure and relegate major responsibilities to the individual states. Similar processes could occur in China, an empire that is essentially a conglomerate of regional entities with major social, economic, and cultural differences. How far down such deconstruction would reach in our current societal and governance systems is an interesting question. One of my colleagues argues that it might well go as far as empowering major metropolitan areas at the expense of all larger sociopolitical units.
It is likely that all this would lead to a substantive period of chaos before a next set of more or less stable institutional solutions was identified and implemented. The longer our societies continue on the current trajectory, the more likely it is that in such a chaotic period many people will suffer substantively. The current chaos in the Near East and adjacent areas is a telling example, as is the situation in Africa that is causing the current migration crisis in Europe. Neither is likely to change unless there is a fundamental societal restructuring, and that will take a lot of time.
But that is where my optimism comes in again. At some point in time this restructuring will happen, if only because it is the fundamental nature of human beings to be social and individuals cannot survive alone. That is the lesson of the long-term perspective that archaeology offers, the study of the emergence, flourishing, and disintegration of all kinds of societal structures, from very small to very large, such as the Chinese, Persian, and Roman Empires. That is the reason I can be optimistic about humanity, yet pessimistic about our current way of life.


 Open access