Refine search
Actions for selected content:
53179 results in Statistics and Probability
Recurring bacterial strains, subclusters, and the importance of practising lessons learned
-
- Journal:
- Epidemiology & Infection / Volume 152 / 2024
- Published online by Cambridge University Press:
- 16 December 2024, e171
-
- Article
-
- You have access
- Open access
- HTML
- Export citation
Author response to: Recurring bacterial strains, subclusters, and the importance of practising lessons learned
-
- Journal:
- Epidemiology & Infection / Volume 152 / 2024
- Published online by Cambridge University Press:
- 16 December 2024, e170
-
- Article
-
- You have access
- Open access
- HTML
- Export citation
A note on continuity and asymptotic consistency of measures of risk and variability
-
- Journal:
- ASTIN Bulletin: The Journal of the IAA / Volume 55 / Issue 1 / January 2025
- Published online by Cambridge University Press:
- 16 December 2024, pp. 168-177
- Print publication:
- January 2025
-
- Article
-
- You have access
- Open access
- HTML
- Export citation
Reasoning about physical processes in buildings through component stereotypes
- Part of
-
- Journal:
- Data-Centric Engineering / Volume 5 / 2024
- Published online by Cambridge University Press:
- 16 December 2024, e40
-
- Article
-
- You have access
- Open access
- HTML
- Export citation
The effect of SARS-CoV-2 infection and COVID-19 vaccination during pregnancy on neonatal outcomes
-
- Journal:
- Epidemiology & Infection / Volume 153 / 2025
- Published online by Cambridge University Press:
- 16 December 2024, e5
-
- Article
-
- You have access
- Open access
- HTML
- Export citation
Essential covers of the hypercube require many hyperplanes
- Part of
-
- Journal:
- Combinatorics, Probability and Computing / Volume 34 / Issue 3 / May 2025
- Published online by Cambridge University Press:
- 16 December 2024, pp. 326-337
-
- Article
- Export citation
-
We prove a new lower bound for the almost 20-year-old problem of determining the smallest possible size of an essential cover of the
 $n$-dimensional hypercube
  $\{\pm 1\}^n$, that is, the smallest possible size of a collection of hyperplanes that forms a minimal cover of
  $\{\pm 1\}^n$ and such that, furthermore, every variable appears with a non-zero coefficient in at least one of the hyperplane equations. We show that such an essential cover must consist of at least
 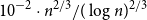 $10^{-2}\cdot n^{2/3}/(\log n)^{2/3}$ hyperplanes, improving previous lower bounds of Linial–Radhakrishnan, of Yehuda–Yehudayoff, and of Araujo–Balogh–Mattos.


Rough multi-factor volatility for SPX and VIX options
- Part of
-
- Journal:
- Advances in Applied Probability / Volume 57 / Issue 2 / June 2025
- Published online by Cambridge University Press:
- 16 December 2024, pp. 524-565
- Print publication:
- June 2025
-
- Article
-
- You have access
- Open access
- HTML
- Export citation
Introduction to Probability and Statistics for Data Science
- with R
-
- Published online:
- 13 December 2024
- Print publication:
- 14 November 2024
-
- Textbook
- Export citation
The transfer learning of uncertainty quantification for industrial plant fault diagnosis system design
-
- Journal:
- Data-Centric Engineering / Volume 5 / 2024
- Published online by Cambridge University Press:
- 13 December 2024, e41
-
- Article
-
- You have access
- Open access
- HTML
- Export citation
Space scan statistics to identify clusters of neonatal mortality associated with bacterial sepsis
-
- Journal:
- Epidemiology & Infection / Volume 152 / 2024
- Published online by Cambridge University Press:
- 13 December 2024, e169
-
- Article
-
- You have access
- Open access
- HTML
- Export citation
Enhancing resilience in IoT cybersecurity: the roles of obfuscation and diversification techniques for improving the multilayered cybersecurity of IoT systems
- Part of
-
- Journal:
- Data & Policy / Volume 6 / 2024
- Published online by Cambridge University Press:
- 13 December 2024, e74
-
- Article
-
- You have access
- Open access
- HTML
- Export citation
Estimating the seasonal performance and electricity consumption of retrofitted heat pumps
- Part of
-
- Journal:
- Data-Centric Engineering / Volume 5 / 2024
- Published online by Cambridge University Press:
- 13 December 2024, e39
-
- Article
-
- You have access
- Open access
- HTML
- Export citation
Tree universality in positional games
- Part of
-
- Journal:
- Combinatorics, Probability and Computing / Volume 34 / Issue 3 / May 2025
- Published online by Cambridge University Press:
- 13 December 2024, pp. 338-358
-
- Article
- Export citation
-
In this paper we consider positional games where the winning sets are edge sets of tree-universal graphs. Specifically, we show that in the unbiased Maker-Breaker game on the edges of the complete graph
 $K_n$, Maker has a strategy to claim a graph which contains copies of all spanning trees with maximum degree at most
  $cn/\log (n)$, for a suitable constant
  $c$ and
  $n$ being large enough. We also prove an analogous result for Waiter-Client games. Both of our results show that the building player can play at least as good as suggested by the random graph intuition. Moreover, they improve on a special case of earlier results by Johannsen, Krivelevich, and Samotij as well as Han and Yang for Maker-Breaker games.


Lizards as sentinels for the distribution of Angiostrongylus cantonensis
-
- Journal:
- Epidemiology & Infection / Volume 152 / 2024
- Published online by Cambridge University Press:
- 13 December 2024, e168
-
- Article
-
- You have access
- Open access
- HTML
- Export citation
Transfer learning for predicting source terms of principal component transport in chemically reactive flow
-
- Journal:
- Data-Centric Engineering / Volume 5 / 2024
- Published online by Cambridge University Press:
- 13 December 2024, e42
-
- Article
-
- You have access
- Open access
- HTML
- Export citation
Development of a nomogram for high antibody titre of COVID-19 convalescent plasma
-
- Journal:
- Epidemiology & Infection / Volume 152 / 2024
- Published online by Cambridge University Press:
- 11 December 2024, e167
-
- Article
-
- You have access
- Open access
- HTML
- Export citation
Health insurance’s contribution to reducing the financial burden of tuberculosis in Guizhou Province, China
-
- Journal:
- Epidemiology & Infection / Volume 152 / 2024
- Published online by Cambridge University Press:
- 11 December 2024, e141
-
- Article
-
- You have access
- Open access
- HTML
- Export citation
Twin-width of sparse random graphs
- Part of
-
- Journal:
- Combinatorics, Probability and Computing / Volume 34 / Issue 3 / May 2025
- Published online by Cambridge University Press:
- 11 December 2024, pp. 401-420
-
- Article
- Export citation
-
We show that the twin-width of every
 $n$-vertex
  $d$-regular graph is at most
  $n^{\frac{d-2}{2d-2}+o(1)}$ for any fixed integer
  $d \geq 2$ and that almost all
  $d$-regular graphs attain this bound. More generally, we obtain bounds on the twin-width of sparse Erdős–Renyi and regular random graphs, complementing the bounds in the denser regime due to Ahn, Chakraborti, Hendrey, Kim, and Oum.


Receiving three doses of inactivated or mRNA COVID-19 vaccines was associated with lower odds of long COVID symptoms among people with a history of SARS-CoV-2 infection in Hong Kong, China: a cross-sectional survey study
-
- Journal:
- Epidemiology & Infection / Volume 152 / 2024
- Published online by Cambridge University Press:
- 11 December 2024, e166
-
- Article
-
- You have access
- Open access
- HTML
- Export citation
Tight bound for the Erdős–Pósa property of tree minors
- Part of
-
- Journal:
- Combinatorics, Probability and Computing / Volume 34 / Issue 2 / March 2025
- Published online by Cambridge University Press:
- 11 December 2024, pp. 321-325
-
- Article
- Export citation
-
Let
 $T$ be a tree on
  $t$ vertices. We prove that for every positive integer
  $k$ and every graph
  $G$, either
  $G$ contains
  $k$ pairwise vertex-disjoint subgraphs each having a
  $T$ minor, or there exists a set
  $X$ of at most
  $t(k-1)$ vertices of
  $G$ such that
  $G-X$ has no
  $T$ minor. The bound on the size of
  $X$ is best possible and improves on an earlier
  $f(t)k$ bound proved by Fiorini, Joret, and Wood (2013) with some fast-growing function
  $f(t)$. Moreover, our proof is short and simple.


