

1 Introduction
Dialectologists have thoroughly mapped variation in the Russian spoken language, especially dialects spoken in villages across European Russia. Meanwhile, the non-linguist perspective on variation in Russian has largely been ignored. Since nonlinguists have not gone through the same training as professionals, nor have the same experience with fine-tuned analyses of language, linguists may easily consider beliefs and knowledge possessed by nonlinguists to be arbitrary and of little consequence. In folk linguistics, however, the non-linguist perspective on language is valued as a source of information about the position that language issues hold in everyday life.
This article builds on 55 perceptual maps of regional variation in Russian drawn by young Russian nonlinguists. The Russian language is characterized by a hegemonic standard language (Paulsen, Reference Paulsen2009) which dominates the public discourse to such degree that one might expect people to be less attentive to regional variation when they hear it. Nevertheless, it appears in this study that members of the younger generation in Moscow, Perm, and Novosibirsk do indeed have an opinion on how and where spoken Russian varies across Russia.
In this article I address the following research questions:
-
Can perceptual maps be used to access the beliefs of nonlinguists about regional variation in spoken Russian?
-
What regional variation in the spoken language do young Russian city dwellers believe can be found in the Russian language, and what terms do they use to describe such variation?
-
What beliefs and knowledge do nonlinguists apply when talking about regional variation?
My hypothesis was that if the hegemonic, standard-language informed, prescriptive viewpoint on linguistic usage was conceived of as current or relevant, this would be reflected in the perceptual maps. I expected exceptions from Russian as spoken in the perceived linguistic norm centers of Moscow and St. Petersburg, as well as geographic spots far away from these cities, to be judged negatively. I also found it likely that the similarity of the spoken language in major Russian cities would result in young city residents having very little, if any, experience or concern with regional language variation.
In the first section of this article, I offer a short introduction to Russian standard language and dialect variation, and I present relevant methods used in folk linguistics. In the second section, I test the potential of such methods in the study of perceptions of regional variation in Russian. In the third section, I present the findings from my study of perceptual maps. In the fourth section, I discuss structures of variation as they appear in perceptual maps, both in their direct statements and through a more complex assessment of their statements. In the conclusion, I discuss the features of regional language variation that appear as salient to young Russian city dwellers and the conceptions on which they base their statements, and make suggestions for further research in the area.
Following Johnstone (Reference Johnstone2013:109), I use the term “regional variety” to refer to varieties that have regional adherence. In the U.K., Johnstone writes, “dialect is often synonymous with regional variety,” but this is not the case in Russia, where the term “dialect” is commonly used to refer more narrowly to Russian as spoken in villages in European Russia, most often in early settlements. In this paper “regional variation” encompasses all variation that has geographically conditioned characteristics, manifested both in traditional dialects and speech with a certain amount of dialect features. Footnote 1 “Perceived regional variation” might encompass more than that, as informants have their own opinion on what constitutes regional variation. For the purpose of this article I use a broad definition of the term “region,” including any larger or smaller area that informants choose to separate from other parts of Russia. While one can expect the perceived regional variation in smaller regions to correspond to more or less specific, delineable features, the variation linked to larger areas can sometimes be of a more general character.
2 Background
2.1 Russian standard language and Russian dialects
Russia is a multilingual country, and, according to the 2002 census, more than 150 languages of differing extent and status are spoken across the nation (Wingender, Reference Wingender2015:179). Out of these, Russian is the only nationwide official language, while 25 other languages have the status of official languages in Russia’s 21 republics (Wingender, Reference Wingender2015:179; see Zamyatin, Reference Zamyatin, Kraus and Francois2018, for a fuller discussion of the sociolinguistic situation of the languages that are spoken in Russia). The 2010 Population Census shows that Russian is spoken by 99.4% of the population (Zamyatin, Reference Zamyatin, Kraus and Francois2018:46), meaning that it has a clear dominance among Russia’s other languages as the main language of communication in the Russian Federation. The Russian government confirms the special status of the Russian language. As Zamyatin claims, “Russian official rhetoric does not accent the endangered state of many languages or the decrease in a linguistic diversity. Instead, the authorities emphasize the exceptional importance of Russian as a ‘global’ or ‘world language’ amongst the other languages in Russia, and its ‘degradation’ in political and socio-linguistic terms, for example, its ‘contamination with foreign words’” (Zamyatin, Reference Zamyatin, Kraus and Francois2018:48).
In the remaining parts of this section, I will present and discuss literature on variation in Russian. A full discussion of the various terms for varieties of Russian exceeds the bounds of the current article, however, in the following paragraphs I will give a short introduction to the Russian standard language and to regional variation in spoken Russian, thus providing a basic outline of the scholarly discourse on regional variation in spoken Russian. Basing first my discussion on an assumed opposition between dialect and standard language (Krause, Reference Krause2011), I go on to offer an overview of terminology for other forms of regional variation in Russian, identifying a number of research gaps. I demonstrate that the terminology commonly used in Russian linguistics to denote variation in the spoken language is often dependent on the standard language.
2.1.1 The Russian standard language
The Russian standard “literary” language (literaturnyj jazyk) is, naturally, an ideological construct which is perceived as meaningful and relevant in different spheres of life. Lunde (Reference Lunde2018) mentions a range of factors that have influenced the standardization process of Russian. Peter the Great’s reforms in the early 18th century, including his ideal of a simple language, played a significant role in its codification (Lunde, Reference Lunde2018:32), and, as Lunde explains, among the factors that have been important in its subsequent development are the high status of Russian writers and Russian literature from the 19th century and onwards, and the close association of standard language and literature (Lunde, Reference Lunde2018:33–34; see also Paulsen, Reference Paulsen2009:66-77 for a discussion of the term literaturnyj jazyk in the Russian philological and sociolinguistic tradition). While according to the philological tradition following Vinogradov, the Russian standard language is first of all a written language, Leonid P. Krysin’s sociolinguistic approach allows for the inclusion of a spoken standard as well (Paulsen, Reference Paulsen2009:76). The spoken form of the Russian standard language is to a large extent centered around the pronunciation norms of Moscow speech (Sussex & Cubberley, Reference Sussex and Cubberley2006:521) and/or St. Petersburg speech (Kolesov, Reference Kolesov1991:3–4). Moscow is the national capital of Russia and St. Petersburg is nicknamed the “cultural capital” of Russia, meaning that these two cities are, generally speaking, culturally prominent cities (Montgomery, Reference Montgomery2012), “bringing ‘far away’ areas ‘closer’ to respondents through increased exposure in various forms of media and public discourse” (Montgomery, Reference Montgomery2012).
The Russian standard language holds a strong position in Russia, which influences the relative status of regional variation in spoken Russian and other forms of linguistic variation, but, as Schoenenberger claims, definitions of the Russian standard language are problematic; “Russian linguists based their work on the precondition of the existence of literaturnyi iazyk as an unquestionable fact, as something that can be taken for granted and does not need to be proven” (Schoenenberger, 2004, in Paulsen, Reference Paulsen2009:71). Definitions of a spoken standard language most often refer to speakers or settings instead of referring to actual speech. In Zemskaja’s (Reference Zemskaja1981) definition, the spoken form of the Russian standard language consists of the kodificirovannyj literaturnyj jazyk (KLJa) “codified standard language,” which is used in official settings, and razgovornaja rečʹ “(standard) conversational speech,” which is used in all other settings. Speakers of the standard language, writes Zemskaja, have higher education and are most often born in the city (Zemskaja, Reference Zemskaja1981:23). As Hinrichs (Reference Hinrichs1999:594) observes, Zemskaja’s model of razgovornaja rečʹ is defined by extralinguistic, pragmatic and situation-bound criteria, and further, its definition is not autonomous, but stands in relation and opposition to the codified standard language. Zemskaja’s definition, which refers to social-class stratification rather than speech, is shared by Krysin, among others (see Paulsen, Reference Paulsen2009:76), and shows how social and sociolinguistic criteria have played a decisive role in the terminology of Russian linguistics.
Erofeeva (Reference Erofeeva2005:95–97) notes that linguists have generally understood the spoken form of the standard language (in Russian: ustnaja forma literaturnogo jazyka) in two different ways: a) as a spoken form that varies from place to place, or b) as a spoken form without territorial differences. The Russian standard language is often perceived as “dialect-free.” Isačenko (1958) claims in his definition of the Russian standard language that “[the standard language, in the modern sense of this word] is obligatory for all members of our national community and hence does not allow dialect variants” (Isačenko, 1958, in Paulsen, Reference Paulsen2009:73), Footnote 2 while Vinogradov (1978) who was “heavily influenced by Marxist-Leninist terminology and its understanding of historical development as a necessity” (Paulsen, Reference Paulsen2009:73), writes that “literaturnyj jazyk as the highest standardized form of the national language will gradually push back dialects and interdialects” (Vinogradov, 1978, in Paulsen, Reference Paulsen2009:73).
As Preston (Reference Preston2016:8) claims, “the city and city-countryside divide loom large in the folk understanding of language variety.” Several experiments have shown that speech from larger Russian cities are perceived differently than speech from villages and minor cities. A matched-guise test revealed that informants recognized features which are typical for base dialects and differentiated between these and speech from St. Petersburg and other large cities, Footnote 3 so-called standard speech, which did not possess those marked features (Andrews, Reference Andrews1995, Reference Andrews2003). Krause and Podrušnjak (Reference Krause and Vera2010) found in their study that certain regional variation was allowed in speech that was evaluated as Russian standard language. Footnote 4 In a verbal guise test, Footnote 5 they demonstrated that variation between Russian as spoken in two larger cities (Kirov and Perm) was perceived as being small compared to the variation between the so-called standard and village dialects. In both Andrews’ and Krause and Podrušnjak’s studies dialect features were perceived more negatively than standard speech.
Andrews (Reference Andrews2006) argues that the Russian standard language is becoming a “negative dialect” which he terms “educated mainstream Russian.” This variety, he claims, is first of all characterized by an avoidance of regional features, but also by an acceptance of variation within certain limits (Andrews, Reference Andrews2006:178ff.). More research is required in order to explore the perceived boundaries of the Russian standard language.
2.1.2 Russian dialects
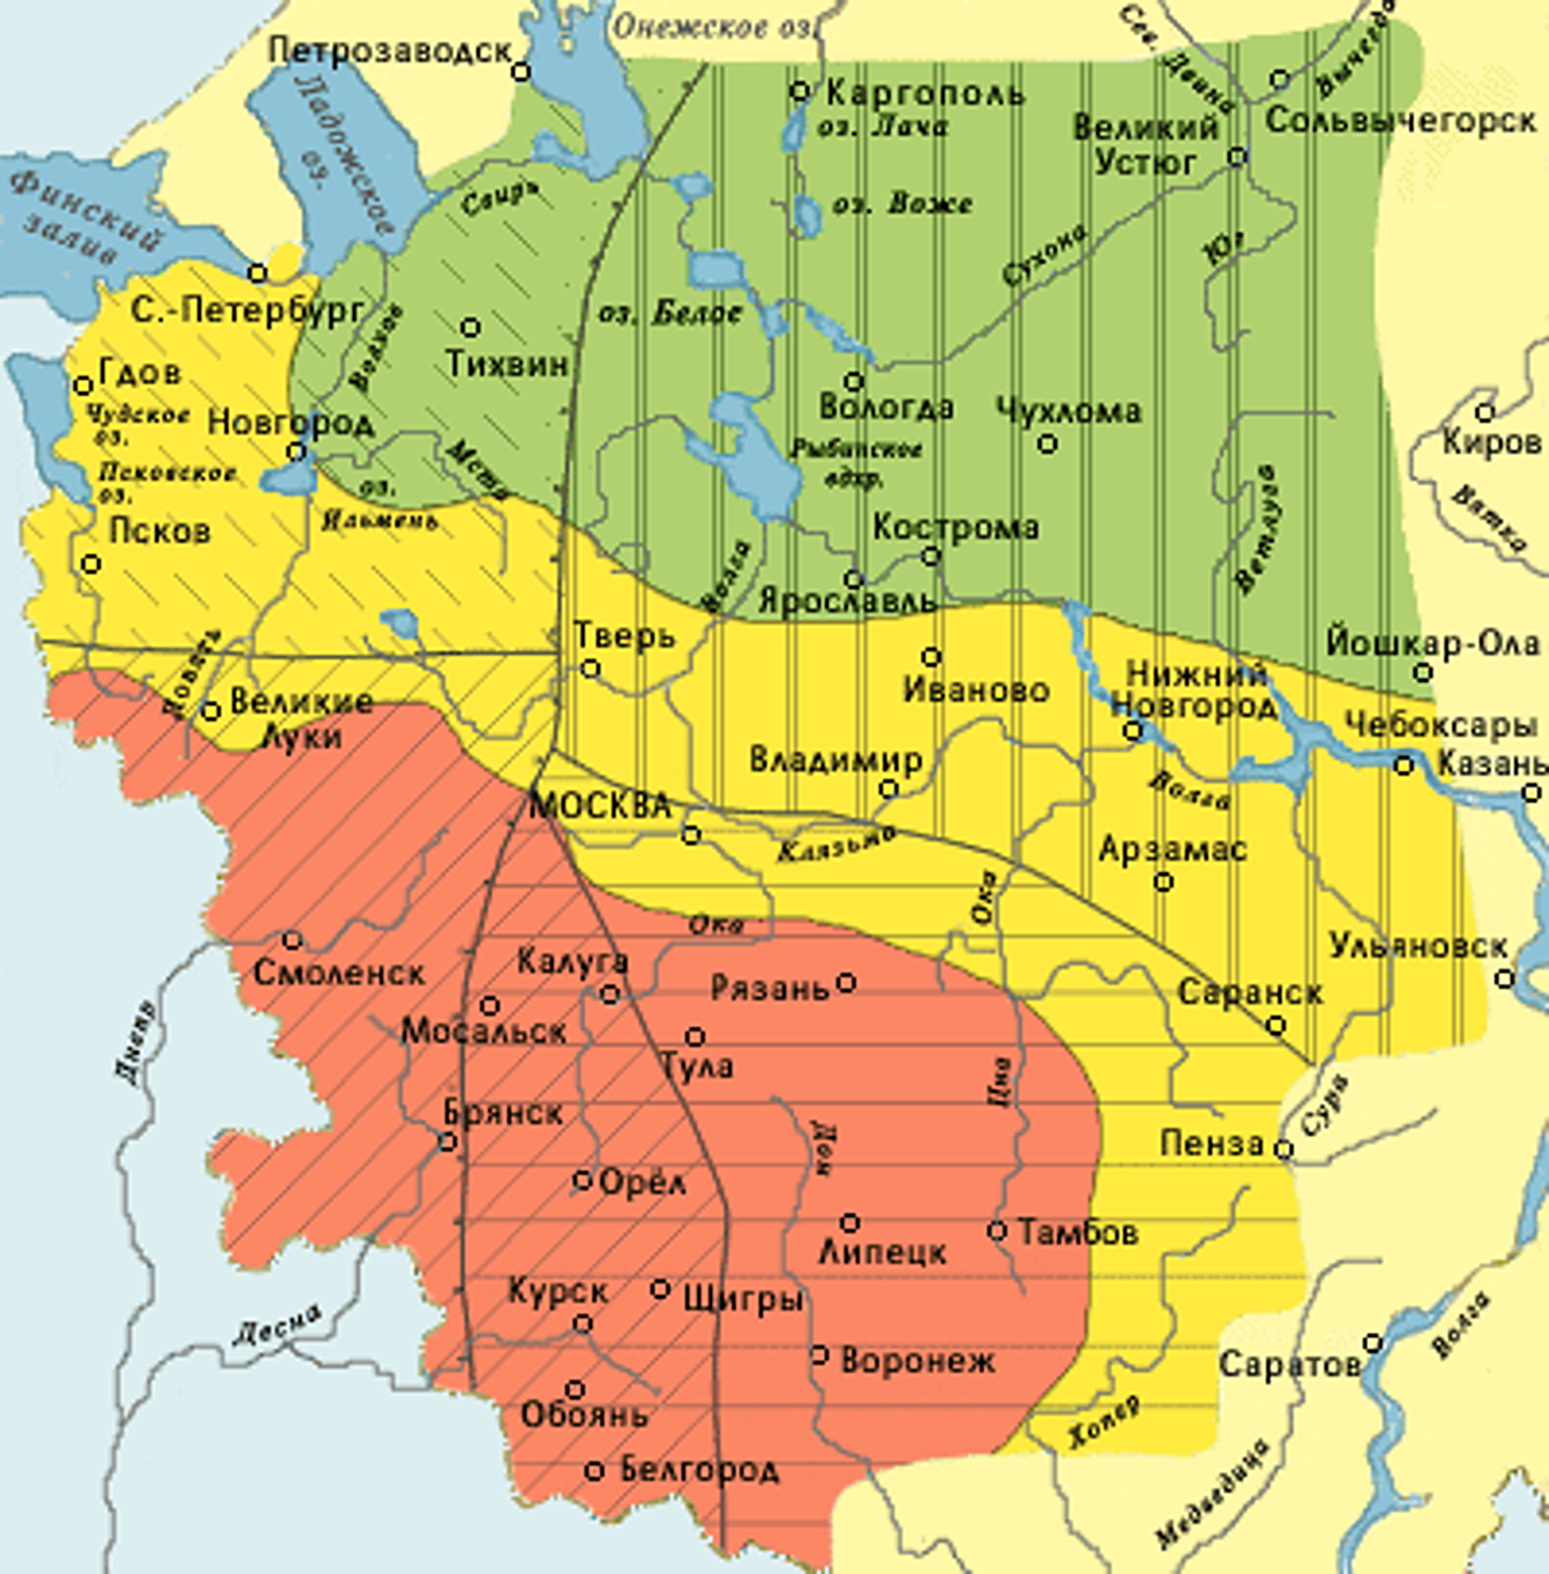
In Slavic studies, the term dialekt/govor ‘dialect’, or tradicionnyj dialekt ‘traditional dialect’, generally refers only to base dialects in Central European Russia villages, which have been studied extensively since the 19th century (Krause & Sappok, Reference Krause and Christian2014), mostly through documenting the speech of elderly village inhabitants. Footnote 6 According to Bukrinskaja & Karmakova (Reference Bukrinskaja and Karmakova2016:3), such “traditional dialects” form language systems of their own and are territorially confined. The base dialects in Central European Russia are represented in DARJa (Dialektologičeskij atlas russkogo jazyka ‘The dialectological atlas of the Russian language’, 1986–2005) and can be split into three main dialect belts, a Northern, a Southern and a transitional belt, as shown in Map 1. These dialect belts are formed by the accumulation of isoglosses, the most salient of which are the following two features: the pronunciation of /o/ in unstressed position and the plosive versus fricative pronunciation of /g/. The Northern belt has okanʹe, which is “the opposition between the phonemes /ɔ/ and /a/ in unstressed position in Northern Russian dialects” Footnote 7 (Krause & Sappok, Reference Krause and Christian2014:2055; my translation) [molo’ko] and plosive pronunciation of /g/ ['mnogə], while the Southern belt has akanʹe, “a neutralisation of this opposition” (Krause & Sappok, Reference Krause and Christian2014:2055; my translation) [məlɐ'ko] and fricative pronunciation of /g/ ['mnoɣə]. The transitional belt has features from both the Northern and the Southern belt: for example, many of these dialects have akanʹe from the Southern belt, but plosive pronunciation of /g/ from the Northern belt. Both of these features are relatively well-known features among nonlinguists.
Russian dialect zones (Bukrinskaja et al. Reference Bukrinskaja, Golubeva, Karmakova, Nikolaev and Sarkis’jann.d.). The green zone represents the Northern dialect belt; the yellow zone represents the transitional belt and the red zone represents the Southern dialect belt.
The Russian base dialects mentioned above are by no means descriptive of today’s dialect situation in the Russian speech community as a whole. First of all, like in other languages, they exist to this date (Bukrinskaja & Karmakova Reference Bukrinskaja and Karmakova2016; Kasatkin, Reference Kasatkin1999:42), but Russian dialects (tradicionnyj dialekt) are evolving. Trubinskij wrote that Russian dialects do not disappear, but turn into regiolects, a process which leads to the loss of archaic features (Trubinskij, 2004, in Bukrinskaja & Karmakova, Reference Bukrinskaja and Karmakova2016). Krause & Sappok have termed the repeated proclamation in public discourse on language of an approaching “death of Russian dialects” as “scientific fiction” (Krause & Sappok, Reference Krause and Christian2014:2051; my translation). They provide evidence that although they are changing, the base dialects in Central European Russia are spoken in different age groups (Krause & Sappok, Reference Krause and Christian2014:2057).
Secondly, there is reason to believe that Russian does demonstrate certain regional variation, not only in villages, but more generally, although the measured and perceived variation in more densely populated areas has been less researched. Several terms have been proposed to describe geographically dependent varieties that do not fit the definition of base dialects, suggesting that there is in fact much more to be said about regional variation. Terms suggested to describe regional varieties include “new dialect,” (city) prostorečie, Footnote 8 regionally colored standard language and regiolekt (Bukrinskaja & Karmakova, Reference Bukrinskaja and Karmakova2016; Erofeeva, Reference Erofeeva2009). As Bukrinskaja & Karmakova (Reference Bukrinskaja and Karmakova2016) note, the definition of such terms may differ between linguists. Regionally or locally colored standard language and regiolekt refer to speech which cannot be defined as dialect in the Russian understanding of the term, but that does have regional features. There is no general agreement on the use of these two terms and they are sometimes used interchangeably, while regiolekt typically has a larger share of features that tie speech to a geolinguistic location than regionally/locally colored standard language. Regiolekt can be understood broadly as an entity which includes regionally colored standard language and transformed dialects and is opposed to dialect (tradicionnyj dialekt) and standard language, or more narrowly as a variety on a continuum starting with dialect (tradicionnyj dialekt) (Bukrinskaja & Karmakova, Reference Bukrinskaja and Karmakova2016). Prostorečie differs from the other terms mentioned above. The majority of researchers today, including Erofeeva (Reference Erofeeva2003:441), consider it to be a range of nonstandard elements. According to Xolodkova (Reference Xolodkova2009), definitions of prostorečie are normally twofold and refer to 1) a set of linguistic tools or features which is used by educated speakers “to give a rough, substandard expression of a concept” (Xolodkova, Reference Xolodkova2009; my translation), and 2) linguistic features used by speakers who have little education that “compromise the speech of educated speakers” (Xolodkova, Reference Xolodkova2009; my translation). Footnote 9 These linguistic features, Xolodkova (Reference Xolodkova2009) writes, can be influenced by local dialects, which can explain why prostorečie has been suggested alongside other terminology for regional variation. Footnote 10
More research is needed to establish the nature of regional variation which does not fit the definition of so-called traditional village dialects, and to understand whether variants spoken in different parts of Russia which are similar, yet not identical to one another (such as speech in various large cities) may also be salient. As Krause et al. claim, a spoken corpus of regional variation in Russian would be useful for the study of Russian regiolects (Krause et al., Reference Krause, Erofeeva, Post and Vardøy2015).
Terms that refer to regional variation in Russian may sometimes be value-based. A vertical axis with “dialect-free” standard language and dialect at the top and bottom respectively, referring to the relative position of various varieties, serves to reinforce the standing of the standard language as a superior variety of Russian. In his differentiation between “degrees of dialect,” Orlov (1974) implies that there exists such a vertical axis. He suggests the categories “dialect,” “close to the standard language,” and “intermediate forms” (Orlov 1974, in Lutovinova & Tarasova Reference Lutovinova and Tarasova2003:16). Krause Reference Krause2011, following Auer (Reference Auer, Nicole, Johan and Dirk2005), argues for a diaglossic model of variation in Russian which encompasses both dialects and regional variation such as regiolects and regionally colored standard language. This model suggests the existence of a continuum where the traditional village dialects figure as a category on one end of a scale of decreasing use of regional variables. In this model, too, the vertical axis with standard Russian on top is repeated, demonstrating how the standard language is generally assigned as the point of orientation in the discourse surrounding regional variation in Russian.
Proclamations of the “death of dialects” (Krause & Sappok, Reference Krause and Christian2014) can be interpreted as a sign that the linguistic resources available for talking about regional variation in spoken Russian are limited. The contexts for using the term “dialect” not only reveals connotations to village speech, but also to the elderly generation, or to the speech of the past. Such connotations are not unique to Russian, though: in his study from 1986, Preston reports that he avoids the term “dialect” when talking to lay people because it “carries negative meaning for nonlinguists” (Reference Preston1986:224). Coupland (Reference Coupland2007:2) writes that dialects are often considered “styles of yesteryear, largely out of step with the social circumstances of contemporary life.”
2.2 Folk linguistics
Folk linguistics is the study of folk beliefs about language. The field of folk linguistics is well-established (Cramer & Montgomery, Reference Cramer and Chris2016; Long & Preston, Reference Long and Dennis2002; Niedzielski & Preston, Reference Niedzielski and Preston2003; Preston, 1999), although less so in Russia (but see Bondarenko, Reference Bondarenko2016; Golʹdin & Krjučkova, Reference Gol’din and Ju2017; Golovko, Reference Golovko2014). Folk linguists have studied various aspects of language, including regional variation in speech.
By taking into account all kinds of contributions to the discourse on language variation, regardless of the underlying reasoning, we can achieve a deeper understanding of how people believe that language varies and why. As Johnstone (Reference Johnstone2013:107) writes: “If we simply rule out the lay view as uninteresting and wrong, we risk missing the ways in which laypeople’s ideas about regional variation can be consequential in the study of patterns of linguistic variation and change.” The metalanguage of the nonlinguists that is the object of this study differs substantially from the metalanguage of a linguist. An analysis of the metalanguage of nonlinguists allows us, for example, to draw parallels between a folk structure of language on the one hand, and structures outlined by a professional linguist on the other. It also provides insight into what fields of knowledge other than linguistics the informants consider relevant when talking about language.
Folk linguistic statements can give insight into people’s awareness of language variation, but also into their particular language ideologies and their interpretation of the social meaning of language variation. Assuming that ideology lies behind both in the work of professional linguists and in the minds of laypeople, Paulsen in his thesis rejects the concept of folk linguistics. Paulsen points out that the bounds between the assumptions of laypeople and professional linguists are blurred (Paulsen, Reference Paulsen2009:64). Preston comments on these blurred lines, claiming that professional knowledge suppresses the folk knowledge that might be at work in the language attitudes of linguists: “We’re all folk when we step into the world of traditional knowledge and ways of behaving outside our own technical training. Even then, folk knowledge may be at work when more subconscious modes prevail, although, as in the language attitudes of linguists, for example, they may be suppressed from overt comment or behavior by professional knowledge” (Preston, Reference Preston2011:15). Further, Preston points out that language ideology is a concept from the ethnography of language, and claims that folk linguistics, on the level of practice, may be indistinguishable from this field of research (Preston, Reference Preston2011:16).
2.2.1 Folk linguistics in Russia
In Russia folk linguistics is a young discipline. The term “folk linguistics” has different equivalents or near-equivalents in Russian, including stixijnaja lingvistika ‘spontaneous linguistics’ (Bulygina & Šmelëv, Reference Bulygina and Šmelëv2000), narodnaja lingvistika ‘folk linguistics’, and ljubitelʹskaja lingvistika ‘amateur linguistics’ (Zaliznjak, Reference Zaliznjak2010). In Zaliznjak’s opinion, amateur linguistics arises because nonlinguists think that the command of their native language makes them capable of retrieving correct answers—“all that remains is to think a little” (Zaliznjak, Reference Zaliznjak2010:8). Zaliznjak displays clear scepticism to amateur linguistics and gives examples of Russian nonlinguists’ faulty conclusions in different linguistic subjects, such as in the area of language change, where he for example notes that amateurs fail to understand diachronic phonetic changes and so believe that such words as flot and plot are related because the Latin word pater is Vater in German—a given sound could change into almost any other sound (Zaliznjak, Reference Zaliznjak2010:18ff.). Golovko (Reference Golovko2014:15) writes that the field of folk linguistics relates to linguistic anthropology: “The task of the researcher is, in particular, a matter of extracting cultural meaning from the assembled folk accounts on language.” Footnote 11 Following Golovko, the value of folk linguistics lies not in mapping nonlinguists’ knowledge of linguistics or lack thereof, but in exploring what lies behind non-professional statements on language. While Russian folk linguistic studies are scarce, there is an abundance of studies within Russian ethnolinguistics, which roots back to the 1960s and the Soviet researcher Nikita Tolstoj, and investigates “language and culture in the organic relationship between them, (…) on the basis of all kinds of data available: language, customs, beliefs, folklore” (Tolstaja, 2013, in Bartmiński, Reference Bartmiński2017:11). Such studies are, however, mainly concerned with semantics (Bartmiński, Reference Bartmiński2017:9).
There are few folk linguistic studies on regional variation in Russian. One of the exceptions is Lopuxina’s (Reference Lopuxina2014) study of a village dialect in the Arkhangelsk province. Lopuxina found that speakers of this dialect had a more complex understanding of their own spoken language than previously demonstrated. On the opposition between dialect and standard language, she writes, “One’s own dialect is no longer considered to be incorrect, or something that needs to be fought” (Lopuxina, Reference Lopuxina2014:107). Footnote 12 As Lopuxina concludes, this suggests that the relationship between dialect and standard language is dynamic. The relationship between the informants’ own dialect and other dialects was found to be the same as in previous studies: the informants’ own dialect is thought to be correct (pravilʹnyj) and other dialects are thought to be incorrect and funny (nepravilʹnye i smešnye) (Lopuxina, Reference Lopuxina2014:106–7). Lopuxina’s findings are not typical for general attitudes to dialects in Russia, but if people in this community believe that there is no need to fight one’s own dialect, this could mean that the status of dialect is changing, at least in this community, or that Lopuxina’s folk linguistic approach reveals new knowledge about nuances in the status of a Russian dialect. Lopuxina’s understanding of these dynamics is also untypical of earlier research on regional variation in Russian, which has generally not taken the issue of dynamics (between varieties, in identity, etc.) into account. The findings of the few Russian studies within folk linguistics that have been conducted so far definitely suggest that research within this branch of linguistics could give important insights into dialectology and other branches of linguistics.
A different method from folk linguistics was applied in Krause et al. Reference Krause, Ljublinskaja, Sappok, Evdokimov, Kopylova, Moškina and Podrušnjak2003, where respondents were asked to locate and evaluate speech stimuli consisting of excerpts where different Russian dialects were spoken. The informants in Krause et al.’s study recognized standard varieties more readily than other varieties, while Northern dialects were recognized better as such than Southern and Siberian dialects (Krause et al., Reference Krause, Ljublinskaja, Sappok, Evdokimov, Kopylova, Moškina and Podrušnjak2003:209). Excerpts that the authors classify as standard were evaluated as more pleasant than other examples.
While the informants in Lopuxina’s study reside in a small village and speak a dialect which is quite different from the perceived standard language, the informants in my study are young city residents, and compared to features of dialects as spoken in villages, features of Russian as spoken in cities across Russia are harder to distinguish from each other. The informants in my study might not have been exposed to any traditional village dialects at all, and it is interesting to explore whether they nonetheless know of any distinguishing features in the spoken language across Russia, and further, which features they can name. Moreover, the statements of nonlinguists on the topic might also teach us more about how beliefs about language variation come into being.
3. Methodology
This study is based on perceptual maps, which were gathered as part of audio-recorded interviews with 59 Russian adolescents (Vardøy, Reference Vardøy2019). The interviews were conducted between November 2014 and October 2015, in Novosibirsk, Perm, and Moscow. In the interviews, I collected data on young Russians’ perception of regional and other variation in spoken Russian. The perceptual maps were collected in a draw-a-map task. Footnote 13 In this section, I provide context for the draw-a-map task by describing briefly how the interviews were conducted and explain my choice of methodology. I also discuss the analysis of the perceptual maps.
3.1 Choice of methodology
Montgomery & Cramer (Reference Montgomery and Jennifer2016:9ff.) present a wide range of methods that have been used in folk linguistics from the earliest publications in the field until today. Using semi-structured interviews to collect data, I aimed primarily to access the informants’ conscious knowledge and beliefs about variation in spoken Russian, to gain insight into how laypeople talk about language variation. Footnote 14 Within the frame of the interviews, the draw-a-map task was chosen as a suitable tool with which one could explore whether young nonlinguists would be willing to indicate specific places in Russia where variation occurs, and how they would label the varieties perceived as belonging to these places. Labels from the perceptual maps are the main source of data for the current article. Quotes from the interviews were added to discuss two issues for which this material was insufficient: the informants’ motivation for choice of labels and their decision for leaving an area without any label at all.
3.1.1 Draw-a-Map Task
Studies using the draw-a-map task have been done in many different countries and on many different languages. Showers-Curtis’ (Reference Showers-Curtis2019) master’s thesis studied Slovak dialect perceptions, while Schimon & Achim (Reference Schimon and Achim2016) used the draw-a-map task in their pilot study of folk beliefs of the East Slavic language Rusyn, but to my knowledge this instrument has not before been used in Russia or in Russian.
The draw-a-map task is a way of asking the informants to relate their beliefs about language variation to different locations in Russia. By indicating areas where variation occurs and labeling these areas, the informants show what kind of variation they believe exist, the size and character of the areas where they believe variation to exist, and whether they believe that Russian varies in all of Russia or just in parts of the country. Importantly, they describe regional language variation in their own terms and do not depend on their knowledge of professional linguistic vocabulary.
In this study, the draw-a-map task was presented to the informant in the second part of the interview. Before I handed out the map, I asked each informant whether she or he believes Russian to vary, and if so, how. By starting the conversation with these open-ended questions, I gave the informant the possibility to state that no variation can be found in Russian. In the cases where the informants stated that Russian does not vary, the interview nevertheless moved on to asking more specific questions, and in most cases the informant had some opinion on regional variation after all. All the informants completed the draw-a-map task even if they claimed there to be no variation in Russian.
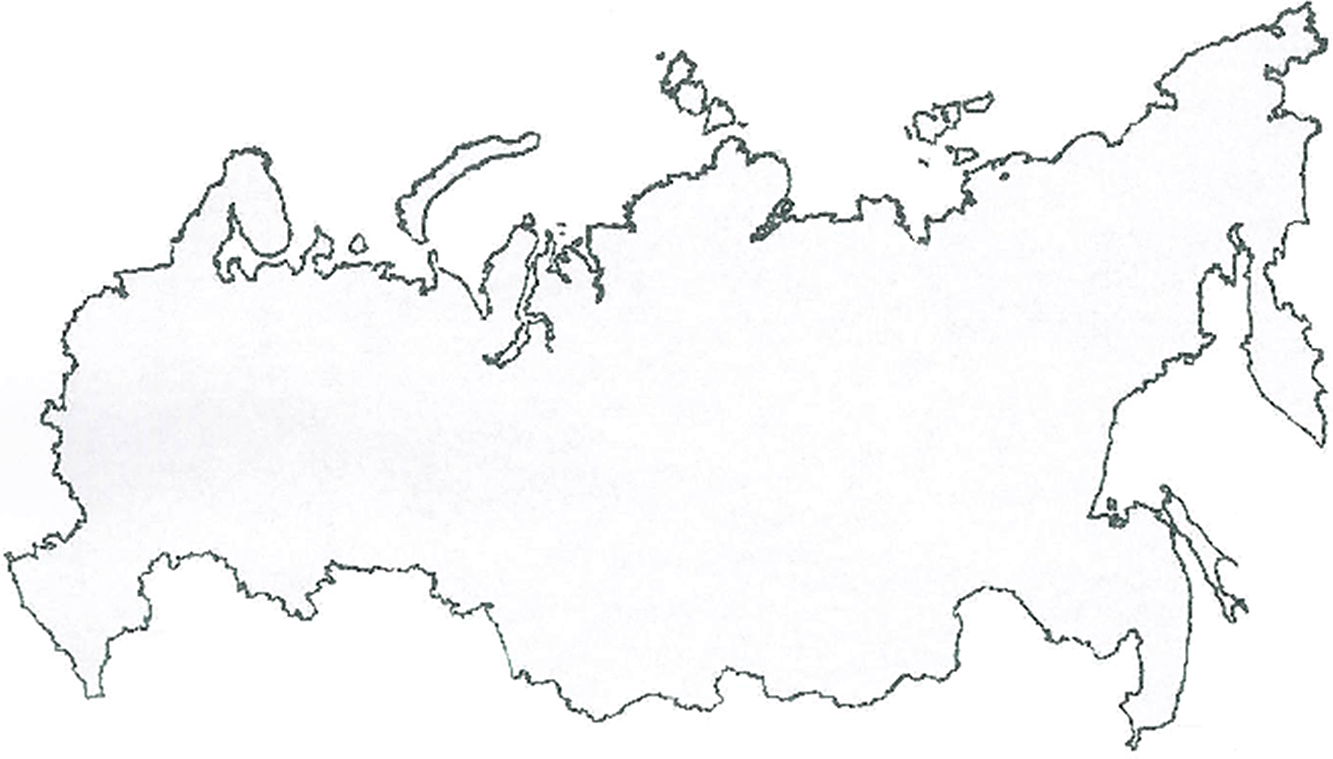
The draw-a-map task in this study is based on Preston’s study from Reference Preston1982, where the informants were presented with blank US maps and could fill in information about where they believed the language to vary, and were also asked to label these areas. Each informant was then given a map of Russia, as shown in Map 2, and a pen. The map was completely blank, with no cities or geographical clues, so as to not lead the informant to mark off certain spots rather than others. They were then asked to indicate all the different places where they believe that spoken Russian is different in any way, and to indicate how it is different. If they believed there to be no differences in Russian across Russia, they were asked to encircle the map. After an initial phase of reasoning, a political map showing Russia’s administrative units as well as larger cities (see Map 3) was given to the informant as an aid when the informant either demonstrated or stated a lack of knowledge of geography, or when he or she did not proceed with the task. This map seemed to make the task easier in other ways, too, as informants often remembered more regional variation when they had access to the political map. Footnote 15
The blank map of Russia which was presented to informants in the draw-a-map task.
The political map of Russia which was presented as an aid in the draw-a-map task.

Confusion was the main unintended downside of handing out a blank map. Very few informants had the skills in geography that would allow them to say what was where, and the vast majority of informants needed to consult the more detailed map. Preston, in his study from Reference Preston1982, changed from using blank maps to using maps with state lines or allowing the informants to consult a map with more details because of the “resulting confusion” of blank maps (Preston, Reference Preston1993:355). Lameli et al. (Reference Lameli, Christoph and Roland2008) analyzed responses to eight designs of a perceptual map with different level of detail, ranging from a map with only the national border of Germany to a map with a combination of various information: the borders of Germany, its states (Bundesländer), cities, and rivers (Lameli et al., Reference Lameli, Christoph and Roland2008:58). They found that the level of detail provided in the map impacted on how informants performed the task. On the map with only the national border informants drew large regions, and on a more detailed map that contained many German cities the response was characterized by more subtle regions. The most detailed map in the study that had states and rivers as well as cities and the national border, was found to confuse the informants because it was too detailed. Lameli et al. suggested that in any given study, the map design should correspond to the researcher’s aims for that study (Lameli et al., Reference Lameli, Christoph and Roland2008:81). In coming studies I will consider including cities in the map in order to gain access to more nuances in people’s perception of variation. Even thought my informants had access to a separate map with cities as an aid, including these spots in the actual perceptual map would have provided points of orientation that were the same to all the informants, thus making it easier to compare information across maps and to make reliable aggregate maps.
3.1.2 Approaching layman’s terminology in conversations about language variation
The conversations about language variation were designed to access young Russians’ reflections about language variation, particularly regional variation in Russia. I aimed to let the informant describe language variation using his or her own vocabulary, and the interview guide therefore aimed for a neutral vocabulary. As discussed in section 1.1, I assumed that the term dialekt would trigger social and ideological connotations and possibly be understood to mean Russian as spoken in small villages. In conversations with Russian nonlinguists, the term dialekt might therefore not be helpful when referring to variation other than remote village dialects which, to most Russians, are not part of their everyday life. I replaced dialekt with the phrases vidy russkogo jazyka; raznovidnosti russkogo jazyka (‘varieties of Russian’). I also asked where in Russia people govorjat po-raznomu (‘talk differently’). I assumed that such formulations would be perceived as neutral in the context of the current interviews because they only contain words from everyday speech. In future work I would ask what the supposedly neutral terms that I introduced signify to the informants, in order to understand whether they in fact are perceived as neutral, and which associations might arise from the terms. I would also ask informants to provide their own definition of language variation. Accessing their ideas on what it means for a language to vary would give us a better understanding of the background for their claims about regional variation.
3.2 Cities
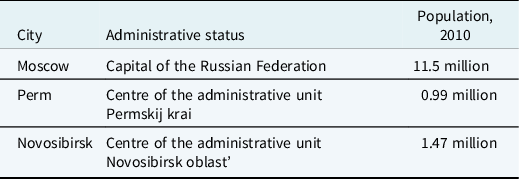
The data for this study were collected in 2014–2015, in the cities Novosibirsk, Perm, and Moscow (see Map 4 for their locations). Studies of Russian dialects (see Krause & Sappok, Reference Krause and Christian2014) have most often been interested in exploring the North, the South and a transitional area of Central European Russia, corresponding to areas traditionally separated by an accumulation of isoglosses in traditional Russian village dialects, as described in section 1.1. The three cities in this study, however, are located on a West-East axis. This provides an opportunity to compare beliefs and knowledge about language variation in Moscow, which has long been surrounded by traditional dialect areas, with cities in regions further away from these areas: one city in Ural and one in Siberia. Moscow, Perm, and Novosibirsk enjoy different levels of political status: Moscow is the national capital of Russia, while Perm and Novosibirsk are the administrative centers of their respective federal subjects, Footnote 16 Perm krai and Novosibirsk oblast’. Although both Moscow, Novosibirsk, and Perm have large populations, they differ in many respects, and Moscow stands out both in size and status, as shown in Table 1.
Locations for fieldwork. Moscow (green), Perm (red), Novosibirsk (blue).

Administrative status and population of Moscow, Perm, and Novosibirsk (Tom 11. Svodnye itogi Vserossijskoj perepisi naselenija 2010 goda. Federal’naja služba gosudarstvennoj statistiki 2010).
Few speech production studies of these sites are available. Only Moscow lies within the area of the Russian dialect atlas DARJa and is surrounded by villages where speech production data have been studied. The spoken language of Moscow city itself has also been studied (Kitajgorodskaja & Rosanova, Reference Kitajgorodskaja and Rozanova2005). Moscow is particularly known for its akanʹe, combined with an exaggerated usage and length of /a/, which makes this vowel highly salient (Bethin, Reference Bethin2010:21). Perm city speech was categorized by Krause et al. (Reference Krause, Ljublinskaja, Sappok, Evdokimov, Kopylova, Moškina and Podrušnjak2003) as an example of a regionally colored Russian standard variety (“regional gefärbte Standardvarietät des Russischen”) and as Northern Russian; the spoken language in Perm has been studied by linguists at the Perm school of sociolinguistics (Erofeeva, Reference Erofeeva2014; T. I. Erofeeva, E. V. Erofeeva & Gračeva Reference Erofeeva, Erofeeva and Gračeva2000). Erofeeva et al. (Reference Erofeeva, Erofeeva and Gračeva2000) note that Perm city speech is characterized by an articulatory base with summoned lips (Masalova, 1977, in Erofeeva et al., Reference Erofeeva, Erofeeva and Gračeva2000:39) which affects the pronunciation of the entire vowel system, as well as characteristics of the pronunciation of vowels such as ekanʹe, which is the pronunciation of [e] in orthographic E and JA in unstressed positions, and incomplete okanʹe (Erofeeva et al., Reference Erofeeva, Erofeeva and Gračeva2000:38-43. The pronunciation of consonants shows fewer features specific to Perm and suprasegmental features of Perm speech have been little studied (Erofeeva et al., Reference Erofeeva, Erofeeva and Gračeva2000:43-49). To my knowledge, there are no studies of spoken Russian from the city of Novosibirsk.
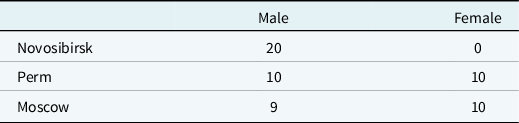
Differences between the informants in the three cities are illustrated in Tables 2 and 3 and Figure 1, and further details of the fieldwork in the three cities can be found in the paragraphs below.
Distribution of pupils and students in each city.

Distribution of male and female informants in each city.
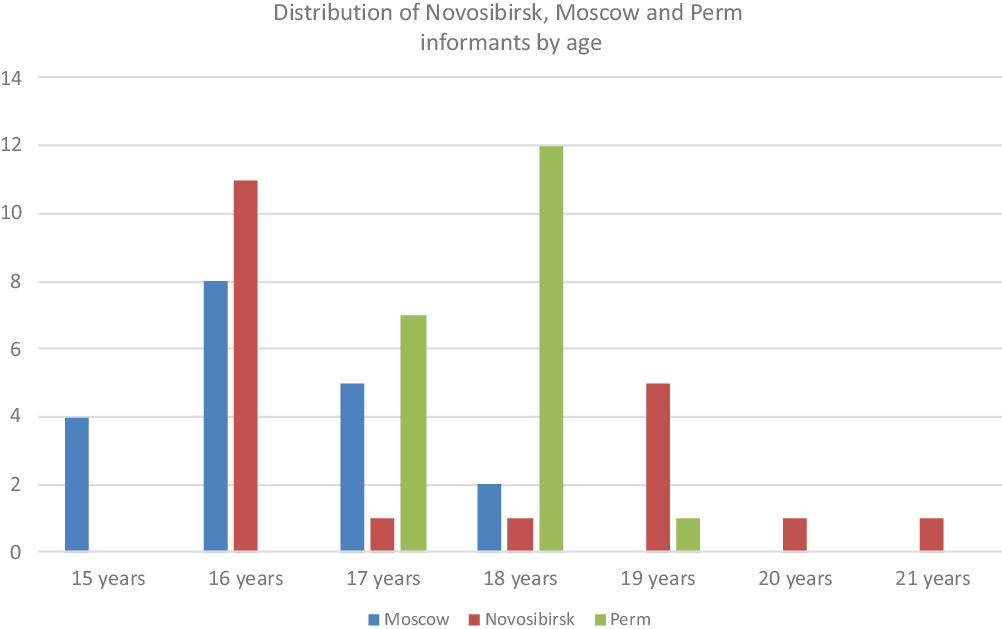
Distribution of Novosibirsk, Moscow and Perm informants by age.
3.2.1 Interviewers
The Novosibirsk interviews were carried out by two male assistants, A. and G., who were second-year students in linguistics at Novosibirsk State University. Each of them interviewed ten informants. G. is a native of Novosibirsk and A. is from Tomsk, which is located 265 km from Novosibirsk. The assistants had a training session before they started interviewing and were equipped with an interview guide. The interviewers in Novosibirsk stand out in several ways: as all the informants are male, they are the same gender as the interviewers; the interviewers are closer to the informants in age, and they are native Russians who either come from Novosibirsk or a city not far away, all of which facilitated a fairly informal and relaxed conversation. Interruption, leading questions, and suggestions from the interviewer occurred, which could be a result of little interview experience from the students’ side or inadequate training.
In Perm and Moscow, I did the interviews myself. I am a female non-Russian citizen and speak Russian well, albeit with a foreign accent. Although they were not asked to do so, the informants in Perm and Moscow might have accommodated to a simpler Russian to make sure that they were understood.
3.2.2 Data collection in Perm
The interviews in Perm were carried out in March and April 2015. Employees at Perm State University helped to establish connection with a school, and all of the informants from Perm are from this school. In Perm, there is an even distribution of ten male and ten female informants. One of the informants, Lev, reports that he has moved to Perm from a different city, but does not say when, or where he lived before. The other 19 informants are native of Perm. They are school pupils from the ninth, tenth, or eleventh grade, aged between 16 and 19 years old. All the 20 interviews in Perm were done individually. The interviews were conducted in school during, between, or after lessons.
In Perm, I received a list of ten male and ten female pupils whom I could ask to participate from the school administration, and even if I informed the pupils that participation was voluntary and would not influence their grades in any way, one could assume that they felt a certain amount of pressure to participate. In practice, not everyone on the list could or wanted to participate, and in these cases, volunteers filled in.
3.2.2 Data collection in Moscow
Seven of the interviews in Moscow were completed in April 2015, while the remaining 12 were carried out in October 2015. Contact with the school where all the Moscow interviews were conducted was established with the help of V. V. Vinogradov Russian Language Institute of the Russian Academy of Sciences. As in Perm, the informants from Moscow are school pupils from the ninth, tenth, or eleventh grade, aged between 15 and 18 years old. In Moscow there are ten female and nine male informants. The informants Jurij and Èlʹdar are not native of Moscow. Jurij moved to Moscow from a location to the North of Moscow. Èlʹdar moved to Moscow from a city in Western Siberia. All the Moscow interviews were done individually. In Moscow, recruitment was based on the voluntary participation of pupils.
3.2.3 Data collection in Novosibirsk
The interviews in Novosibirsk were conducted in November and December 2014. Half of the informants were recruited at a school, while the other half were recruited among university students. The pupils were between 16 and 19 years old, while the university students were between 18 and 21 years old, i.e., in the first or second year of their studies. Four of the students, Andrej, Valerij, Vasilij, and Aleksandr, studied language, while the others studied mathematics and natural sciences. All the Novosibirsk informants are native of their city and all of them are male: gender balance was only introduced after the Novosibirsk interviews. Contact with the school was established with the help of employees at Novosibirsk State University. The majority of the Novosibirsk interviews, 16, are individual, while the two remaining interviews had two informants in each (Andrej/Anton and Bogdan/Vadim). The pupils were interviewed at school, while the students were interviewed at their university department.
Four Novosibirsk maps, which were all drawn by pupils, were excluded from the data set because the interviewer made suggestions of labels for the informant’s perceptual map. Footnote 17 Despite these drawbacks the Novosibirsk interviews and perceptual maps contain valuable information about how young people in Novosibirsk talk about language.
3.3 Analysis of the draw-a-map data
I explored labels in the 55 maps suitable for analysis by categorizing and analyzing them mainly qualitatively. I added interview data in section 3.5 and 3.6 to comment on the informants’ choice of labels, as well as on the content of blank and semi-blank maps. Interview data could arguably have contributed to a more detailed analysis of all the maps, however, by choosing perceptual maps as my primary source, I explore the suitability of perceptual maps as a tool for accessing beliefs about regional variation in Russian.
All the 184 labels were listed and categorized in an Excel spreadsheet. The following categories were used: “location,” “variety name,” “variety feature,” “variety comparison,” “explanation for variety,” “evaluation of variety,” “people,” “evaluation of people,” and “uncertainty.” In the analysis, I focused on determining which features and groups of features were most frequent and arguably most important to my informants when talking about regional variation in Russian. I also tried to determine on what they based their beliefs. Blank and semi-blank maps were included as well, in order to discuss what a map needs to contain in order for the researcher to make a meaningful interpretation of it. This article does not deal with the spatial aspect of the perceptual maps, which could have been explored for example by creating aggregate maps in ArcGIS (Montgomery & Stoeckle, Reference Montgomery and Stoeckle2013). Footnote 18
The combination of information from several maps can illustrate similarities and dissimilarities in how young Russians perceive language variation across Russia, and also suggest which categories are most common when young Russians talk about regional variation in the spoken language.
The analysis shows where young Russians think there is regional variation in Russian. A natural follow-up to my study would be to gather production data and create an updated overview of how spoken Russian varies across Russia at all different linguistic levels, where one could compare claims and beliefs about regional variation. One could compare the places that were marked in perceptual maps and see to what degree variation actually occurs in these areas, and one could compare the perceived salience of speech differences to the differences in speech production. Footnote 19
4. Results and analysis
The 55 perceptual maps from Moscow, Perm, and Novosibirsk presented in this section demonstrate that young Russians—at least the participants in this study—think that spoken Russian varies regionally. In this section, I focus on the labels applied in the draw-a-map task. Only two informants left their maps blank, while the remaining 53 informants marked in their maps where in Russia they believed Russian to vary. 48 of these 53 maps use labels to name locations and areas, while five maps indicate areas where variation occurs with no labels attached. Map 5 shows one of the perceptual maps drawn in the current study, by Julija, a female informant from Moscow.
Example of a perceptual map. Informant Julija from Moscow. Labels (my translation): “working population −> elderly specialists −> not an innovative language,” “Jakutia −> kind and warm-hearted people,” “Spb [St. Petersburg] −> more cultured/educated than in Moscow speech is more beautiful and branchy/detailed,” “Ukraine,” “Msk [Moscow],” “Voronež Orel Belgorod very many loanwords from Ukrainian,” “Ural,” “Caucasus – rougher speech, they don’t listen to their conversation partner because of the climate there are specific terms.”

As I demonstrate in this section, folk choice of vocabulary and definitions of variation naturally differ from professional vocabulary and definitions. The informant’s approach to the task may have depended on knowledge of linguistics or language-related issues, but he or she may also have made use of other beliefs and knowledge. As a researcher, it has been my task to make sense of the statements and put them into a meaningful context, rather than to merely compare them with professional linguists’ knowledge of language variation.
The 48 maps that are marked with labels have 182 labels and the mean number of labels in each map is 3.79. Footnote 20 Below I explore how the informants solved the draw-a-map task and which labels they chose in their descriptions of regional variation in Russian. Some labels contain combinations of remarks in different categories, for instance both the categories “location” and “linguistic characteristics” are manifested in the label “Northern Caucasus (speech manner).” Footnote 21 Therefore, the total number of remarks is higher than the number of labels (see Table 4).
Categorization of remarks in labels used by informants from Novosibirsk, Perm and Moscow in the draw-a-map task. Footnote 22

In section 3.1, I present labels which refer to the linguistic characteristics of different varieties. These labels tell us how the informants believe that the spoken language varies in certain places. In section 3.2, I show what informants have named as different varieties. The two next categories are not directly connected to language variation: in section 3.3, I present names of geographical locations that were mentioned in labels, and in section 3.4, reference to other extralinguistic factors. Although the categories presented in sections 3.3 and 3.4 do not specify features in the spoken language that are deemed to be different, they do show us which areas are perceived of as different from other areas. In section 3.5, I discuss blank and semi-blank maps and the different degrees of information found in the various maps. In the last sections, I briefly discuss similarities between maps drawn in Perm, Moscow, and Novosibirsk (section 3.6) and between area and label (section 3.7), before providing my concluding remarks (section 3.8).
4.1 Linguistic characteristics
Linguistic characteristics is the most frequent category of labels in the data set. Thirty-eight maps contain a total of 86 labels that name linguistic characteristics at different levels. Among these, phonetic features were mentioned most frequently. The total number of labels referring to phonetic features is 33. Features at word level can be found in 19 maps. In these labels the informant names one or several specific lexical items that he or she finds to be specific of an area, or states that such variation exists. Accent and influence from other languages are mentioned in 16 labels. Footnote 23 In addition, comprehensive features of speech are mentioned. Labels that refer to linguistic characteristics demonstrate that informants have identified one or several specific ways in which spoken Russian in one area stands out from Russian in other areas, and that they have an opinion on where in Russia this variation occurs. Apart from okanʹe/akanʹe (see section 1.1), other features that occur in so-called traditional Russian village dialects are almost absent in the informants’ maps.
4.1.1 Linguistic characteristics at the phonetic level
Linguistic characteristics at the phonetic level were found only in maps from Moscow and Perm. Informants use different words to refer to these features. References to differences at the phonetic level are sometimes made in general terms. For instance, Mikhail from Perm claims the existence of “different pronunciation of the same words” in the European part of Russia. Footnote 24
With one exception, notes on vowel quality or quantity refer to the pronunciation of /a/ and /o/, most often okanʹe/akanʹe. Some informants describe this feature of pronunciation with the verbs akatʹ “to speak with akanʹe” and okatʹ “to speak with okanʹe,” for instance Vera from Perm who claims that “everyone speaks with akanʹe” Footnote 25 in Europe and “everyone speaks with okanʹe” Footnote 26 in the Ural and Siberia regions. The feature is also referred to as “stress on A” versus “stress on O,” Footnote 27 or the “sound ‘a’” and the “sound ‘o’,” Footnote 28 where the word ‘stress’ in particular indicates that these vowels are perceived as noticeable in certain parts of Russia. Ksenija from Perm writes that “we constantly speak with O,” Footnote 29 while Maksim from Perm claims that people “confuse ‘A’ and ‘O’” Footnote 30 in a limited area of Europe. The distribution of labels that refer to okanʹe/akanʹe between informants from Moscow, Perm, and Novosibirsk is discussed in section 3.8.
The pronunciation of /g/ not as a velar stop, but as a fricative—voiced [ɣ] or unvoiced [x] or [h], which is typical of Southern European Russian, is referred to as “fricative G” and “xy instead of g,” Footnote 31 where xy most likely refers to the fricative pronunciation. As mentioned in section 1.1, this is also a well-known dialect feature.
4.1.2 Linguistic characteristics at word level
Seven informants attribute local variants of lexical items to geographic areas where they are typically spoken. Ksenija from Perm mentions the words bordjur ‘edge of the pavement,’ and šanʹga, the name of a Russian dish which she claims is typical of the cities Perm, Ekaterinburg and Cheljabinsk. Aleksandr, a linguistics student from Novosibirsk, attributes two lexical variants of “plastic folder” to Moscow (fajl) and Novosibirsk (mulʹtifora), showing that people in various locations use different lexical items to denote the same concept. Semyon from Moscow does not provide examples, but instead offers an explanation concerning (parts of) lexical variation, claiming that word choice differs between city and village as a result of globalization: “The language differs a bit between the residents of villages and cities: city residents use more loan words, [while] village dwellers use original Russian words that are unknown to us, that are preserved in the village because it has been less affected by globalization.” Footnote 32
3.1.3 Above word level
Speed is one of the paralinguistic features which is mentioned in the data set: for example, Darʹja from Perm writes that “in Perm, [people speak] quickly and through their teeth.” Footnote 33 Another one is accessibility—how easy it is to understand the spoken language in a certain area. Anna from Perm labels three different areas as viz. “unintelligible,” “clear,” and “clear/precise.” Footnote 34 Some of the informants do not seem to possess the vocabulary to express what it is that makes spoken Russian in a certain area stand out from other areas, or they perceive the difference as vague. Valentina from Perm uses the label “strange,” Footnote 35 while Oleg from Perm writes “something.” Footnote 36
Comments on the aesthetic dimension of the spoken language were found in reference to speech in St. Petersburg and the Caucasus. St. Petersburg speech is referred to as cultured/educated Footnote 37 and beautiful. Footnote 38 Comments on the spoken language in the Caucasus area reflect style and pragmatics. Julija from Moscow claims that the Caucasus displays “rougher speech, they don’t listen to their conversation partner.” Footnote 39 These comments echo stereotypes of these cities which are tied not only to speech. St. Petersburg speech is evaluated positively, while Caucasus speech is evaluated negatively, just as St. Petersburg generally is perceived as the cultural capital of Russia and Caucasus often is portrayed as a problematic region in Russian media.
4.2 Names of varieties
Twenty maps referred to what I have called names of varieties. This category includes all the names the informants use for speech in a certain area. The 35 labels in this category refer to names of regional varieties, names of other languages or language mixtures, or names of styles.
Some of the labels concern Russian as spoken in the cities. Russian as spoken in Moscow is called “Moscow speech” or “Muscovian,” as well as “Moscow dialect.” Footnote 40 Similarly, Russian as spoken in St. Petersburg is referred to as “Petersburg speech” and “Peterburgian.” Footnote 41 Four labels refer to dialect: “village language” Footnote 42 (Lidija from Moscow), “with their own dialects” (Anna from Perm), Footnote 43 “Northern Russian dialects” and “Southern Russian dialects” (Valerij from Novosibirsk). Footnote 44 Valerij is a student of mathematical linguistics, and is bound to have learnt about dialects during classes. Anna from Perm labels one area “European,” Footnote 45 thus suggesting that Russian as spoken in Europe is united by certain features or separated from other parts of Russia in certain ways.
Some names of varieties that informants tie to specific regions would in professional linguistics be related to style, and not dialect. This includes the labels “cultured/educated Russian,” Footnote 46 “slang,” Footnote 47 and “swearword Russian,” Footnote 48 as well as “normal Russian language.” Footnote 49 The fact that informants categorize style as regional variation in Russian shows that not only dialect is perceived to influence differences in speech across Russia. As noted in section 1, Russia is a multilingual country where other languages are present to varying degree in different regions, and among the labels there were also notions of the influence from other languages, e.g., “Other languages are also possible.” Footnote 50
4.3 Reference to geographical locations
The name of a geographical location is found in 73 labels, which makes this group of labels the second largest category in the data set. Locations include cities, as well as large or small areas. Nearly half the labels, 34 labels, refer to the names of 15 different cities. Only four of the 15 cities, Moscow, St. Petersburg, Perm and Novosibirsk, are mentioned in more than one perceptual map. Perm is mentioned by nine informants and Novosibirsk by two, and they are mentioned only by their respective residents. Moscow and St. Petersburg are mentioned by informants from all three cities. Moscow, the national capital, is mentioned in 14 of the maps, while St. Petersburg is mentioned in nine. In addition to any differences in the spoken language the informants might believe there to be, these two cities, of course, are of significant cultural and political importance in Russia, and finding these two cities on maps drawn in all three cities is therefore of no surprise.
The names of areas are referred to in 39 labels. None of these areas are found in very many perceptual maps: the most frequently mentioned areas are Siberia (in five maps), Europe (in four maps), Ural (in four maps), and Jakutija (in three maps).
The location labels may or may not be followed by an explanation as to how the language differs. Additional comments are found in 37 of the location labels (17 names of cities and 20 names of areas), which helps determine the informant’s motivation for including the location in his or her perceptual map. For instance, three informants who mention Moscow include a comment on pronunciation: “Moscow (they have akanʹe)” notes Leonid from Moscow, “Moscow different pronunciation of similar words” according to Mixail from Perm, and “Moscow they put the stress on a” writes Elena from Perm). Footnote 51
4.4 Reference to extralinguistic features
Some informants demonstrate that their beliefs about regional language variation are influenced by beliefs about extralinguistic features, which suggests that they experience speech as interrelated with other factors.
In addition to the 73 references to geographical locations, there are also labels that refer to the properties of a location. Dmitrij from Novosibirsk encircles an area in the Far East, with the comment “How is it even possible to live here?” Footnote 52 , which could be understood as an ironic remark on the area’s distantness. Evgenij from Novosibirsk encircles an area in the Far East where he claims that “Because of the weather conditions they have fallen behind in life.” Footnote 53 Julija from Moscow ties regional language variation to climate factors by claiming that “because of its distinctive climate there are specific terms” Footnote 54 in Caucasus.
Some labels refer to the properties of the people who live in a certain area, like their personal characteristics (“Jakutija kind and compassionate people” Footnote 55 ), their level of education (“Low level of education” Footnote 56 ), or adherence to certain ethnic groups (“I think that people in different parts of Russia speak a bit differently. This depends on how many different ethnic groups that live in the area” Footnote 57 ). Vladimir from Novosibirsk ties regional variation in Russian to migration. All the three areas that he mentions in his map—one in the middle of Europe, a second area in the Caucasus, the third in the North-East of the Far East—are labeled “many migrants from other countries.” Footnote 58 This could mean that he thinks that the presence of newcomers who speak other languages changes Russian in the area. It could also mean that he believes that in these areas, many people speak with an accent, or merely that other languages can be heard alongside Russian.
Julija from Moscow separates and labels an area in the North of European Russia which includes the Kola Peninsula. She writes: “working population −> elderly specialists −> not an innovative language.” Footnote 59 In Julija’s mind, the language is affected by the presence of specialized workers in the area. Anatolij from Novosibirsk writes that there are religious characteristics in Jakutija that sets the region apart, thus implying that religion affects the way people speak in this area. Footnote 60 Both of the above-mentioned examples show how beliefs and knowledge about people’s life in a certain area can influence the perception of language variation.
4.5 Choice of labels
The categorization presented in the previous paragraphs of this section conceals how often a place was identified as having regional variation in spoken Russian, since the same location could be marked with labels in different categories. For example, labels that refer to “Moscow” (12 labels) and “Moscow speech” (three labels) refer to the same location on the map and perhaps also to the same object. On the other hand, unless specified, the object behind the label “Moscow” could be anything that the informants perceive of as related to Moscow. In this section, as well as in section 3.6, I include interview excerpts. The purpose of this is to illustrate the benefit of combining the draw-a-map task with other methods in cases where map data are insufficient. The examples below demonstrate cases where the labels “Moscow” and “Moscow speech” both seem to refer to Moscow speech.
Arkadij from Novosibirsk uses the label “Moscow speech different.” In the dialogue with the interviewer he reveals that he does observe certain differences in Moscow speech, but is unable to describe it.
Interviewer: If in your opinion it doesn’t differ anywhere, you can draw one big circle.
Arkadij: (laughs) // Ok/we-ell right away I can sug-/suggest that Moscow is around here somewhere right? //
Interviewer: Well yes.
Arkadij: Yes/like this // (pause 2.8 sec) // So/what should I write? // Simply Muscovites/it is something particular (laughs) //
Interviewer: Muscovites, well, Moscow (unintelligible), which peculiarities you believe there are.
Arkadij: Muscovi- Moscow-
Interviewer: If you don’t know you can (unintelligible) just that you think that it is different.
Arkadij: Well it’s definitely different // So/It just takes some talking // (laughs) // Because I have had conversations you see // (pause 5 sec) // You see with Piter [St. Petersburg] it will be more difficult // (laughs) // Somewhere to the North // Hm-m/I’ll try not to embarrass myself!// (Pause 2.5 sec) Footnote 61 (Interview extract 3.1, my translation.)
Moscow is the first place/area that Arkadij marks off in his map after receiving instructions from the interviewer. In Arkadij’s words, it “just takes some talking” to understand how Muscovite speech is different. His observation seems to be closely tied to the communicative situation, the speaker, or even the location.
Ksenija from Perm uses the label “Moskva,” which in section 3.3 thus was classified as a location. In the dialogue with the interviewer, it turns out that she is referring to Moscow speech: she talks of Muscovian long vowels, and mentions Perm speech as an example of the contrary: “summoned,” “closed,” and “in a way colder” speech.
Interviewer: Yes, just write what you …
Ksenija: Ok //
Interviewer: …know. What y … you believe. And write down, please, how it differs.
Ksenija: With words? // Or … //
Interviewer: Yes, something like that. Either words or other differences.
Ksenija: (pause 38 sec, writes) // N-n by the way there is one more peculiarity/well I guess the guys already told you about it // So/in Moscow/they very often speak with a-a/a long letter a-a // So/Moscow (Moskva-a)/A beauty (krasota-a) // Bu-ut/in Perm/o/in other words everything is so/summoned/closed // In a way colder //
Interviewer: And you? Do you speak like that?
Ksenija: To be honest I don’t know/in order to know/it is probably necessary to hear from the outside/So/I don’t know Footnote 62 //
(Interview extract 3.2, my translation.)
The examples above show that it can be useful to record the data gathering process in order to be able to consult additional, spoken data in cases where map data are unclear.
4.6 Blank and semi-blank maps
I here present the maps that were left blank, as well as maps that contained little information. As already noted, two informants, both from Perm (Pavel and Nikolaj), choose to leave the map of Russia completely blank, not identifying any specific area where Russian stands out as different. In addition to the informants who left their maps blank, I discuss the maps that can be characterized as partly empty.
Only 11 maps split the whole of Russia into labeled zones, which means that the majority of the maps in the current study do not provide any information on whether the informant thinks that Russian varies across the entirety of Russia. The fact that only 11 informants choose to split entire Russia into zones indicating the variation of Russian could reflect the opinion that variation is not the norm, but, on the contrary, deviations from the Russian as spoken by the majority. Most informants, though, do not say whether they believe there to be such a spoken norm in Russian, nor do they specify any areas where such a norm would be spoken. The failure to split the whole of Russia into zones could also mean that most informants are not able to say something about how Russian varies in all parts of Russia. Labeling the entire area was not a requirement for participation in the study. There is little to suggest that an incomplete map is less valuable than a map labeling all of Russia, at least for the purposes of this study.
When analyzing spatial aspects of the perceptual maps, the most problematic maps in my data set are those that lack a one-to-one correspondence between label and area. In all the maps there are 51 unlabeled regions, three unlabeled dots, and one unlabeled arrow. While 48 maps contain labeled locations or areas, many of them contain unlabeled locations or areas as well. In order to explore the character and significance of both labeled and unlabeled locations in the informants’ minds—whether they be labeled or not—aggregate maps would be helpful (Montgomery & Stoeckle, Reference Montgomery and Stoeckle2013).
4.6.1 Interpreting Unlabeled Areas in the Maps
It is challenging to interpret unlabeled areas in a meaningful way, especially maps that are left entirely without labeled areas. Four maps have lines, but no labels. To be able to comment on the informants’ motivation for marking areas without labeling them, it is helpful to include excerpts from the adhering interviews like in section 3.5. For example, while he draws the map, Jaroslav from Moscow says that he separated an area around Moscow because of their “dialect with akanʹe.” Footnote 63 Later in the interview, though, he raises doubts about his decision to separate this area:
Jaroslav: This/well/eh here I have properly separated the Moscow territory (laughs) // eh but it is incorrect // eh/generally you can disregard (laughs) this map/honestly // I shouldn’t have drawn anything // But/I tried // a shot in the dark // I tri-/I tried // (sighs) Footnote 64
(Interview extract 3.3, my translation)
Earlier in the conversation Jaroslav makes imitations of both akanʹe and okanʹe, and ties akanʹe to Moscow and okanʹe to Vologda, so he does not seem to lack any justification for separating the Moscow area. His decision not to write down in what way he thinks Russian varies in this area might be based on lack of confidence, but his doubts might also mean that he does not really think that this variation is important enough to be written down. Another example is Vasilij, a student of philology from Novosibirsk, who comments on four places where he thinks that Russian varies: 1) Novosibirsk, where he suggests that there is okanʹe, Footnote 65 2) the Northern regions and particularly the Far East, where, he says, some peculiarities in the language are present, Footnote 66 3) peoples in Caucasus “and so on,” who migrate, Footnote 67 and 4) “the most typical Russian language” Footnote 68 which, he claims, is spoken in Western Russia. Vasilij nevertheless also chooses to leave his perceptual map free of labels.
4.7 Differences between maps drawn in Novosibirsk, Perm, and Moscow
The differences in maps drawn in Perm, Moscow, and Novosibirsk are in many cases found only at an individual level, but some differences can still be spotted when comparing cities. We will now have a closer look at how the labels with linguistic features were distributed (Table 5).
Labels referring to linguistic features in the data set.
** Two informants are not native to Moscow. These account for four labels referring to linguistic features.
* One informant is not native to Perm. He does not note any linguistic features in his map.
*** 7 students and 2 pupils.
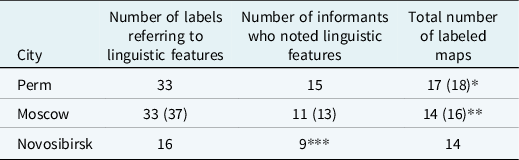
Linguistic features are mentioned by far fewer informants from Novosibirsk than from Moscow and Perm, and the Novosibirsk informants mention fewer linguistic features each. Notes on okanʹe and akanʹe are found only in Perm and Moscow maps and okanʹe/akanʹe is the most frequent specific feature in the maps from Perm. In Perm, 12 of the informants are aware of okanʹe and akanʹe and mark it in their maps (18 labels), while this feature is less commented on by the Moscow informants (3 informants, 4 labels). As mentioned in section 1.1, okanʹe/akanʹe is a well-known dialect feature, and my data show that many of the informants know of its existence. Okanʹe is a feature that is considered typical of the Perm region, while Moscow is, as mentioned in section 2, known for salient pronunciation of /a/ (Bethin, Reference Bethin2010:21). This might explain why informants from these two cities are eager to report on okanʹe/akanʹe. Okanʹe/akanʹe is not mentioned at all by the informants from Novosibirsk. This could be because the local pronunciation of unstressed /o/ is not perceived as salient in any way by the informants.
Notes on lexical variation are found much more frequently in perceptual maps from Moscow than in the ones from Perm and Novosibirsk: In Moscow, ten informants report on lexical variation across Russia, in 13 labels (e.g., Lidija “moskovskij (bardjur)” ‘Muscovian (sidewalk),’ “piterskij (porebrik)” ‘Peterburgian (sidewalk)’). Meanwhile, in Novosibirsk, only one (student) informant mentions lexical items, and in Perm, three informants do so. Certain lexical differences between St. Petersburg and Moscow are often-quoted stereotypes of the linguistic difference between the two cities Footnote 69 and this might explain why lexical items occur most often in the maps from Moscow.
The city of Moscow is mentioned in 14 maps, and the majority of the maps mentioning Moscow, eight of them, are drawn by Perm informants. Moscow is mentioned by three informants from Novosibirsk and three from Moscow. The fact that Moscow is mentioned most often in Perm might indicate that the Perm informants perceive of a difference between Moscow speech and the spoken Russian that they have experienced either in their hometown or elsewhere in Russia. In particular, this can be related to their reported knowledge of the akanʹe/okanʹe opposition, as many Perm informants indicate an opposition between akanʹe in and around Moscow versus okanʹe in and around Perm.
4.8 Summary
In this section, I have described perceptual maps of regional variation in Russian drawn by informants in Perm, Moscow, and Novosibirsk. As shown, both linguistic as well as extralinguistic features are mentioned, and certain features and varieties are mentioned more frequently than others. The semi-blank maps illustrate that it may be difficult to clearly distinguish between those who do believe Russian to vary, and those who do not, based only on perceptual maps. I found it useful to add interview data for two purposes: in order to assess unclear reference and in order to understand why some informants left areas unmarked. Even if, for these particular purposes, the map data are insufficient, such shortcomings could have been avoided by improving the study design. The informants could have been asked to specify any unclear references while they filled out the map, and they could have been encouraged to write down all the regional variation that they mentioned orally, on their maps.
I have demonstrated how labels relate to different categories and provide different amounts of information about regional variation in Russian. When informants either refer to a geographical location or name a variety, they implicitly state that some sort of variation occurs. In naming specific linguistic features, they provide more detailed information about what it is that varies in a given area. It seems reasonable to assume that the features that the informants mention are perceived of as particularly important in separating spoken Russian in one area from other areas. Labels that refer to the evaluation of regional variation as well as labels with reference to extralinguistic features provide insight into the informants’ associations with the spoken language in a certain area, and the social meaning that they assign to it.
Perm reports most eagerly on linguistic characteristics, while Moscow has most labels relating to lexical items. No single feature is found consistently in all or most of the maps. One of the weaknesses of the draw-a-map task is that it does not give any information on what the informant does not choose to talk about. Based on this study it is therefore impossible to ascertain where the informants believe that Russian does not vary, unless they explicitly state that Russian is the same across Russia, like two of the informants did.
5 Discussion
In this section, I discuss the characteristics of the perceptual maps, relating the informants’ perception of regional variation in Russian to previous research in the field (section 4.1). I also explore the links that informants made between language and other domains in the course of the draw-a-map task (section 4.2). Such links might provide valuable insight into how young Russians organize their beliefs on language. In section 4.3, I discuss the explanatory value of perceptual maps in the Russian context.
5.1 Ideas on how and why Russian varies
One of the aims of the current study was to find out what regional variation young Russian city dwellers believe can be found in Russian and how they describe this variation. As shown in this article, the informants demonstrate that they do have ideas on how and why Russian seems to vary. No single feature was noted in all or most of the perceptual maps, however, as shown in section 3.7, certain features were more typically noted by informants from Perm (akanʹe/okanʹe) and Moscow (lexical items).
According to the perceptual maps of the young informants in this study, regional variation is typical not only for people in distant villages, but also for larger parts of the Russian population, as they claimed that there is regional variation both in cities and larger areas. Russian as spoken in different cities does not vary a lot, but cities make up a large part of the places that were mentioned in the perceptual maps. As the informants may not have much experience with villages in general and, in particular, with village speech in different parts of Russia, it may be easier for them to relate to cities. However, as my findings suggest, the variation that they have in mind does not necessarily fit into a diaglossic model of Russian (Krause, Reference Krause2011) with the so-called standard language on top and traditional village dialects at the bottom. The informants’ labels may also refer to stylistic variation in language and include the evaluation of speech on scales of beauty or educatedness. Such scales are among those typically used in matched- and verbal guise tests in the operationalization of language attitudes (see Andrews, Reference Andrews1995, Reference Andrews2003), and the association of personality traits with language is well-explored in sociolinguistics (Kristiansen & Grondelaers, Reference Kristiansen and Stefan2013).
Particularly the connection between style and location may suggest the presence of one or several (linguistic) norm centers and peripheries in Russia. Moscow is the national capital of Russia and St. Petersburg is nicknamed the “cultural capital” of Russia, and both cities have high media exposure. As Montgomery (Reference Montgomery2012) writes, “[c]ultural prominence functions by bringing ‘far away’ areas ‘closer’ to respondents through increased exposure in various forms of media and public discourse,” and these cities are expected to be perceived as close and relevant sites to the informants. As noted, St. Petersburg, a city which is often called the “cultural capital” of Russia and thus is an important norm center, is tied to educatedness in the data set, while Russia’s national capital Moscow is frequently mentioned. Neither city is ever described in negative terms in the data set. Locations further away are more frequently tied to language mixture or accent, geographical distance or low level of education—factors which might distinguish and estrange the spoken language from what one of the informants termed “normal/regular Russian language” Footnote 70 —a perceived unmarked Russian spoken by natives in central European Russia.
5.2 Regional variation is perceived as a fuzzy category
The informants in this study believe regional variation in Russian to be related to other linguistic (style, language contact) and extralinguistic (speaker characteristics, geography) domains.
If we wish to understand how informants have acquired the beliefs and knowledge that lie behind their claims about regional variation in Russian, it is crucial to account for the domains that informants experience to be interrelated to language. An explanation might be that the informants experience certain factors as interrelated with language and also as natural elements in their discourse on language. If this is the case, such interrelations can give valuable insight into how laypeople view language. This orientation towards the role of language versus other domains is in line with previous research within folk linguistics and third wave sociolinguistics. Preston (Reference Preston2010:3) writes that “a conceptual world of language ideologies lies behind the more superficial categories of language differentiation,” while Eckert (Reference Eckert2019:754) claims that “iconic connections are central to language ideology (Irvine & Gal, 2000), allowing the construal of language features or entire varieties as natural reflections of a characterological construal of their speakers. Iconicity is also fundamental to variation (and expressivity more generally), as the social meaning of a variable can be intensified by repetition.” Thus, claims which at first sight seem to have nothing to do with language can, in fact, explain certain iconic connections and help us approach the informant’s particular language ideologies. Bringing in knowledge and beliefs from other domains could also be explained by a strong personal interest for instance in geography or demography, or possibly by a lack of knowledge about regional variation in Russian, using other knowledge and beliefs to fill in that gap.
In the current study, regional variation in Russian seems to be understood by most of the informants as a fuzzy domain or category which is not readily distinguishable from other spheres such as personal characteristics or geography. Based on the maps I have identified style, language contact, speaker characteristics, and location characteristics as domains bordering on regional variation in the eyes of my informants. In a word, these are domains that might have played a role in shaping the informants’ particular language ideologies, and domains that they often consult when they need to relate to regional variation in Russian, at least when they are forced to consider how regional variation could be represented on a perceptual map. My findings suggest that taking beliefs and knowledge in these domains into consideration could enrich further studies within folk linguistics among adolescents in Russia.
5.3 The explanatory value of perceptual maps
The chief aim of the draw-a-map task was to let informants suggest where in Russia they believe that the spoken language varies, and to map any kind of regional variation that they think exists. The analysis of data from the 53 maps included in this study has shown that perceptual maps can indeed be used to access nonlinguists’ beliefs about regional variation in Russian. It has allowed us to make conclusions about the perceived character of regional variation in Russian, and to discuss factors that lie behind their explanations for this variation. The analysis has also shown that there is much more to be learned about regional variation in Russian and how it is perceived by nonlinguists.
In most of the perceptual maps, only a small number of areas were indicated. Each perceptual map therefore provides a somewhat incomplete model where the informant emphasizes the variational features of his or her choice. The combination of data from several maps provides additional information about what is considered more and less important to young Russians when talking about regional variation in the spoken language.
In this study, little attention has been given to the character of individual maps. At an individual level, some maps mainly contain labels related to dialect. Other maps have labels related to other linguistic or extralinguistic domains, either instead of, or in addition to, the dialect-related ones.
Based on the perceptual maps, it has not been possible to distinguish between informants who think that variation in the labeled areas is universal, relating to all levels of spoken Russian, and those who perceive it is partial, relating only to the features that they note on the map. A suggestion for further draw-a-map studies of spoken Russian would be to ask the informants to write down how different they think the varieties that they name actually are. If, for instance, an informant perceives two single lexical items to be the only thing that sets spoken Russian in Moscow apart from Russian in other places, the difference would perhaps hardly be noticeable in daily life. If, on the other hand, these lexical items are simply two examples out of many, or perceived as particularly salient, the perceived difference would be larger. Another suggestion for further studies is to ask the informants whether they believe variation or non-variation to be the norm in Russian. These two adjustments to the task could contribute to further accessing the folk model of regional variation in Russian, both as an autonomous model, and in light of the professional sociolinguistic discourse, including the presence of di(a)glossia in Russian regional variation (Krause, Reference Krause2011) and the interpretation of standard language as a “negative dialect” (Andrews, Reference Andrews2006).
This article has focused on perceptual maps. A combination of perceptual maps and other folk linguistic methods, which would be highly recommended for further studies, would give an even deeper understanding of perceived regional variation among young Russians.
6 Conclusion
In the current study, I have shown that almost all the adolescents from Moscow, Perm, and Novosibirsk who participated in my study indicate in their perceptual maps the presence of regional variation in spoken Russian in one or several geographic areas. The informants in this study refer to variation in different categories and with different levels of abstraction, although the labels that they use have little in common with scientific descriptions of Russian base dialects. This suggests that regional variation in spoken Russian is something that young Russians can to a large degree relate to. The results of my study indicate that the underlying motivations for claims about regional variation in spoken Russian needs to be examined more closely in order to understand the role that regional variation in spoken Russian plays in young Russians’ ideas about language. To the informants in this study, language is definitely more than its formal structure. While knowledge and belief about particular language features indeed are key sources for their claims, one must also take into account other knowledge and beliefs that the informants experience to be interrelated with regional language variation. This does not mean that the informants lack an opinion on where in Russia the spoken language can be said to vary, but rather implies that they perceive other linguistic and extralinguistic factors as relevant to regional variation in Russian. A wide definition of language including many explanatory factors is typical for the informants in this study. I argue that in order to grasp what their beliefs about regional variation in spoken Russian actually mean, it is important to understand how informants have acquired them. Taking the origin of the informants’ beliefs into account can help explain more clearly what role regional variation in spoken Russian plays in the minds of young Russians.
Acknowledgments
Fieldwork for this study was financed by two project grants from the Meltzer foundation. Other parts of the project have been financed by the Department of Foreign Languages at the University of Bergen.


 Open access