


1. Introduction
Robotics as a branch of Artificial Intelligence aims to build embodied intelligence systems to perform tasks in structured and unstructured environments [Reference Bentley1]. Robot path planning, a crucial component of robotics, includes choosing the best route for a robot to take from its current location to a specified objective location while avoiding obstacles and abiding by a variety of limitations.
Research is advanced in achieving intelligent navigation and task performance of robots. Recent advancements in robotic path planning have introduced various innovative approaches that address the challenges of navigating complex environments. For example, the study of Boscariol et al. [Reference Boscariol, Gasparetto, Scalera, Carbone and Laribi2] focused on developing and refining path-planning algorithms for special robotic operations, where robots are deployed in complex environments requiring high precision, safety, and efficiency. Orozco-Rosas et al. [Reference Orozco-Rosas, Picos, Pantrigo, Montemayor and Cuesta-Infante3] also proposed Q-learning artificial potential field technique to address path-planning problem.
Various path-planning methods categorized into nature-inspired computation, conventional, and hybrid methods were used by researchers to address path-planning problems [Reference Ayawli, Chellali, Appiah and Kyeremeh4]. The popular category of global path-planning methods is roadmap (RM) path-planning methods including probabilistic roadmap (PRM), rapidly exploring random trees (RRT), and Voronoi diagram (VD) [Reference Ayawli, Appiah, Nti, Kyeremeh and Ayawli5, Reference Karaman and Frazzoli6]. PRM is particularly notable for its efficiency in exploring large configuration spaces by randomly sampling the environment, as discussed by Santiago et al. [Reference Santiago, de Ocampo, Ubando, Bandala and Dadios7]. RRT have gained popularity for their ability to quickly explore vast and unstructured spaces, making them ideal for real-time applications [Reference Aguilar and Morales8–Reference Katiyar and Dutta13 ]. VD is a spatial partitioning method used in robotics for efficient path planning, dividing space based on proximity to predefined points, and enhancing navigation by complementing other techniques [Reference Katona, Neamah and Korondi14]. Another global path-planning method apart from PRM, VD, and RRT is the visibility graph (VG) [Reference Ayawli, Appiah, Nti, Kyeremeh and Ayawli5]. The VG technique involves constructing a graph where nodes represent key positions (such as the start, goal, and obstacle vertices), and edges connect nodes that have a direct line-of-sight, allowing for the computation of the shortest path in environments with well-defined obstacles.
To provide efficient path-planning algorithms, most researchers explore hybrid methods. Some of the popular proposed hybrid methods considered RM path-planning techniques including PRM, VD, and RRT. For example, in ref. [Reference Ayawli, Appiah, Nti, Kyeremeh and Ayawli5], VD was combined with morphological dilation to propose an algorithm for mobile robot path planning in complex and dynamic environments. Also, an extreme learning machine (ELM) was combined with improved RRT in ref. [Reference Meng, Li, Zhang and Sun15] to address path-planning problems. Moreover, Qiao et al. [Reference Qiao, Luo and Luo16] combine artificial potential field and PRM to address path-planning problems in complex environments. The integration of recent methodologies with these established RM techniques underscores the ongoing evolution of path-planning strategies. Despite the popularity and successes chucked by the integration of RM path-planning methods with others over the years compared to other global path-planning methods, the challenge of achieving intelligent path planning in complex environments persists [Reference Tao and Kim17, Reference Rezaee, Hamid, Hussin and Zukarnain18]. It remains a significant challenge to determine the appropriate choice of RM path-planning methods to integrate with other methods to compute a safe and optimal path with minimal computational time [Reference Ayawli, Chellali, Appiah and Kyeremeh4, Reference Qi, Yang and Sun19–Reference Francis, Faust, Chiang, Hsu, Kew, Fiser and Lee21].
To contribute to research in this area, this article reviewed and performed a comparative analysis of the popular RM path-planning methods including PRM, RRT, and VD to assess the safety of the computed path, path optimality, and the computation time in environments with different complexities and obstacle occupancy rate.
The main contributions of this review paper are summarized as follows:
-
• To perform a comparative analysis of PRM, RRT, and VD RM path-planning methods in terms of path length, computation time, and path safety.
-
• Demonstration of the stability of PRM, RRT, and VD path-planning methods across various environmental complexities and obstacle densities.
-
• Identification of specific scenarios where each method excels, offering insights into the selection of integration of appropriate path-planning methods for different applications.
-
• Proposal of future improvements for each method based on observed limitations.
The following sections of this article are organized to first provide an overview of the RM path-planning methods (Section 2), followed by a detailed description of the methodology used in this study (Section 3). The comparative analysis results are presented in Section 4, and the article concludes with a discussion of the findings and suggestions for future work in Section 5.
2. Overview of RM path planning
Mobile robots operate in a workspace $W$
made up of obstacles
$W$
made up of obstacles $W_{obs}$
of different shapes. The rest of the
$W_{obs}$
of different shapes. The rest of the $W$
is described as the free workspace
$W$
is described as the free workspace $W_{free}$
. Robot navigation is expected in the
$W_{free}$
. Robot navigation is expected in the $W_{free}$
. A RM can be described as a set of edges and points such that for a given initial and goal position in
$W_{free}$
. A RM can be described as a set of edges and points such that for a given initial and goal position in $W_{free}$
, a path can be connected. RM is made up of a set of paths between two given points in the
$W_{free}$
, a path can be connected. RM is made up of a set of paths between two given points in the $W$
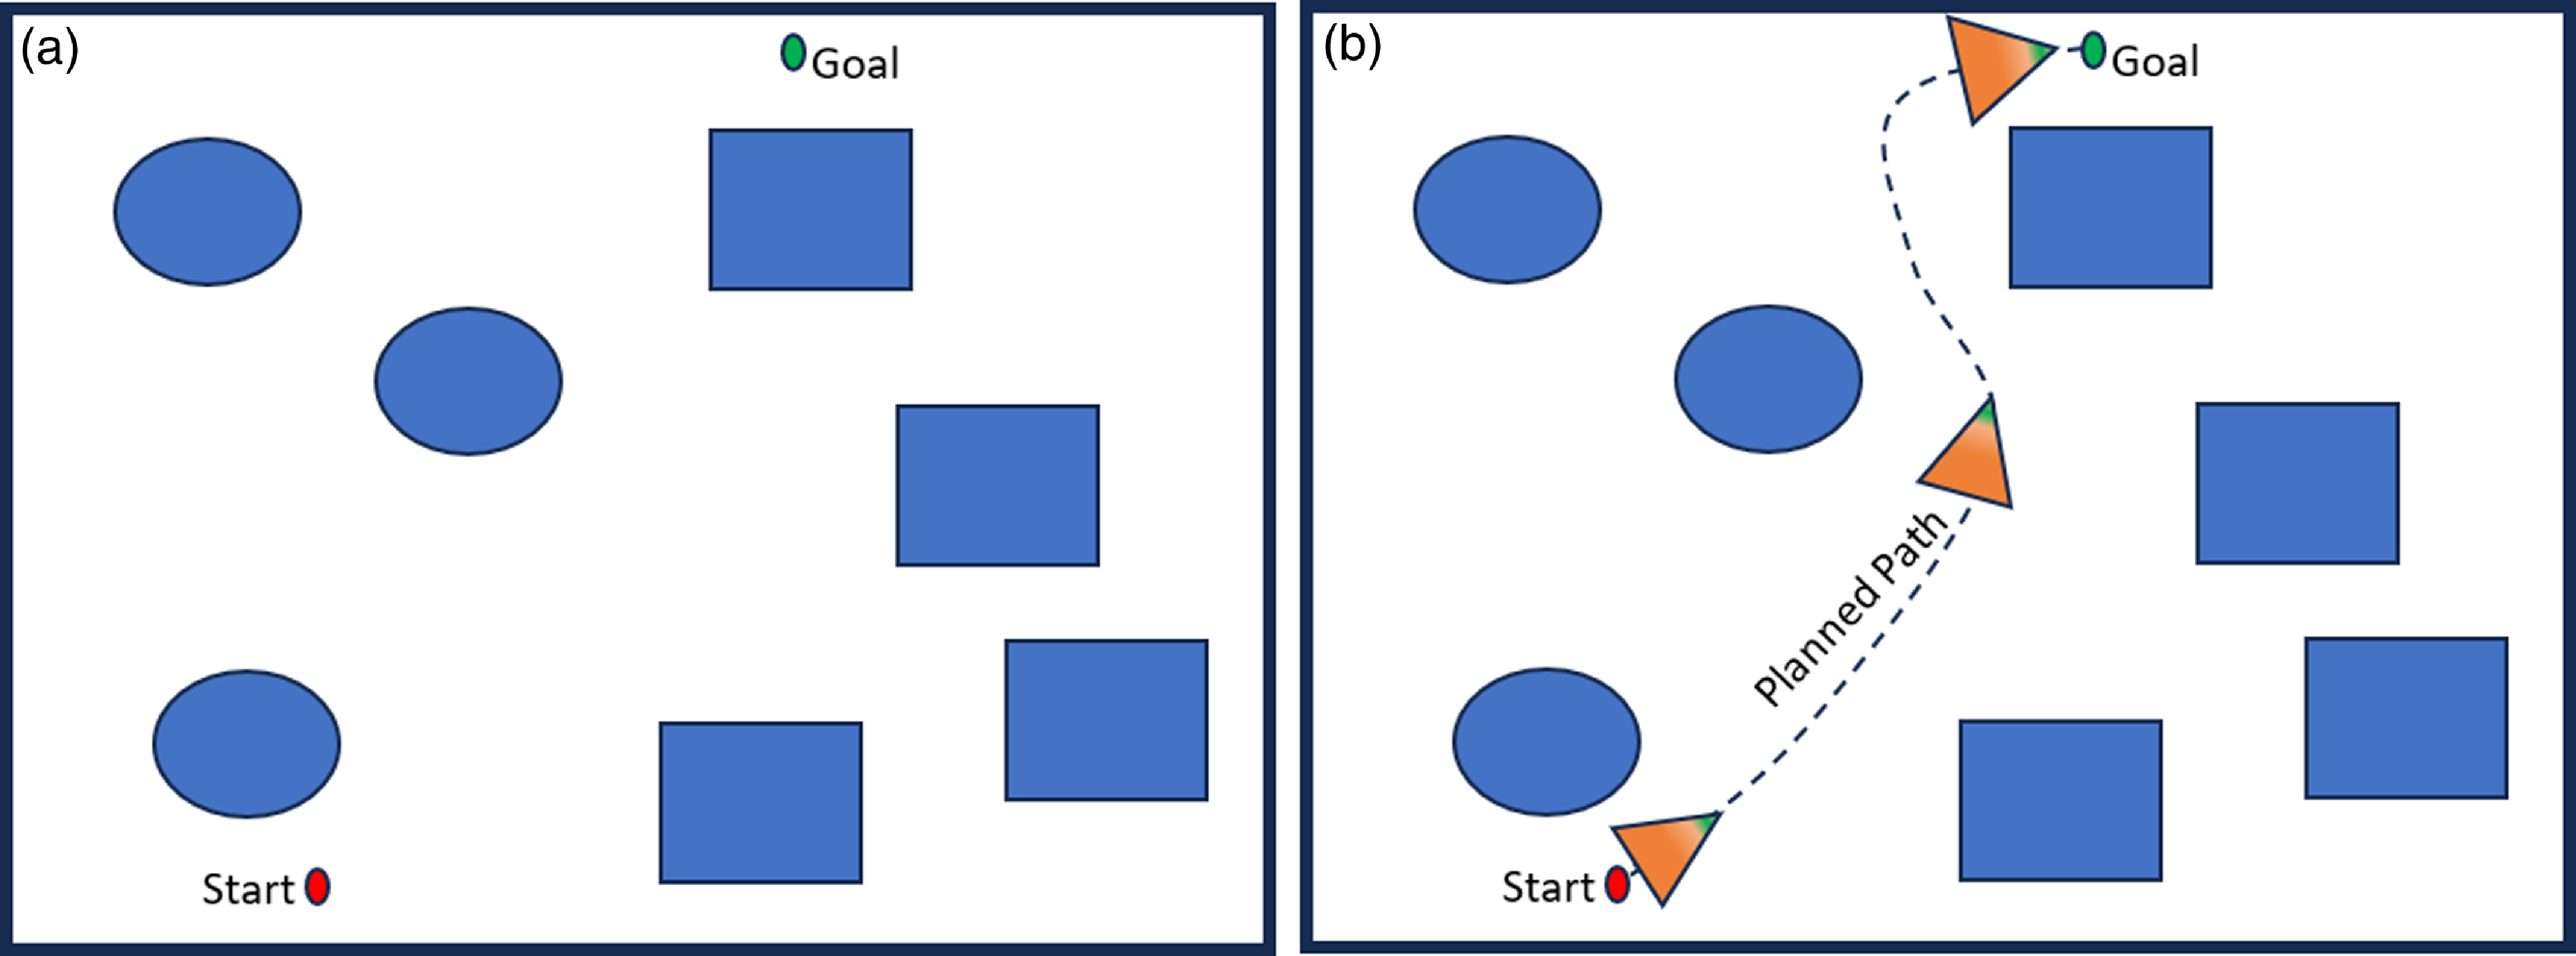
where the robot can navigate without colliding with obstacles. Figure 1(a) and (b) shows samples of workspace with obstacles, Start, and Goal positions. This collection of paths can be stored as a graph with vertices and edges
$W$
where the robot can navigate without colliding with obstacles. Figure 1(a) and (b) shows samples of workspace with obstacles, Start, and Goal positions. This collection of paths can be stored as a graph with vertices and edges $\mathcal{G}(V,E)$
[Reference Klančer, Zdešar, Blažič and Skrjanc22]. From each point on the RM, a goal point can be accessed and connected.
$\mathcal{G}(V,E)$
[Reference Klančer, Zdešar, Blažič and Skrjanc22]. From each point on the RM, a goal point can be accessed and connected.
Dijkstra algorithm

(a) Configuration space with obstacles, start, and goal positions (b) Expected path for a mobile robot in the configuration space.
There is, therefore, a path in $RM\in W_{free}$
from
$RM\in W_{free}$
from $V_{\textit{start}}\in W_{free}$
to some
$V_{\textit{start}}\in W_{free}$
to some $V^{\prime}\in W_{free}$
, and there is a path from some
$V^{\prime}\in W_{free}$
, and there is a path from some $V^{\prime\prime}\in W_{free}$
to
$V^{\prime\prime}\in W_{free}$
to $V_{goal}\in W_{free}$
. There exists a path in RM between
$V_{goal}\in W_{free}$
. There exists a path in RM between $v^{\prime}$
and
$v^{\prime}$
and $v^{\prime\prime}$
. RM path-planning involves using algorithms to build RM in the
$v^{\prime\prime}$
. RM path-planning involves using algorithms to build RM in the $W_{free}$
of the workspace of the robot after which a path is computed between the initial point of the robot to the goal point. Search algorithms including Dijkstra’s, theta*, D*, and A* are then used to compute an efficient path from the initial position to the goal position using the graph generated by the RM method. Given
$W_{free}$
of the workspace of the robot after which a path is computed between the initial point of the robot to the goal point. Search algorithms including Dijkstra’s, theta*, D*, and A* are then used to compute an efficient path from the initial position to the goal position using the graph generated by the RM method. Given $\mathcal{G}(V,E)$
of the RM with the initial point
$\mathcal{G}(V,E)$
of the RM with the initial point $s$
, and goal point
$s$
, and goal point $g$
, Algorithms 1 and 8 outline the Dijkstra’s and A* algorithms that could be used to generate the path for RM path-planning methods, respectively.
$g$
, Algorithms 1 and 8 outline the Dijkstra’s and A* algorithms that could be used to generate the path for RM path-planning methods, respectively.
RM path-planning methods can be classified into two namely: geometry-based and sampling-based (SB) methods. These methods are discussed in the next sections.
3. Geometry-based roadmap path-planning methods
Geometry-based roadmap (GBRM) path-planning methods employ geometry computation techniques to compute the vertex and edges of the RM based on the $W_{obs}$
and
$W_{obs}$
and $W_{free}$
of the workspace of the robot. Other constraints are also considered in generating the RM to ensure the safety and quality of the RM. The popular GBRM methods used by researchers over the years to address path-planning problems include the VG [Reference Lee, Choi and Kim23] and the VD [Reference Candeloro, Lekkas and Sørensen24]. The most popular of these methods is the VD.
$W_{free}$
of the workspace of the robot. Other constraints are also considered in generating the RM to ensure the safety and quality of the RM. The popular GBRM methods used by researchers over the years to address path-planning problems include the VG [Reference Lee, Choi and Kim23] and the VD [Reference Candeloro, Lekkas and Sørensen24]. The most popular of these methods is the VD.
3.1. VG path-planning method
In a polygonal configuration space, a VG is used to generate points and edges in $W_{free}$
where connections are made to join all visible points to form a RM. The initial and goal positions are included as points for the connection [Reference Klančer, Zdešar, Blažič and Skrjanc22]. Two points on a VG are connected, provided visibility can be established between them. Considering two arbitrary data values
$W_{free}$
where connections are made to join all visible points to form a RM. The initial and goal positions are included as points for the connection [Reference Klančer, Zdešar, Blažič and Skrjanc22]. Two points on a VG are connected, provided visibility can be established between them. Considering two arbitrary data values $(x_{i},y_{i})$
and
$(x_{i},y_{i})$
and $(x_{j},y_{j})$
to have visibility between them, a connection between these points can be established if any other data point
$(x_{j},y_{j})$
to have visibility between them, a connection between these points can be established if any other data point $(x_{k},y_{k})$
inserted between
$(x_{k},y_{k})$
inserted between $(x_{i},y_{i})$
and
$(x_{i},y_{i})$
and $(x_{j},y_{j})$
satisfy Eq. (1) [Reference Lacasa, F.Ballesteros, Luque and Nuno25].
$(x_{j},y_{j})$
satisfy Eq. (1) [Reference Lacasa, F.Ballesteros, Luque and Nuno25].
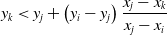 \begin{equation}y_{k}\lt y_{j}+\left(y_{i}-y_{j}\right)\frac{x_{j}-x_{k}}{x_{j}-x_{i}}\end{equation}
Given point $p$
, obstacles
$p$
, obstacles $W_{obs}$
, and
$W_{obs}$
, and
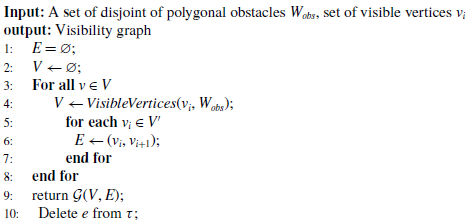
 $v_{i}$
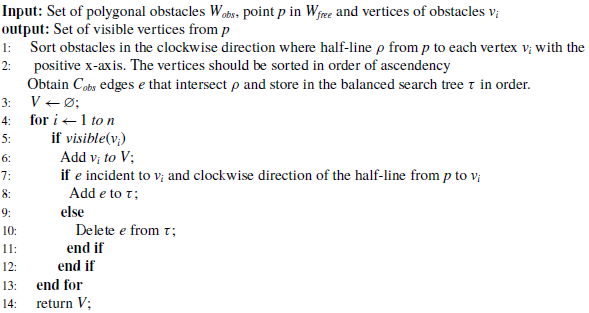
as the vertices of all the polygonal obstacles in the workspace of the robot, we can obtain the visible vertices for the graph using Algorithm 2 provided in [Reference Mark, Otfried, Marc and Mark26]. Algorithm 3 outlines the algorithm to build the VG RM after identifying the visible vertices using Algorithm 2.
$v_{i}$
as the vertices of all the polygonal obstacles in the workspace of the robot, we can obtain the visible vertices for the graph using Algorithm 2 provided in [Reference Mark, Otfried, Marc and Mark26]. Algorithm 3 outlines the algorithm to build the VG RM after identifying the visible vertices using Algorithm 2.
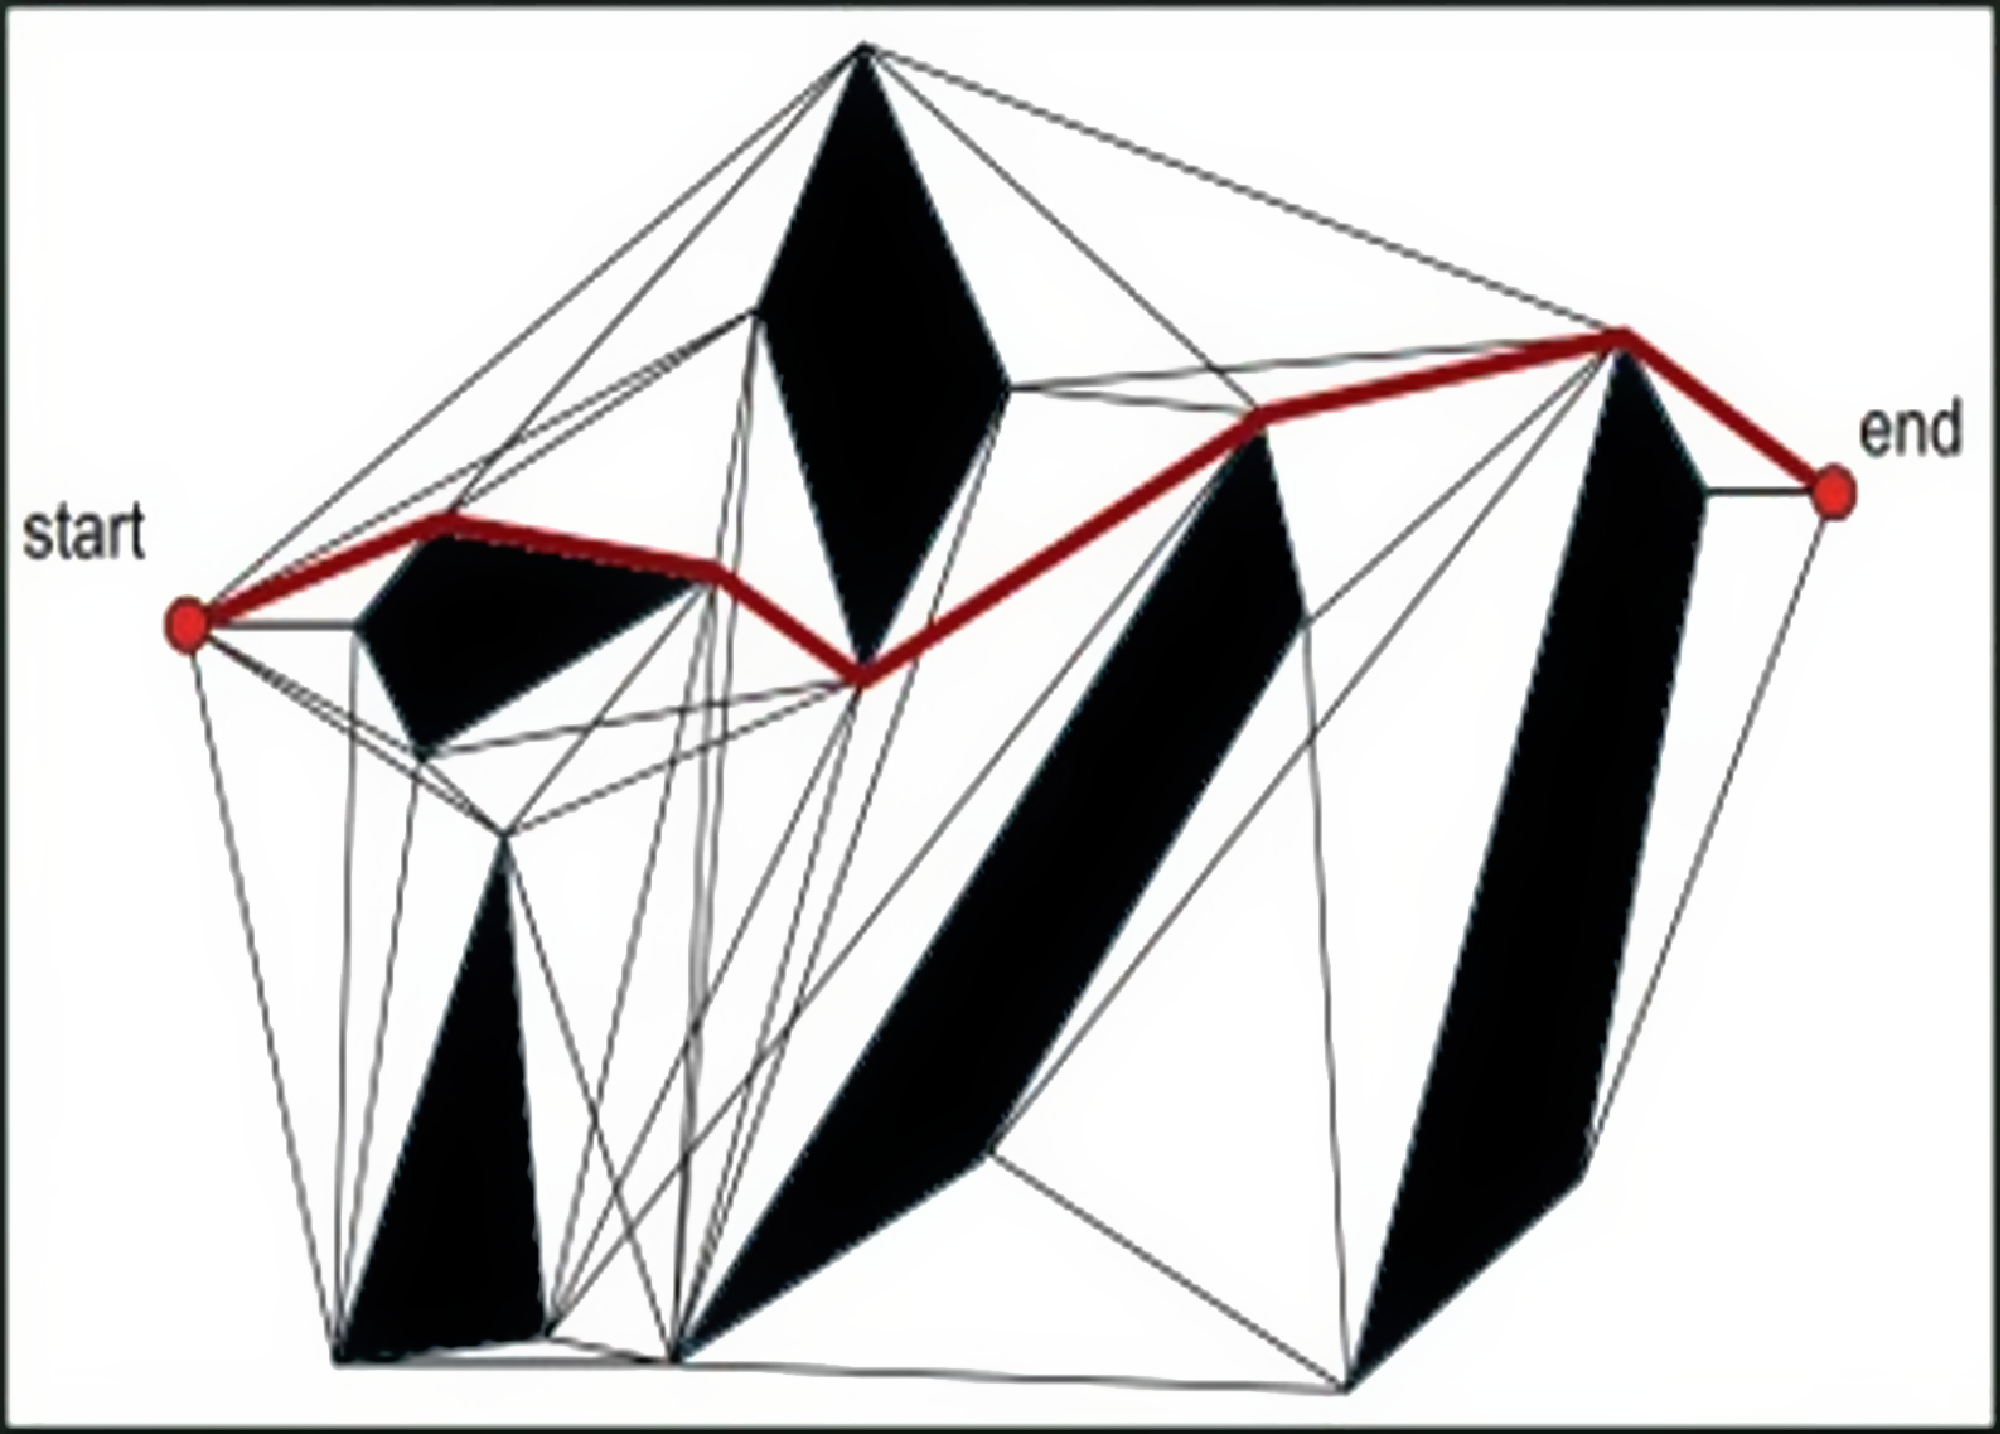
After the RM is generated, the path planner tries to obtain a path from the initial position to the goal position on the RM. A sample VG with a path from the initial position to the goal is presented in Fig. 2.
Visibility graph with the path from the start to the goal points.
VG has been used in path-planning research over the years to address various path-planning problems. Li et al. [Reference Lee, Choi and Kim23] present a VG-based path-planning algorithm with quadtree representation that efficiently reduces search space and computation time but faces challenges in maintaining accuracy in complex environments due to the quadtree’s simplified representation. In ref. [Reference Wu, Atilla, Tahsin, Terziev and Wang27], the authors propose a long-voyage route planning method for autonomous ships using a multiscale VG that successfully balances computational efficiency and route safety over long distances but faces challenges in handling dynamic environmental changes and integrating real-time data. The study by Blasi et al. [Reference Blasi, D’Amato, Mattei and Notaro28] introduces a path-planning approach with real-time collision avoidance using an essential VG, which effectively navigates dynamic environments but faces challenges in keeping the graph updated and accurate in highly dynamic settings. Also, in ref. [Reference Kaluđer, Brezak and Petrović29], the authors proposed a VG-based path-planning method that effectively navigates dynamic environments with moving obstacles, but it faces significant challenges in managing computational overhead during real-time scenarios with frequent and unpredictable changes.
Determining Visible vertices for the visibility graph
Visibility graph roadmap
The VG method requires the environment and the vertices of the obstacles to be well-defined. To mimic the real environment for robot navigation, the environment and obstacles used in this study are not well-defined. Hence, the VG was not included in the comparative analysis.
3.2 Voronoi diagram path-planning method
Another popular GBRM path-planning method considered by most researchers is the VD. VD was named after Georgy Fedosievyeh Voronoy, a Russian mathematician who is believed to have first defined VD. VD is also called Voronoi tessellation, Voronoi partition, Voronoi decomposition, Dirichlet tessellation or Thiessen polygons [Reference Moulinec30]. The VD method is applicable in many fields of study especially in science and technology [Reference Pehlivanoglu31, Reference Bełej and Figurska32]. It has also been considered in path-planning research over the years [Reference Ayawli, Appiah, Nti, Kyeremeh and Ayawli5, Reference Candeloro, Lekkas and Sørensen24, Reference Sun, Ishida, Makino, Shibayama and Terada33].
In robot path planning, VD partitions the workspace of the robot into several regions whose edges form a RM. Each Voronoi region is closer to its generating node than to any other generating node. Any node in each region is closer to the generating obstacles than to any other obstacle [Reference Klančer, Zdešar, Blažič and Skrjanc22]. The nearest neighbor rule is used to obtain edges equidistant from the nodes. Considering a configuration space, S with S={s
1
,s
2
,s
3
,…,s
i
} nodes, d as the distances function, and N indicating a set of nodes in S, the Voronoi region is made up of a set of nodes N
i
in S with distances less or equal to the distances to other nodes Nj
where $N_{i}\neq N_{j}$
. The VD can, therefore, be computed using Eq. (2).
$N_{i}\neq N_{j}$
. The VD can, therefore, be computed using Eq. (2).
 \begin{equation}V_{d}=\{s \epsilon S|d \left(x,N_{i}\right)\leq d\left(x,N_{j}\right)\forall _{i\neq j}\}\end{equation}
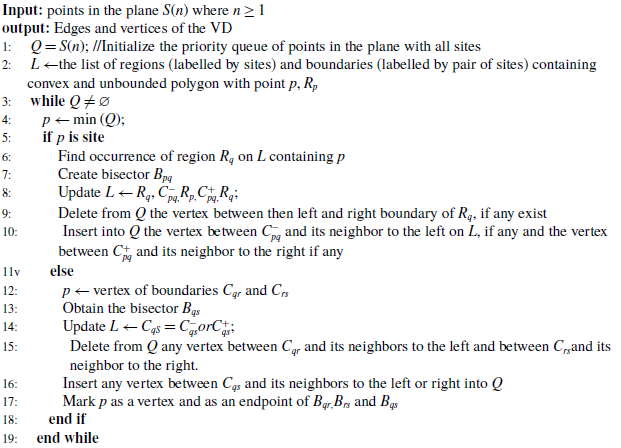
The VD could be computed using Fortune’s VD algorithm given in Algorithm 4 [Reference Ayawli, Appiah, Nti, Kyeremeh and Ayawli5]. In the algorithm, $L$
represents a sequence of regions and boundaries, and
$L$
represents a sequence of regions and boundaries, and $Q$
is a priority queue of nodes in the plane. Every node is labeled as a site or as the vertex of a pair of boundaries of given regions. It should be noted that elements of
$Q$
is a priority queue of nodes in the plane. Every node is labeled as a site or as the vertex of a pair of boundaries of given regions. It should be noted that elements of $Q$
may not be unique. Details of the algorithm are given in ref. [Reference Ayawli, Appiah, Nti, Kyeremeh and Ayawli5].
$Q$
may not be unique. Details of the algorithm are given in ref. [Reference Ayawli, Appiah, Nti, Kyeremeh and Ayawli5].
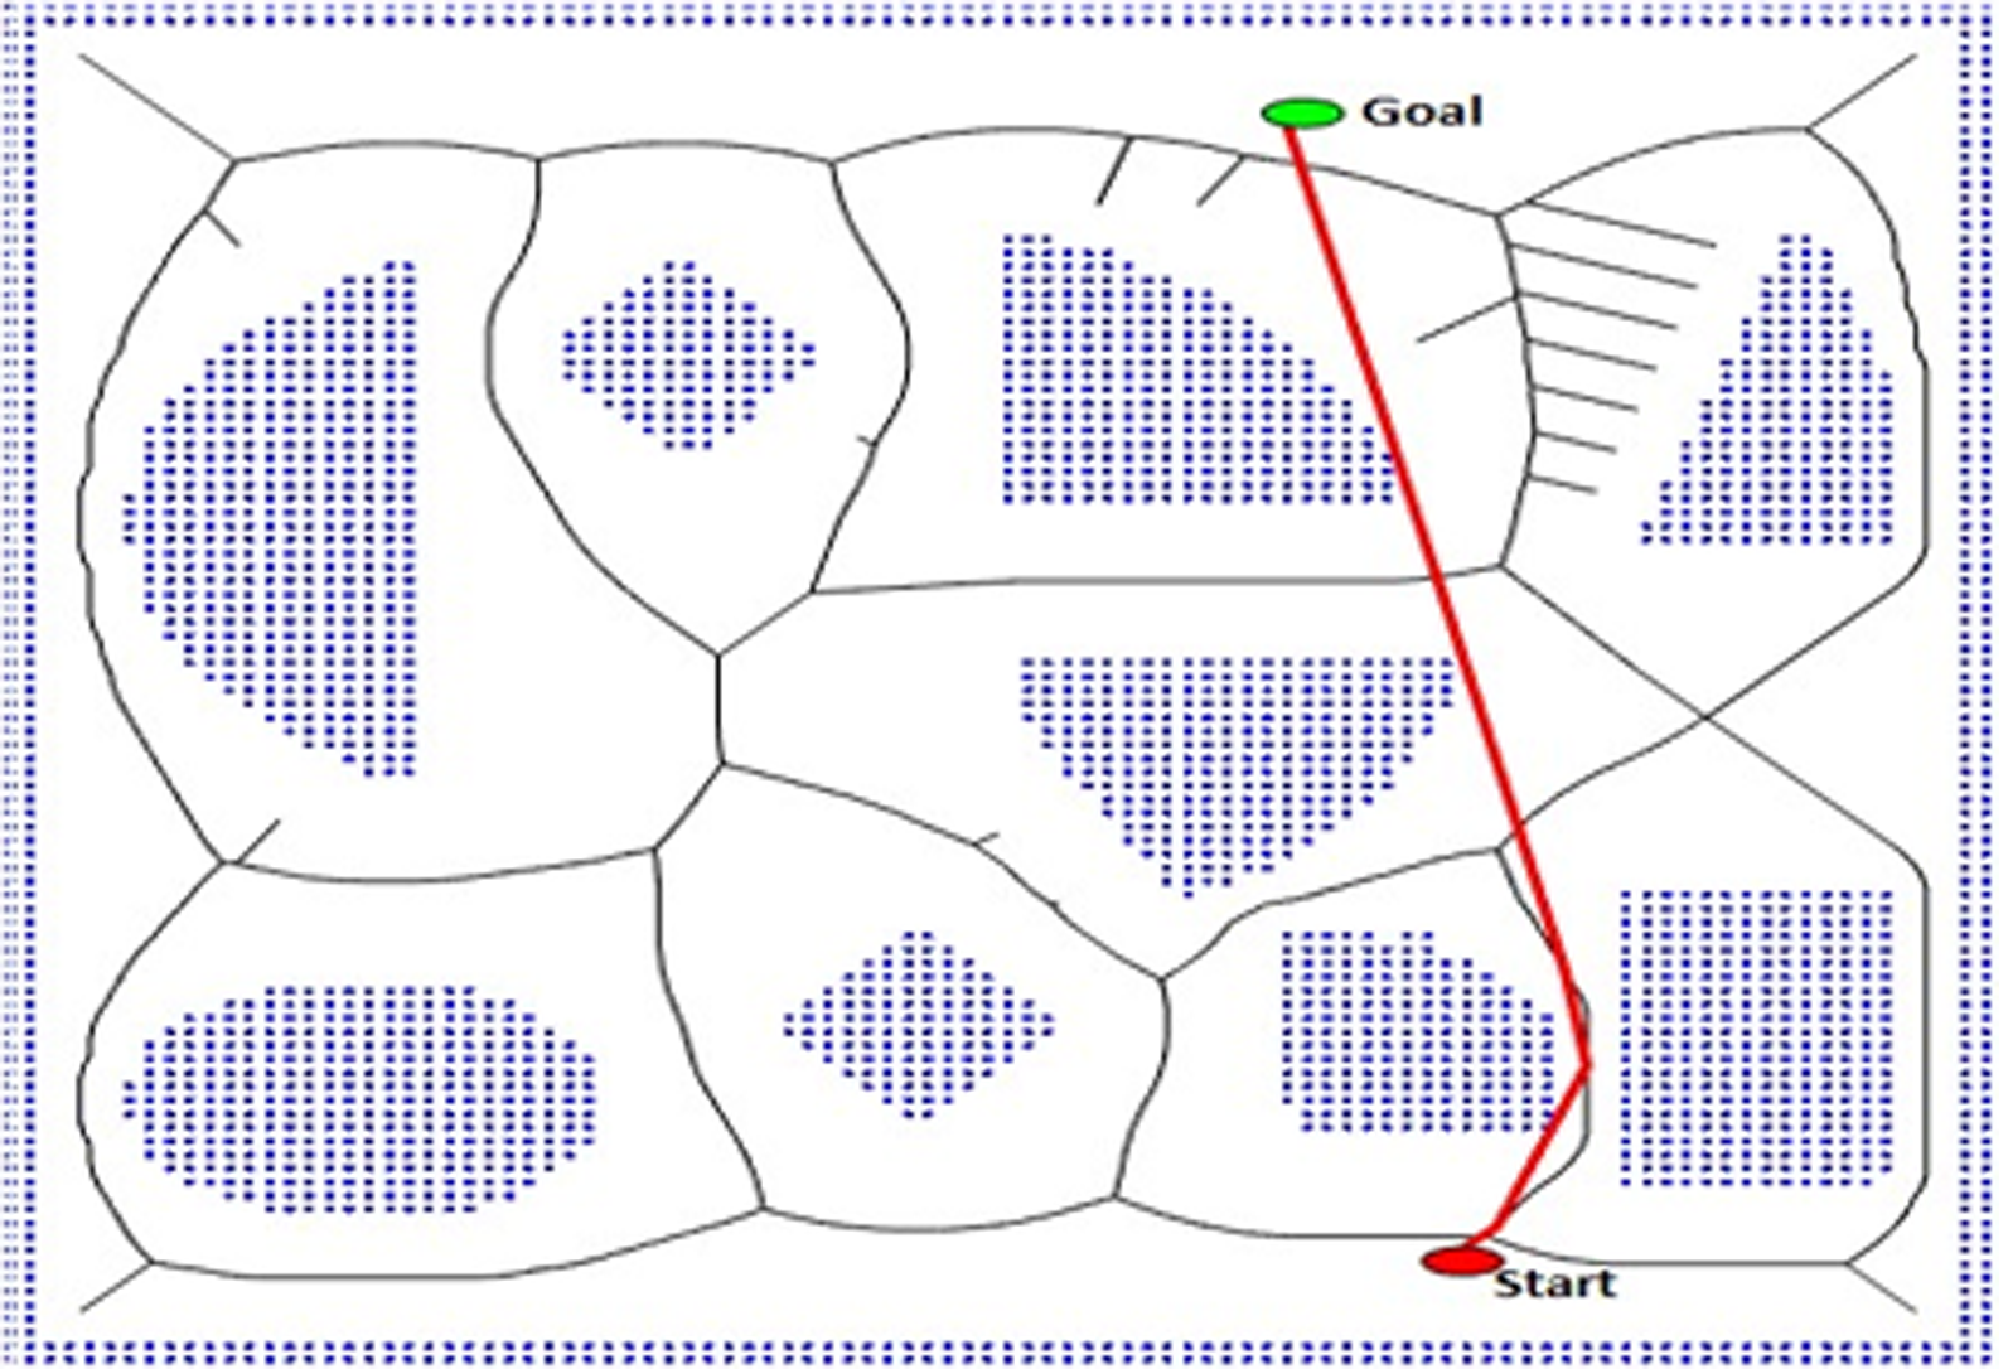
After the VD RM is generated, a search algorithm is used to compute a path from the initial position to the goal. Figure 3 demonstrates a generated VD RM and a path connecting the start position to the goal using the A* search algorithm.
Voronoi diagram roadmap
Voronoi diagram roadmap with path from start to the goal using A* algorithm.
Recently, VD has been combined with other techniques to propose path-planning methods. In ref. [Reference Ayawli, Appiah, Nti, Kyeremeh and Ayawli5], the authors propose a VD combined with computational geometry for mobile robot path planning in dynamic environments, achieving real-time adaptability, though the method struggles with computational complexity in rapidly changing scenarios. Ayawli et al. [Reference Ayawli, Appiah, Nti, Kyeremeh and Ayawli5] introduced a morphological dilation VD RM algorithm for mobile robot path planning, aiming to enhance obstacle avoidance and efficiency, with results showing improved path smoothness but challenges in handling highly cluttered environments. Also, in ref. [Reference Tuncer34], the author combines the VD with ant colony optimization for autonomous mobile robot path planning, resulting in efficient and adaptive paths, but faces challenges with convergence speed in complex environments. Kim et al. [Reference Kim, Kang and Ryoo35] presented a real-time path-planning method for unmanned aerial vehicles (UAVs) using a compensated VD to improve navigation accuracy, achieving reliable obstacle avoidance but encountering difficulties in highly dynamic airspaces. Moreover, Xu in ref. [Reference Xu36] proposed a Voronoi graph-based path inference method for unmanned maritime vehicles, focusing on efficient navigation in maritime environments, with positive results in route optimization but challenges in handling unpredictable maritime conditions. Additionally, Su et al., [Reference Su, Gao, Gao and Xuan37] enhanced multi-UAV path planning using Voronoi-based obstacle modeling and Q-learning, achieving improved navigation in complex environments, though the method is challenged by the need for extensive computational resources for real-time applications.
4. Sampling-based RM path-planning methods
In generating a RM using SB methods, random points are generated and sampled after which collision detections are done to ensure that sample points are in the $W_{free }$
[Reference Li and Chen38, Reference Lavalle and Kuffner39]. Connected edges among these points form the RM. Search algorithms are then applied to connect the initial and goal positions to obtain the nodes for the path. SB methods have been employed successfully for robot path planning [Reference Schmid, Pantic, Khanna, Ott, Siegwart and Nieto40]. The well-known SB path-planning methods are PRM [Reference Xu, Deng and Shimada41] and RRT [Reference Otte and Frazzoli42]. These methods are described as possessing the ability to address trajectory-shaping problems of traditional path-planning methods in complex environments [Reference Pharpatara, Hérissé, Pepy and Bestaoui43] with SB methods. There is no need to consider approximations even in complex systems [Reference Pepy, Lambert and Mounier44]. PRM and RRT methods are discussed in the next sections.
$W_{free }$
[Reference Li and Chen38, Reference Lavalle and Kuffner39]. Connected edges among these points form the RM. Search algorithms are then applied to connect the initial and goal positions to obtain the nodes for the path. SB methods have been employed successfully for robot path planning [Reference Schmid, Pantic, Khanna, Ott, Siegwart and Nieto40]. The well-known SB path-planning methods are PRM [Reference Xu, Deng and Shimada41] and RRT [Reference Otte and Frazzoli42]. These methods are described as possessing the ability to address trajectory-shaping problems of traditional path-planning methods in complex environments [Reference Pharpatara, Hérissé, Pepy and Bestaoui43] with SB methods. There is no need to consider approximations even in complex systems [Reference Pepy, Lambert and Mounier44]. PRM and RRT methods are discussed in the next sections.
4.1. Probabilistic RM path planning
PRM generates a RM of the environment by randomly sampling the space and connecting the samples to form a graph. PRM path is computed by generating random points in $W_{free }$
of the workspace of the robot and a collision-free path is computed to link the start and the goal positions [Reference Klančer, Zdešar, Blažič and Skrjanc22, Reference Zheng, Cao, Zhang, Zhang, Chen, Dai and Zhao45, Reference Novosad, Penicka and Vonasek46]. Path computation using PRM is made up of two stages: learning and query stages [Reference Xu, Deng and Shimada41].
$W_{free }$
of the workspace of the robot and a collision-free path is computed to link the start and the goal positions [Reference Klančer, Zdešar, Blažič and Skrjanc22, Reference Zheng, Cao, Zhang, Zhang, Chen, Dai and Zhao45, Reference Novosad, Penicka and Vonasek46]. Path computation using PRM is made up of two stages: learning and query stages [Reference Xu, Deng and Shimada41].
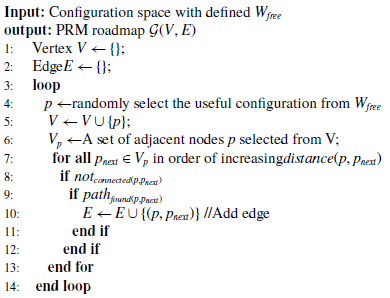
At the learning stage, the RM in the form of an undirected graph $\mathcal{G}(V,E)$
is constructed with
$\mathcal{G}(V,E)$
is constructed with $V$
representing the generated random nodes and
$V$
representing the generated random nodes and $E$
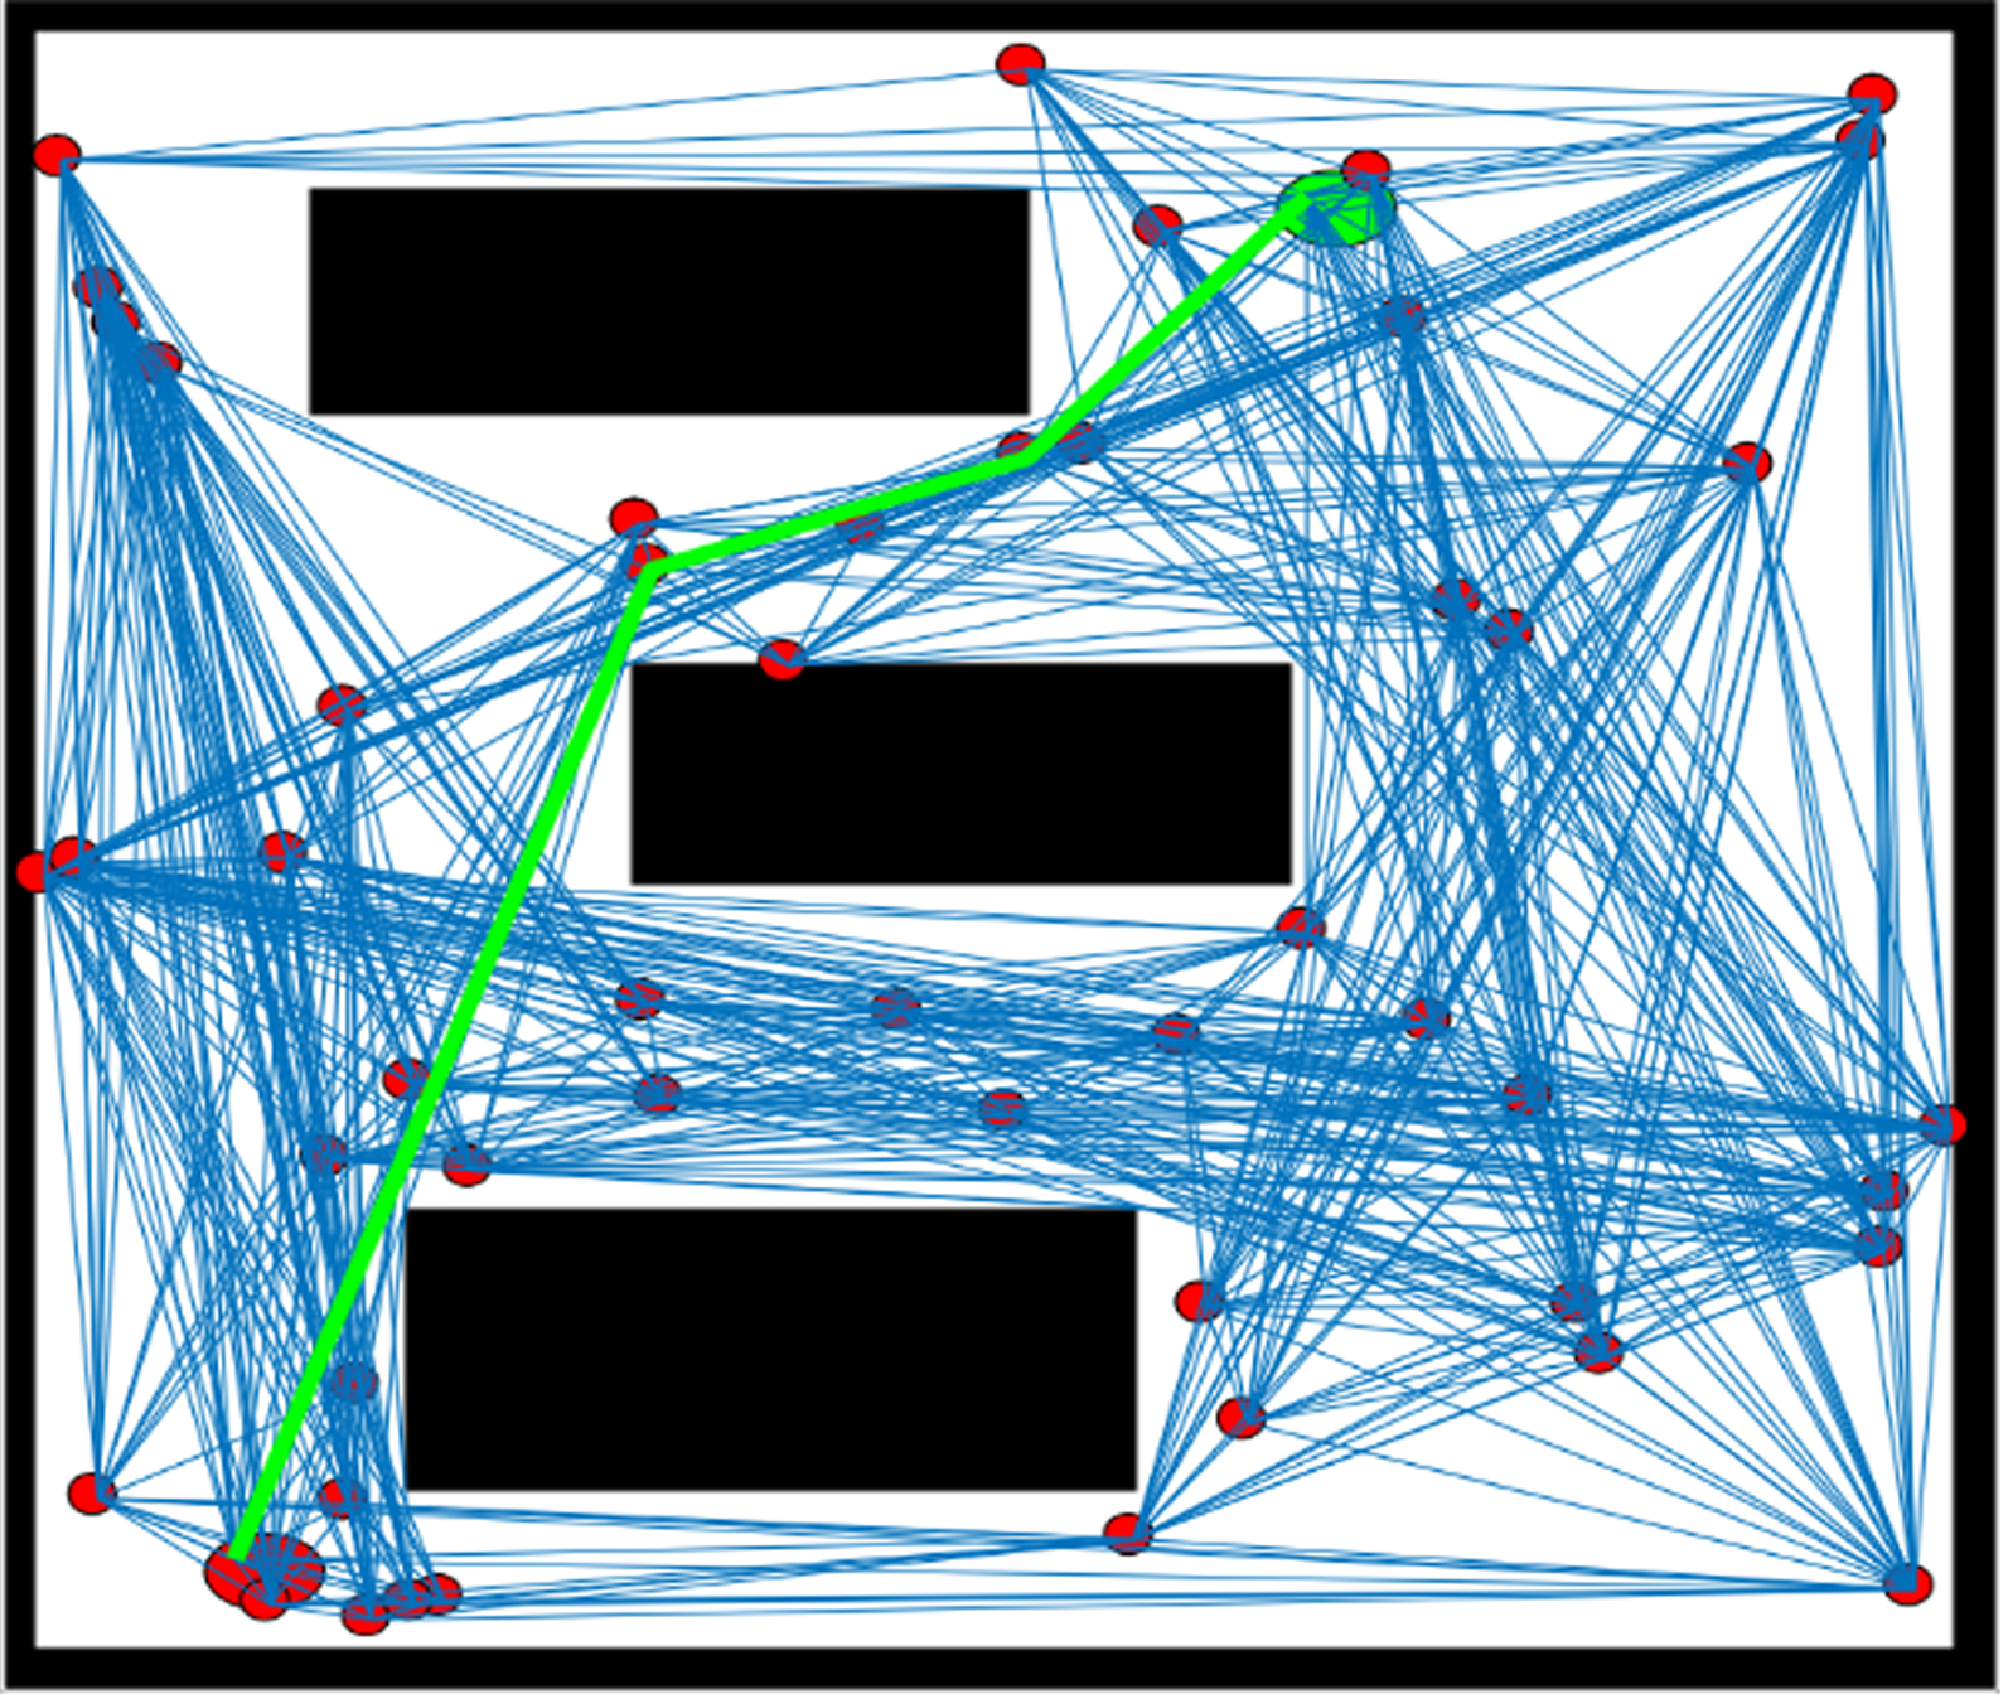
representing the edges of the connected nodes. Algorithm 5 outlines how the RM using the PRM method is computed [Reference Velagic, Delimustafic and Osmankovic47]. Figure 4 demonstrates a sample RM and path generated from point S to G using the PRM method.
$E$
representing the edges of the connected nodes. Algorithm 5 outlines how the RM using the PRM method is computed [Reference Velagic, Delimustafic and Osmankovic47]. Figure 4 demonstrates a sample RM and path generated from point S to G using the PRM method.
At the query stage, a path is computed to connect the initial position of the robot and the goal positions based on the computed RM at the learning stage. Search algorithms including Dijkstrar’s and A* algorithms are mostly used to obtain the shortest path on the RMs. Algorithm 6 outlines how to construct a path based on PRM using A* heuristic algorithm [Reference Velagic, Delimustafic and Osmankovic47].
PRM roadmap learning stage algorithm
Road map and path from point S to G using PRM method.
PRM is based on the assertion that a few numbers of points and a RM are enough to provide complete connectivity in the $W_{free}$
by reducing the time of the path-planning process [Reference Velagic, Delimustafic and Osmankovic47]. This makes the PRM method simple to implement and supports fast path queries. PRM is also probabilistically complete such that once there is a path on the RM, it can be computed. There are variants of PRM methods proposed over the years to improve its performance. Some of these variants include obstacle-based PRM [Reference Alarabi, Luo and Santora48], Bridge Test PRM [Reference Hsu, Jiang, Reif and Sun49], Gaussian PRM [Reference Lin50], medial axis PRM [Reference Arias, Ichter, Faust and Amato51], Lazy toggle PRM [Reference Denny, Shi and Amato52], T-PRM, [Reference Hüppi, Bartolomei, Mascaro and Chli53] Dancing PRM [Reference Kim, Kwon and Yoon54], and LD-PRM [Reference Khaksar, Hong, Khaksar and Motlagh55].
$W_{free}$
by reducing the time of the path-planning process [Reference Velagic, Delimustafic and Osmankovic47]. This makes the PRM method simple to implement and supports fast path queries. PRM is also probabilistically complete such that once there is a path on the RM, it can be computed. There are variants of PRM methods proposed over the years to improve its performance. Some of these variants include obstacle-based PRM [Reference Alarabi, Luo and Santora48], Bridge Test PRM [Reference Hsu, Jiang, Reif and Sun49], Gaussian PRM [Reference Lin50], medial axis PRM [Reference Arias, Ichter, Faust and Amato51], Lazy toggle PRM [Reference Denny, Shi and Amato52], T-PRM, [Reference Hüppi, Bartolomei, Mascaro and Chli53] Dancing PRM [Reference Kim, Kwon and Yoon54], and LD-PRM [Reference Khaksar, Hong, Khaksar and Motlagh55].
Recently, path-planning research using PRM combined with other techniques is becoming popular. For instance, Singh [Reference Singh56] modified PRM using a decision-making strategy for optimizing unmanned vehicle trajectories in unstructured environments, achieving time-efficient navigation but facing challenges related to unpredictable environmental complexity and dynamic obstacles. In ref. [Reference Fan, Zhang, Zheng, Zou and Zhou57], Fan et al. presented a hierarchical path planner that combines PRMs with deep deterministic policy gradients to navigate unmanned ground vehicles with nonholonomic constraints, leading to enhanced navigation accuracy but encountering difficulties in real-time adaptability. Also, in ref. [Reference Zheng, Ridderhof, Zhang, Tsiotras and Agha-Mohammadi58], the authors integrated belief space planning with PRMs to ensure reachability and consistency, offering a robust planning framework but confronting the challenge of computational cost in high-dimensional belief spaces. In ref. [Reference Huang, Wang, Han and Xu59], an improved PRM method for robot path planning in narrow passages was presented, yielding more efficient pathfinding but facing obstacles in balancing computational efficiency and optimality in highly constrained environments.
4.2. Rapidly exploring random trees path-planning method
RRT path-planning method is noted to be suitable for path planning in high-dimensional configuration space, and it involves a random building of a tree from a given point termed as the root [Reference Li and Chen38, Reference Devaurs, Siméon and Cortés60]. The tree grows with random samples from the root toward the unsearched $W_{free}$
, until the target or the given maximum iteration limit is reached [Reference Mohanan and Salgoankar61]. Two main stages are followed alternatively to grow the tree. These include selection and propagation stages. During the selection stage, a sample,
$W_{free}$
, until the target or the given maximum iteration limit is reached [Reference Mohanan and Salgoankar61]. Two main stages are followed alternatively to grow the tree. These include selection and propagation stages. During the selection stage, a sample, $u_{rand}$
is generated at random and the nearest sample,
$u_{rand}$
is generated at random and the nearest sample, $u_{near}$
to
$u_{near}$
to $u_{rand}$
is selected. The next stage is the propagation stage where an edge is extended from the
$u_{rand}$
is selected. The next stage is the propagation stage where an edge is extended from the $u_{near}$
toward the
$u_{near}$
toward the $u_{rand}$
. The ending point of the edge which is determined by the distance threshold to the
$u_{rand}$
. The ending point of the edge which is determined by the distance threshold to the $u_{near}$
is added to the tree. The two stages are performed alternatively until the goal or the maximum iteration limit is reached [Reference Li and Chen38, Reference Branicky, Curtiss, Levine and Morgan62]. Algorithm 8 shows how to generate the RRT RM as given in ref. [Reference Yershova, Jaillet, Siméon and LaValle63]. The growth of the tree could be computed to grow from two points towards each other to connect a branch of one to the other. The growth process ends when there is a connection between branches from each point. This type of RRT is termed as bidirectional RRT.
$u_{near}$
is added to the tree. The two stages are performed alternatively until the goal or the maximum iteration limit is reached [Reference Li and Chen38, Reference Branicky, Curtiss, Levine and Morgan62]. Algorithm 8 shows how to generate the RRT RM as given in ref. [Reference Yershova, Jaillet, Siméon and LaValle63]. The growth of the tree could be computed to grow from two points towards each other to connect a branch of one to the other. The growth process ends when there is a connection between branches from each point. This type of RRT is termed as bidirectional RRT.
PRM path computation at the query stage
RRT roadmap algorithm
Just like other RM methods, the generation of the tree forming the RM as indicated in Algorithm 7 is done at the learning stage. Other algorithms are applied at the query stage to obtain the path from the initial position to the goal position. Figure 5 is a sample RM and path computed using the RRT method.
Road map and path from point S to G using RRT.

The RRT method is simple to implement. It is also probabilistic complete. However, it is believed to produce suboptimal solutions with poor path quality [Reference Devaurs, Siméon and Cortés60].
RRT method is believed to be a fast path-planning method that performs efficiently in complex and high-dimensional workspace [Reference Heβ, Lindeholz, Eck and Schilling64, Reference Yang, Wei-guo, Jing-ping and Guang-wen65].
To improve the RRT method, variants of these methods were proposed. Some of these include RRT* [Reference Li, Liu, Zhang and Zhao66], RRTx, TG-RRT* [Reference Qureshi, Mumtaz, Iqbal, Ayaz, Muhammad, Hasan and Ra67], RRT-A* [Reference Li, Liu, Zhang and Zhao68], parallel RRT*, RRT-Edge, Liveness-based RRT, Theta*-RRT, human-guided RRT*, ORRT-A* [Reference Ayawli, Mei, Shen, Appiah and Kyeremeh11], ELMs-improved RRT (ELM-IRRT) [Reference Meng, Li, Zhang and Sun15], continuum-RRT* [Reference Gao, Li, Liu, Ge and Song69], and continuous bidirectional Quick-RRT* [Reference Ye, Li and Li70] planning methods. Each of these variants tried to address a particular path-planning problem using RRT with other techniques.
Path-planning research involving the RRT algorithm is gaining attention. Yu in ref. [Reference Yu, Chen, Arab, Yi, Pei and Guo71] introduced the RDT-RRT algorithm that combines real-time double-tree and rapidly exploring random tree (RRT) methods for autonomous vehicle path planning. The proposed algorithm improved computational speed and efficiency, but faces challenges with complex dynamic environments. The Improved Rapidly Exploring Random Trees Star (RRT*) algorithm was presented by Wang and Zheng [Reference Wang and Zheng72]. It enhanced robot path planning by increasing exploration speed and solution quality, though it struggles with high dimensionality. Also, in ref. [Reference Ganesan, Ramalingam and Elara73], a hybrid RRT* algorithm was proposed by Ganesan et al for mobile navigation. The method was good at merging SB methods with optimization for smoother path planning, but it is limited by environmental complexity. Moreover, the RRT-A* hybrid algorithm presented by Ayawli et al. [Reference Ayawli, Mei, Shen, Appiah and Kyeremeh11] optimizes path planning in partially known environments for mobile robots, achieving reduced computational time but facing obstacles in highly dynamic settings.
In summary, RM path-planning methods, including PRM, RRT, and VG, offer unique advantages and challenges in navigating complex environments. Details of the advantages and challenges of each of these methods are essential for making the appropriate integration of other modern methods. The next section will describe the methodology employed to evaluate these methods, focusing on their performance in various scenarios.
A star algorithm
5. Methodology
This section describes the methodology used for the comparative analysis of PRM, RRT, and VD path-planning methods.
A comparative research methodology was adopted in this research to determine the performance of popular RM path-planning methods (VD, RRT, and PRM) in terms of path optimality, computation time, path safety, and the stability of path computation. Therefore, the metrics considered for the comparison include computed path length, path computation time, safety of the computed path, and the consistency of path computation for each of the methods under consideration. An optimal path is achieved if a shorter path is computed to enable a robot to reach its goal as fast as possible. The time required to compute a path is very important and it is expected that a chosen path-planning method computes a path in the shortest time to enable the robot to make the necessary decisions during navigation to avoid colliding with obstacles or missing its goal. The safety of the computed path is also very important, hence its consideration as a metric in the analysis. The safety of the computed path in this research is determined by the distance between the computed path and obstacles. This is required to ensure that the systemic and nonsystemic conditions of the robot during navigation do not negatively affect the safe navigation of the robot. In as much as we require the shortest path and the shortest time, a computed path should make the provision for a robot to navigate freely from its start point to the goal point without colliding with obstacles considered during the global path computation despite the systemic and nonsystemic challenges of the robot. Hence, the higher the average distance between the path and the obstacles, the safer the computed path and vice versa.
Although VG, a geometric-based RM has also been used in the past for global path planning, it has not been included in this comparison because VG requires that the dimensions (vertices) of obstacles positions in the environment are known before path computation [Reference Bełej and Figurska32]. In real situations with multiple and complex environments with obstacles with different shapes, it is difficult to determine the dimensions of obstacle positions in the environment before global path computation. Hence, VG cannot be used in a complex environment with different shapes and a higher occupancy rate of obstacles.
This research considers 100 maps of different complexities with obstacle occupancy rates ranging from 50.95% to 78.42% to evaluate the performance of the RM path-planning methods. The obstacle occupancy rates of the maps were obtained using Eq. (3)
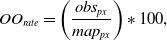 \begin{equation}OO_{rate}=\left(\frac{obs_{px}}{map_{px}}\right)*100,\end{equation}
where OO rate represents obstacle occupancy rate, obs px indicates the map obstacle pixels, and map px = the total pixel of the map represents the environment of the robot. Each of the maps considered was 500X500 pixels in size and was used in previous research work [Reference Ayawli, Appiah, Nti, Kyeremeh and Ayawli5, Reference Ayawli, Mei, Shen, Appiah and Kyeremeh11].
A RM path-planning method usually relies on search algorithms to achieve efficient path computation. In this research, A* algorithm indicated in Algorithm 8 was used for each of the three methods for the path computation.
To ensure fairness in the comparison, each of the three methods was implemented on the same platform and datasets. Simulations were conducted on a machine with an Intel Core(TM) i7-7700HQ CPU @ 2.80 GHz, 8 GB RAM, running Windows 10. The path-planning algorithms were implemented and tested using MATLAB R2018b.
Unlike VD and RRT methods, PRM requires the initialization of nodes to be used for the path computation. It is believed that the higher the number of nodes, the better the path length to be obtained but the computation time increases. To ensure fairness in the comparison, the computed average nodes of VD and RRT were used for computing the path as indicated in Eq. (4).
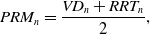 \begin{equation}PRM_{n}=\frac{{VD_{n}}+RRT_{n}}{2},\end{equation}
where PRM n represents the nodes to be used by the PRM method for the path computation. VD n and RRT n represent the nodes used by the VD and the RRT in the path computation, respectively.
The methodology outlined provides a robust framework for evaluating the selected RM path-planning methods. The next section presents the results of the evaluation, highlighting key differences in performance among PRM, RRT, and VG.
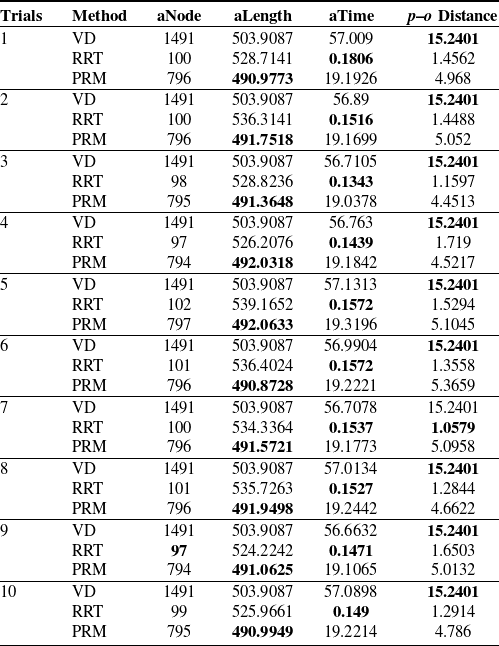
Table I demonstrates the performance of VD, RRT, and PRM in terms of the average nodes (aNode) used for the path computation, average path length (aLength) obtained, average computation time (aTime), and the average path–obstacle (p–o) distance for each trial of the 100 maps used in the simulation.
Results of path computation performance of VD, RRT, and PRM of 10 trials each of 100 different maps.
6. Results analysis
This section presents the results of our comparative analysis, based on the methodology described in Section 6. The findings provide insights into the relative strengths and weaknesses of PRM, RRT, and VG in different environments.
The experiments were performed on 100 maps of varying complexities. To validate the consistency of the results, each simulation was run ten times. The metrics used for the comparison included path length, computation time, and path safety, measured as the path–obstacle (p–o) distance.
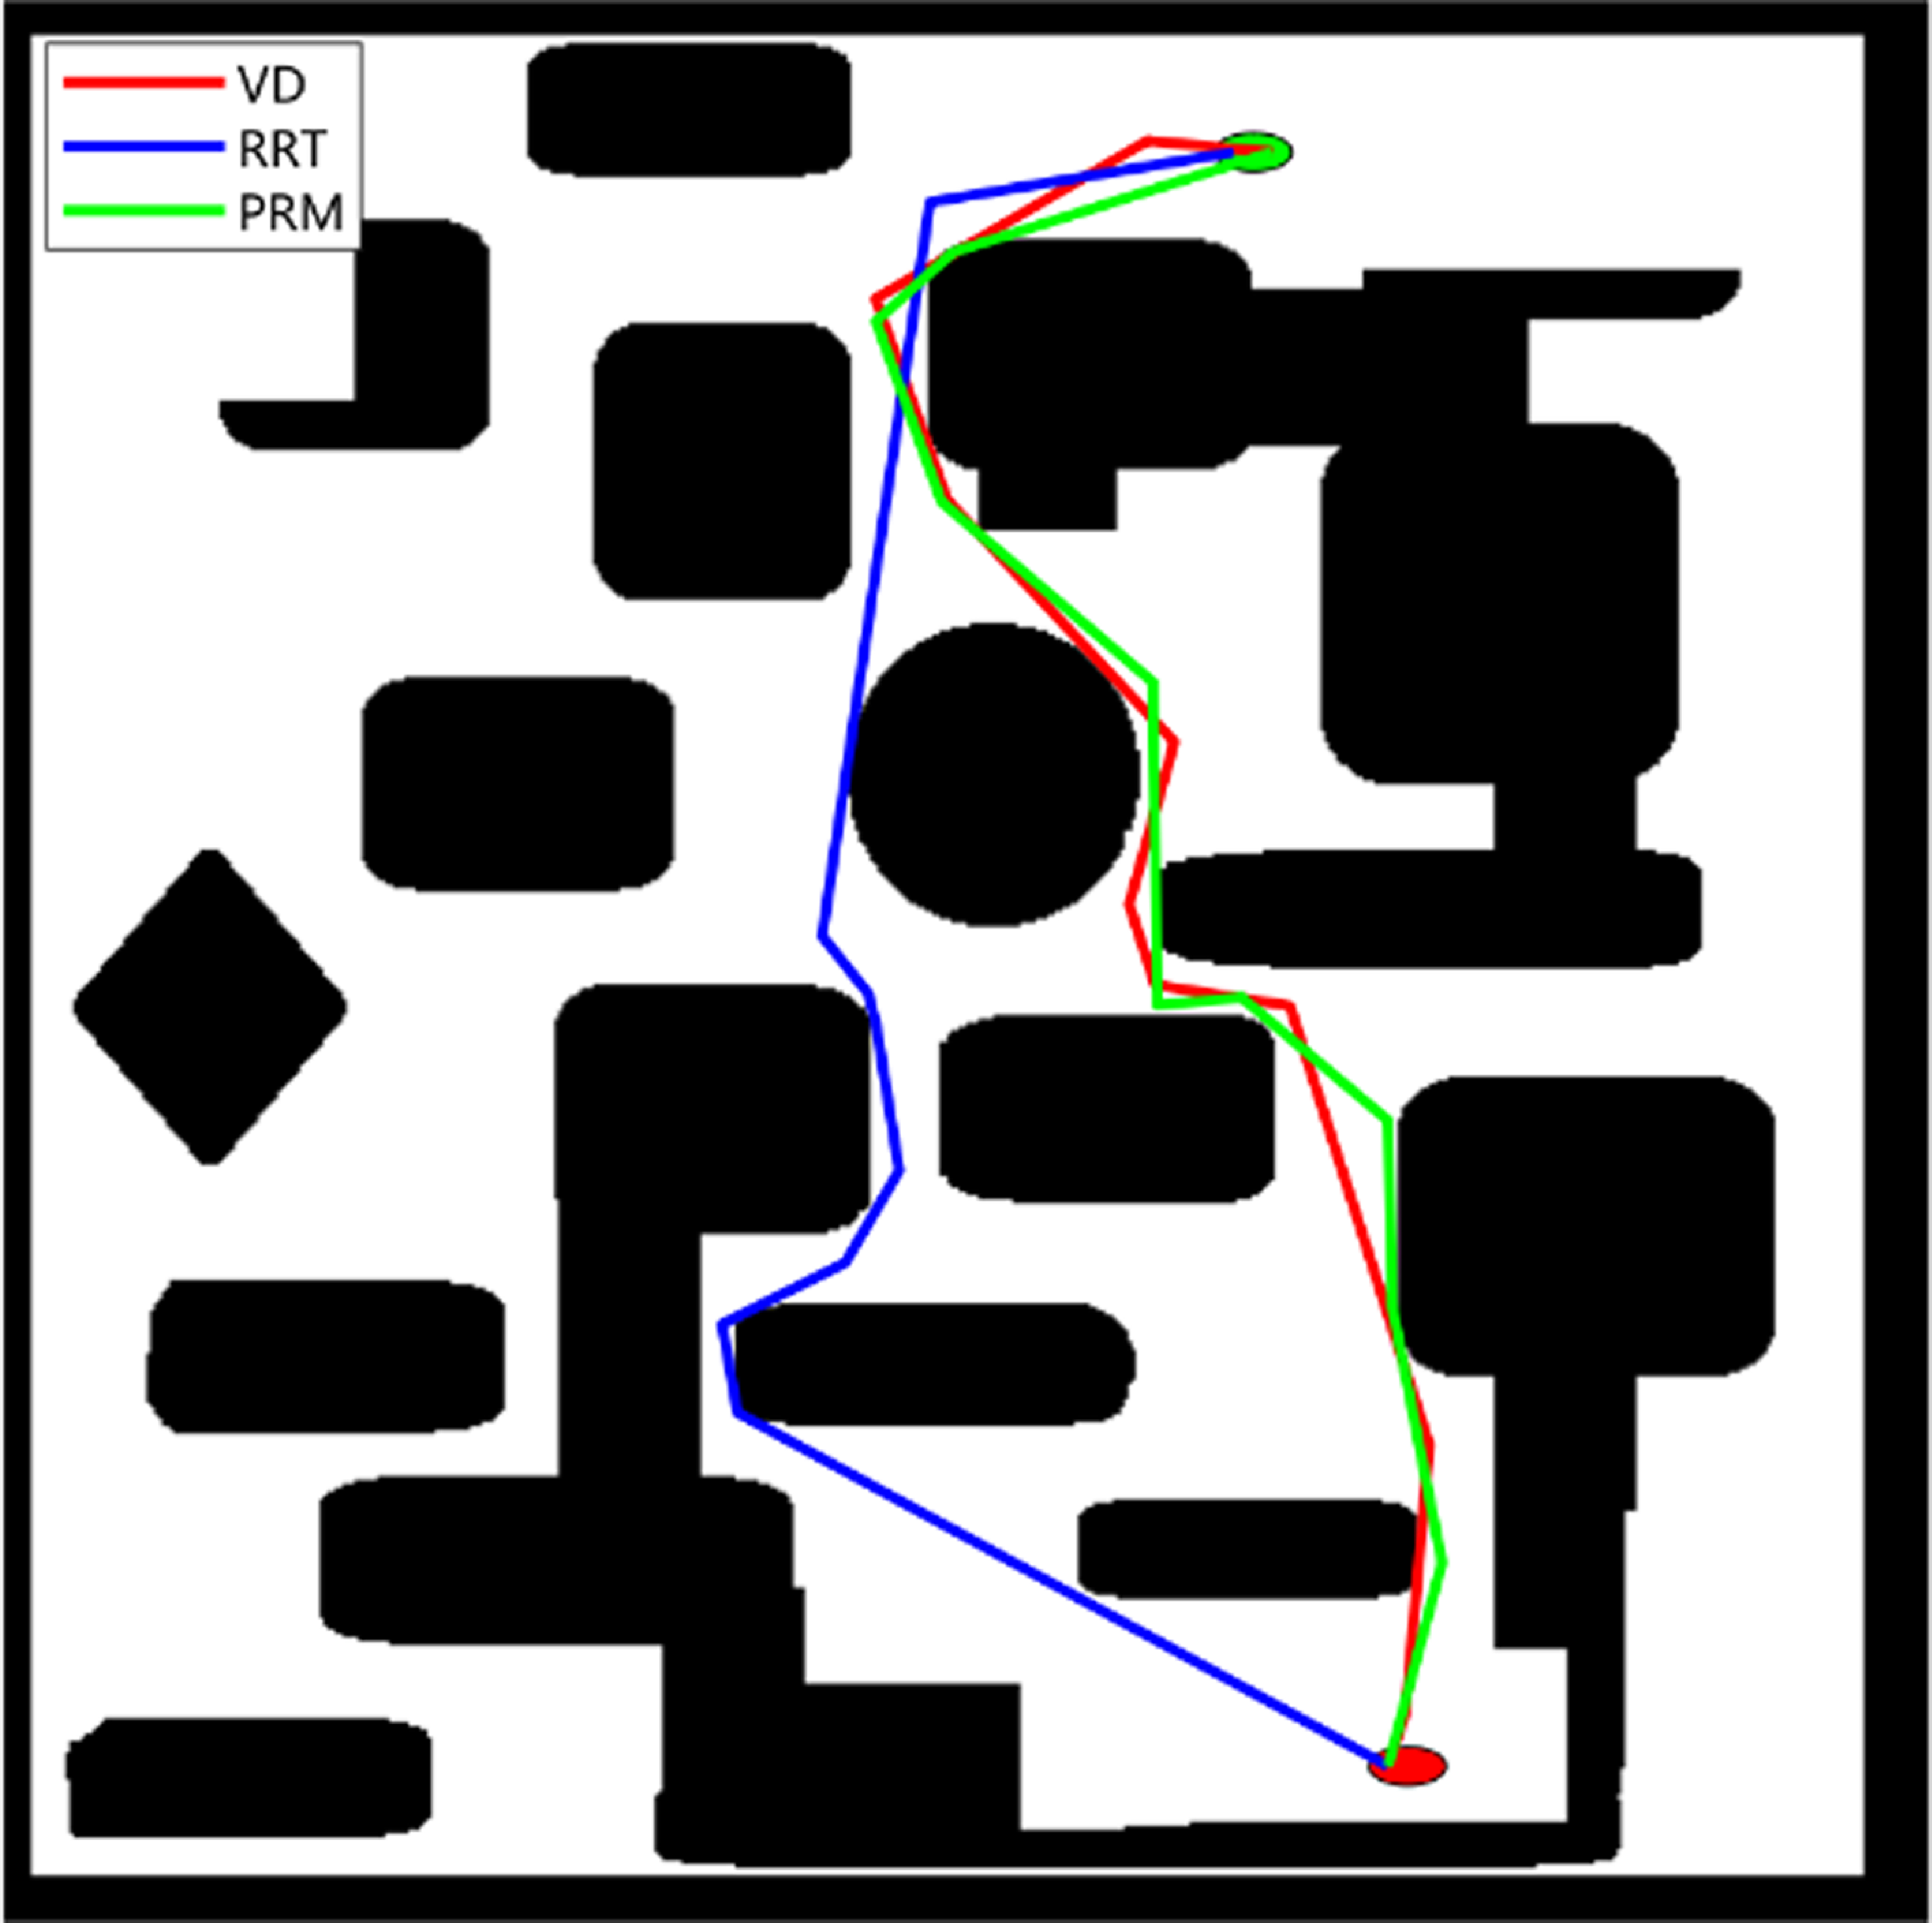
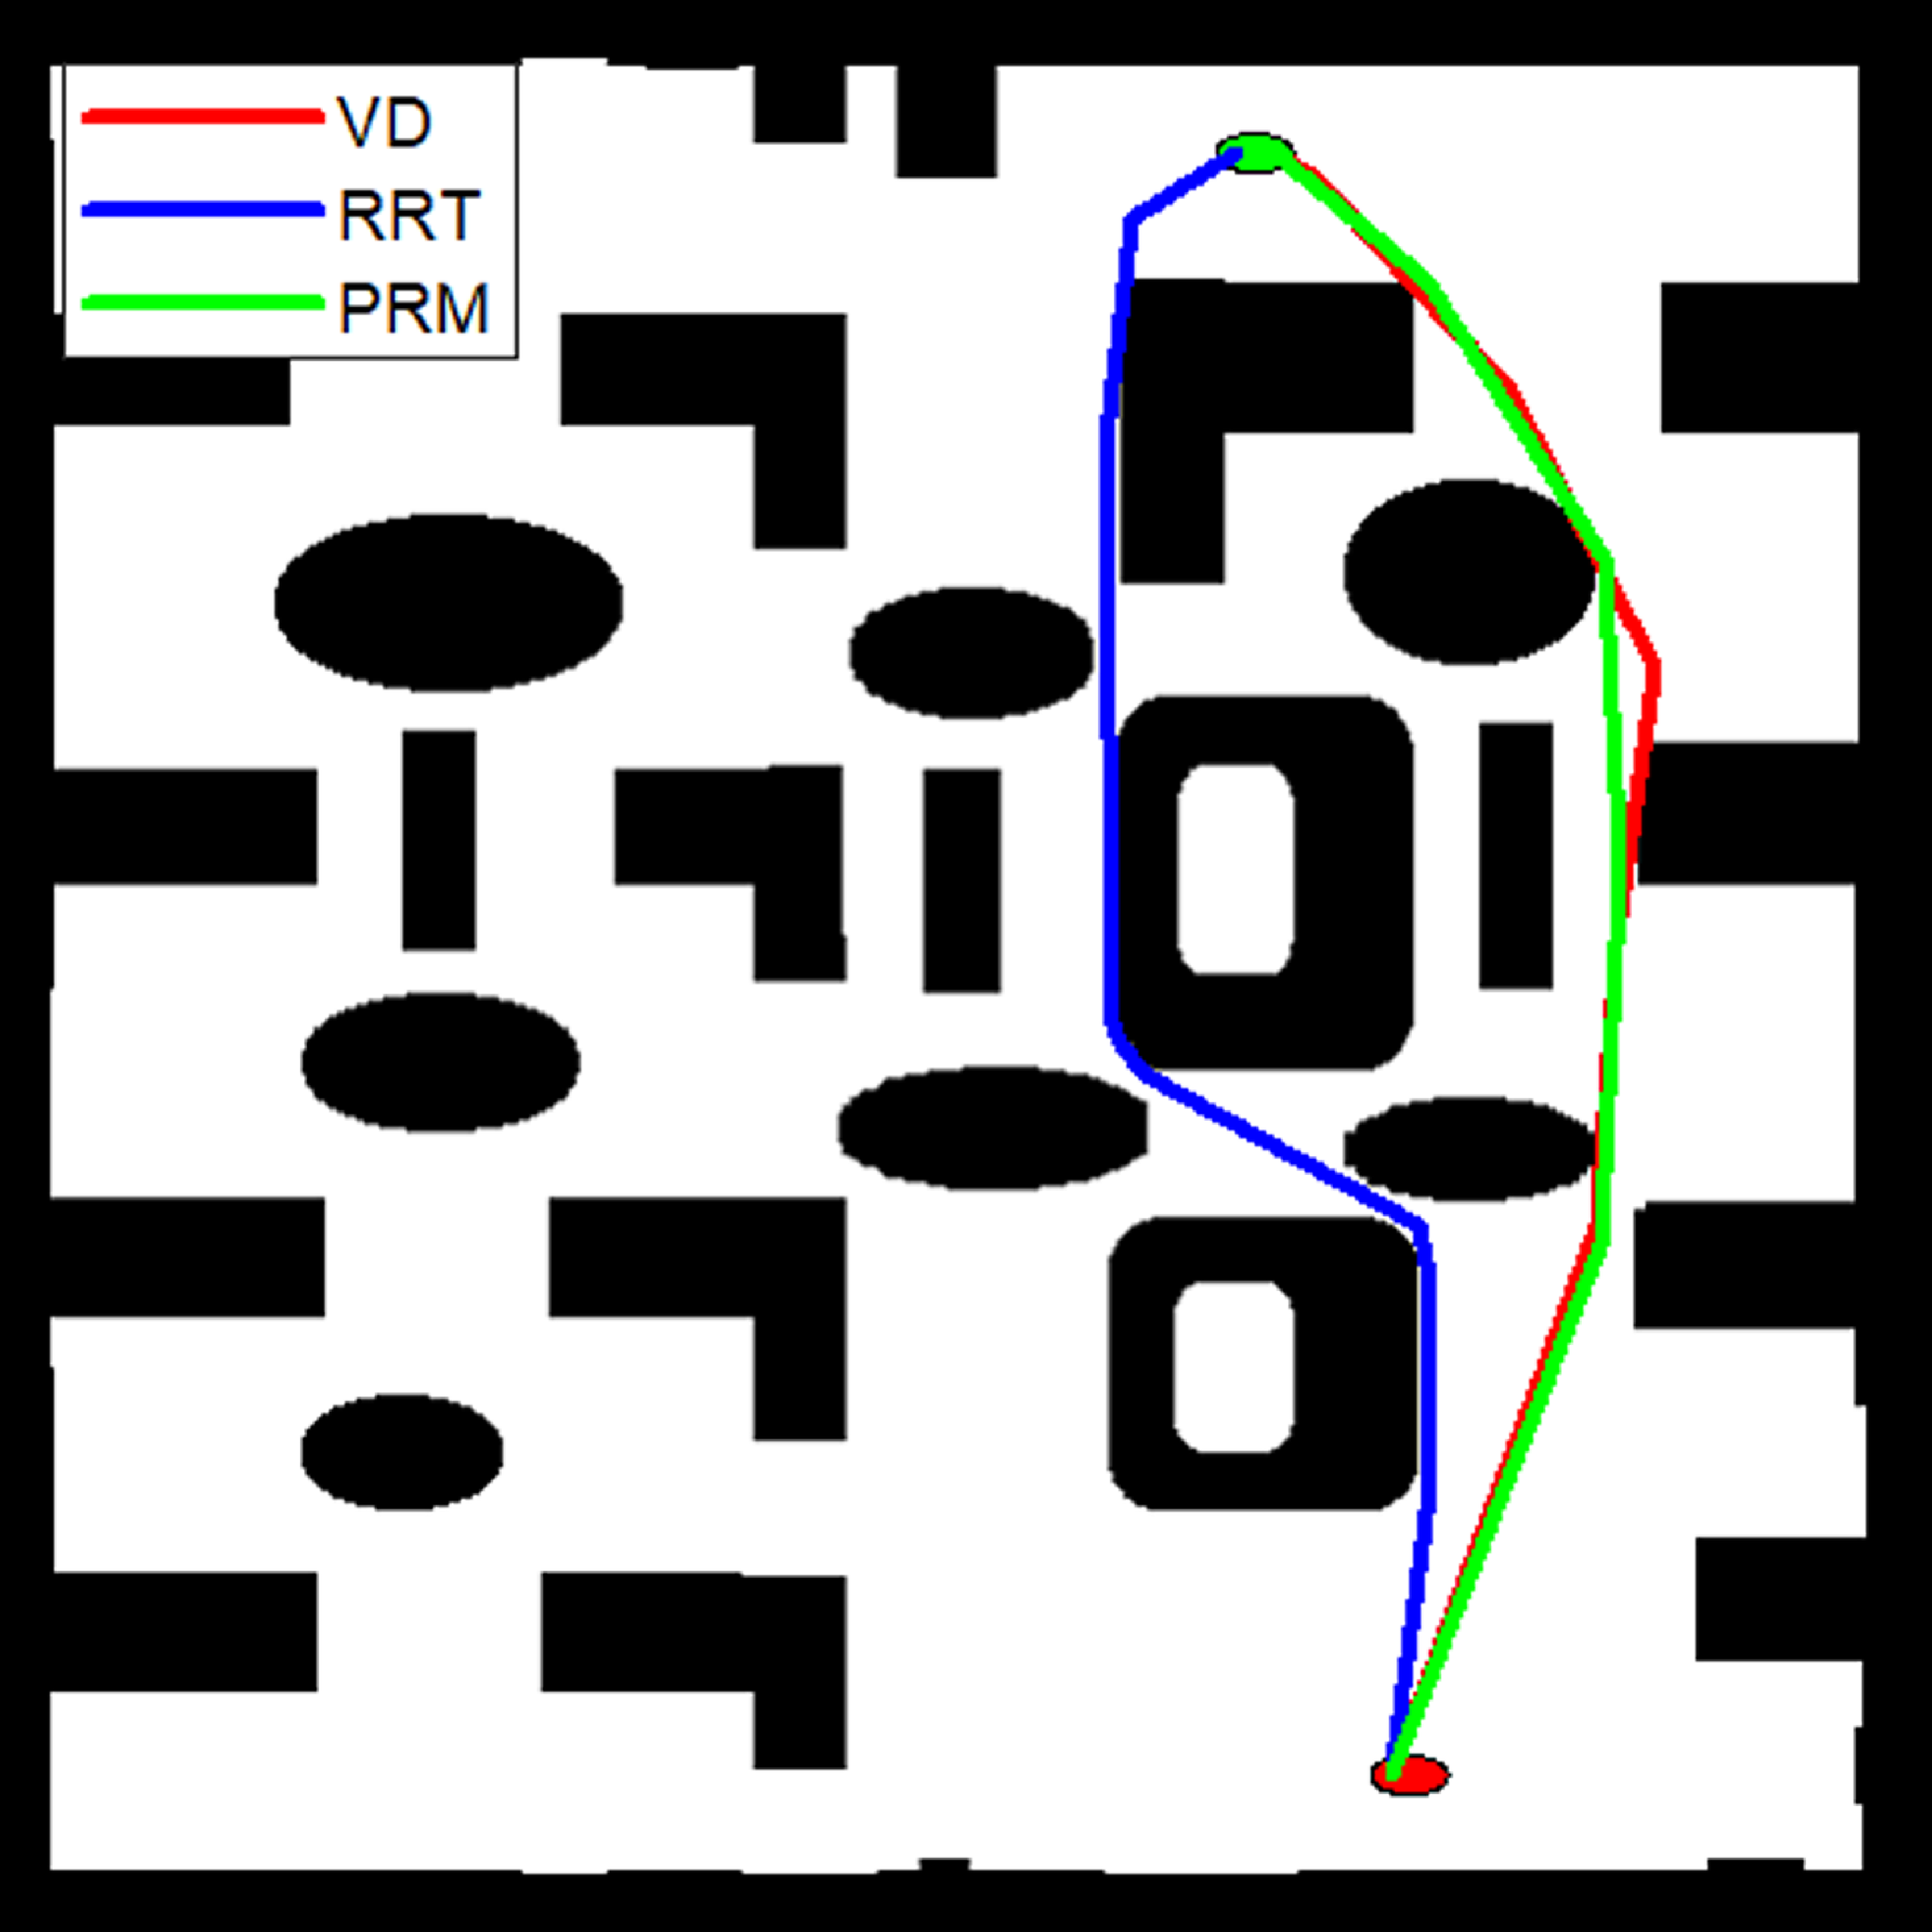
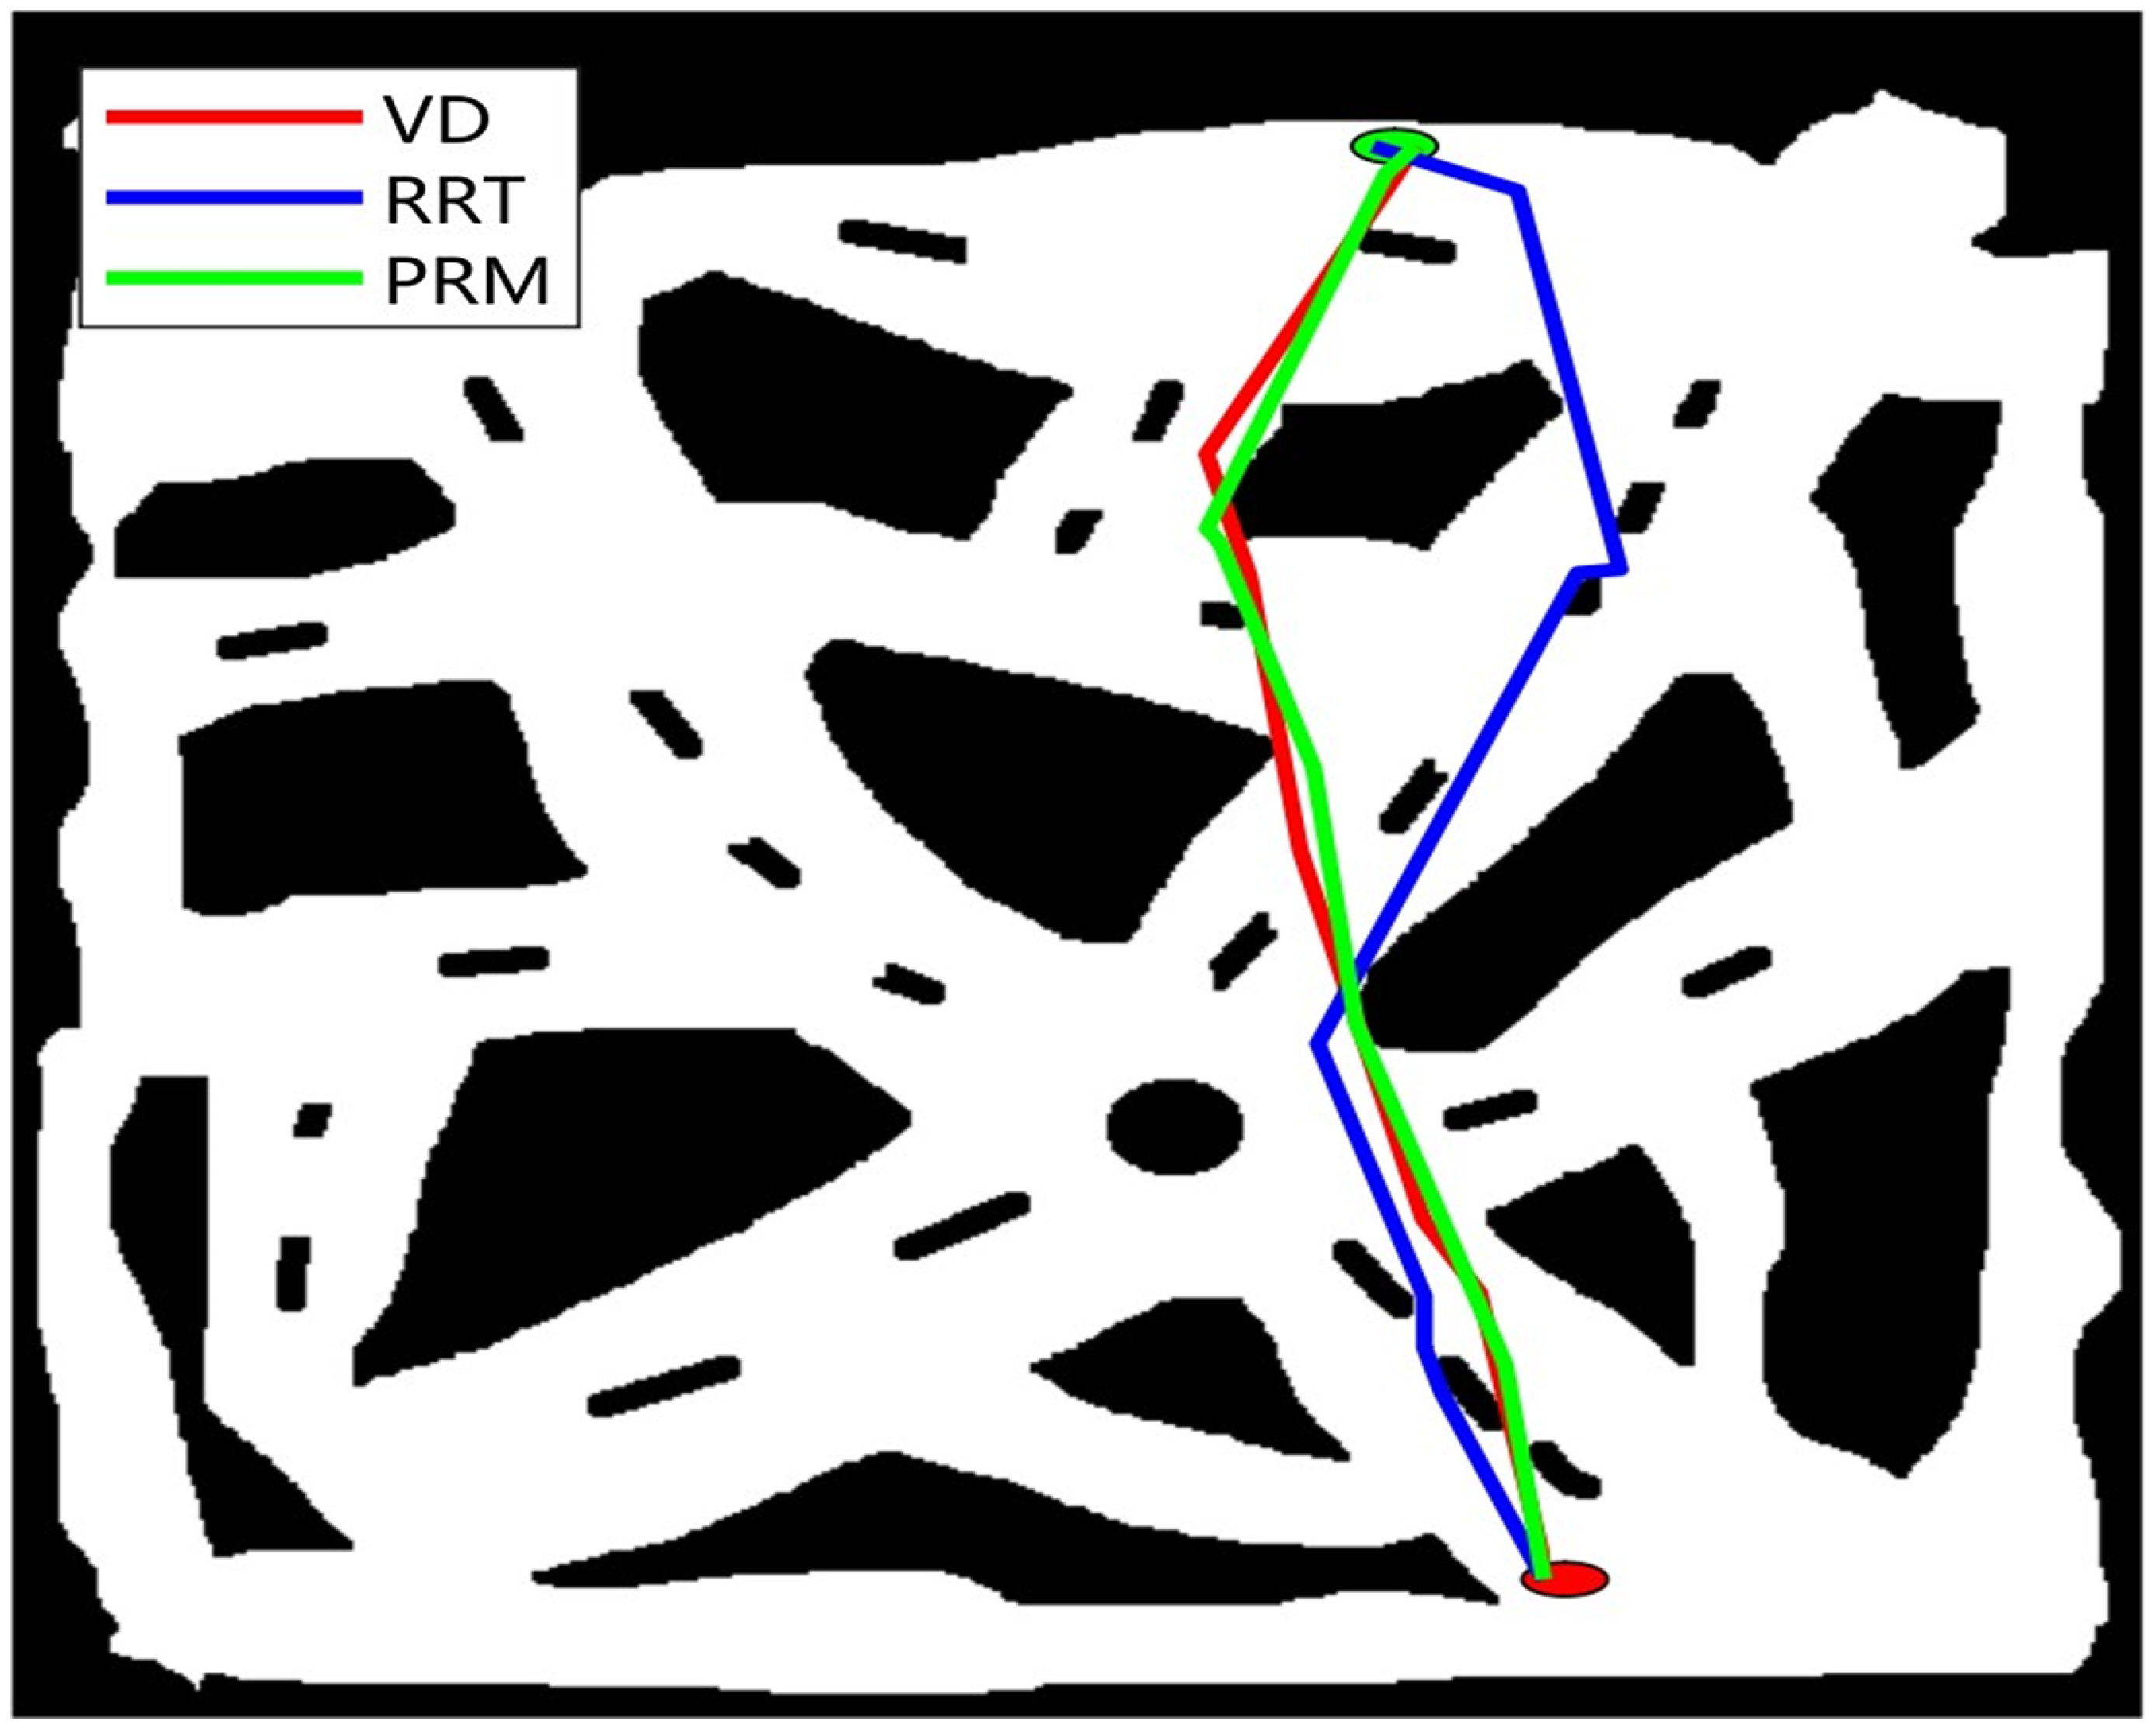
Figures 6–10 present the results of the computed path for VD, RRT, and PRM. Figure 6 shows computed path lengths of VD, RRT, and PRM in a map with an occupancy rate of 55%. PRM obtained the shortest path length of 542.76 in 9.9 s while RRT obtained the longest path length of 618 in 0.2 s. It can be noted that, though RRT obtained the longest path, it used the shortest time in its path computation. In Fig. 7, the shortest path length of 461.44 was computed by PRM in 13.89 s while RRT computed the longest path length of 518.91 in 0.1 s. Among the three methods, RRT computed its path in the shortest time. Figure 8 demonstrates the shortest path length of 485.57 computed by the VD in the longest time of 65.77 s while RRT recorded the longest path of 537.97 in the shortest path of 0.11 s. Figures 9 and 10 illustrate the shortest path length computed by PRM with path lengths of 500.81 and 440.63 in 31.64 and 30.71 s, respectively. RRT obtained the shortest computation time of 0.11 s but recorded the longest path length of 479.9 in Fig. 10. In Fig. 9, VD recorded the longest path length of 514.41.
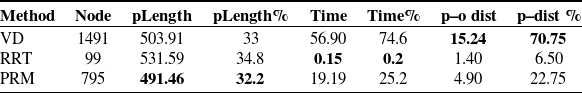
A summary of path computation performance of VD, RRT, and PRM.
Generated path in an environment with an occupancy rate of 55% with VD obtaining path length of 562, RRT 618.36, and PRM 542.76.
Generated path in an environment with an occupancy rate of 42.9% with VD obtaining path length of 471.11, RRT 518.91, and PRM 461.44.
Generated path in an environment with an occupancy rate of 43.2% with VD obtaining path length of 485.57, RRT 537.97, and PRM 488.21.
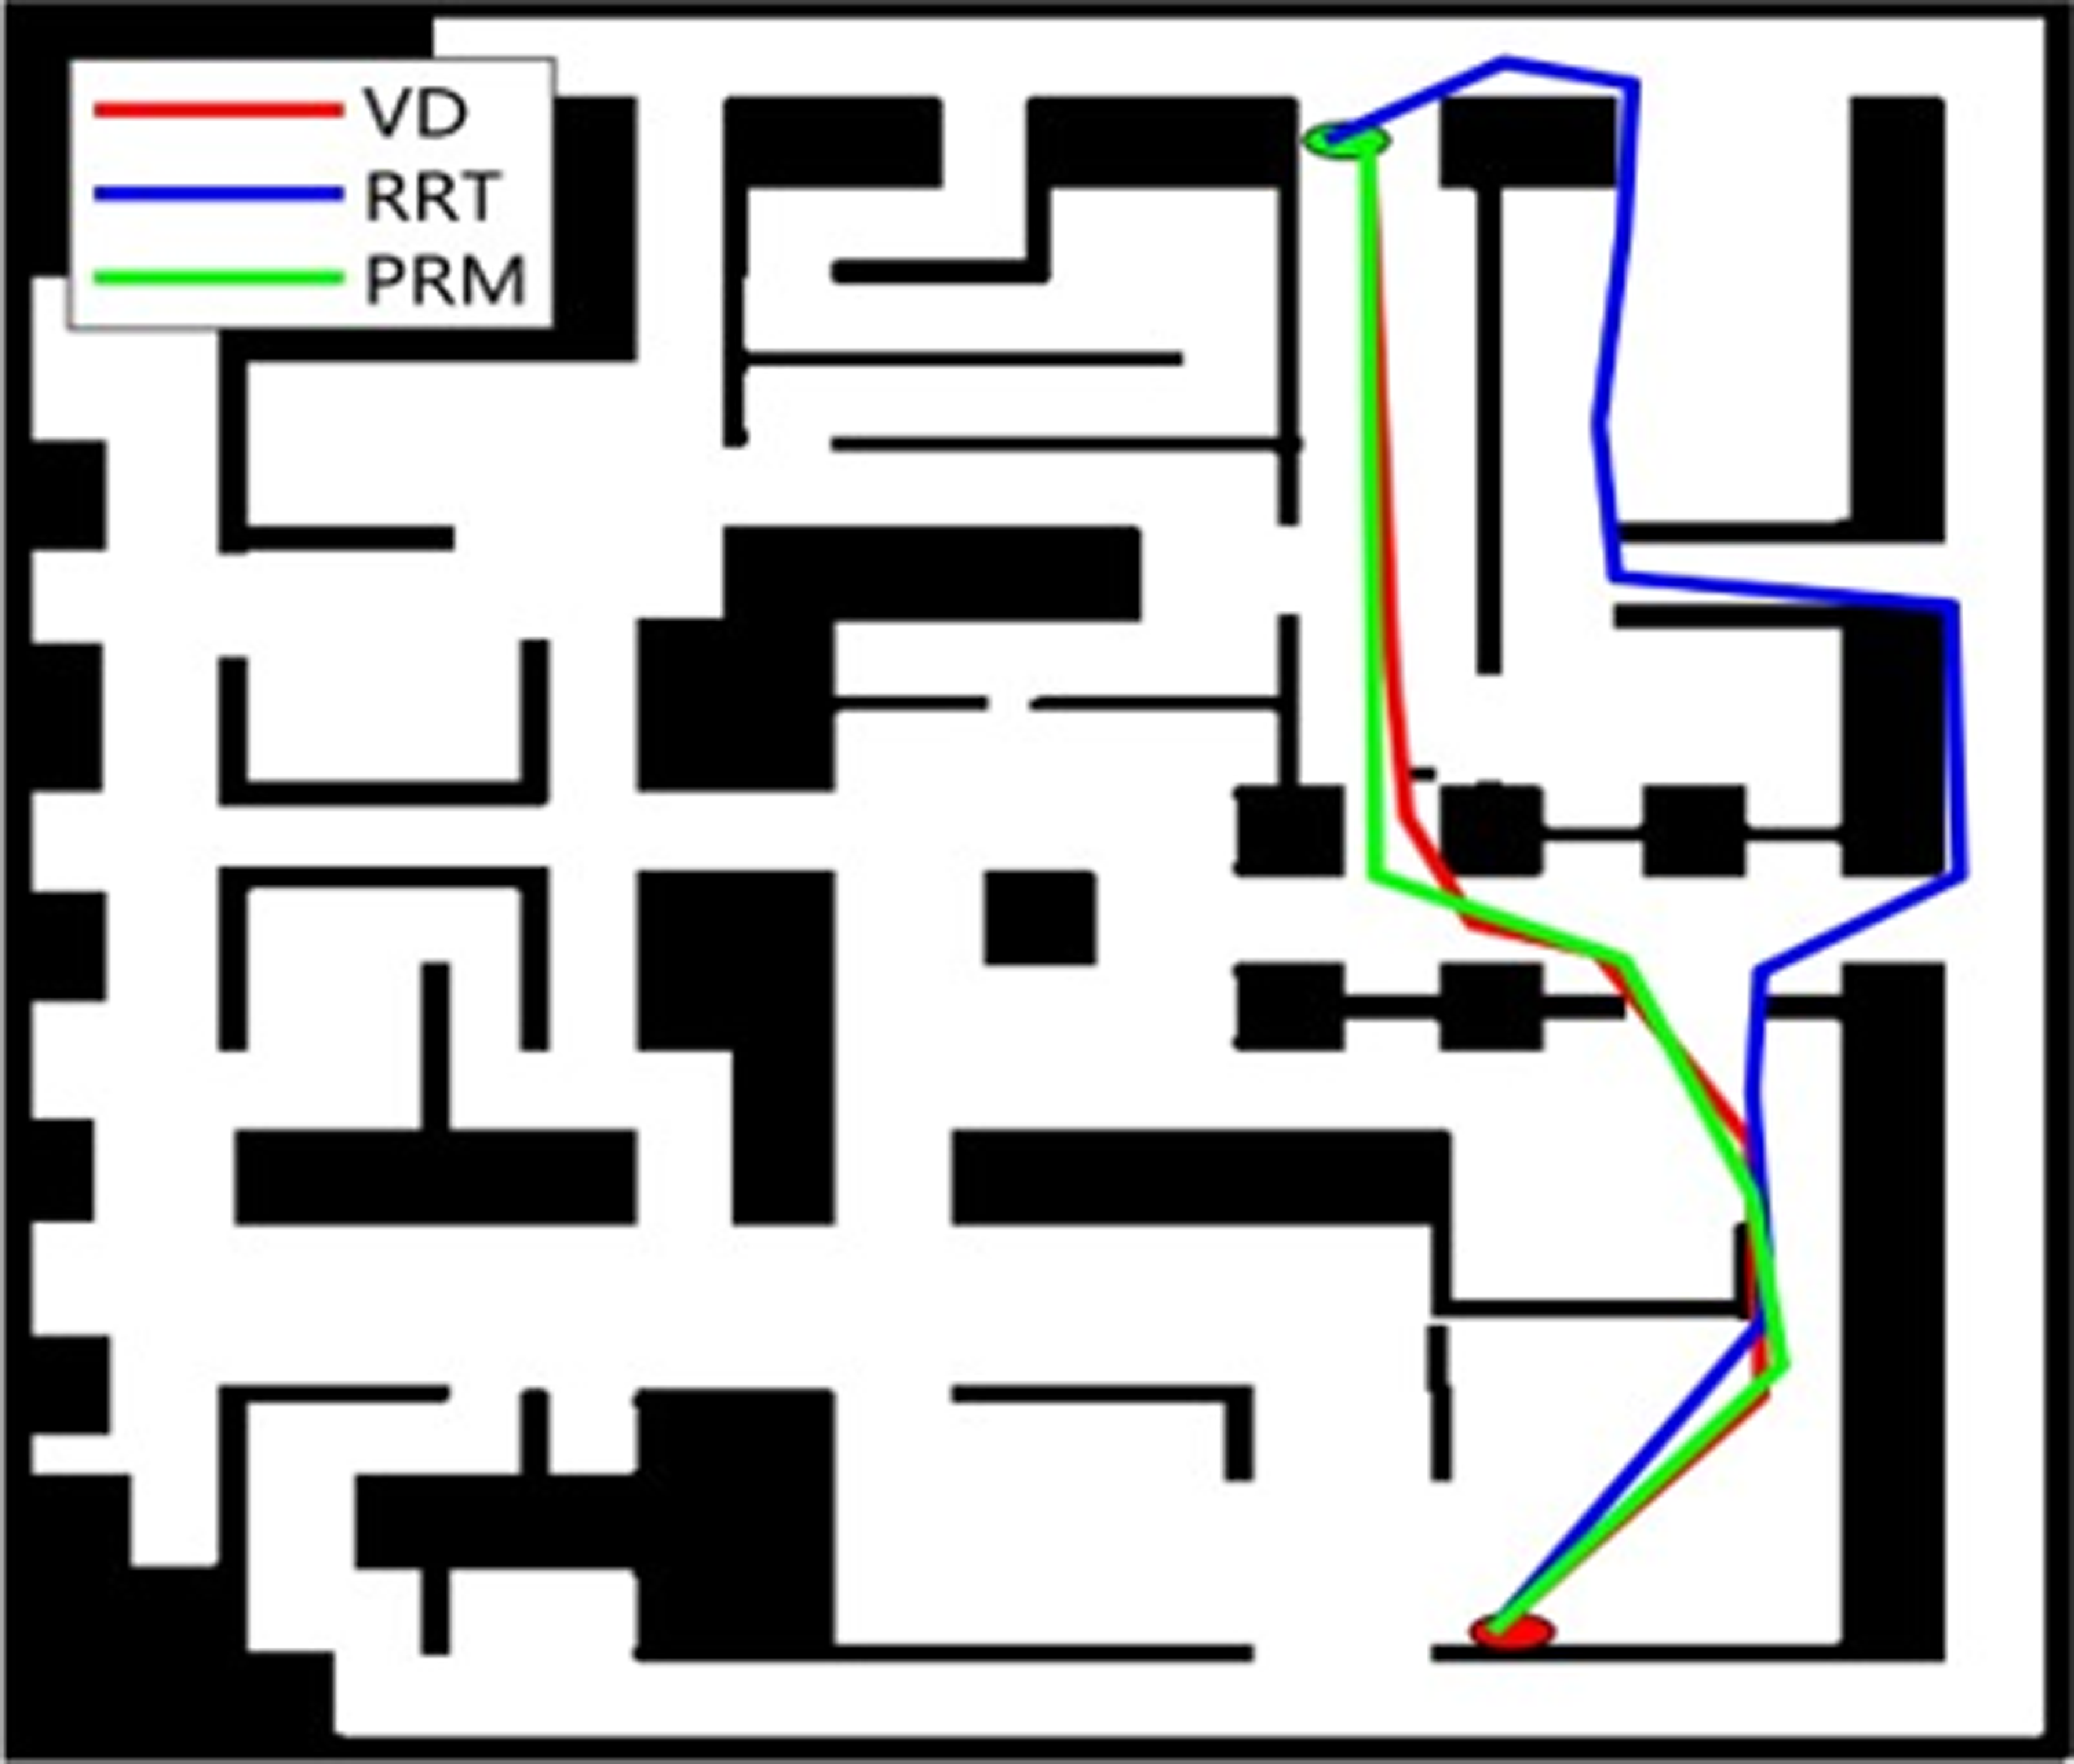
Generated path in an environment with an occupancy rate of 33.8% with VD obtaining path length of 514.41, RRT 512.12, and PRM 500.81.
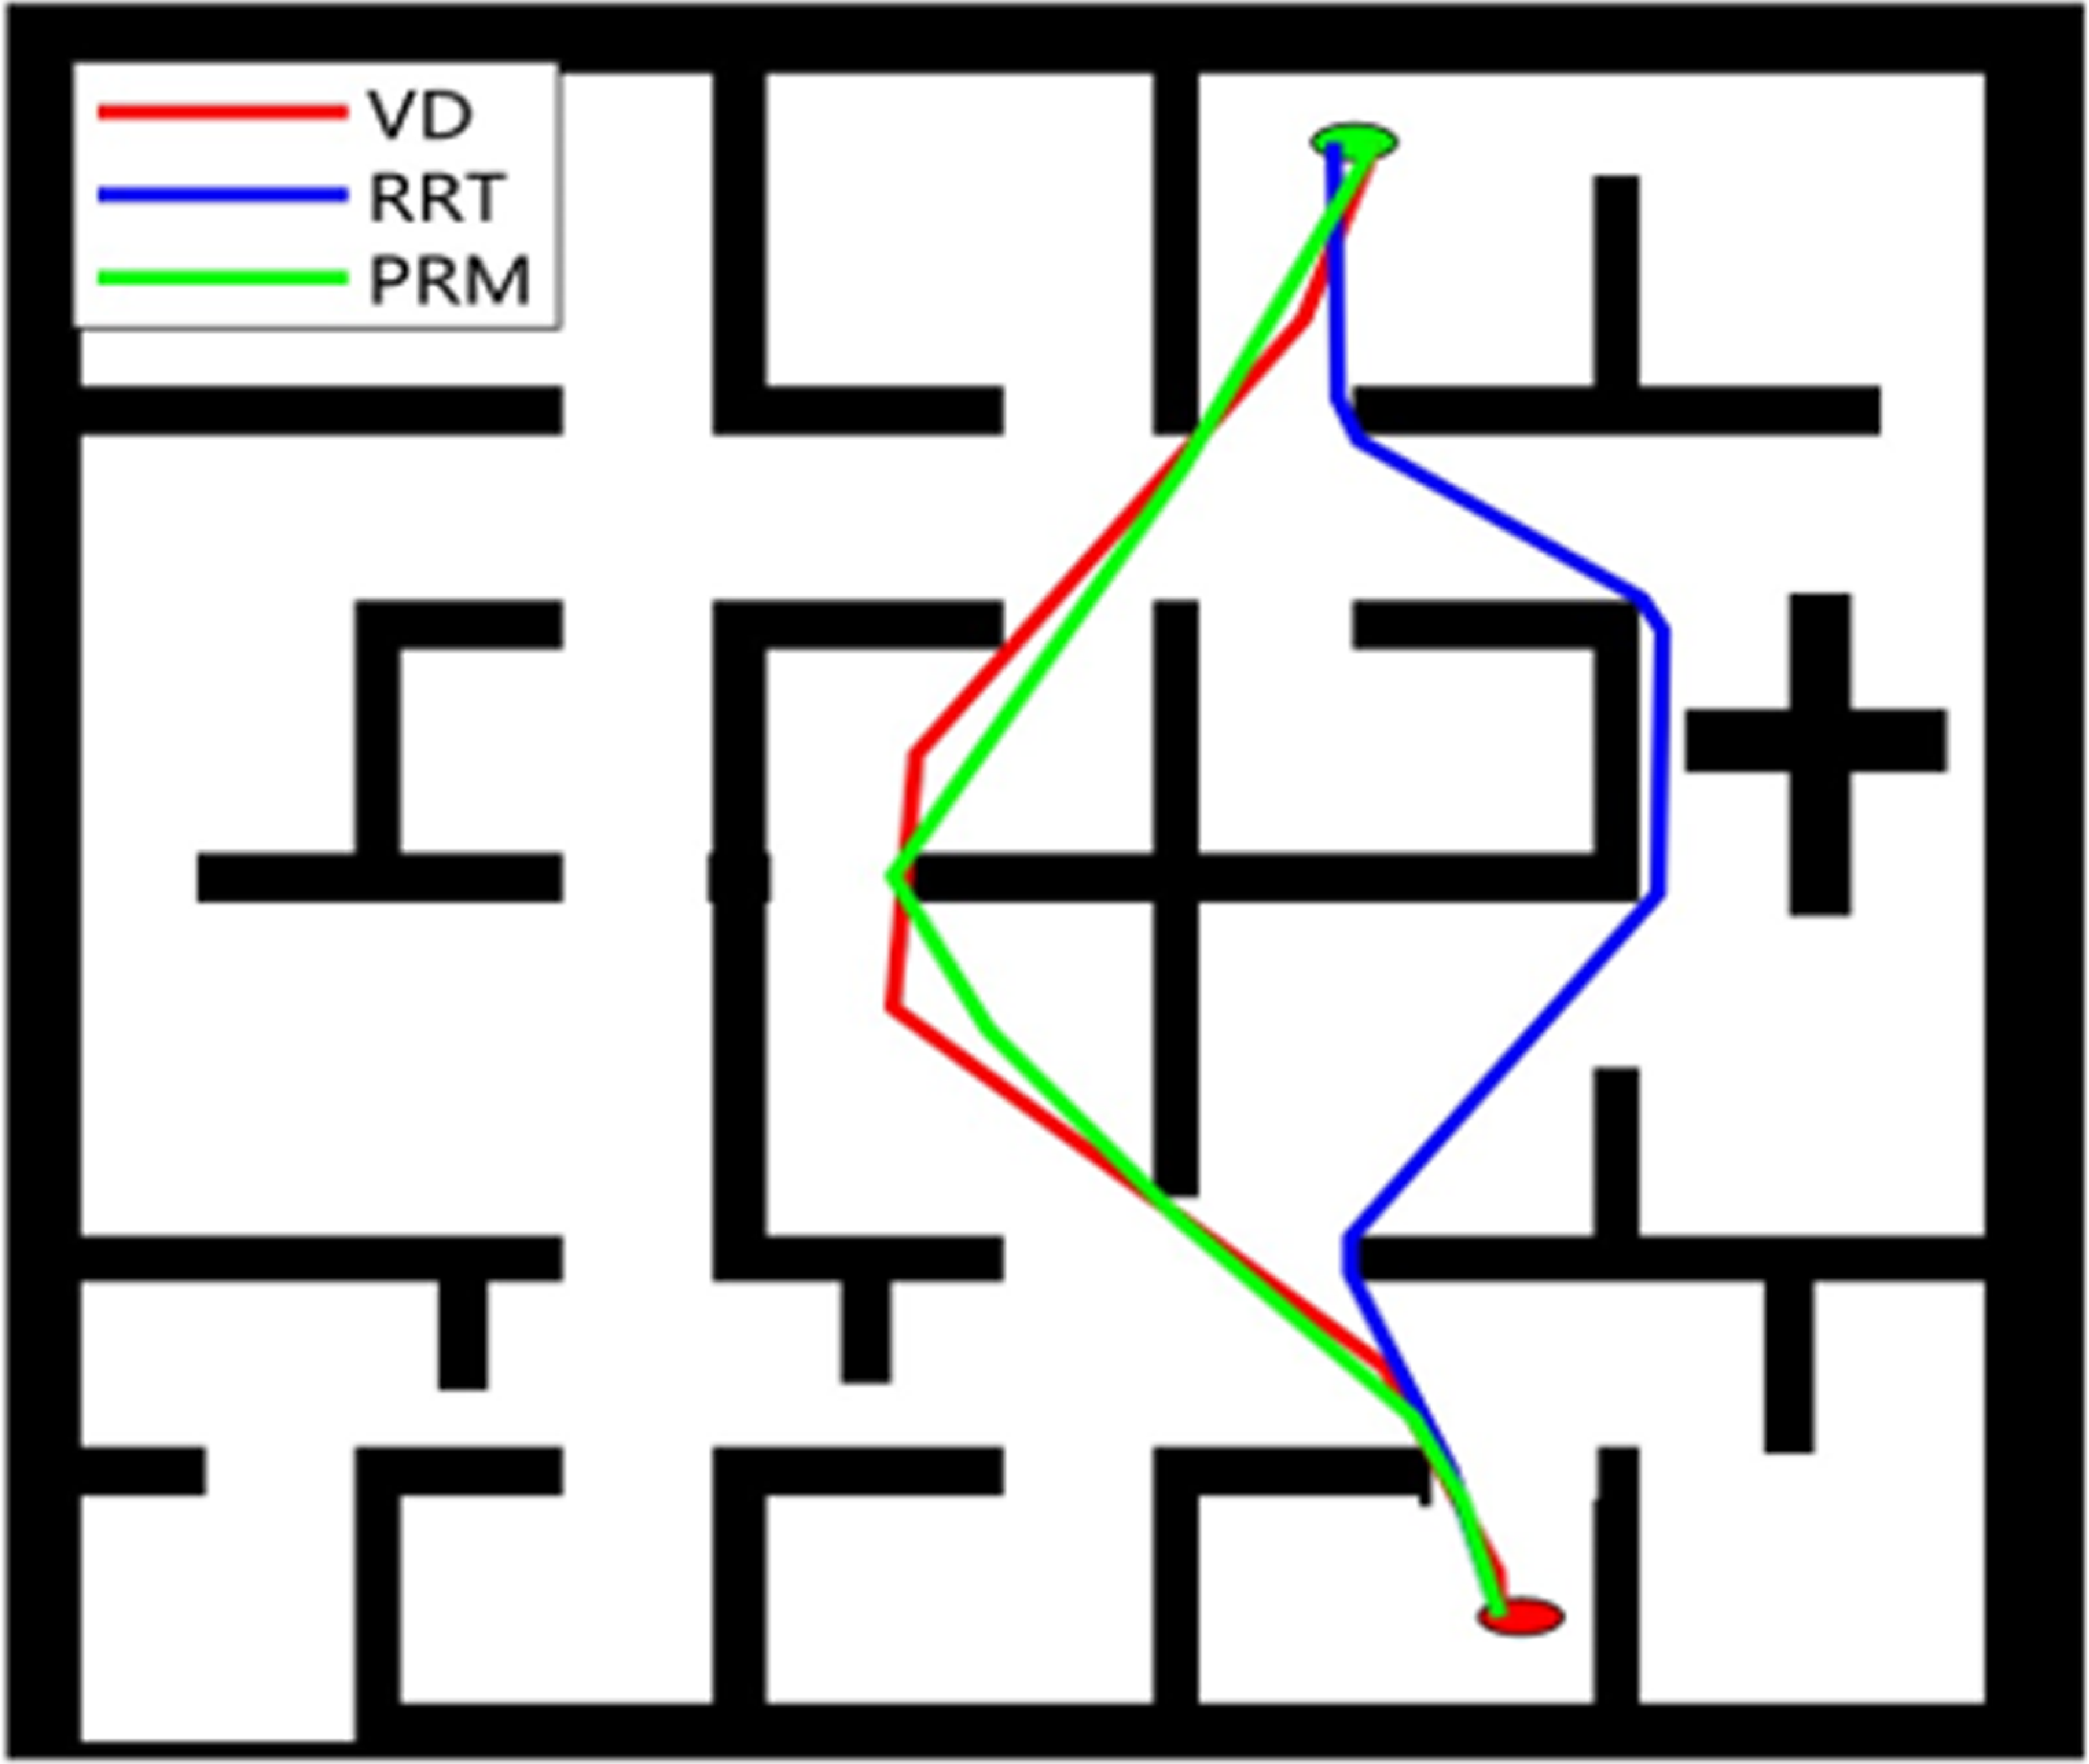
Generated path in an environment with an occupancy rate of 44.9% with VD obtaining path length of 453.12, RRT 479.9, and PRM 440.63.
The following observations can be derived from Table I.
-
• PRM obtained the shortest average path lengths of 490.98, 491.75, 491.36, 492.03, 492.06, 490.87, 491.57, 491.95, 491.06, and 490.99 for each of the 10 trials, respectively. RRT recorded the longest path lengths ranging from 524.22 to 536.31 for each of the trials.
-
• Concerning performance in computation time, RRT obtained the shortest computation time ranging from 0.13 to 0.18 s for each of the trials. Though the VD method performed better compared to RRT in terms of path length computation, it recorded the longest computation time ranging from 56.66 to 57.13 s.
-
• p-o distance determines the safety of the computed path and vice versa. In Table II, VD recorded a stable and the highest p–o distance value of 15.24 for each trial. However, RRT recorded the lowest distance ranging from 1.05 to 1.72 for each of the trials.
Figure 11 illustrates the path lengths obtained by VD, RRT, and PRM for each map and the 1000 trials. It can be deduced that PRM demonstrated the best performance in terms of shortest path computation, while RRT demonstrated the worst performance of the three methods.
Detailed path length obtained by VD, RRT, and PRM for each of the 1000 trials.
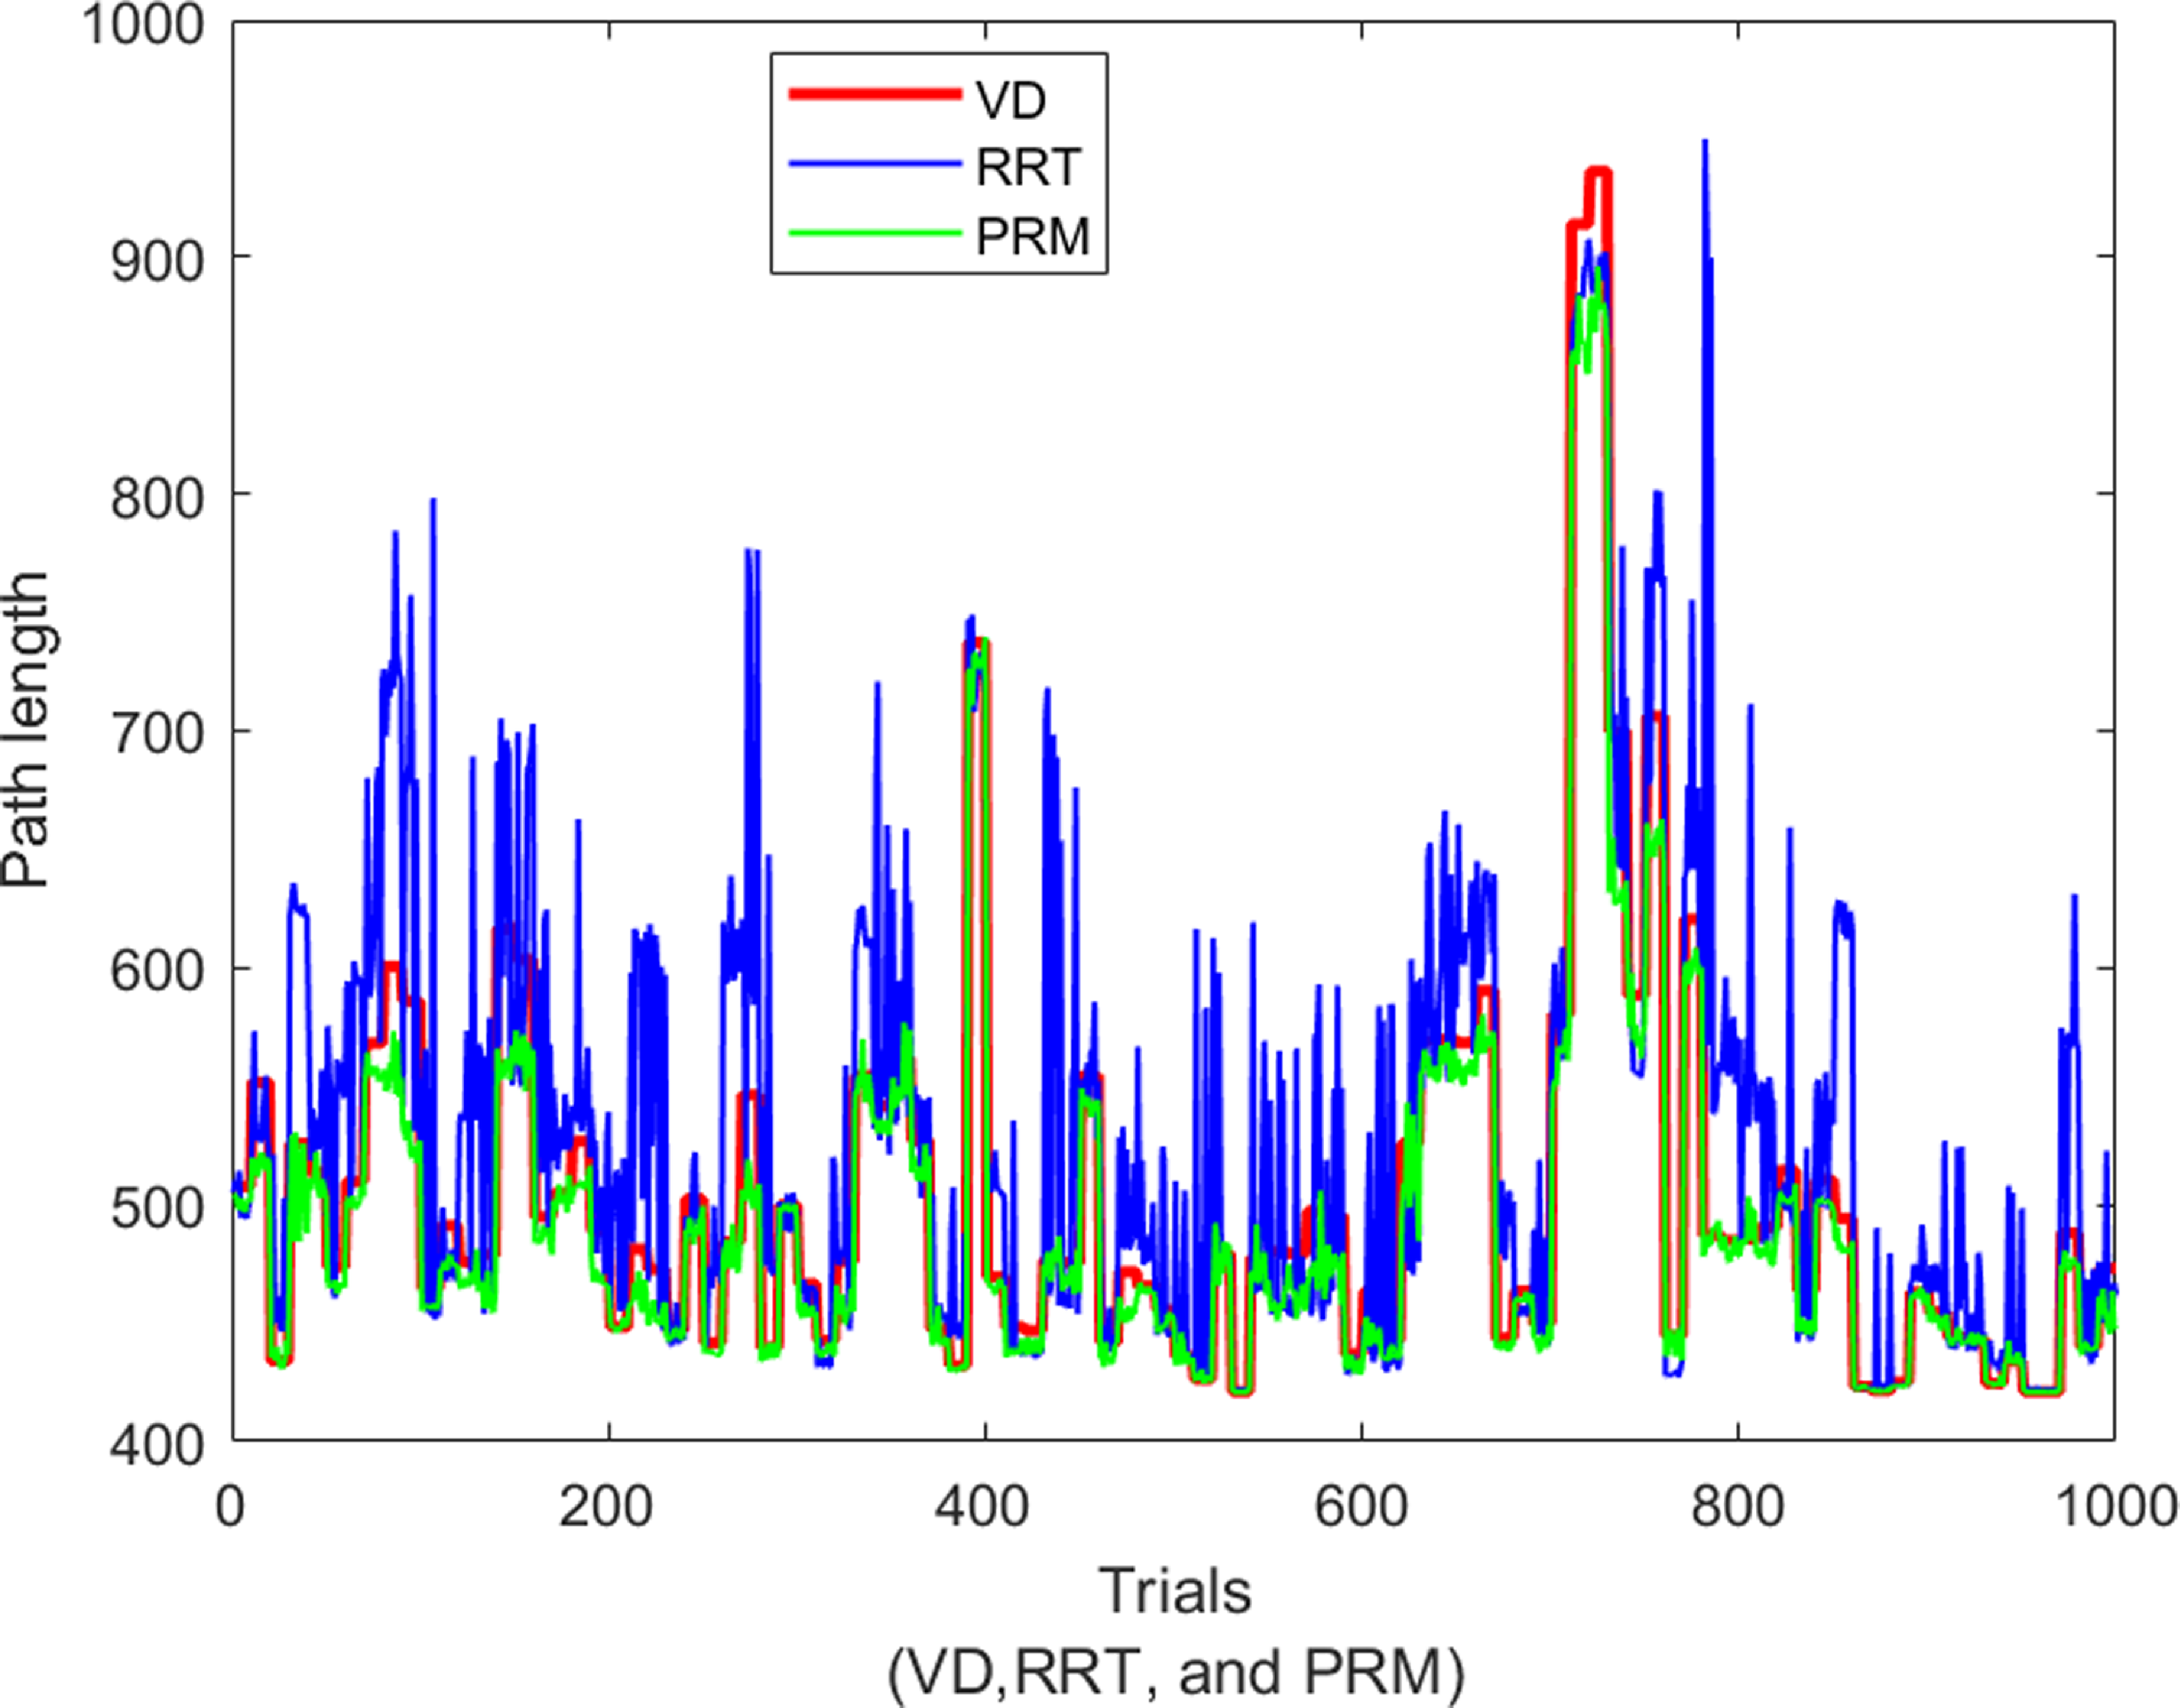
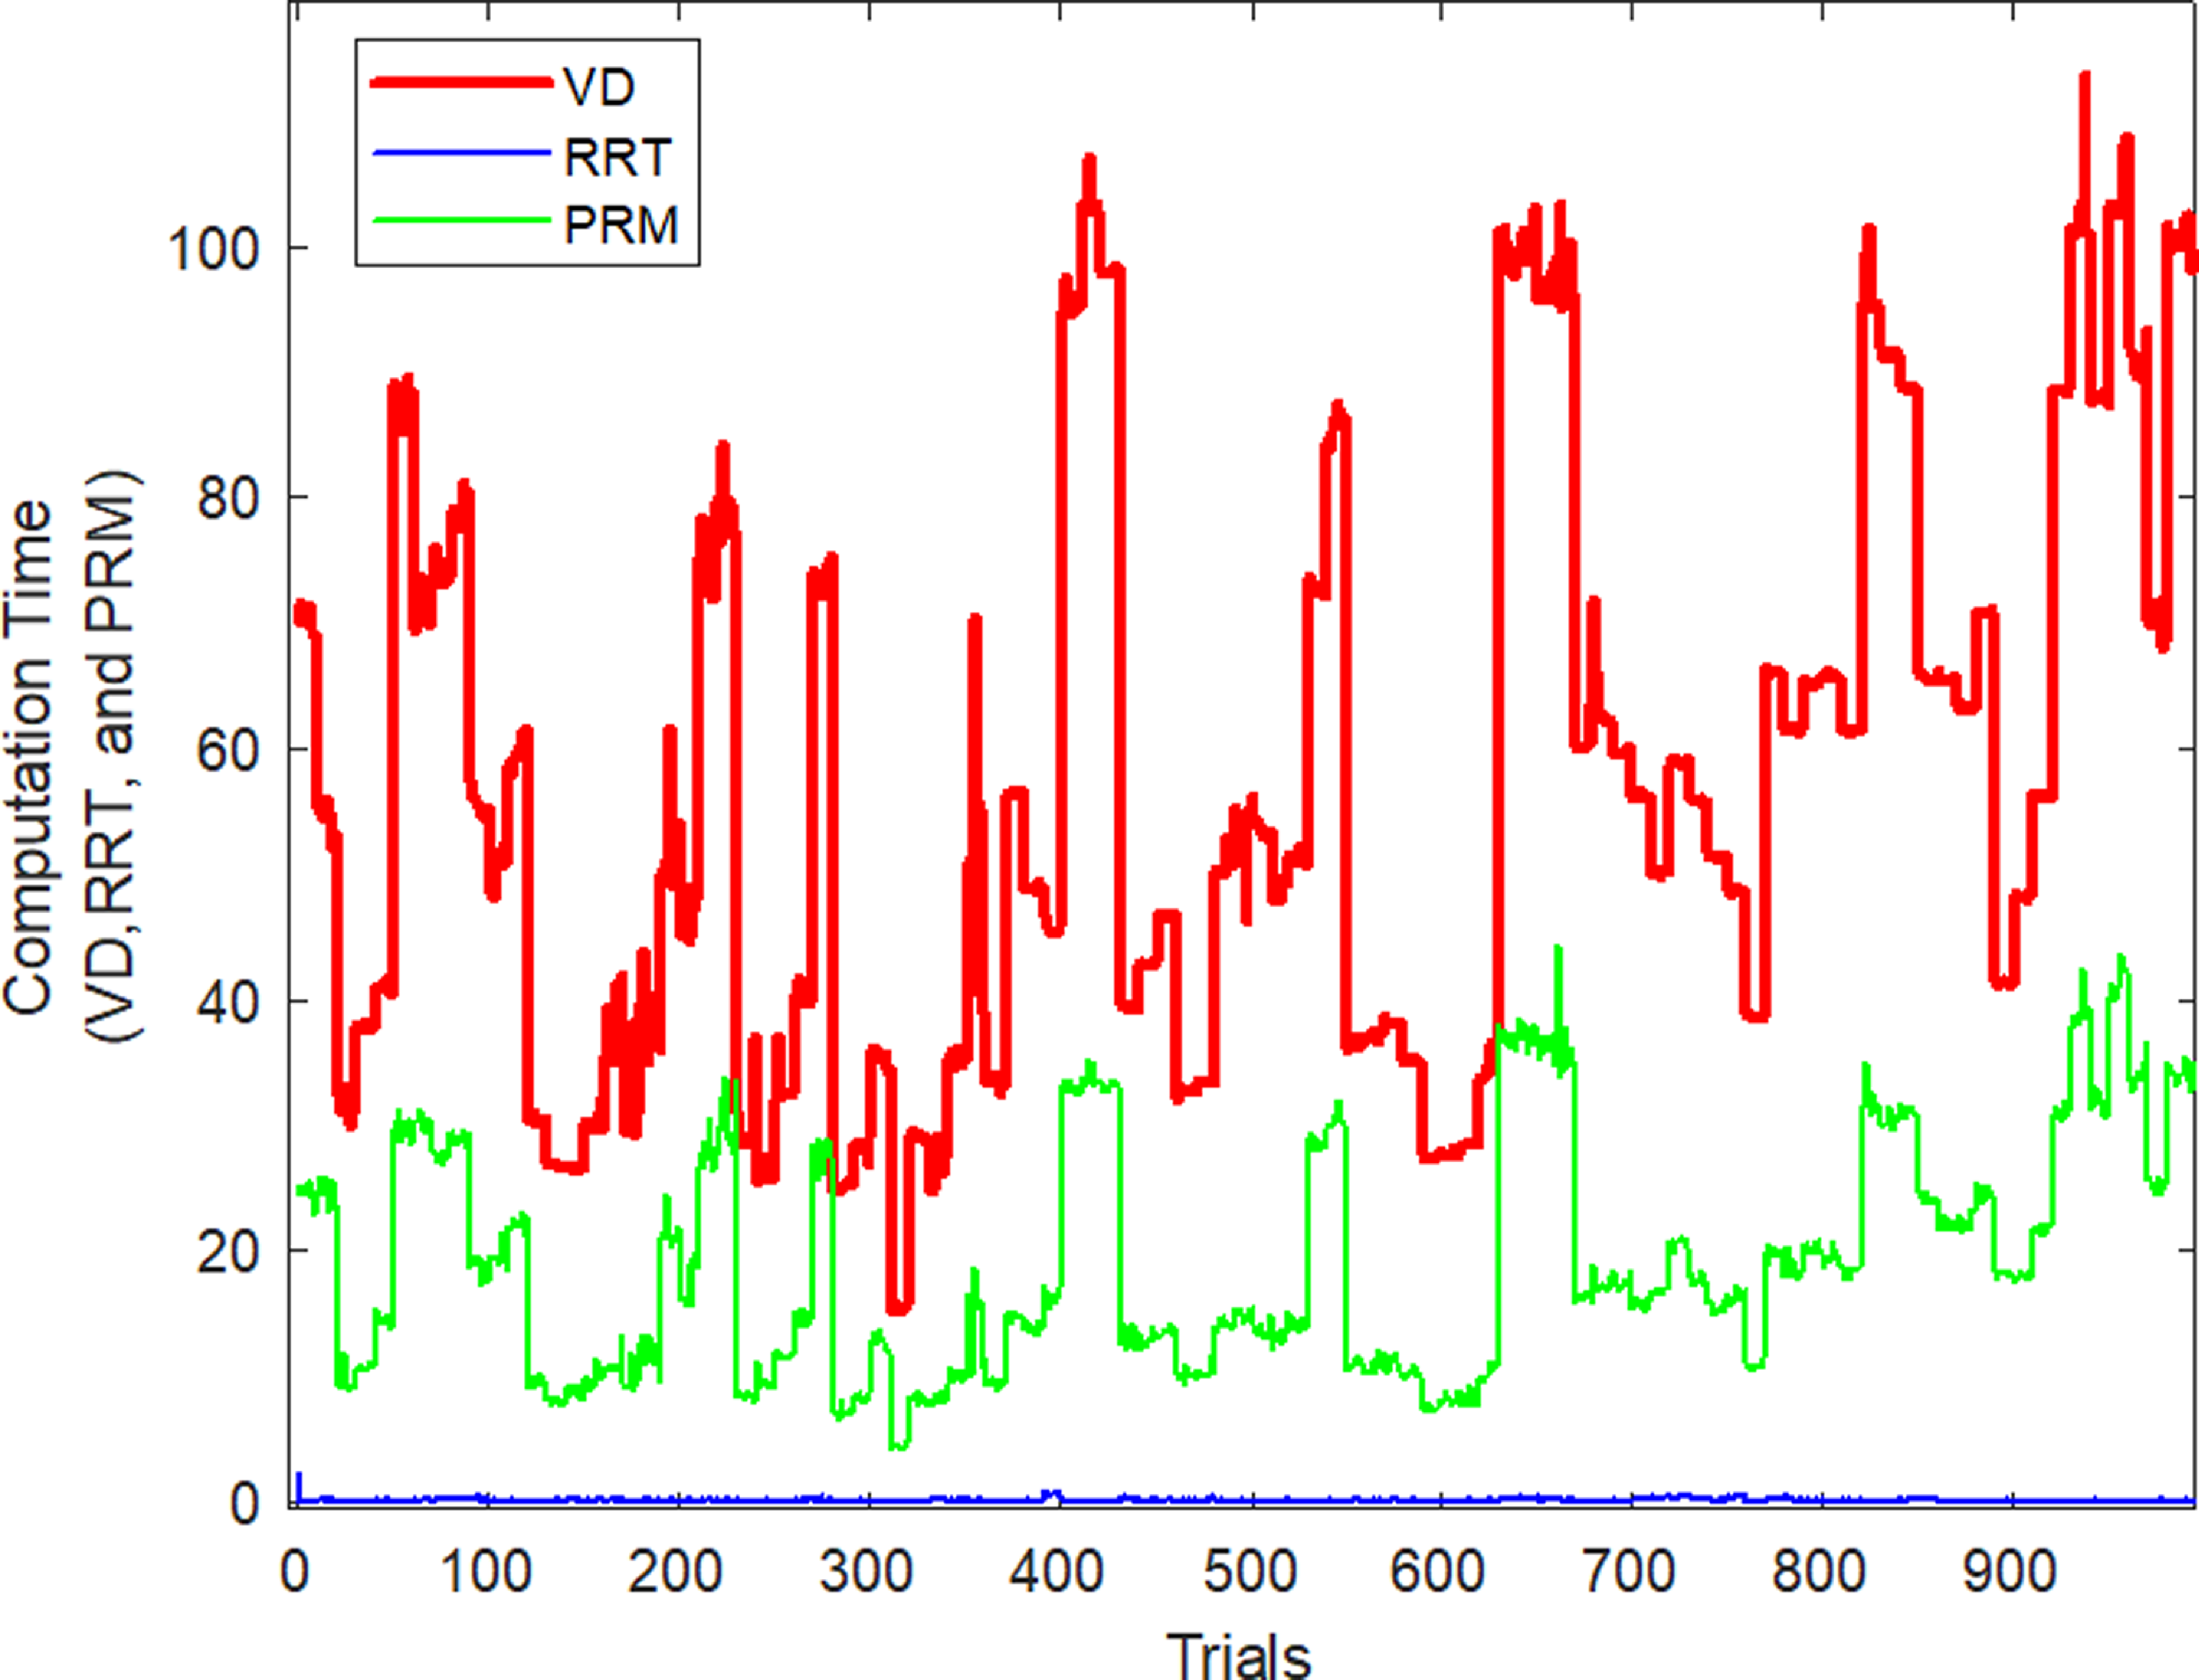
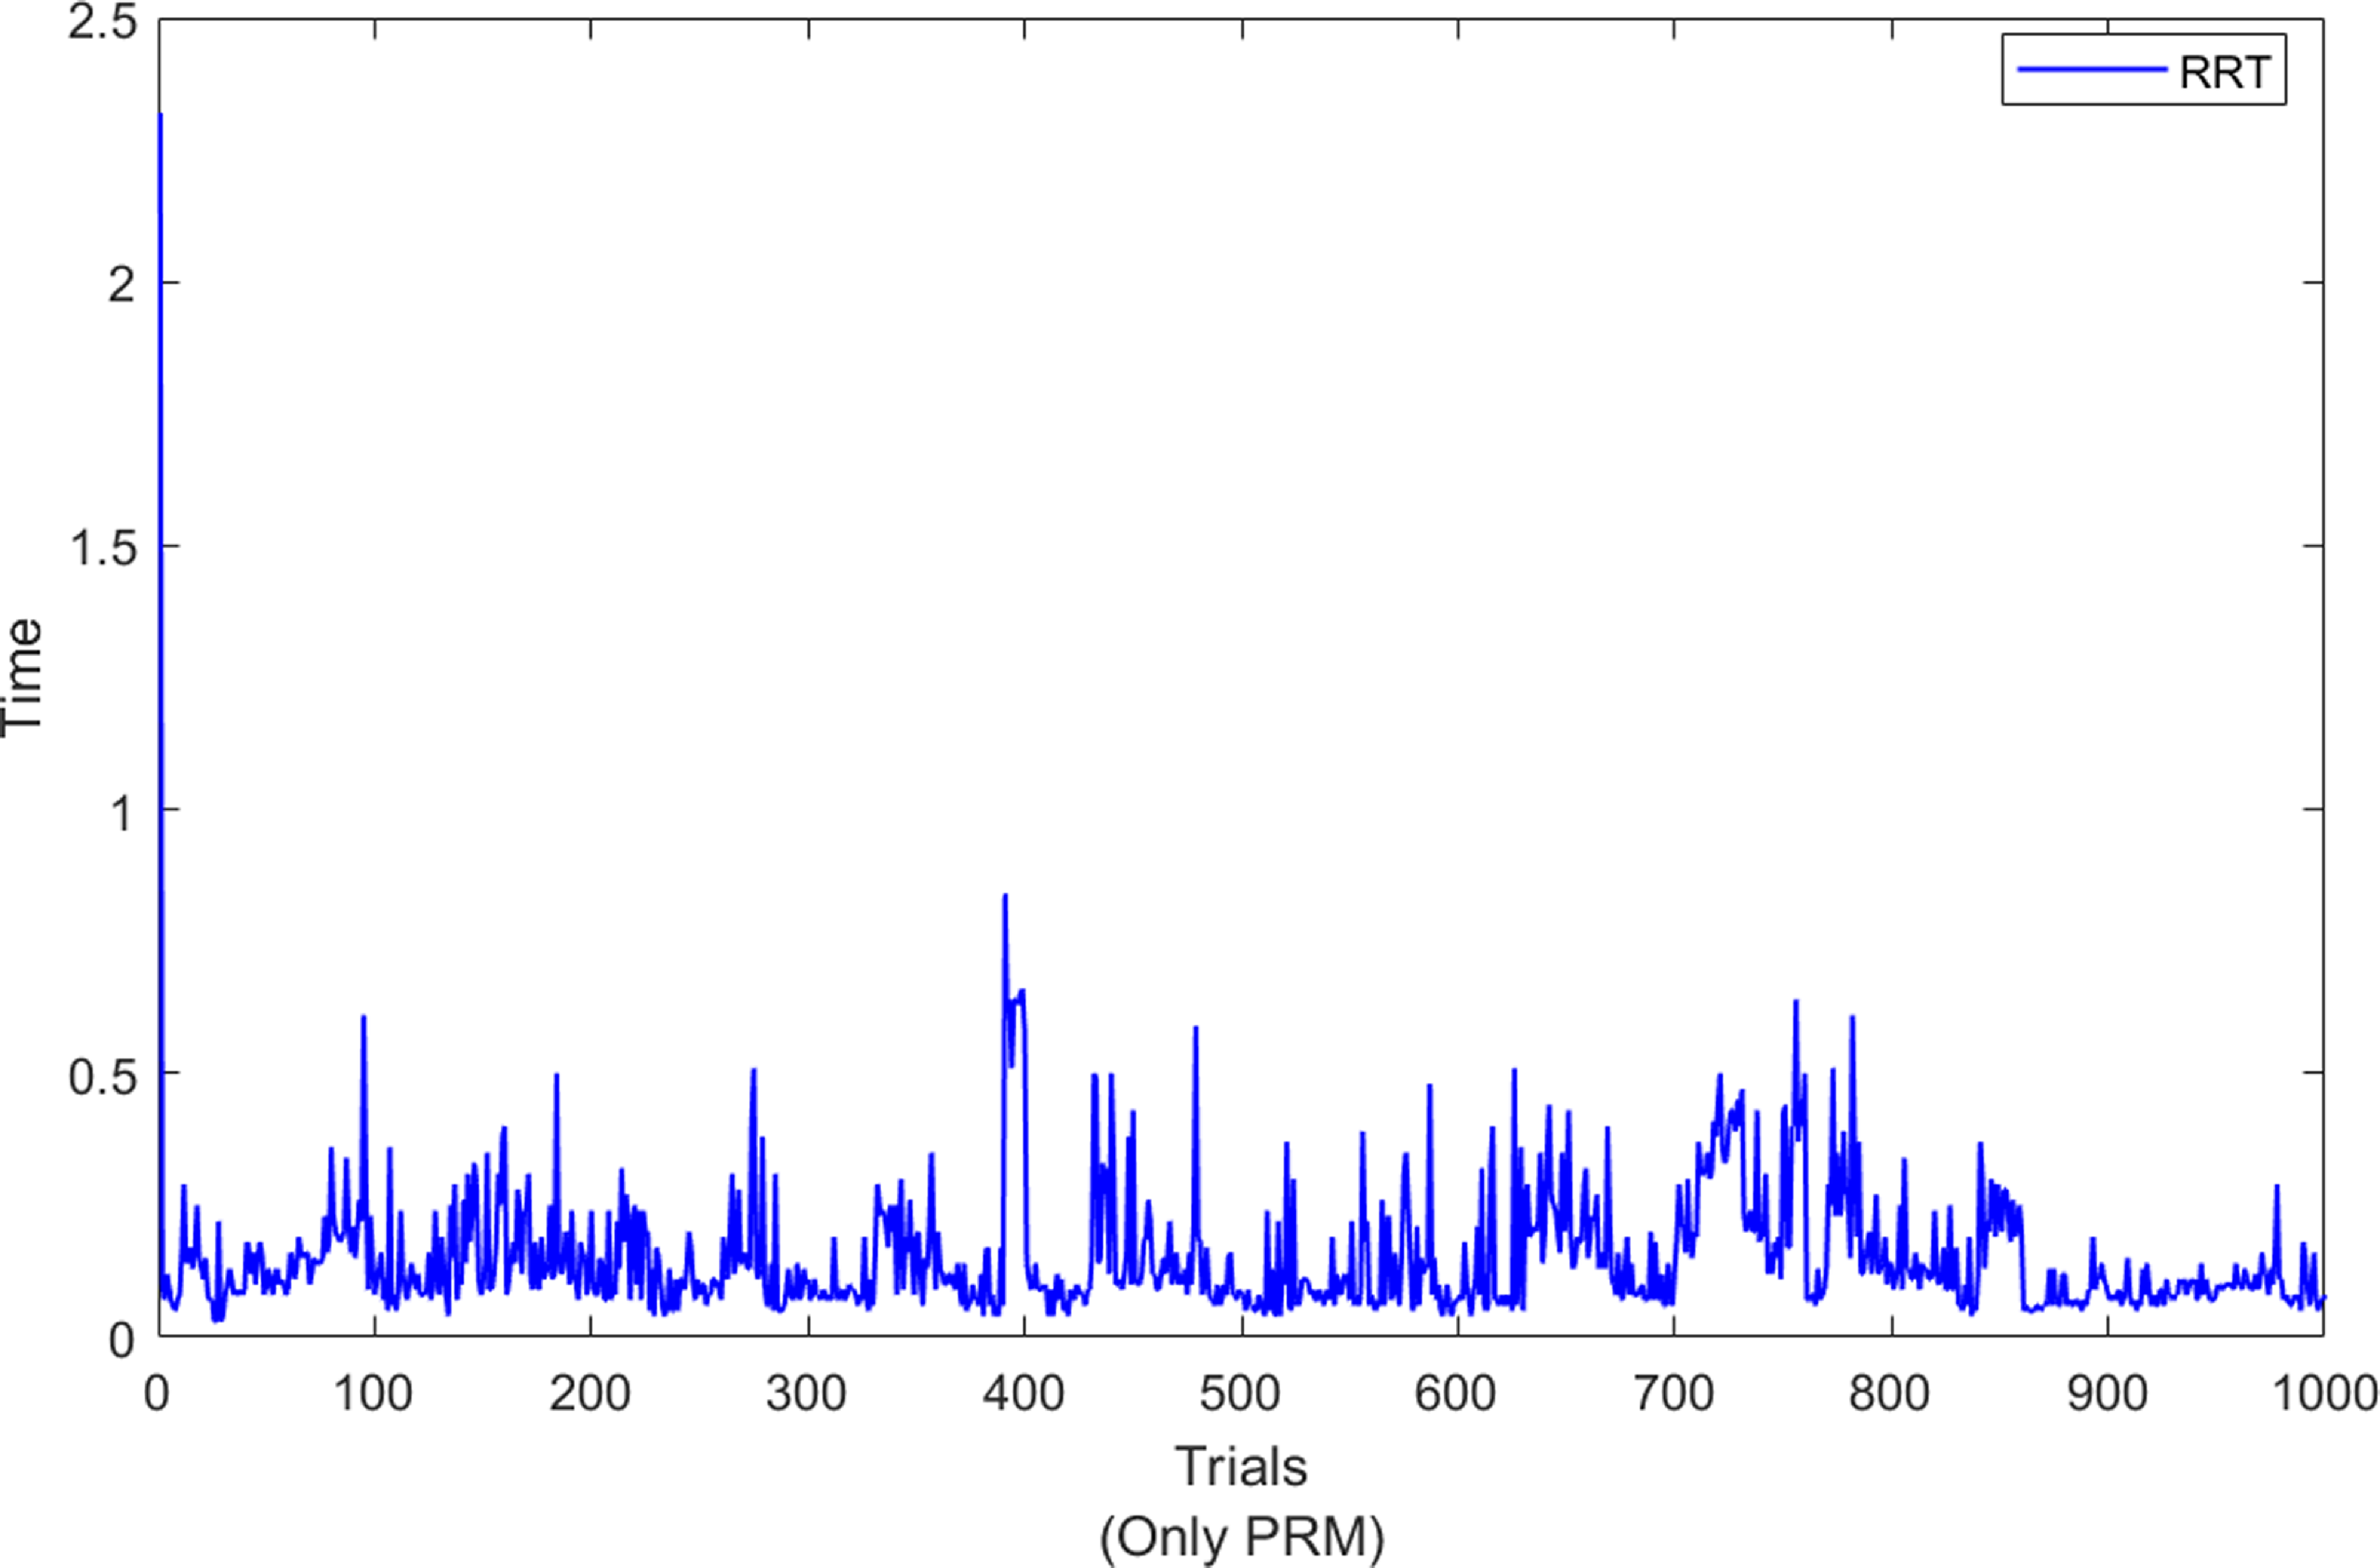
Figure 12 shows the computation time recorded by VD, RRT, and PRM for each map and each trial. Figure 13 demonstrates the expanded chart to reveal the detailed computation time obtained by RRT for each of the trials as shown in Fig. 12. Results demonstrate the best performance of RRT recording less than 2.5 s for each of the trials on each map. However, VD obtained the highest computation time, with some recording computation time of more than 100 s.
Computation time by VD, RRT, and PRM for each of the 1000 trials.
Expanded chart showing the computation time by RRT for each of the 1000 trials.
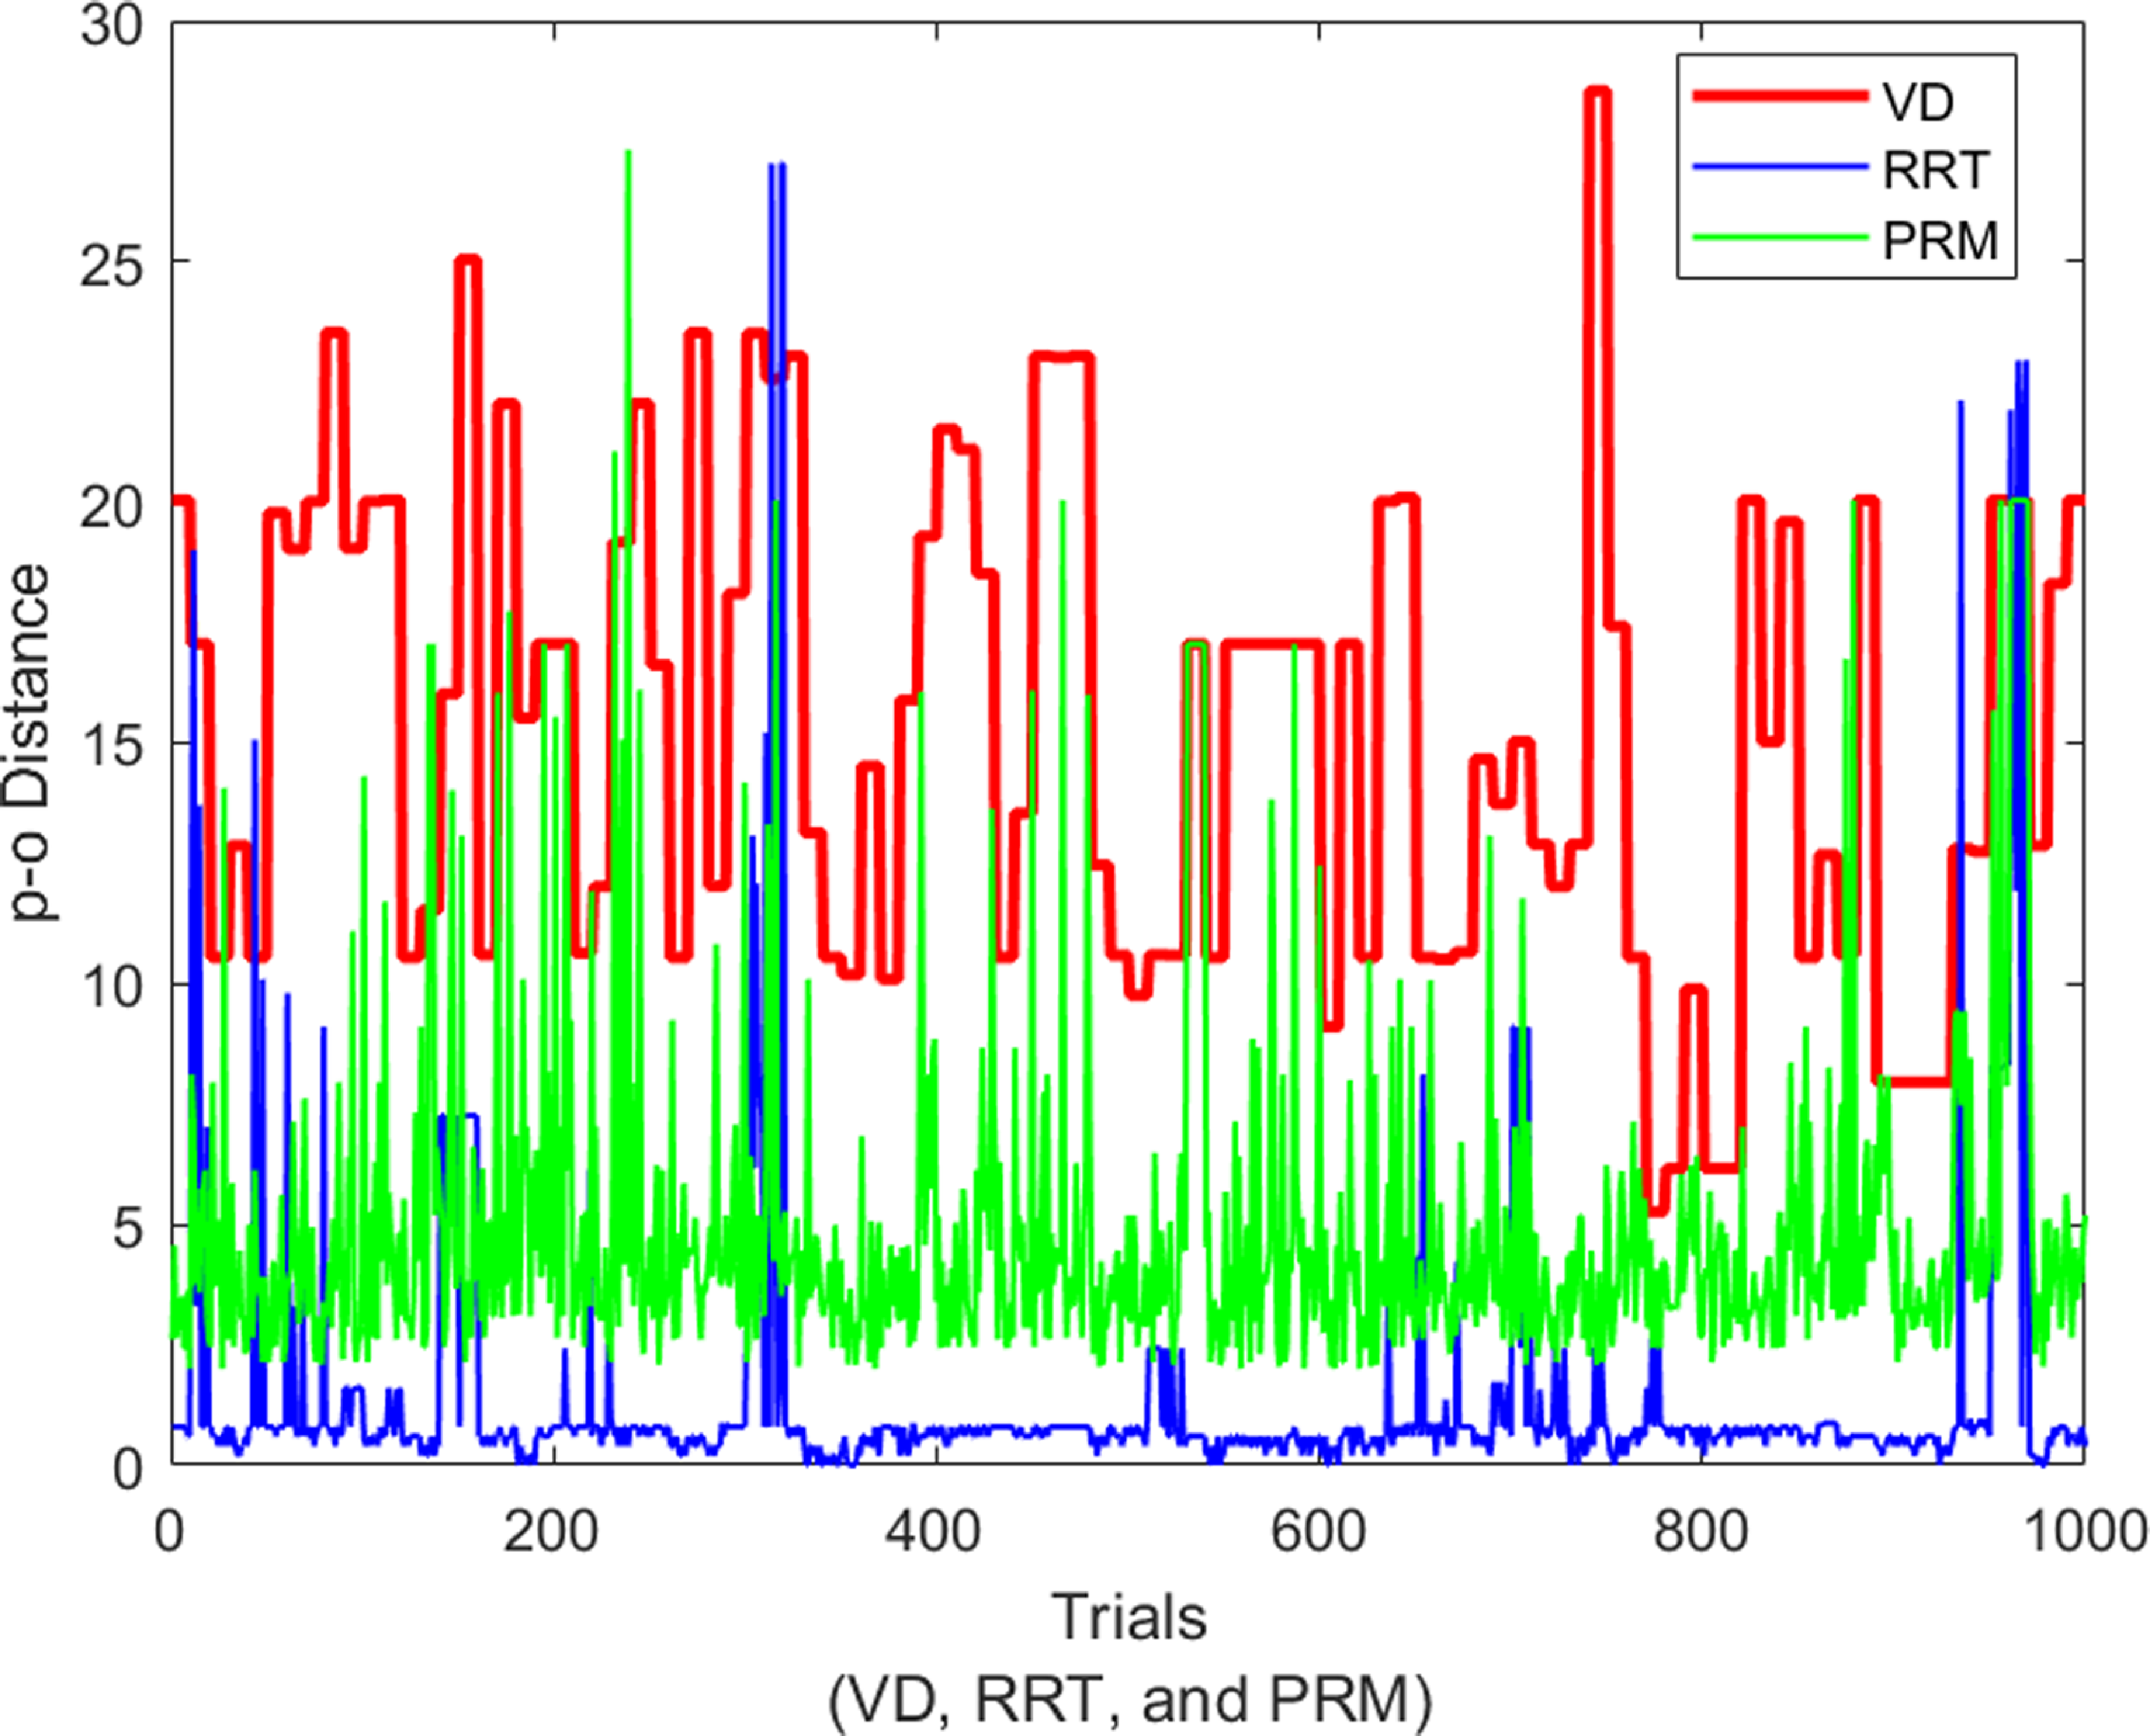
Detailed p–o distances to determine the safety of the computed path is shown in Fig. 14. It can be observed that VD recorded the highest and most consistent p–o distance for each of the maps and trials. The lowest p–o distance value was recorded by the RRT method. It could be noted that while the p–o distance of VD was consistent, RRT and PRM were inconsistent.
Average p–o distance of VD, RRT, and PRM for each trial.
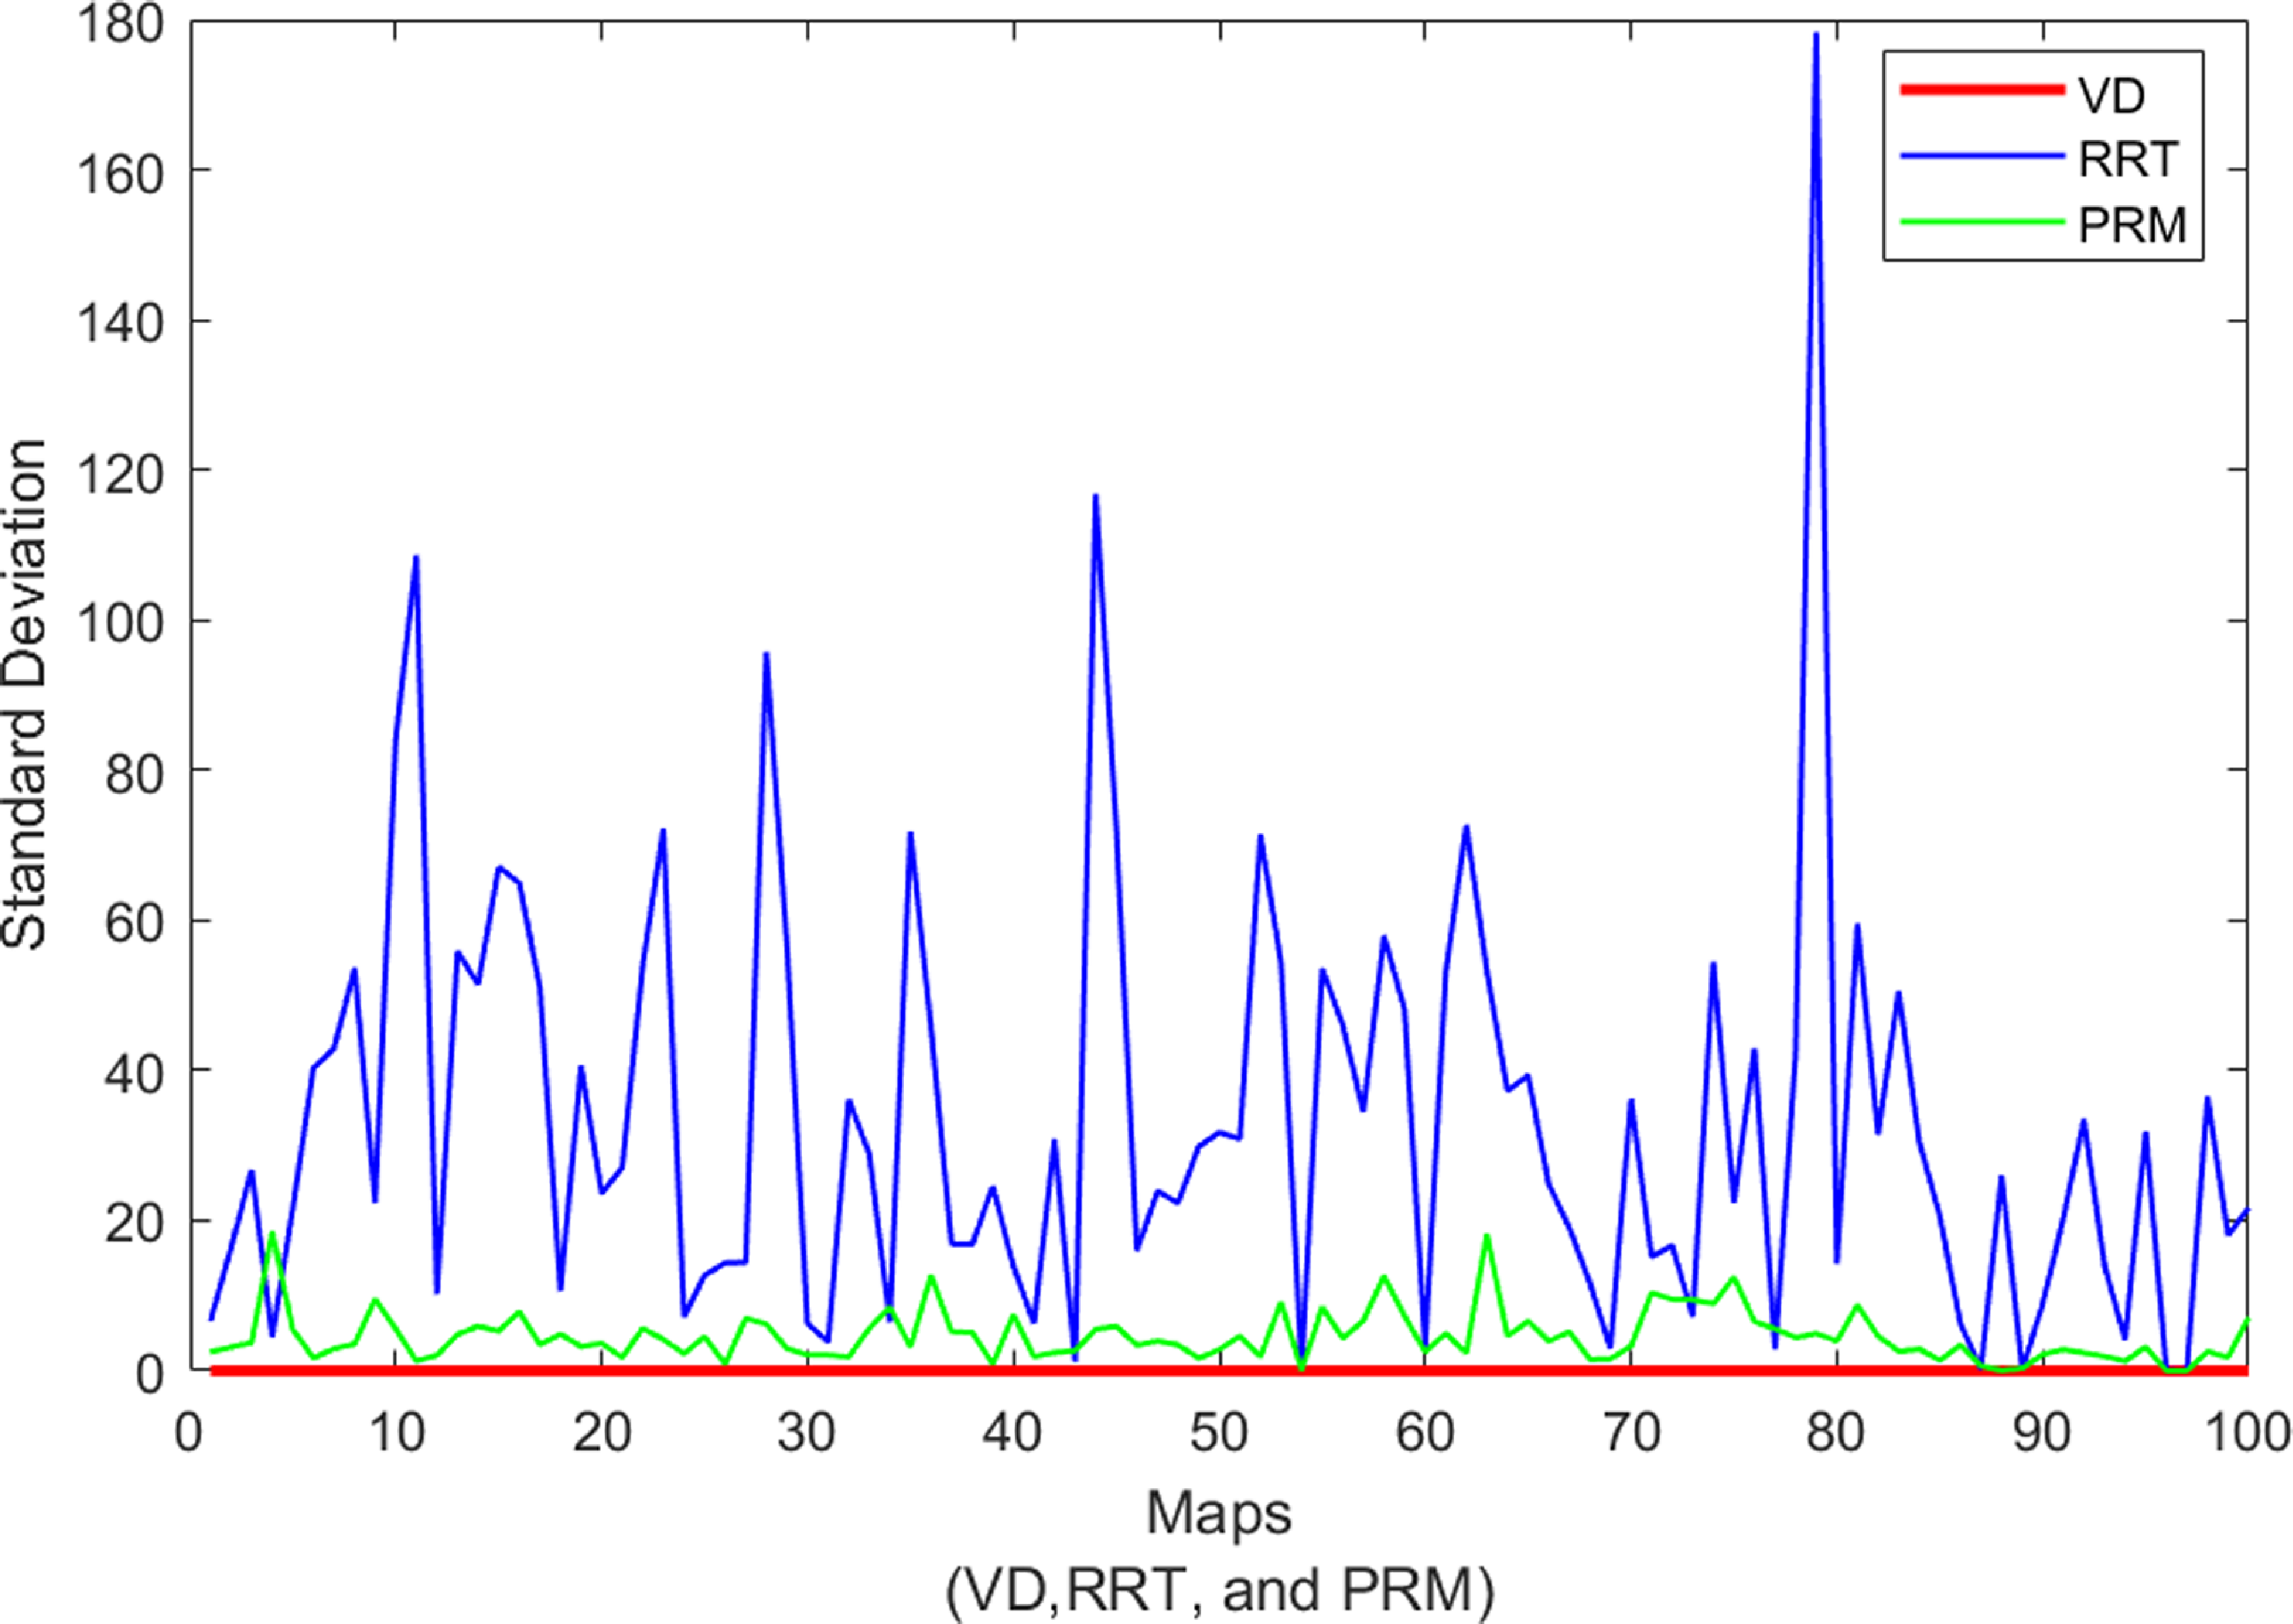
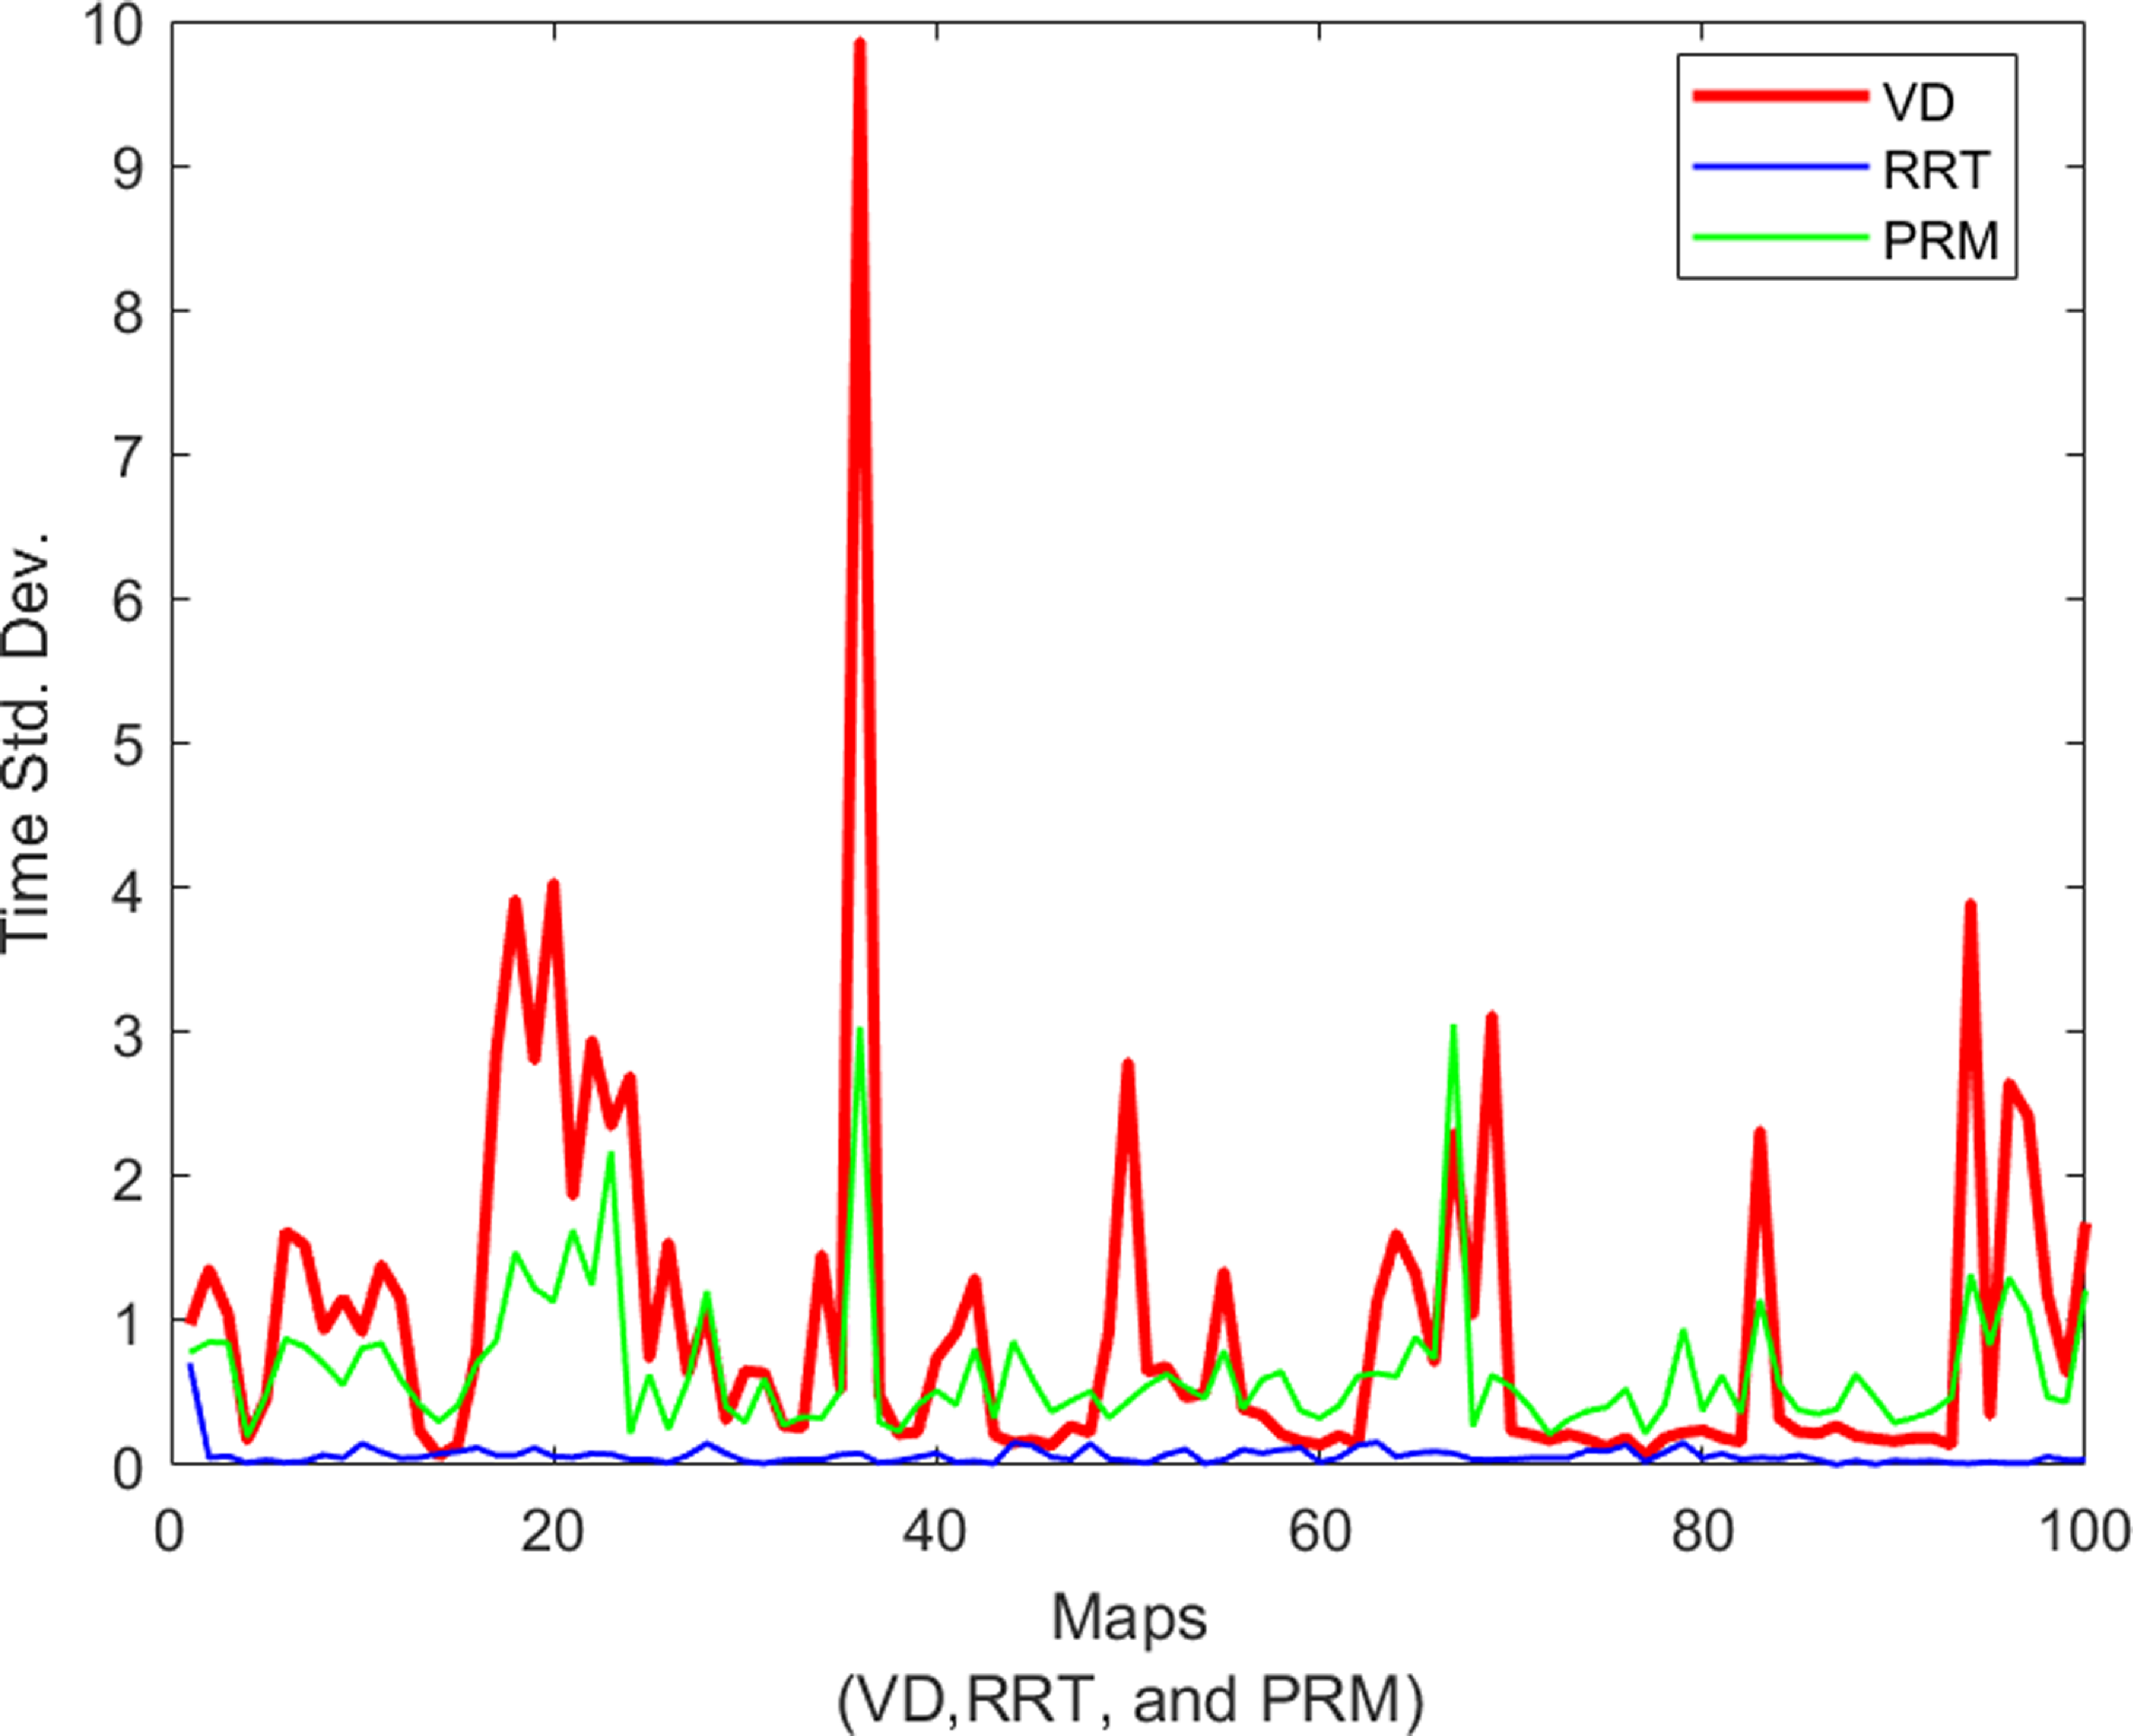
To determine the stability in path computation of VD, RRT, and PRM, the standard deviation of the computed path lengths and computation times for the ten trials for each of the 100 maps were computed for comparison. The standard deviation of the computed path lengths is demonstrated in Fig. 15. It can be observed that while the variation of path computation remains 0 for VD demonstrating its path computation consistency, RRT and PRM have varied values demonstrating their inconsistencies in path computation. The method with the highest instability on path length computation was RRT. In terms of variations in computation time, Fig. 16 demonstrates RRT to be the most consistent while VD is the most inconsistent. The standard deviation of path computation time demonstrated in Fig. 16 shows that VD obtained the highest computation time variation indicating time instability in path computation while RRT showed the highest stability in its computation time.
Path length computation variation of VD, RRT, and PRM.
Computation time variation of VD, RRT, and PRM.
In summary, Table II demonstrates PRM to be the most efficient RM planning method in terms of path length computation by recording the overall average value of 491.46 (32.2%). The worst performance among the three methods was RRT which recorded a path length of 531.59 (34.8%). RRT recorded the best overall average computation time of 0.15 (0.2%). However, VD obtained the worst overall average computation time of 56.9 (74.6%). Regarding path safety, VD recorded the best overall average p–o distance of 15.24 (70.75%) while RRT recorded the worst p–o distance of 1.40 (6.50%).
The results show that the PRM method consistently computes the shortest paths, which is crucial for applications where path efficiency is paramount, such as autonomous delivery robots navigating complex urban environments. However, the variation in PRM’s computation time suggests that it may not be suitable for time-sensitive operations where predictability and consistency are critical.
On the other hand, the RRT method, despite generating longer paths, excels in computation speed. This makes it highly suitable for applications requiring real-time decision-making, such as UAVs performing dynamic obstacle avoidance in rapidly changing environments. However, its lower safety margin indicates a potential risk in high-stakes scenarios, such as search and rescue operations in disaster-stricken areas, where collision avoidance is critical.
The VD method, which consistently produces the safest paths, demonstrates its utility in environments where safety is the primary concern. For instance, industrial robots operating in close proximity to humans could benefit from VD’s higher p–o distance, ensuring safer operations even in densely populated or cluttered spaces.
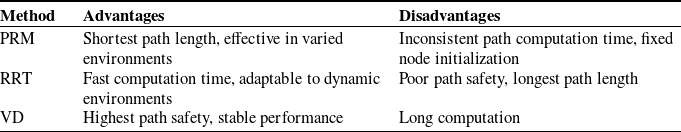
After analyzing the performance of PRM, RRT, and VD across different environments, Table III summarizes the key advantages and disadvantages of each method. The concise tradeoffs associated with PRM, RRT, and VD methods using the criteria; path length, computation time, path safety, stability, scalability, and best application are illustrated in Table IV. This comparative overview highlights the strengths and weaknesses of each approach, providing a clear perspective on their suitability for various robotic path-planning scenarios.
The advantages and disadvantages of PRM, RRT, and VD methods.
The concise tradeoffs associated with PRM, RRT, and VD path planning methods.
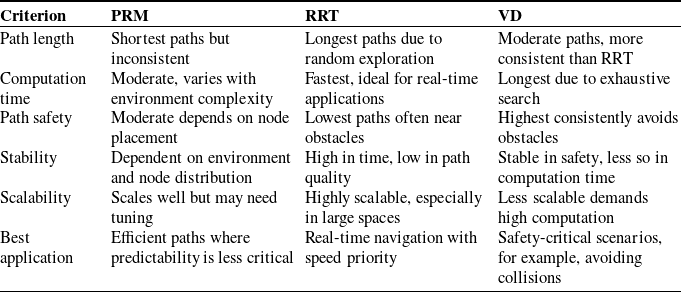
Table IV provides a concise overview of the tradeoffs associated with each path-planning method. As shown, PRM is most effective in scenarios where path length efficiency is crucial, though it requires careful consideration of node initialization to ensure consistent results. RRT is distinguished by its rapid computation time, making it ideal for real-time applications, albeit at the expense of path safety. VD, while slower, excels in ensuring path safety, making it the preferred choice for environments where avoiding collisions is the top priority. These insights are critical for selecting the most appropriate path-planning method based on the specific requirements of a given application.
The comparative analysis reveals that each path-planning method has distinct advantages and limitations depending on the application context. PRM is ideal for scenarios requiring efficient path optimization but may falter in time-critical tasks. RRT’s strength lies in its rapid computation, making it suitable for dynamic and unpredictable environments, though its path safety is a concern. VD provides the safest paths, which is crucial for applications where minimizing risk is essential, albeit at the cost of longer computation times. Using the VD method, the effects of systematic and nonsystematic noise of the robot would be minimal and would also avoid local minimal challenges. These findings highlight the importance of selecting the appropriate path-planning algorithm based on the specific needs of the application, whether it be speed, safety, or path efficiency.
The results of this comparative analysis align with recent advancements in the field of path planning, particularly regarding the tradeoffs between computation time, path optimality, and safety. For example, the findings on RRT’s rapid exploration but suboptimal paths are consistent with the work of Xiao et al. [Reference Xiao, Zhang, Wu, Han, Ding and Han12], who noted similar challenges with standard RRT and addressed them using heuristic optimizations. Similarly, the path safety observed in VD aligns with the improvements proposed by Ayawli et al. [Reference Ayawli, Appiah, Nti, Kyeremeh and Ayawli5], whose enhanced VD algorithm focused on increasing clearance from obstacles in densely cluttered environments. While the integration of machine learning techniques such as Learning from Demonstration (LfD) with PRM in refs. [Reference Meng, Li, Zhang and Sun15, Reference Wang, Li and Liang74] shows potential for improving adaptability in dynamic environments, our analysis of the baseline PRM method highlights its limitations in computational efficiency in such scenarios. These comparisons demonstrate the continued relevance of PRM, RRT, and VD in contemporary path-planning applications, while also suggesting areas where further enhancement is necessary.
7. Conclusions
This article presents a comprehensive comparative analysis of popular RM path-planning methods, including VD, RRT, and PRM, to evaluate their performance in global path planning. Key metrics considered in the evaluation include path length, computation time, path safety, and consistency of path computation.
The results demonstrate that PRM excels in computing the shortest path length, although its performance is hindered by the need for fixed node initialization and inconsistency in path length and computation time. RRT stands out as the fastest method for path computation, making it ideal for time-critical applications like mobile robots and UAVs, but it performs poorly in path safety. VD, despite having the longest computation time, is the most reliable for ensuring safe and consistent paths, making it suitable for applications where safety is paramount.
Each method has its limitations, underscoring the need for further improvements. Future research should focus on addressing PRM’s fixed node initialization challenge by developing adaptive node generation algorithms, enhancing RRT’s path safety and length without compromising speed, and reducing VD’s computation time to make it more competitive. If these challenges are resolved, VD could emerge as the most efficient method due to its superior path safety and consistency. This study provides practical guidance for selecting RM methods based on application-specific priorities in robotics path planning.
Author contributions
All authors contributed equally to this article.
Financial support
No financial support.
Conflicts of interest
The authors declare no conflicts of interest exist.
Ethical approval
Not applicable.


 Open access