
“In the long run, History is the story of information becoming aware of itself.”
Introduction
In the first part of this book, and particularly in Chapters 4–7, I have presented the basis of this book’s argument by presenting some of the salient characteristics of my approach, such as taking a long-term ex-ante perspective, learning from the past about the present for the future, using complex systems thinking, etc.
This chapter begins the presentation and discussion of the central theses of this book by drawing an outline of the long-term coevolution of human societies, focusing on the interaction between cognition, technology, social organization, and societies’ relation with the environment. It will be followed by six chapters that describe the dynamics involved at different spatiotemporal scales, and from different perspectives.
Two of the chapters in this middle section use the same perspective but elaborate it at different scales. The first of these, the current chapter, first outlines aspects of the very long-term coevolution of human cognition (from c. 2.5 MY BP to c. 0 CE) with its technology, societal organization, and environment. Chapter 15, which begins the third part of the book, is the continuation of this story, focusing on how the European world system emerged and evolved over the period from c. 1000 CE to the present. That chapter instantiates Wallerstein’s perspective on the “Modern World System,” (1974–1989) and emphasizes, at the European scale, the three major tipping points that have, each time, brought that system to the edge of disintegration, and the changes that, nevertheless, enabled it to continue its growth and evolution to encompass the global system of the present day.
Chapter 10 looks at eight centuries of socioenvironmental evolution in the western Netherlands in some detail and emphasizes the bootstrapping process that transformed the technology, the environment, the economics, the institutions, and the geography of that region. It sees that process in terms of the continued interaction between solutions and challenges. In that process, unanticipated consequences of earlier actions play a fundamental role.
In Chapter 9, I develop parts of a theoretical approach that enables me to consider these case studies as instances of transformations in the organization of information processing. This approach adopts Prigogine’s “dissipative flow structure” idea to explain how the interaction between flows of energy, matter, and information together structure more and more complex societies. In Chapter 11, that approach is then discussed on a more theoretical level by looking at information processing as a percolation phenomenon, in which the relationship between network activation and network size in terms of the average number of edges per node determine the main characteristics of the system.
Making information processing the explanatory core of my approach, and combining it with the Complex (Adaptive) Systems (CAS) perspective that emphasizes the need for the study of emergence, prompts me to look at inventions (Chapters 12 and 13) as shaped in the interaction between the material niche created by a technological system and the perception thereof by the agents in it. To conclude this middle section of the book, I then describe a model of the dynamic of transformations in the transition from village to town systems (Chapter 14).
Human Information Processing Is at the Core
The core of my argument is that societies are collective information-processing organizations, and that the evolution of human information processing is therefore at the center of the long-term evolution of human societies. Why have I chosen this approach, which is different from most other social science approaches to the long-term evolution of humanity (except for a few archaeologists such as Wright (Reference Wright1969) and Johnson (Reference Johnson, Renfrew, Rowlands and Segraves1982), and the economist Auerwald (Reference Auerswald2017)? The reason is that I am here looking for a general rather than a series of proximate explanations of changes in human behavior over long-term time. In other words, I am looking for a dynamic that can explain the emergence of human societal behavior under a wide range of circumstances, as well as explain how that behavior has changed.
It seems obvious that human responses to the environment, as well as human technology and human social and economic behavior are determined by human cognition and organization. (See Leroi-Gourhan’s fundamental treatment of these relationships: Reference Leroi-Gourhan1943, Reference Leroi-Gourhan1945, 1993). Our cognitive apparatus is the universal interface between each one of us and his/her environment, shaping how we perceive that environment and the nature of the actions we could potentially undertake. This apparatus is acquired through learning from an individual’s earliest days, and that learning is shaped by the sociocultural and natural environments in which it occurs. This in turn shapes the ways in which human beings behave. An individual uses the tools for thought and action he or she has acquired in order to ensure his or her survival, that is to ensure his or her continued subsistence and fulfill any other needs the individual might have. It is such use of tools for thought and action that I here call information processing – the gathering of information about an individual’s or group’s circumstances, and the organization and execution of actions appropriate to those circumstances.
But this is only part of the overall argument. Contemporary science is based on the assumption that there are three fundamental commodities in nature: matter, energy, and information. The first two of these are essential to the physical survival of individuals, whether human or nonhuman. Energy can be turned into matter and vice versa, and both are subject to what physicists call the law of conservation, which implies that they cannot be shared but can be transmitted. The person who hands over an object, or performs an energy-related task, is no longer in possession or control of the energy or matter that was used or handed over. Information and its processing determine how we acquire matter and energy, and what we do with it. But, contrary to the other two commodities, information can actually be shared: if I show someone how to do something, that does not mean that subsequently I no longer know how to do it. Tools for thought and action can be shared.
Taking the argument one step further, it is easy to see that human societies are dependent on the sharing of these tools for thought and action. The set of such tools that a group of people or a society share is what we commonly call their culture – their institutions, ways of doing things, knowledge about how to survive in different environments, artifacts, etc. Hence, human societies are collective information processing organizations.
The long-term evolution of human societies is therefore in the first instance the evolution of human information processing (or, as recently described by Auerswald (Reference Auerswald2017, 1) “the advancement of code”), and this chapter is meant to present the reader with a 3 million year overview of human history from that perspective, based on a series of papers I developed with Dwight Read (Reference Read2008, Reference Read, van der Leeuw, Renfrew and Malafouris2009, Reference Read, van der Leeuw, Coward, Hosfield and Wenban-Smith2015).
That history can be divided into two parts, the first of which is essentially biological (the growth of our brain and its cognitive capacity), whilst the second is essentially sociocultural (learning to exploit the full capacity of the evolved brain). Hence, this chapter is divided into two major sections, presenting respectively the biological evolution and the cultural evolution of cognition. The chapter concludes with a description of a simple model that can integrate the two.
It should be emphasized that each of these two sections is based on insights and knowledge from different disciplines and subdisciplines. The first part derives from arguments in evolutionary biology and evolutionary psychology, and therefore is based on an essentially life science epistemology and argument, and data deriving from ethology, paleoanthropology, and cognitive science. It attempts to reconstruct the evolution of the cognitive capabilities of the human species leading up to the present by comparing the capabilities of living primates, the fossil remains of – and the artifacts made by – hominins and modern humans at various stages of their development, and the physical and behavioral characteristics of modern human beings. This leads to a patchwork of data points and ideas that, in so far as it coherently holds together, finds its principal interest in the fact that it raises new questions and provides a basis for the arguments in the second part.
That second part, on the other hand, derives from arguments in archaeology and history, which are based on humanities – and social science epistemologies, and data and insights from archaeological, written historical, and modern observational sources. It attempts to outline the development of societal organization from small roaming gatherer-hunter-fisher bands, via villages, urban systems, and empires to the present-day global society, with a focus on the roles and forms that energy and information processing assume in that development. In combining these approaches, I am using the constraints and opportunities afforded by the bio-social nature of our species to explain observed phenomena in human history, and couching the explanation in systemic terms, which many archaeologists and most historians may initially have difficulty recognizing. My justification for doing this is the fact that most, if not all, transdisciplinary research must aim to constructively upset the practitioners of the disciplines involved in order to raise new questions and challenges for consideration by the communities practicing these disciplines as well as by others, and thus to stretch the envelope of our knowledge and insights. I hope that the direction in which I have attempted to stretch that envelope can make a contribution to the current sustainability debate.
The Biological Evolution of the Human Brain
The first part of the coevolution story concerns the physical development of the human brain and its capacity to deal with an increasing number of simultaneous information sources. The core concept that is most relevant here is the evolution of the short-term working memory (STWM), which determines how many different sources of information can be processed interactively in order to follow a particular train of thought or course of action.
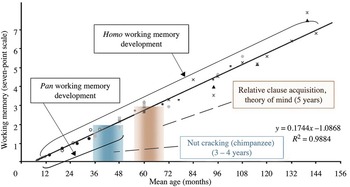
There are different ways to reconstruct this evolution (Read & van der Leeuw Reference Read and van der Leeuw2008, Reference Read, van der Leeuw, Renfrew and Malafouris2009, Reference Read, van der Leeuw, Coward, Hosfield and Wenban-Smith2015). Indirectly, it can be interpolated by comparing the STWM of chimpanzees (our closest common ancestor in the evolutionary tree that produced modern humans) to that of modern human STWM. In the act of cracking a nut, 75 percent of chimpanzees are able to combine three elements (an anvil, a nut, and a hammerstone), which leads us to think that the STWM of chimpanzees is 3 ± 1 (because 25 percent of them never master cracking nuts). Experiments with different ways of calculating the human capacity to combine information sources, on the other hand, seem to point to an STWM of 7 ± 2 for modern humans. This difference coincides nicely with the fact that chimpanzees reach adolescence after three to four years and modern humans at age thirteen to fourteen. We therefore assume that the growth of STWM occurs before adolescence in both species, and that the difference in the age at which adolescence is reached explains the difference in STWM capacity (Figure 8.1, see Read & van der Leeuw Reference Read and van der Leeuw2008, 1960).
The relationship between cognitive capacity and infant growth in Pan and in Homo sapiens sapiens. The trend line is projected from the regression of time-delay response (Diamond and Doar, Reference Diamond and Doar1989) on infant age. Data are rescaled for each dataset to make the trend line pass through the mean of that dataset. Working memory scaled to STWM = 7 at 144 months. The “fuzzy” vertical bars compare the age of nut cracking among chimpanzees with the age for relative clause acquisition and theory of mind conceptualization in humans. [Data on STWM are here represented by the following symbols: • = Imitation (Alp Reference Alp1994); + = time delay (Diamond & Doar, Reference Diamond and Doar1989); □ = number recall (Siegel & Ryan Reference Siegel and Ryan1989); x = total language score (Johnson et al., Reference Johnson, Fabian and Pascual-Leone1989); x = relative clauses (Corrêa 1995; ■ = count label, span (Carlson et al., Reference Carlson, Moses and Breton2002); o = 6 month retest (Alp 1989); ▲ = world recall (Siegel & Ryan Reference Siegel and Ryan1989); ● = spatial recall (Kemps et al., Reference Kemps, De Rammelaere and Desmet2000); ♦ = relative clauses (Kidd & Bavin Reference Kidd and Bavin2002); -, spatial working memory (Luciana & Nelson Reference Luciana and Nelson1998); ––– = linear time delay (Diamond & Doar Reference Diamond and Doar1989)].

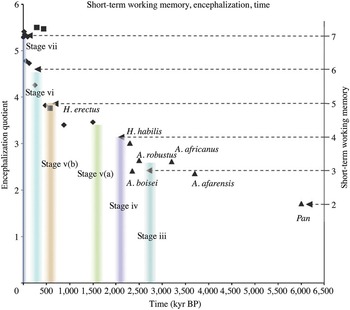
Another approach to corroborating the growth of STWM is by measuring encephalization – the evolution of the brain to body weight ratio of modern humans’ ancestors through time. The evolution of these ratios is based on the skeletal remains of each subspecies found and, as shown in Figure 8.2, corresponds nicely to the evolution of the STWM as has been established based on the way and extent to which these ancestors were able to shape stone tools (see Read & van der Leeuw Reference Read and van der Leeuw2008, 1964).
Graph of encephalization quotient (EQ) estimates based on hominid fossils and Pan (Chimpanzees). Early hominid fossils have been identified by taxon. Each data point is the mean for hominid fossils at that time period. Height of the “fuzzy” vertical bars is the hominid EQ corresponding to the data for the appearance of the stage represented by the fuzzy bar. Right vertical axis represents STWM.

Whereas both these approaches depend in fact on extrapolation and therefore do not provide any direct proof for our thesis, the study of the way and extent to which the various subspecies and variants preceding modern humans have been able to shape stone tools does provide some direct evidence, which is summarized in Table 8.1. This links the evolution of actions in stone toolmaking with the concepts that they define, the number of dimensions involved in manufacturing actions, and the STWM required, and refers to stone tools that provide examples of each stage. It shows how it took at least about 2 million years for the human STWM capacity of 7 ± 2 to develop, beginning with the Lokalalei artifacts and ending with the capacity to create blade tools.
| Stage | Concept | Action | Novelty | Dimensionality | Goal | Mode | STWM | Age BP | Example |
|---|---|---|---|---|---|---|---|---|---|
| 1 | Object attribute | Repetition possible | Functional attributes present; can be enhanced | 0 | Use object | 1 | |||
| 1A | Relationship between objects | Using more than one object to fulfill task | 0 | Combine objects | 2 | ||||
| 2 | Imposed attribute | Repetition possible | Object modified to fulfill task | 0 | Improve object | 2 | > 2.6 My | Lokalalei I | |
| 3 | Flaking | Repetition | Deliberate flaking without overall design | 0: incident angle < 90º | Shape flakes | 3 | 2.6 My | Lokalalei 2C | |
| 4 | Edge | Iteration: each flake controls the next | Debitage: flaking to create an edge on a core | 1: line of flakes creates partial boundary | Shape core | 1 | 4 | 2.0 My | Oldowan chopper |
| 5 | Closed curve | Iteration: each flake controls the next | Debitage: flaking to create an edge and a surface | 2: edges as generative elements of surfaces | Shape biface from edge | 2 | 4.5 | ||
| 5A | Surface | Iteration: each flake controls the next | Faconnage: flaking used to make a shape | 2: surfaces intended elements, organized in relation to one another | Shape bi-face from surfaces | 2 | 5 | 500 Ky | Biface handaxes |
| 6 | Surface | Algorithm: removal of a flake prepares the next | Control over location and angle to form surface | 2: Surface of flake brought under control, but shape constraint | Serial production of tools | 3 | 6 | 300 Ky | Levallois |
| 7 | Intersection of planes | Recursive application of algorithm | Prismatic blade technology: monotonous process | 3: flake removal retains core shape – no shape constraint | Serial production of tools | 4 | 7 | .50 Ky | Blade technologies |
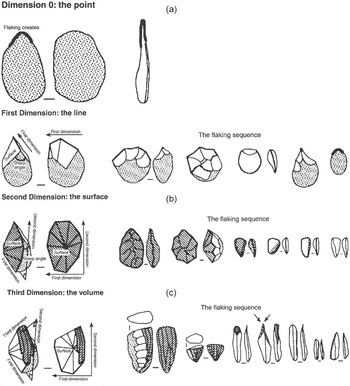
Mastering the three-dimensional conceptualization of stone tools (see Figure 8.3 a–d) (Pigeot Reference Pigeot1991; van der Leeuw Reference van der Leeuw, Murray and Anderson2000) is a good example of how this worked. The first tools are essentially pebbles from which at one point of the circumference (generally where the pebble is pointed) a chip has been removed to create a sharper edge (Figure 8.3a). Removing the flake requires three pieces of information: the future tool from which the flake is removed, the hammerstone with which this is done, and the need to maintain the two at an angle of less than 90 degrees at the time of the blow. Here, we therefore have to do with proof of STWM 3. In the next stage, this action (flaking) is repeated along the edge of the pebble. That requires control over the above three variables and a fourth one: the succession of the blows in a line. STWM is therefore 4 (Figure 8.3b). Next, the edge is closed: the toolmaker goes all around the pebble until the last flake is adjacent to the first. By itself, this is not a complete new stage, and we have called this STWM 4.5. But once the closed loop is conceived as defining a surface the knapper has two options: to define a surface by knapping an edge around it and then taking off the center, or to do the reverse – take off the center first and then refine the edge. The conceptual reversibility shows that the knapper has now integrated five dimensions, and his or her STWM is 5 (Figure 8.3c). The next stage again develops sequentiality, but in a more complex way.
For humans to attain the capacity to conceive of a three-dimensional object (a pebble or stone tool) in three dimensions takes around 2 million years. (a) Taking a flake off at the tip of the pebble is an action in 0 dimensions, and takes STWM 3; (b) successively taking off several adjacent flakes creates a (one-dimensional) line, and requires STWM 4; (c) stretching the line until it meets itself, defines a surface by drawing a line around it represents STWM 4.5; distinguishing between that line and the surface it encloses implies fully working in two dimensions, and requires STWM 5; (c) preparing two sides in order to remove the flakes from the third side testifies to a three-dimensional conceptualization of the pebble, and requires STWM 7.

In the so-called Levallois technique, making one artifact serves at the same time as preparation for the next, by dividing the pebble conceptually in two parts along its edge (STWM 6). And finally, the knapper works completely in three dimensions, preparing two surfaces and then taking flakes off the third. At this stage, STWM 7 (Figure 8.3d), for the first time the knappers are able not only to work a three-dimensional piece of stone, but also to conceive it as three-dimensional and adapt their working techniques accordingly, greatly reducing loss and increasing efficiency.
Closely observing the tools and other traces of human existence available in the Upper Paleolithic (around 50,000 BP) indicates that, after some 2 million years, people could (van der Leeuw Reference van der Leeuw, Murray and Anderson2000):
Conceive of feedback, feedforward and reversal in time (e.g., reverse an observed causal sequence, in order to conclude from the result what kind of action could achieve it);
Remember and represent sequences of actions, including control loops, and conceive of such sequences that could be inserted as alternatives in manufacturing sequences;
Create basic hierarchies, such as point–line–surface–volume, or hierarchies of size or inclusion;
Conceive of partonomies: relationships between a whole and its constituent parts (including reversing these relationships);
Maintain complex sequences of actions in the mind, such as between different stages of a production process;
Represent an object in a reduced set of dimensions (e.g., life-like cave paintings).
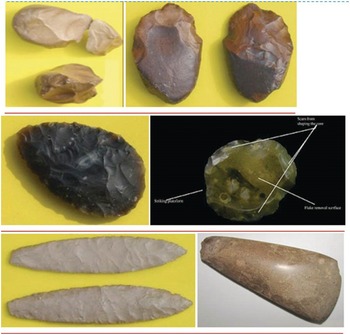
From left top to bottom, left to right, the image shows the technological advances in stone toolmaking, from an Oldowan chopper, via an Acheulean handaxe, a Mousterian handaxe, a Levallois tool, a Solutrean blade, to a Neolithic handaxe. The first four images refer to STWM stages below 7 ± 2, the last two have reached STWM 7 ± 2.

The Innovation Explosion: Mastering Matter and Learning How to Put the Brain to Use
After 50,000 BP,1 and especially after around 15,000 BP, we see a true innovation explosion occurring just about everywhere on Earth. The sheer multitude of inventions in every domain was truly astonishing, and has accelerated up to the present day. There is no reason to assume further developments of the human STWM, as the experimental evidence indicates that modern humans currently have the capacity to deal simultaneously with at most seven, eight, or occasionally nine dimensions or sources of information, while even a superficial scrutiny of modern technologies, languages, and other achievements shows the wide variety of things that can be achieved with a STWM of 7 ± 2. We would therefore argue that for this next phase, from about 50,000 BP to the present, the biological development of the mind no longer imposes any major constraints, and the emphasis is on acquiring the fullest possible range of techniques exploiting the STWM capacity available. This leads, among other things, to dramatic changes in the nature of the coevolution between human beings and their environments (e.g., Henshilwood & Marean Reference Henshilwood and Marean.2003; Hill et al. Reference Hill, Barton and Hurtado2009).
We can distinguish several phases in this process. In the first, the global toolkit explodes, but the gatherer-hunter-fisher mobile lifestyle remains the same. As part of the technological innovations emerging at the time, we see people moving into environments that were until then closed to them because they lacked the tools to survive there. At this time, for example, people began to move into higher latitudes with colder climates, into desert environments, etc., requiring completely novel technological and social adaptations. One way to explain this is to assume that people acted more and more collectively in solving various problems they were encountering, which would imply an increase in the importance, and the means, of communication as well as the pooling of some STWM capability.
In keeping with my fundamental tenet that information processing is crucial to such changes, I attribute the changes occurring from now on in human history to a new dynamic:
Problem-solving structures knowledge —> more knowledge increases the information processing capacity ––> that in turn allows the cognition of new problems ––> creates new knowledge —> knowledge creation involves more and more people ––> increases the size of the group involved and its degree of aggregation ––> creates more problems ––> increases need for problem-solving ––> problem-solving structures more knowledge … etc.
In that process, learning moved from the individual to the group because the dimensionality of the challenges to be met increased beyond the capability of individuals to deal with them. This involved the emergence of the above feedback loop (van der Leeuw Reference van der Leeuw, Costanza, Graumlich and Steffen2007).
As a result of these developments, about 35,000 years later, in what is called the Late Upper Paleolithic and Mesolithic in Europe, a number of other cognitive functions can be documented (van der Leeuw Reference van der Leeuw, Murray and Anderson2000). These include:
The use of completely new topologies (e.g., that of a solid around a void, such as in the case of a pot, hut, or basket).
The use of many new materials to make tools. Although it is difficult to prove that these materials were not used earlier, nevertheless one frequently observes from this time onwards objects in bone, as well as wood and other perishable materials.
The combination of different materials into one and the same tool (e.g., hafting small sharpened stone tools into a wooden or bone handle).
The inversion of manufacturing sequences from reductive to additive. In the former approach, which was current up to this time, making tools began with a big object such as a block of stone and smaller and smaller pieces were successively taken off it, so as to gain control over the shape. In the additive approach, tiny particles such as fibers are combined into larger, linear objects – threads – and then into a two-dimensional object (such as a woven cloth), which is finally given shape (by sewing) to fit a three-dimensional object (such as a human being). This implies the cognition of a wider range of scales, and has the advantage that corrections can take place during manufacture, which is much more difficult with reductive manufacturing sequences.
Stretching and chunking the sequence of actions kept in the mind: distinguishing between (complex) preparation stages (e.g., gathering of raw materials, preparing them, making roughouts, shaping, finishing) yet being able to link the logic of manufacture across these stages (adapting the selection of raw materials to all the later stages of the manufacturing process, etc.).
The resulting invention of new tools characterizes the period until about 13,000 BP (in East Asia) or 10,000 BP (in the Near East), while for the time being the dominant subsistence mode was still characterized by a multi-resource strategy of harvesting various foodstuffs in the environment, but now including a wider range facilitated by the new toolkit, and moving around over increasingly limited distances so as to always stay below the carrying capacity of the environment. In effect, people lacked the know-how to interact with their environment; they could only react to it. They did not invest in the environment (by means of activities such as building long-term shelter, clearing the forest and plowing the soil, or investing in a herd), and therefore, though everyone dealt daily with uncontrollable change, risk was not really important, as risk is incurred when effort or (human, natural, or financial) capital is expended by humans to achieve something, and that is then destroyed (see van der Leeuw Reference van der Leeuw, Murray and Anderson2000).
The First Villages, Agriculture and Herding
In the next stage, c. 13,000–10,000 BP, the continued innovation explosion changed the lifestyle of many human populations. The acceleration was so overwhelming that in a few thousand years it transformed the way of life of most humans on earth: rather than live in small groups that roamed around, people concentrated their activities in smaller territories, invented different subsistence strategies, and in some cases literally settled down in small villages (van der Leeuw, Reference van der Leeuw, Murray and Anderson2000, Reference van der Leeuw, Costanza, Graumlich and Steffen2007, and references therein). As the information-processing capacity of individual humans did not increase, I join many other colleagues in ascribing these developments to an ever-closer interaction between more and more people, generating a greater density of information-processing capacity by improving communication and collaboration. Together, these advances greatly increased the number of ways at people’s disposal to tackle the challenges posed by their environment. That rapidly increased our species’ capability to invent and innovate in many different domains, allowed it to meet more and more complex challenges in shorter and shorter timeframes, and thus substantively increased humans’ adaptive capacity. But the other side of the coin was that these solutions, by engaging more people in the manipulation of a material world that they now partly controlled, ultimately led to new, often unexpected, societal challenges that required the mobilization of great effort to be overcome in due time.
As part of this process, a number of fundamental changes occurred. First of all, the relationship between societies and their environments became reciprocal: the terrestrial environment from now on not only impacted on society, but society impacted on the terrestrial environment as well. As a result, sedentary societies tried to control environmental risk by intervening in the environment, notably by (1) narrowing and optimizing the range of their dependencies on the environment (by cultivating a single or a few crops), (2) simplifying or even homogenizing (parts of) their environments (by locally removing the natural diversity of the environment and replacing it by a single, or a few, species of plants), and (3) spatial and technical diversification and specialization (by allocating specific spaces to specific activities and developing specific tools for these activities) (see van der Leeuw Reference van der Leeuw, Murray and Anderson2000).
The new subsistence techniques introduced, including horticulture, agriculture and herding, narrowed the range of things people depended on for their subsistence. In the process, certain areas of the environment were cleared and dedicated to the specific purpose of growing certain kinds of plants. This required investment in certain parts of the environment, dedicating those areas to specific activities and delaying the rewards of the investment activities. Clearing the forest and sowing resulted only months later in a harvest, for example. The resulting increase of investment in the environment in turn anchored different communities more and more closely to the territory in which they chose to live. People now built permanent dwellings using the new topology (upside down containers), and devised many other new kinds of tools and toolmaking technologies facilitating the new subsistence strategies practicable in their environment (e.g., the digging stick or the ard, the domestication of animals, baskets and pottery for storage, skin bags or pottery and hot rocks for boiling). Without speaking of (full-time) specialists, certain people in a village began to dedicate more time, for example, to weaving or pottery-making, and provided the products of their work to others in exchange for some of the things they produced. Differences in resource availability and technological know-how thus led to economic diversification and, in order to provide everyone with the things they needed, exchange and trade.
The symbiosis that thus emerged between different landscapes and the lifeways invented and constructed by human groups to deal with them narrowed the spectrum of adaptive options open to the individual societies concerned, and drove each of them to devise more and more complex solutions, with more and more unanticipated consequences that then needed to be dealt with in turn.
Collective information processing among larger and larger groups enabled the continued accumulation of knowledge, and thus the growth of information-processing capacity, which in turn enabled a concomitant increase in matter, energy, and information flows through the society, and thus the growth of interactive groups.
But this growth was at all times constrained by the amount of information that could be communicated among the members of the group, as miscommunication led to misunderstandings and conflicts, and impaired the cohesion of the communities involved. Communication stress in my opinion provided the incentive for improvements in the means of communication (for example by inventing new, more precise, concepts to communicate ideas with, cf. van der Leeuw Reference van der Leeuw and van der Leeuw1981, Reference van der Leeuw, van Bakel, Hagesteijn and van de Velde1986), and a reduction in the search time needed to find those people one needed to communicate with (by adopting a sedentary grouped lifestyle).
Finally, as the social system diversified, and people became more dependent on each other, the risk spectrum increasingly included social stresses caused by misunderstandings and miscommunications. Handling risks therefore came to rely increasingly on social skills, and the collective invention and acceptance of organizational and other tools to maintain societal cohesion.
The First Towns
From this point in the story, I will no longer try to point out any novel cognitive operations emerging as human societies grew in size and spread over the surface of the earth because there are simply too many. Instead, I will focus on how the feedback system that drove societal growth as well as the conquest of the material world through innovation posed some major challenges. Overcoming these ultimately enabled the emergence of true world systems such as the colonial empires of the early modern period (Wallerstein Reference Wallerstein1974; van der Leeuw Reference van der Leeuw, Costanza, Graumlich and Steffen2007) and the current globalized world (see Chapter 15).
Throughout the third stage, from around 7,000 BP until very recently, communication remained a major constraint because more and more people were interactive with each other when the size of settlements involved grew to what we now call towns. This stage therefore sees the emergence of a host of new innovations, such as writing, recurrent markets, administration, laws, bureaucracies, and specialized full-time communities dedicated to specific activities (priests, scribes, soldiers, different kinds of craftsmen and women, etc.). Many of these had either to do with improving communication (such as writing and scribes), social regulation (administration, bureaucracies, laws), the harnessing of more and more resources (mining), or the exchange of objects and materials in part over larger and larger distances (markets, long-distance traders, innovations in transportation). As larger groups aggregated, the territory upon which they depended for their material and energetic needs (their footprint to use a modern term) expanded very rapidly, and the effort required to transport foodstuffs and other materials did so too, as did the probability of inter-settlement or intergroup conflict.
This caused the emergence of energy as a major constraint that limited the evolution of urban societies for millennia to come. To deal with this constraint, an interesting core–periphery dynamic emerged to exploit that ever-growing footprint – the exchange of organization against energy. Around towns, dynamic flow structures emerged, in which organizational capacity was generated in the town and then spread around it, extending the town’s control over a wider and wider territory. In return, the increasing quantities of energy collected in that growing territory (foodstuffs and other natural resources) provided for the ever-increasing population that kept the flow structure going by ensuring steady innovation (creation of new technology, institutions, and information-processing capacity). These flow structures became the bootstrapping drivers that created larger and larger agglomerations of people and the territories to go with them.
In their emergence, these flow structures always involved longer distance trade, which brought to each individual town products from a network of other towns and regions. This was an inherent aspect of the fact that in order to keep larger populations interested in aligning their values with each other, such systems had to provide new values, which were no longer uniquely based on the immediate needs of the population (food and other ubiquitous materials and activities) (van der Leeuw Reference van der Leeuw, Chase and Scarborough2014).
What enabled the urban populations to keep innovating, and thus to enlarge their value space (see Chapters 15–16) and thereby maintain their flow structures, was – again – the growing capacity of more and more interacting minds to identify new needs, novel functions, and new categories, as well as new artifacts and challenges. Writing contributed to that capability by enabling information to cross both time and space, and therefore to help individuals to be informed by the efforts and insights of others.
Underpinning that dynamic is one that we know well in the modern world. Invention is usually (and certainly in prehistoric and early historic times) something that involves either individuals or very small teams. Hence, in its early stages an invention is related to a relatively small number of cognitive dimensions – it solves challenges that few people are aware of (see Chapter 12 for a detailed description of the process). When inventions become the focus of attention of a larger number of people, such as in towns, they are simultaneously understood in many more dimensions (people see more uses for them, ways to slightly improve them, etc.), and this in certain cases triggers an invention cascade – a string of further inventions, including new artifacts, new uses of existing artifacts, new forms of behavior, and new social and institutional organization. In this process, clearly, towns and cities are more successful than rural areas because of the greater number of interactive individuals in such aggregations. This is corroborated by the fact that when applying allometric scaling of urban systems of different sizes against metrics of their population, energy flow, and innovation capacity, population scales linearly, energy flow sublinearly, and innovation capacity superlinearly (Bettencourt et al. Reference Bettencourt, Lobo, Helbing, Kühnert and West2007). I will return to this in Chapter 16.
The First Empires
The above flow structures continued to grow (albeit with ups and downs) until, after several millennia (from about 2500 BC in the Old World, and about 500 BC in the New), they were able to cover very large areas, such as the prehistoric and early historic empires (The Chinese, Achaemenid, Macedonian, and Roman Empires, for example, in the eastern hemisphere, the Maya and Inca Empires in the western one, and later the European colonial empires all around the globe), which concentrated large numbers of people at their center (and, in order to feed them, gathered treasure, raw materials, crops, and many other commodities from their hinterlands). Throughout this period communication and energy remained the main constraints, impacting on cities, states, and empires.
Thus we see advances in the harnessing of human energy (including slavery), wind power (for transportation in sailing vessels and for driving windmills), falling water (for mills), etc., but also in the facilitation of communication, (e.g., long distance Roman and Inca “highways” over land, the sextant and compass to facilitate navigation on the seas). This enabled societies to create and concentrate wealth that served to defray the costs of managing societal tensions: maintaining an administration and an army, creating a judiciary or other institutions to arbitrate in conflicts, etc.
The Roman Republic and Empire
To illustrate how this long-term perspective works, I will briefly look at the history of the Roman Empire (van der Leeuw & de Vries Reference van der Leeuw, de Vries, de Vries and Goudsblom2002) in these terms.
The expansion of the Roman republic was enabled by the fact that, for centuries, Greco-Roman culture had spread northward from the Mediterranean. It had, in effect, structured the societies in (modern) Italy, France, Spain, and elsewhere, by means of practical inventions (such as money, new crops, the plough), the building of infrastructure (towns, roads, aqueducts), the creation of administrative institutions, and the collection of wealth. Profiting from this situation, the Romans instituted a flow structure that aligned the organization of the periphery of their sphere of influence with their own culture, creating the channels for an inward flow of matter and energy into the core of the empire. To achieve this, they used an ingenious policy of stepwise assimilation and organization of indigenous political entities based in cities (Meyer Reference Meyer1964), making them subservient to the uninterrupted growth of flows of wealth, raw materials, foodstuffs, and slaves from the conquered territories to Rome. Linking cities across the empire, this flow structure functioned for as long as there were more preorganized societies to be conquered and wealth to be gathered (Tainter Reference Tainter1988). But once the Roman armies came to the Rhine, the Danube, and the Sahara, that was no longer the case and conquests stopped. Then, to keep the flow structure going, a phase of major internal investment in the conquered territories followed, expanding the infrastructure (highways, villas, industries) within the Empire in order to harness more resources for Rome.
As large territories were thus “Romanized,” and technologies and institutional solutions spread, they became less dependent on Rome’s innovations for their wealth, and thus expected less and less from the Empire. In about CE 250 the innovation/value-creation system at the core stalled. The information gradient between the center and the periphery leveled out, and so did the value gradient between the periphery and the center.2 This made it more and more difficult to ensure that the necessary flows of matter and energy reached the core of the empire.
As the relative cost (in terms of a military and administrative establishment) grew, the Roman emperors had more and more difficulty in maintaining their grip on the very large areas concerned. By the fifth century CE, the coherence of the western part of the Empire had decreased to such an extent that it ceased, for all intents and purposes, to exist. People began to focus on themselves, their neighborhoods, and their local environment rather than on maintaining the central system. Other, smaller, structures emerged at its edges, and there the same process of extension from a core began anew, at a much smaller scale, and based on different kinds of information processing. In other words, the alignment between different parts of the overall system broke down, and new alignments emerged that were only relevant locally.
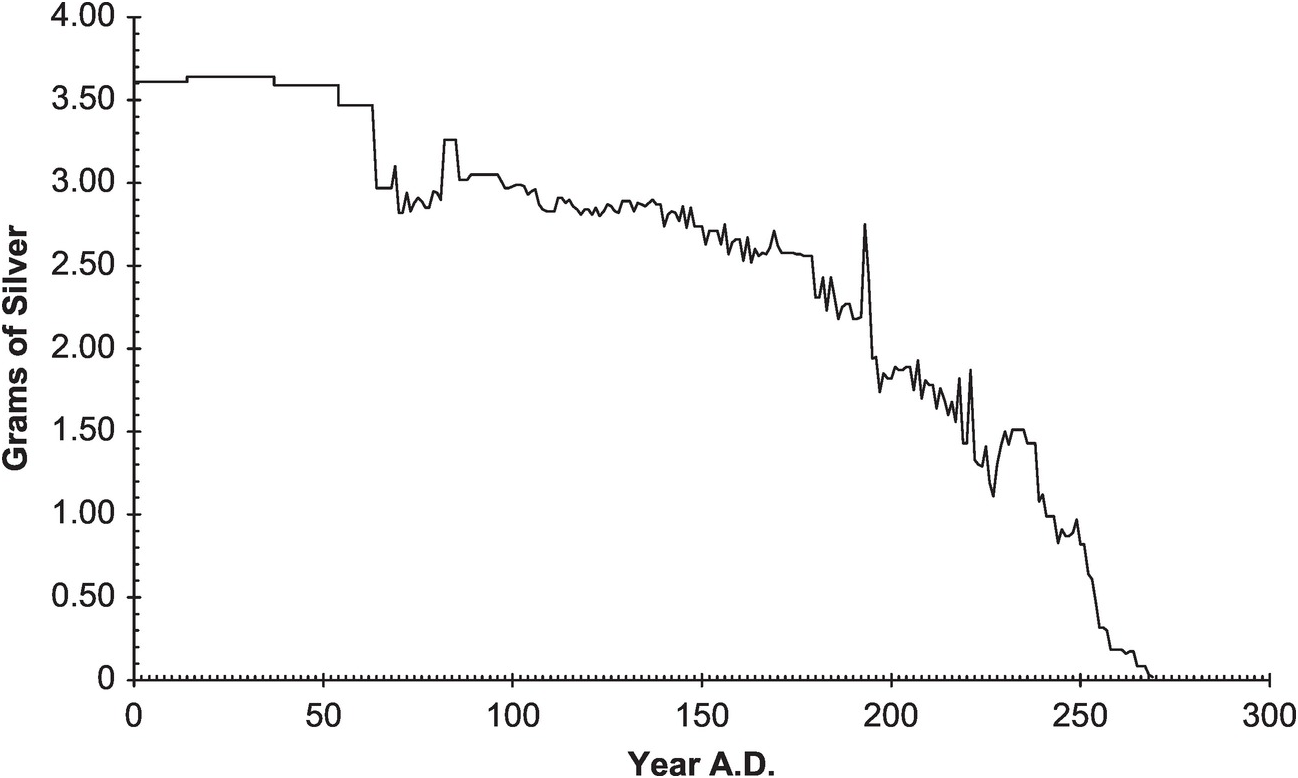
To explain the collapse of the Roman Empire, Tainter (Reference Tainter1988) thus argues convincingly that only by laying its hands on the treasure accumulated outside its borders in the centuries before the Roman conquest was Rome able to maintain the large armies and bureaucracies necessary to keep its Empire. As soon as there was no more treasure to be gained by conquering, the empire was thrown back upon recurrent (in essence solar) energy, which was insufficient to maintain the flow structure. To deal with the difficulties this caused, the emperors progressively debased their currency until it was worth hardly anything (Figure 8.5).
Graph showing the debasement of Roman coinage following the end of the Roman imperial conquests in around CE 100.
On the one hand, this reduced the advantages of being part of the Empire, and on the other it reduced the control of the emperors over its wide territory, so that people increasingly fell back on smaller, regional or local, networks. Disaffection or even dispersion of the population followed the cessation of the flows that generated the coherent socioeconomic structure of an empire in the first place.
As the alignment of large concentrations of people broke down, innovation also ceased, and in the ensuing period the knowledge base of many different technologies was lost. In Chapter 15, I will pick up the story at this point again, and show how from a very low base Europe managed to reemerge as a major political and economic force that conquered many parts of the overseas world.
Conclusion
We have seen how, initially, human information processing was limited by the biological capacity of the brain to deal simultaneously with different sources of information. Once those limits had been pushed back to enable the human STWM to deal with 7 ± 2 such sources, innovation took off in many different ways. Increasingly, information processing became a collective process, bringing more and more people together in groups dealing with their own specific environment, enabling humans to spread to areas with very inhospitable environments, such as the Arctic. As the number of tools for thought and action multiplied, humans became more and more dependent on communication and interaction. To reduce search times in communication, stable patterns of mobility and settlements were introduced, enabled by techniques to invest and exploit the environment for purposes of more or less stable group subsistence. As the interactive groups, and the interaction within them, grew to the size of small towns, this ultimately led to energy and resources becoming important constraints, and societal dynamics growing in importance, requiring an adaptation of communication patterns and the structure of social networks. The resulting flow structure dynamic exchanged spreading information processing capacity for increases in inward flows of the energy and resources needed for survival. As the footprints of such flow structure cells grew, they ultimately federated large territories into empires. But as the regulatory overhead of empires grew, these found themselves limited in size by energy constraints. This ultimately led to their decomposition, back into smaller units.
Of course, an overview over millennia such as this one only intends to show a general trend, the increase of the dissipative information flow capacity of human information processing over time, and simplifies an enormously complex process. This chapter is not intended as proof of the approach taken in this book, but rather as an illustration to stimulate thinking about how this approach might have played out, and to prompt new research questions that this approach raises.
In Chapters 9 and 11 I will develop the dynamics of this long-term process from a theoretical perspective. In Chapter 10 I will again present a case study, but this time in much more detail, arguing how this coevolutionary process affects all aspects of society. Then, in Chapter 15, I will try to show how European history from the Roman Empire to the present illustrates this process in more detail, and how, from about 1750, the energy constraint was lifted owing to the appropriation of fossil energy, so that information processing – again – became the main constraint.


 Open access