Refine search
Actions for selected content:
48214 results in Zoology
Nutritional implications of Australians switching from traditional animal-source foods to plant-based ‘alternatives’: an exploratory study
-
- Journal:
- Proceedings of the Nutrition Society / Volume 82 / Issue OCE2 / 2023
- Published online by Cambridge University Press:
- 22 March 2023, E99
-
- Article
-
- You have access
- HTML
- Export citation
Strengths-based chronic disease health education in Wangkatjungka Community
-
- Journal:
- Proceedings of the Nutrition Society / Volume 82 / Issue OCE2 / 2023
- Published online by Cambridge University Press:
- 22 March 2023, E152
-
- Article
-
- You have access
- HTML
- Export citation
Advancing dietary assessment in human gut microbiome research: review and gap analysis
-
- Journal:
- Proceedings of the Nutrition Society / Volume 82 / Issue OCE2 / 2023
- Published online by Cambridge University Press:
- 22 March 2023, E202
-
- Article
-
- You have access
- HTML
- Export citation
The range and nutrient composition of alternative protein products sold in Australian supermarkets between 2014 and 2021
-
- Journal:
- Proceedings of the Nutrition Society / Volume 82 / Issue OCE2 / 2023
- Published online by Cambridge University Press:
- 22 March 2023, E58
-
- Article
-
- You have access
- HTML
- Export citation
Opportunities for long day care services to increase resistant starch in 2–3-year-olds
-
- Journal:
- Proceedings of the Nutrition Society / Volume 82 / Issue OCE2 / 2023
- Published online by Cambridge University Press:
- 22 March 2023, E193
-
- Article
-
- You have access
- HTML
- Export citation
The association between plant and animal protein intake and disability free survival in community-dwelling older adults: the results of the ASPREE Longitudinal Study of Older Persons (ALSOP)
-
- Journal:
- Proceedings of the Nutrition Society / Volume 82 / Issue OCE2 / 2023
- Published online by Cambridge University Press:
- 22 March 2023, E120
-
- Article
-
- You have access
- HTML
- Export citation
Review of the nutrient criteria for a healthy food and drink policy in healthcare settings—the ‘juggling act’ of nutrition science and feasibility
-
- Journal:
- Proceedings of the Nutrition Society / Volume 82 / Issue OCE2 / 2023
- Published online by Cambridge University Press:
- 22 March 2023, E168
-
- Article
-
- You have access
- HTML
- Export citation
Superfood or superficial? Analysing the accuracy of superfood health claims on social media
-
- Journal:
- Proceedings of the Nutrition Society / Volume 82 / Issue OCE2 / 2023
- Published online by Cambridge University Press:
- 22 March 2023, E197
-
- Article
-
- You have access
- HTML
- Export citation
Australian grown sugarcane derived polyphenol has the potential to reduce enteric methane emission from second cross lambs
-
- Journal:
- Proceedings of the Nutrition Society / Volume 82 / Issue OCE2 / 2023
- Published online by Cambridge University Press:
- 22 March 2023, E122
-
- Article
-
- You have access
- HTML
- Export citation
Defining the satiety characteristics of plant-based mince in comparison to standard beef mince
-
- Journal:
- Proceedings of the Nutrition Society / Volume 82 / Issue OCE2 / 2023
- Published online by Cambridge University Press:
- 22 March 2023, E173
-
- Article
-
- You have access
- HTML
- Export citation
Marketing strategies used for alternative protein products sold in Australian supermarkets in 2014, 2017 and 2021
-
- Journal:
- Proceedings of the Nutrition Society / Volume 82 / Issue OCE2 / 2023
- Published online by Cambridge University Press:
- 22 March 2023, E98
-
- Article
-
- You have access
- HTML
- Export citation
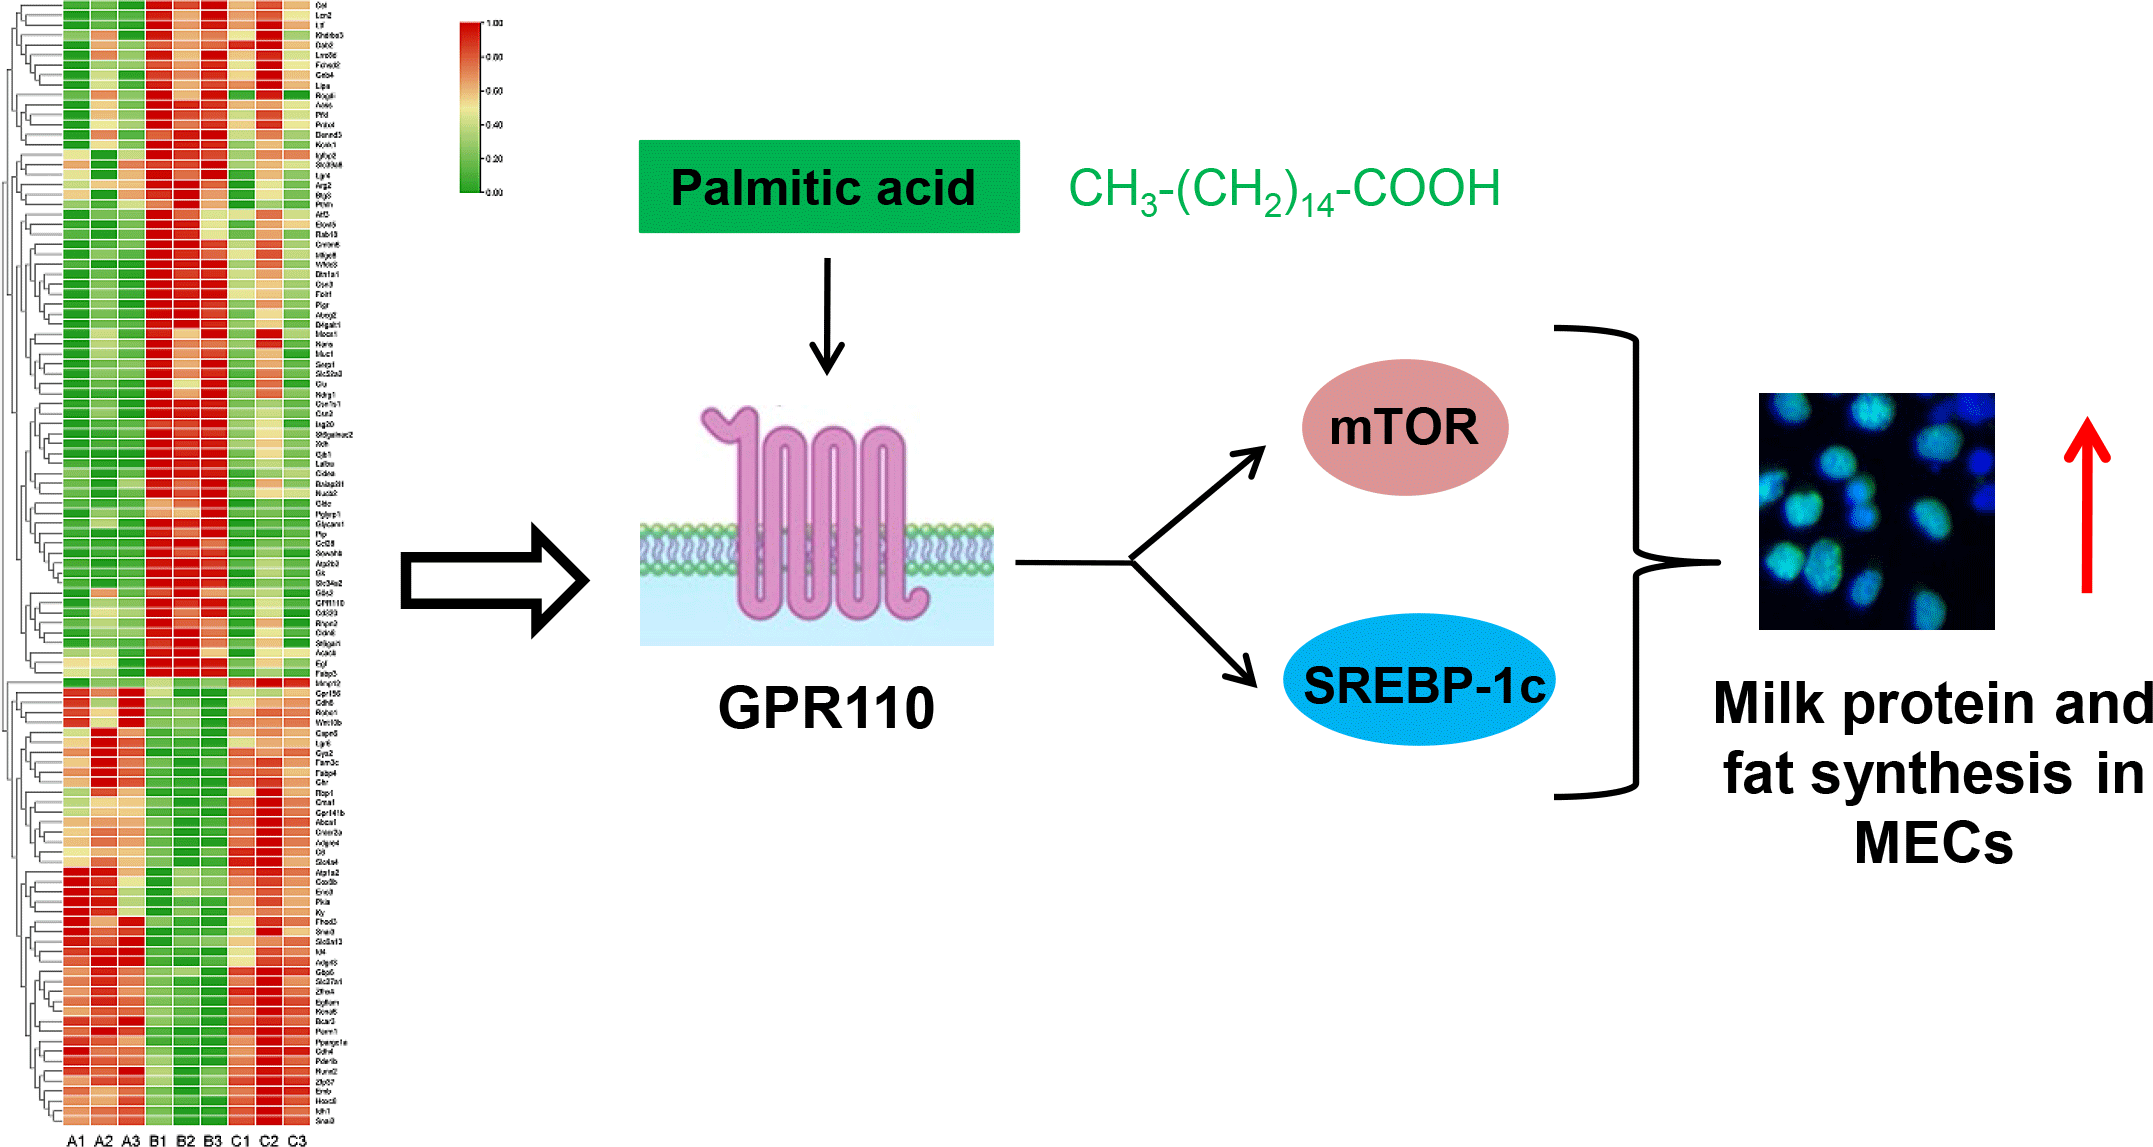
Comparative transcriptomic analysis of mammary gland tissues reveals the critical role of GPR110 in palmitic acid-stimulated milk protein and fat synthesis
-
- Journal:
- British Journal of Nutrition / Volume 130 / Issue 10 / 28 November 2023
- Published online by Cambridge University Press:
- 22 March 2023, pp. 1665-1677
- Print publication:
- 28 November 2023
-
- Article
-
- You have access
- HTML
- Export citation
Ten years on: a review and strengthening of a mandatory healthy food and drink policy in healthcare settings in Western Australia
-
- Journal:
- Proceedings of the Nutrition Society / Volume 82 / Issue OCE2 / 2023
- Published online by Cambridge University Press:
- 22 March 2023, E165
-
- Article
-
- You have access
- HTML
- Export citation
Dietary intake of breastfeeding Khmer mothers in Cambodia are highly inadequate: novel image- and voice-based dietary assessment.
-
- Journal:
- Proceedings of the Nutrition Society / Volume 82 / Issue OCE2 / 2023
- Published online by Cambridge University Press:
- 22 March 2023, E111
-
- Article
-
- You have access
- HTML
- Export citation
Effects of energy restriction with and without almonds on weight and cardiometabolic risk factors
-
- Journal:
- Proceedings of the Nutrition Society / Volume 82 / Issue OCE2 / 2023
- Published online by Cambridge University Press:
- 22 March 2023, E69
-
- Article
-
- You have access
- HTML
- Export citation
A content analysis of supermarket communications against a healthy and sustainable diet framework
-
- Journal:
- Proceedings of the Nutrition Society / Volume 82 / Issue OCE2 / 2023
- Published online by Cambridge University Press:
- 22 March 2023, E90
-
- Article
-
- You have access
- HTML
- Export citation
Effects of 3 months of energy restriction on serum lipids and lipoprotein responses in overweight adults
-
- Journal:
- Proceedings of the Nutrition Society / Volume 82 / Issue OCE2 / 2023
- Published online by Cambridge University Press:
- 22 March 2023, E109
-
- Article
-
- You have access
- HTML
- Export citation
Collecting diet quality and food security data with remote Aboriginal and Torres Strait Islander communities: results and reflections from a remote food security project
-
- Journal:
- Proceedings of the Nutrition Society / Volume 82 / Issue OCE2 / 2023
- Published online by Cambridge University Press:
- 22 March 2023, E63
-
- Article
-
- You have access
- HTML
- Export citation
The neglected potential of red and processed meat replacement: simulation modelling and systematic review
-
- Journal:
- Proceedings of the Nutrition Society / Volume 82 / Issue OCE2 / 2023
- Published online by Cambridge University Press:
- 22 March 2023, E68
-
- Article
-
- You have access
- HTML
- Export citation
Are sports foods all they shake up to be? Understanding the formulated supplementary sports foods retail environment: A product audit of availability, nutrient profile, and claims
-
- Journal:
- Proceedings of the Nutrition Society / Volume 82 / Issue OCE2 / 2023
- Published online by Cambridge University Press:
- 22 March 2023, E156
-
- Article
-
- You have access
- HTML
- Export citation
