Refine search
Actions for selected content:
48214 results in Zoology
Association of Dietary Approaches to Stop Hypertension (DASH) diet with self-reported sleep-disordered breathing (SDB): a cross-sectional study from China
-
- Journal:
- British Journal of Nutrition / Volume 130 / Issue 10 / 28 November 2023
- Published online by Cambridge University Press:
- 31 March 2023, pp. 1806-1813
- Print publication:
- 28 November 2023
-
- Article
-
- You have access
- HTML
- Export citation
Food banks: Understanding their role in the food insecure population in the UK
- Part of
-
- Journal:
- Proceedings of the Nutrition Society / Volume 82 / Issue 3 / September 2023
- Published online by Cambridge University Press:
- 31 March 2023, pp. 253-263
-
- Article
-
- You have access
- Open access
- HTML
- Export citation
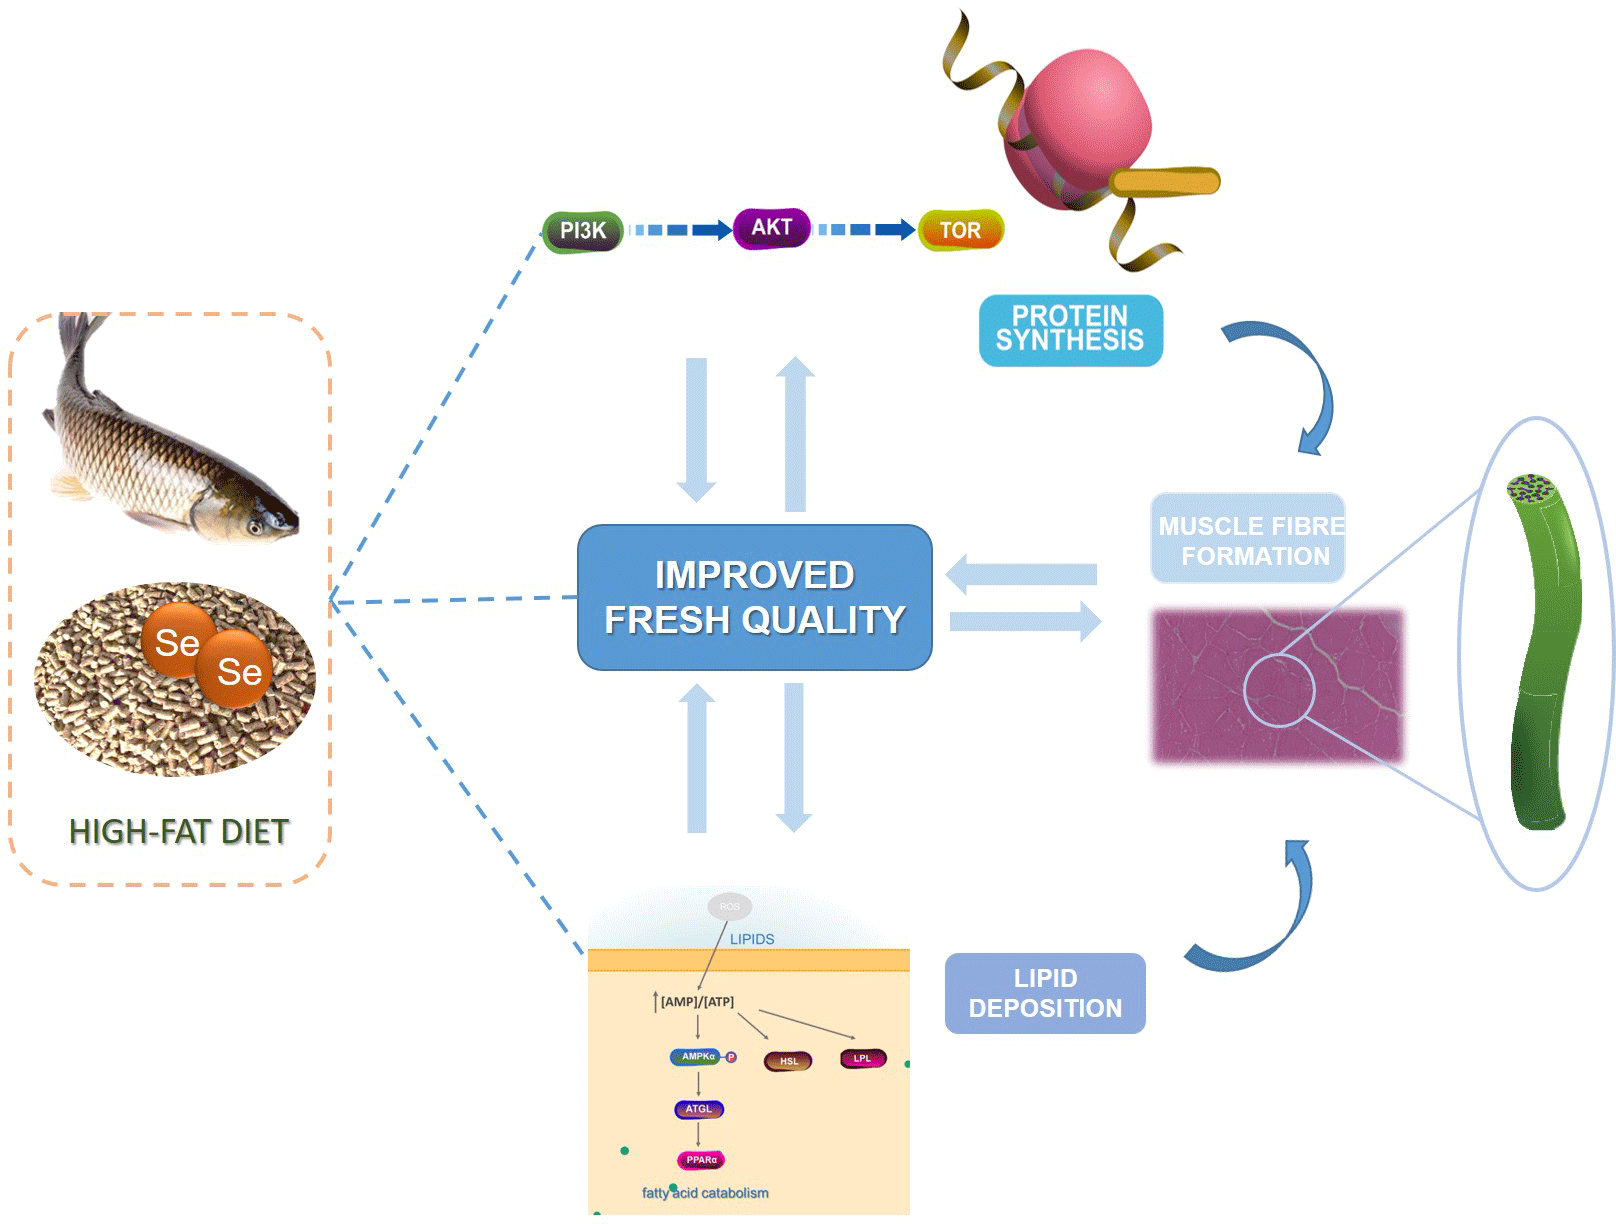
Dietary nano-Se supplementation regulates lipid deposition, protein synthesis and muscle fibre formation in grass carp fed with high-fat diet
-
- Journal:
- British Journal of Nutrition / Volume 130 / Issue 10 / 28 November 2023
- Published online by Cambridge University Press:
- 31 March 2023, pp. 1678-1688
- Print publication:
- 28 November 2023
-
- Article
-
- You have access
- HTML
- Export citation
An online exploratory survey of Australian athletes’ and exercisers’ use of and attitudes towards ultra-processed sports foods
-
- Journal:
- British Journal of Nutrition / Volume 130 / Issue 9 / 14 November 2023
- Published online by Cambridge University Press:
- 31 March 2023, pp. 1625-1636
- Print publication:
- 14 November 2023
-
- Article
-
- You have access
- Open access
- HTML
- Export citation
Sustainable-psycho-nutritional intervention programme for a sustainable diet (the ‘NutriSOS’ study) and its effects on eating behaviour, diet quality, nutritional status, physical activity, metabolic biomarkers, gut microbiota and water and carbon footprints in Mexican population: study protocol of an mHealth randomised controlled trial
-
- Journal:
- British Journal of Nutrition / Volume 130 / Issue 10 / 28 November 2023
- Published online by Cambridge University Press:
- 30 March 2023, pp. 1823-1838
- Print publication:
- 28 November 2023
-
- Article
-
- You have access
- Open access
- HTML
- Export citation
The use of sentiment and emotion analysis and data science to assess the language of nutrition-, food- and cooking-related content on social media: a systematic scoping review
-
- Journal:
- Nutrition Research Reviews / Volume 37 / Issue 1 / June 2024
- Published online by Cambridge University Press:
- 30 March 2023, pp. 43-78
-
- Article
-
- You have access
- Open access
- HTML
- Export citation
Kefir as a therapeutic agent in clinical research: a scoping review
-
- Journal:
- Nutrition Research Reviews / Volume 37 / Issue 1 / June 2024
- Published online by Cambridge University Press:
- 30 March 2023, pp. 79-95
-
- Article
- Export citation
Do 20-minute neighbourhoods moderate associations between work and commute hours with food consumption?
-
- Journal:
- Public Health Nutrition / Volume 26 / Issue 10 / October 2023
- Published online by Cambridge University Press:
- 29 March 2023, pp. 2026-2035
-
- Article
-
- You have access
- Open access
- HTML
- Export citation
PHN List of Reviewers
-
- Journal:
- Public Health Nutrition / Volume 26 / Issue 4 / April 2023
- Published online by Cambridge University Press:
- 27 March 2023, pp. 905-910
-
- Article
-
- You have access
- Open access
- HTML
- Export citation
PHN volume 26 issue 4 Cover and Back matter
-
- Journal:
- Public Health Nutrition / Volume 26 / Issue 4 / April 2023
- Published online by Cambridge University Press:
- 27 March 2023, p. b1
-
- Article
-
- You have access
- Open access
- Export citation
Association between time-restricted eating and non-alcoholic fatty liver disease in a nationwide cross-sectional study
-
- Journal:
- British Journal of Nutrition / Volume 130 / Issue 10 / 28 November 2023
- Published online by Cambridge University Press:
- 27 March 2023, pp. 1787-1794
- Print publication:
- 28 November 2023
-
- Article
-
- You have access
- HTML
- Export citation
Optimal complementary feeding practices of children aged 6–23 months in three agro-ecological rural districts of Jimma zones of southwest Ethiopia
-
- Journal:
- Journal of Nutritional Science / Volume 12 / 2023
- Published online by Cambridge University Press:
- 27 March 2023, e40
-
- Article
-
- You have access
- Open access
- HTML
- Export citation
Efficacy of dietary vitamin D3 and 25(OH)D3 on reproductive capacities, growth performance, immunity, and bone development in pigs – CORRIGENDUM
-
- Journal:
- British Journal of Nutrition / Volume 130 / Issue 10 / 28 November 2023
- Published online by Cambridge University Press:
- 27 March 2023, p. 1839
- Print publication:
- 28 November 2023
-
- Article
-
- You have access
- Open access
- HTML
- Export citation
PHN volume 26 issue 4 Cover and Front matter
-
- Journal:
- Public Health Nutrition / Volume 26 / Issue 4 / April 2023
- Published online by Cambridge University Press:
- 27 March 2023, pp. f1-f3
-
- Article
-
- You have access
- Open access
- Export citation
The suitability of dietary recommendations suggested by artificial intelligence technology via a novel personalised nutrition mobile application – CORRIGENDUM
-
- Journal:
- Proceedings of the Nutrition Society / Volume 82 / Issue 4 / December 2023
- Published online by Cambridge University Press:
- 24 March 2023, p. 489
-
- Article
-
- You have access
- HTML
- Export citation
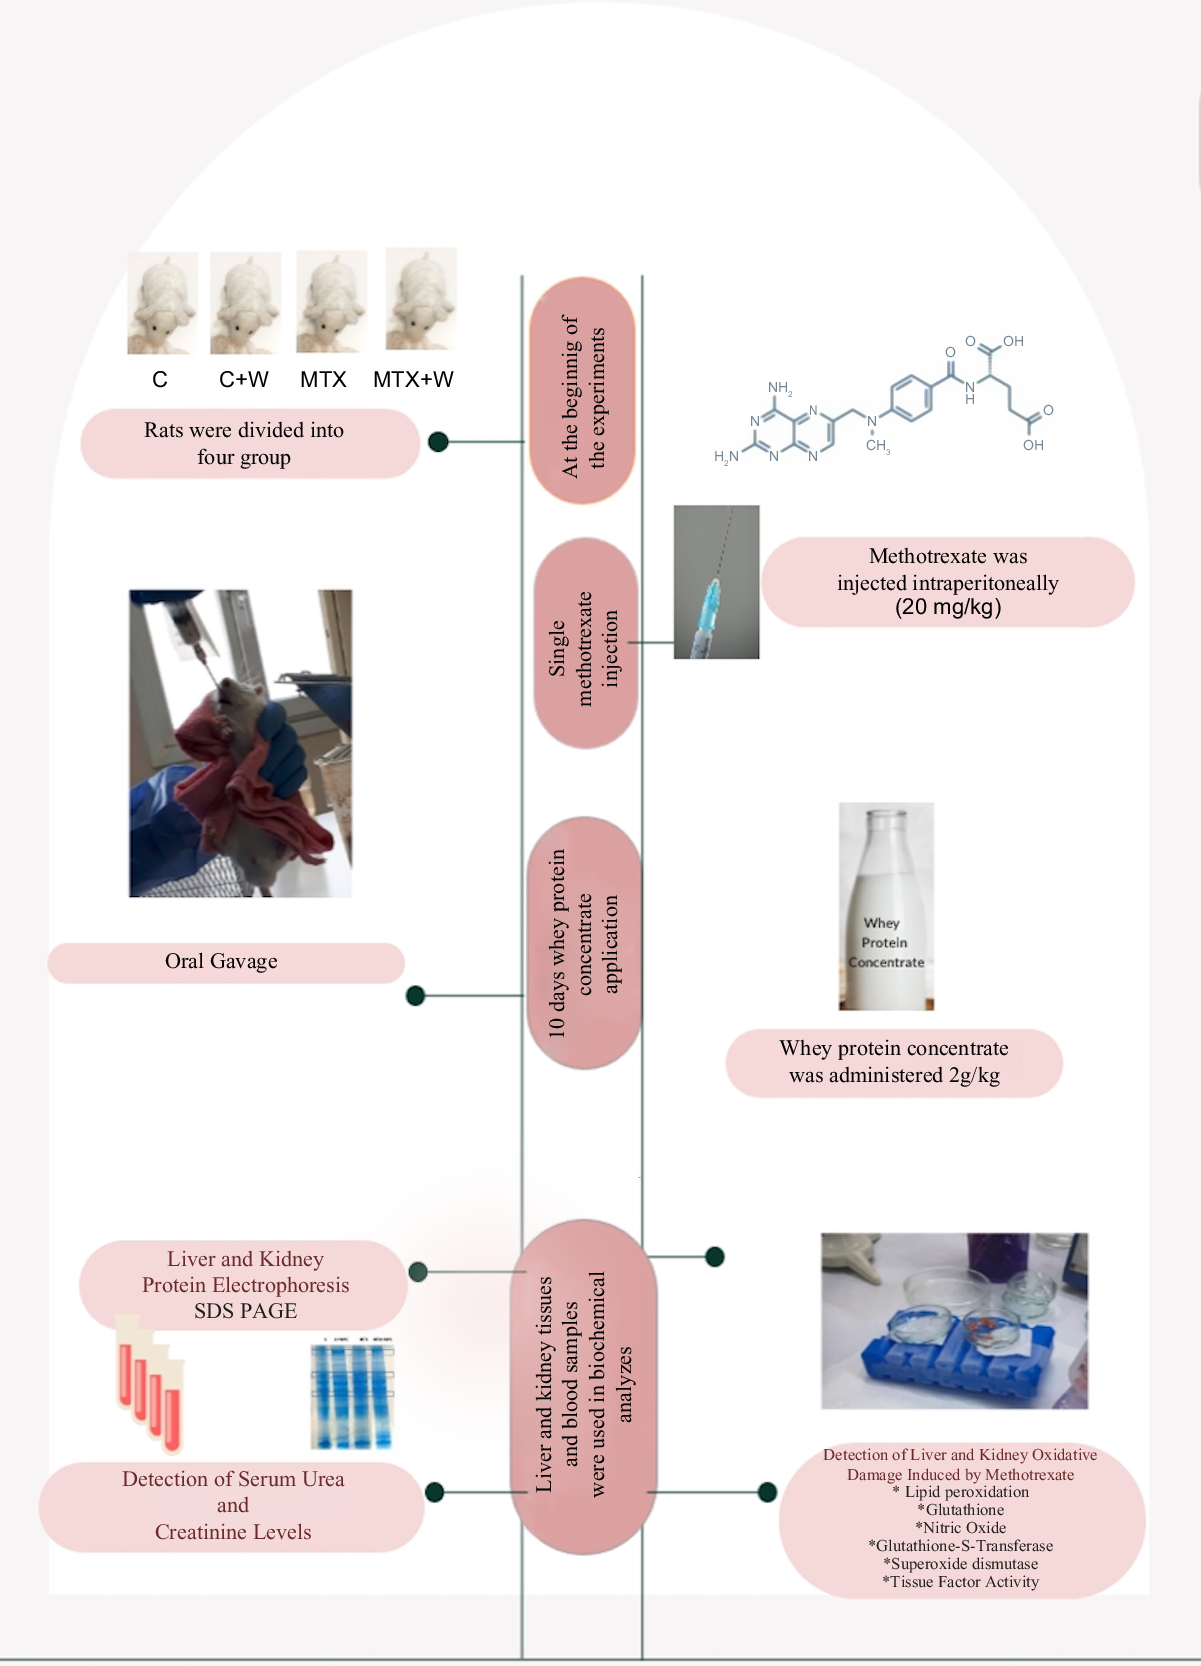
Whey protein concentrate ameliorates the methotrexate-induced liver and kidney damage
-
- Journal:
- British Journal of Nutrition / Volume 130 / Issue 10 / 28 November 2023
- Published online by Cambridge University Press:
- 23 March 2023, pp. 1704-1711
- Print publication:
- 28 November 2023
-
- Article
-
- You have access
- HTML
- Export citation
“I always buy the purple ones if I see them”: a qualitative study of the perceived socioecological factors influencing anthocyanin-rich food consumption for cognitive health in older adults
-
- Journal:
- Proceedings of the Nutrition Society / Volume 82 / Issue OCE2 / 2023
- Published online by Cambridge University Press:
- 22 March 2023, E77
-
- Article
-
- You have access
- HTML
- Export citation
Live More Abundantly: A community-based lifestyle education program addressing selected chronic disease risk factors in Fiji—a pilot study
-
- Journal:
- Proceedings of the Nutrition Society / Volume 82 / Issue OCE2 / 2023
- Published online by Cambridge University Press:
- 22 March 2023, E79
-
- Article
-
- You have access
- HTML
- Export citation
Relationships between the gut microbiota, dietary intake and metabolic disease manifested as non-alcoholic fatty liver disease
-
- Journal:
- Proceedings of the Nutrition Society / Volume 82 / Issue OCE2 / 2023
- Published online by Cambridge University Press:
- 22 March 2023, E175
-
- Article
-
- You have access
- HTML
- Export citation
Variation in subcutaneous fat composition of beef according to region of production
-
- Journal:
- Proceedings of the Nutrition Society / Volume 82 / Issue OCE2 / 2023
- Published online by Cambridge University Press:
- 22 March 2023, E117
-
- Article
-
- You have access
- HTML
- Export citation
