To save content items to your account,
please confirm that you agree to abide by our usage policies.
If this is the first time you use this feature, you will be asked to authorise Cambridge Core to connect with your account.
Find out more about saving content to .
To save content items to your Kindle, first ensure no-reply@cambridge.org
is added to your Approved Personal Document E-mail List under your Personal Document Settings
on the Manage Your Content and Devices page of your Amazon account. Then enter the ‘name’ part
of your Kindle email address below.
Find out more about saving to your Kindle.
Note you can select to save to either the @free.kindle.com or @kindle.com variations.
‘@free.kindle.com’ emails are free but can only be saved to your device when it is connected to wi-fi.
‘@kindle.com’ emails can be delivered even when you are not connected to wi-fi, but note that service fees apply.
The structure of a series of lanthanide iron cobalt perovskite oxides, R(Fe0.5Co0.5)O3 (R = Pr, Nd, Sm, Eu, and Gd), have been investigated. The space group of these compounds was confirmed to be orthorhombic Pnma (No. 62), Z = 4. From Pr to Gd, the lattice parameter a varies from 5.466 35(13) Å to 5.507 10(13) Å, b from 7.7018(2) to 7.561 75(13) Å, c from 5.443 38(10) to 5.292 00(8) Å, and unit-cell volume V from 229.170(9) Å3 to 220.376(9) Å3, respectively. While the trend of V follows the trend of the lanthanide contraction, the lattice parameter “a” increases as the ionic radius r(R3+) decreases. X-ray diffraction (XRD) and transmission electron microscopy confirm that Fe and Co are disordered over the octahedral sites. The structure distortion of these compounds is evidenced in the tilt angles θ, ϕ, and ω, which represent rotations of an octahedron about the pseudocubic perovskite [110]p, [001]p, and [111]p axes. All three tilt angles increase across the lanthanide series (for R = Pr to R = Gd: θ increases from 12.3° to 15.2°, ϕ from 7.5° to 15.8°, and ω from 14.4° to 21.7°), indicating a greater octahedral distortion as r(R3+) decreases. The bond valence sum for the sixfold (Fe/Co) site and the eightfold R site of R(Fe0.5Co0.5)O3 reveal no significant bond strain. Density Functional Theory calculations for Pr(Fe0.5Co0.5)O3 support the disorder of Fe and Co and suggest that this compound to be a narrow band gap semiconductor. XRD patterns of the R(Fe0.5Co0.5)O3 samples were submitted to the Powder Diffraction File.
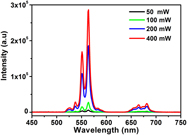
The pure and Er3+-modified binary Pb(Zn1/3Nb2/3)O3–9PbTiO3 (PZN–9PT) single crystals were grown by using the flux method. The phase structure of the as-grown single crystals at room temperature was confirmed by the x-ray diffraction analysis. The effect of Er3+ addition on the electrical properties and upconversion luminescence of PZN–9PT was investigated. The rhombohedral to tetragonal phase transition temperature and the Curie temperature of the Er3+-modified PZN–9PT single crystals were 370 and 451 K, respectively. The coercive field EC at room temperature was evidently higher by 11.6 kV/cm than that of the PZN–9PT single crystals (EC, ∼3.5 kV/cm). Furthermore, the green and red upconversion emission bands were obtained under the 980 nm excitation, which are related to (2H11/2, 4S3/2) → 4I15/2 and 4F9/2 → 4I15/2 transitions.
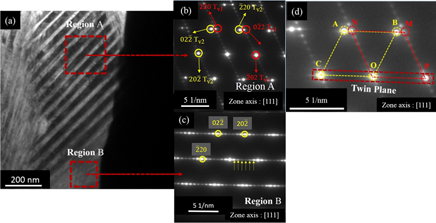
Highly oriented Ni–Mn–Ga thin film with multiple variants and room temperature orthorhombic martensite structure were prepared on a single crystalline Al2O3$\left( {11\bar 20} \right)$ substrate by DC magnetron sputtering. X-ray diffraction and rocking curve measurements reveal the film as (202)7M oriented with an excellent crystal quality (Δω = 1.8°). Spot-like pole figures indicate that the Ni–Mn–Ga film grows with a strong in-plane preferred orientation. An in-depth analysis of the measured pole figure reveals the presence of a retained austenite phase in the film. Two phase transformations, MS ∼345 K and TC ∼385 K, are observed and are attributed to first order structural transformation from cubic to orthorhombic, and second order phase transformation from ferromagnetic to paramagnetic, respectively. In situ high temperature x-ray diffraction measurements provide a clear indication of a thermally-induced martensite ↔ austenite reversible structural phase transformation in the film. The presence of martensite plates with seven modulated orthorhombic structure and adaptive nano-twins are some of the important microscopic features observed in the film with transmission electron microscopy investigations.
In this paper we have reported analysis on activation energy and humidity sensing studies of Cu-doped ZnO thin films. Thin Films of undoped and Cu-doped ZnO nanomaterials were prepared. Undoped and Cu-doped ZnO thin films annealed at 600 °C showed the best results with sensitivity of 20.63 MΩ/%RH and 39.14 MΩ/%RH respectively in the 15–95% RH range. Low value of activation energy indicated that this sensing element had low operating temperature and could be used at room temperature. Other parameters like response time, recovery time, hysteresis, and aging effects were also studied. The crystallite size for the sensing element of pure ZnO annealed at 600 °C calculated from Scherrer's formula is in the 24–38 nm range. For the sensing element of 7% Cu doped ZnO the range of crystallite size is 25–41 nm. The average grain size as measured from SEM micrograph for 7% Cu doped ZnO and pure ZnO sensing elements were 36 and 42 nm, respectively.
The structure changes and lithium intercalation properties in the surface region of Li4Ti5O12 were investigated using epitaxial Li4Ti5O12(111) film model electrodes. The discharge–charge measurements, which were conducted with 1 mol/dm3 LiPF6-containing propylene carbonate, revealed that a 23.8 nm-thick film exhibited a small capacity of 115 mA h/g compared to the theoretical value of 175 mA h/g. In situ neutron reflectometry and ex situ x-ray diffractometry and reflectometry indicated that an irreversible phase change had occurred in the 10-nm surface region of Li4Ti5O12 during the initial reaction processes. The level of deterioration of the surface structure was significantly reduced by decreasing the LiPF6 concentration; in addition, side reactions of the cell components with the electrolyte species, and their products, may be associated with the deterioration of the Li4Ti5O12 surface. The surface reactions have a significant impact on the capacity of lithium intercalation in nano-sized Li4Ti5O12.
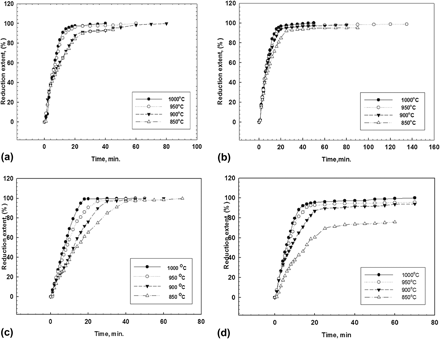
Heavy tungsten alloys with the following compositions 98W2Fe, 93W7Fe, and 95W2Fe3Ni were successfully prepared through gaseous reduction of metal oxide mixtures in the temperature range of 850–1000 °C. Reduced samples were subjected to sintering processes in reducing atmosphere (Ar/4% H2) at different temperatures (1200–1300 °C) and dwell times (30, 90 min). The prepared alloys together with the sintered samples were characterized by x-ray diffraction (XRD), field emission scanning electron microscope (FESEM), and optical microscope. The microhardness of the sintered samples was measured and correlated to sintering temperature and dwell time. The presence of iron oxide decreases the reducibility of WO3 whereas the presence of NiO increases the reducibility of both iron oxide and tungsten oxide. With the increase of sintering temperature and dwell time, porosity of samples decreases forming dense structure which is coupled with the increase of hardness particularly for 95W2Fe3Ni alloy.
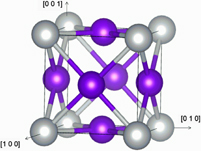
Pt based alloys are one of the most important intermetallic materials with widespread applications. In this article, we have investigated the structural stability, elastic modulus, and electronic structure of Pt3M alloys by applying first-principles density functional theory, where M atom covers alkali metals, alkali earth metals, main group metals, and transition metals. The calculated elastic constants and elastic modulus demonstrated that all Pt3M alloys studied in this article are mechanically stable, possess good stability against shear and behavior in a ductile manner. The equilibrium lattice constant and the binding energy are also calculated to reveal the law with the change of elements. In addition, the LDOS and deformation charge density is presented to reveal the structural stability and the extent of charge transfer between Pt and M atoms. These results help us to better understand the physical properties of Pt3M alloys and also indicate that Pt3M alloys provide an extensive selection of intermetallic materials.
The structure and origin of twin defects have been studied over the past half-century. Recently, there has been renewed interest in investigating the mechanisms by which twin defects facilitate the growth of bulk and nanoscale systems. This article reviews our understanding and experimental advances to unravel the complex role that twin defects play during crystal growth. The following topics are addressed: growth promotion at single and multiple, parallel and antiparallel twin boundaries; the role of {100} and {111} solid–liquid interfaces during crystallization; the application of realtime imaging to the study of crystal growth in the presence of twin defects; and suggested future research needed to shed light on the driving forces for twin-related phenomena. By providing a broad survey of the existing literature on twin-assisted crystal growth, we anticipate that our review will aid researchers in deciphering various growth forms that arise in materials processing applications.
X-ray powder diffraction data, unit-cell parameters, and space group for deferasirox, C21H15N3O4, are reported [a = 8.821(7) Å, b = 26.798(2) Å, c = 7.540(4) Å, α = 90°, β = 94.655(2)°, γ = 90°, unit-cell volume V = 1776.7(3) Å3, Z = 4, ρcal = 1.396 g cm−3, and space group P21/c]. All measured lines were indexed and are consistent with the P21/c space group. No detectable impurity was observed.
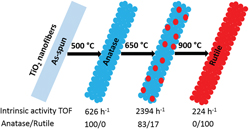
TiO2 nanofibers (TNFs) with different anatase/rutile phase ratios were fabricated using electrospinning technique followed by the annealing at different temperatures. The effect of annealing temperatures on their morphology, structural, and optical properties and photocatalytic activity was investigated. The photocatalytic performance of TNFs was evaluated by degradation of methyl orange (MO) in aqueous solution under the irradiation of simulated solar light. Annealing temperature significantly influenced photocatalytic degradation of MO due to the incorporation of rutile phase which suppresses recombination of photoactivated electron and hole pairs. Turnover frequency (TOF) of MO degradation was introduced to describe the intrinsic activity of TNFs. TNFs acquired best anatase/rutile phase ratio (A/R = 83/17) when annealed at 650 °C, resulting in highest TOF value 2394 h−1, two times higher as compared to P25 with similar anatase/rutile phase ratio (A/R = 85/15). Appropriate crystalline structure could be the reason for good photocatalytic activity as well as intrinsic activity of TNFs.
Here we give a brief review of the principles of stress, strain, and isotropic elasticity that will be needed in the study of defects. Readers familiar with this elementary material can skip on to the next chapter. The review is given here as a reference that will be used from time to time in the remainder of this book. A more thorough treatment of this subject can be found in many elasticity textbooks, such as [10, 11].
Stress
Stress is a measure of the intensity of force transmitted through a surface separating different parts of a body. The basic definition of stress is force per unit area. There are two types of stress: axial and shear, as shown in Fig. 2.1a, b, respectively. The axial stress is σ = P/A, where the force P is perpendicular to the surface area A. In other words, the force P acts along the surface normal. Hence the axial stress is also called the normal stress. The shear stress is τ = P/A, where the shear force P is parallel to the surface area A. The dimension of stress is f/l2, where f is the dimension of force and l is the dimension of length. The unit of stress is N/m2= Pa (pascal).
Stress as a second-rank tensor
To completely specify the stress state at a point, we need to consider a small cube around this point and specify the traction forces per unit area on all faces of this cube. The edges of the cube are chosen to be parallel to the axes of a given coordinate system. The positive faces of the cube are defined as the three faces whose outward normal vectors are along the positive x, y, and z axes, respectively. Because the size of the cube is vanishingly small, it suffices to specify the forces on the positive faces of the cube. The forces on the negative faces must be opposite to the forces on the corresponding positive faces.
The main purpose of this chapter is to introduce the geometrical properties of dislocations, the rules governing dislocation reactions, and the directions of dislocation motion in response to applied stress. The goal is to develop an intuitive understanding of the basic behaviors of dislocations without obtaining their stress field (which is the subject of the next chapter).
We start with Section 8.1 on why dislocations are necessary for plastic deformation of crystals. In Section 8.2, we introduce Volterra dislocations in an elastic continuum, and then describe the differences between them and dislocations in a crystal. In Section 8.3, we define the Burgers vector of a dislocation, and describe the geometric rule for Burgers vectors that must be satisfied when dislocations react. Section 8.4 shows which direction a dislocation should move on its glide plane under an applied stress. It also introduces cross-slip and climb, as alternative modes of dislocation motion. Section 8.5 describes where crystal dislocations come from. Severalmechanisms are presented in which the motion of existing dislocations can lead to multiplication, i.e. an increase of total dislocation length.
Role of dislocations in plastic deformation
We begin our study of dislocations by first thinking about plastic deformation in crystals – a problem that first led to the concept of crystal dislocations in the early 1930s. Although one's common experience with plastic deformation usually involves the continuous bending or stretching of a soft metal wire, the fundamental mechanism of plastic deformation is a shear process, as shown in Fig. 8.1.
The crystal, represented as a rectangular box, is plastically deformed in tension by sequential slip on various crystal planes. The bold lines indicate the active slip plane for that particular strain increment. Notice that the cumulative effect of these events is to make the crystal permanently longer and narrower. So themacroscopic shape change associated with ordinary tensile deformation is actually the cumulative effect of a large number of shear events. This can be confirmed by observing the surface of a plastically deformed metal crystal under an optical microscope, which reveals lots of surface steps, called slip traces. These are the intersection lines between slip planes and the sample surface.
The geometry of grain boundaries (GBs) can be specified with five degrees of freedom: three for the relative misorientation of the crystals and two for the direction of the boundary plane normal. Grain boundaries can be characterized as twist, tilt, or mixed depending on the relative orientation between the axis of rotation and the boundary plane normal.
The coincidence site lattice (CSL) theory describes special orientations between two lattices for which a fraction, 1/Σ, of the lattice points coincide. This leads to the designation of grain boundary misorientation by the Σ number. Special boundaries with low energies usually have low Σ numbers and appear as cusps in the plot of energy versus angle of misorientation.
The CSL theory predicts the vectors by which one lattice can be translated relative to the other while keeping the periodic coincidence pattern unchanged. These displacement vectors also form a lattice, called the displacement shift complete (DSC) lattice. The smallest repeat vectors of the DSC lattice are the Burgers vectors of GB dislocations. A crystal dislocation with an appropriate Burgers vector can spread out in the GB by dissociating into many GB dislocations with much shorter Burgers vectors and lower energies.
This chapter reviews the fundamental principles of thermodynamics and statistical mechanics, which are needed to derive the equilibrium distribution of point defects in a solid under external or internal stresses.
The first law defines the change in energy, E, a state variable, as the sum of the work and heat entering the solid. The second law introduces another state variable, the entropy, S, which may only increase in isolated systems and reaches a maximum at equilibrium. While the entropy can be described by considering heat into a solid, its physical meaning is clarified by Boltzmann’s entropy expression. The number of atoms in the solid, N, and the volume, V, are also state variables. The relation between these state variables, E(S,V,N), is called an equation of state.
The equation of state, E(S,V,N), can be rewritten into more convenient forms by Legendre transform, through which other thermodynamic potentials are defined, such as the enthalpy, H, the Helmholtz free energy, F, and the Gibbs free energy G. Intensive state variables, such as temperature, T, pressure, p, and chemical potential, μ, are defined as partial derivatives of the thermodynamic potentials.
Our study of grain boundaries to this point has focused on their geometry and special misorientations that lead to periodic patterns in the GB structure.We now turn to another important aspect of grain boundaries: their energies and possible elastic fields. A planar grain boundary usually does not have a long range stress field by itself. However, certain grain boundaries contain periodic dislocation arrays as part of their structures. In such cases, there is an appreciable stress field around the GB at distances comparable to the inter-dislocation spacing in the GB. The GB model based on dislocation arrays, combined with the theory of coincidence site and DSC lattices, provides a way to understand the GB energy as a function of its misorientation angle.
We have seen that the GB energy as a function of the misorientation angle has a complex structure, as shown in Fig. 13.2 and Fig. 13.8. Nonetheless, such plots suggest a classification of grain boundaries broadly into three types: singular, vicinal, and general [129]. The singular GBs correspond to the sharp minima on the energy plots. Their misorientations usually correspond to low-Σ CSLs. The singular GBs are usually special in other properties as well, such as mobility and point defect segregation. The vicinal GBs have both misorientation and GB plane direction sufficiently close to the singular GBs, and they can be considered as singular GBs superimposed with one or more GB dislocation arrays. The spacing between the nearest dislocations in the array reduces as the misorientation deviates further away from that of the singular GB. The general GBs are those boundaries that are sufficiently different from the singular GBs that the dislocation array is no longer a useful model as the necessary dislocation density would be so large that the dislocation cores would overlap.
In this classification of GBs, the case of zero misorientation and its vicinal range deserves extra attention. On the one hand, when the misorientation angle θ equals zero, the grain boundary disappears and the GB energy is zero, because the two crystals are perfectly aligned with each other.
A qualitative understanding of the behaviors of point defects can be established by considering atoms as hard spheres packed together to form the crystal. Crude as the hard sphere model may seem, it can be used to explain many of the observations made about point defects. In Section 4.1, we define the hard sphere radius of an atom and show its influence on the site preference of solute atoms. In Section 4.2, we use the hard sphere model to show the type of the distortions (spherically symmetric or not) in the host crystal around a solute atom. This allows us to explain why certain solutes have a much stronger solid solution hardening effect than others.
We then need to go beyond the hard sphere model in order to be more quantitative. In Section 4.3, we define the Seitz radius, which is more useful than the hard sphere radius for keeping track of the volume occupied by atoms of different kinds in solid solutions. We will see that atoms often appear to take on a different radius as a solute atom in another crystal compared to the radius it takes in its own crystal. In Section 4.4, we apply elasticity theory to predict the elastic fields around a solute atom. For simplicity, the size of the point defect is shrunk to zero and is modeled as force dipoles acting on a point in an elastic medium. In Section 4.5, a more realistic model is developed, in which the solute atom is modeled as an elastic sphere to be inserted into a hole inside an elastic medium. Elastic fields arise because the initial size of the sphere is larger than the initial size of the hole. Even though many atomistic and electronic details concerning point defects are ignored, the models developed in this chapter are increasingly more quantitative and can be used to explain a large number of behaviors of point defects.
Hard sphere model
Hard sphere radius
It is common to treat atoms in a crystal as undeformable spheres and to calculate the atomic sizes from the lattice parameters (measured using X-ray diffraction).We call this the hard sphere approach.
In our treatment of dislocations thus far, we have avoided the dislocation core. For example, in Volterra's dislocation model, the stress–strain fields diverge on the dislocation line, so that a cylindrical region of material is usually removed around the dislocation line to avoid the singularity. In the line tension model, the dislocation is modeled as a string that carries a line energy per unit length, but is otherwise featureless. In Chapter 11, we have seen that perfect dislocations in close-packed metals tend to dissociate into partial dislocations, but the partial dislocations were still treated as Volterra's dislocation lines. In reality, every (perfect or partial) crystal dislocation has a core region, which possesses a specific atomistic structure, called the core structure. The core structure is determined by non-linear interatomic interactions and the crystal structure, and, in turn, strongly influences the energetics and mobility of the dislocations. In this chapter, we discuss typical dislocation core structures and their effects on dislocation properties in several crystal structures.
In Section 12.1, we start our discussion with the classical Peierls–Nabarro (PN) model, which was the first physical model for the dislocation core and naturally predicts that the dislocation core should have a finite width. In Section 12.2, we generalize the original PN model to account for the presence of stacking faults in FCC metals. Consistent with the hard sphere model in Chapter 11, the generalized PN model also predicts dissociation of perfect dislocations into partials, except that each partial now has a finite width.
For crystals whose structures are sufficiently different from close-packed, hard spheres are no longer a good model for the atoms. Nonetheless, the geometry of the stacking of atomic layers is still useful for understanding the dislocation core structures in these crystals, as discussed in Section 12.3 (diamond cubic crystals) and Section 12.4 (BCC crystals). Finally, in Section 12.5 we discuss the interaction between dislocations and point defects, which usually leads to segregation of point defects around the dislocation core.
Peierls–Nabarro model
The classical model by Peierls and Nabarro [111, 112] considers the spreading of the dislocation over the glide plane.
Having discussed the elastic field around a single point defect, we now apply the thermodynamics principles (Chapter 3) to obtain the equilibrium concentration of point defects in crystals under a given temperature and pressure. The fundamental principle used repeatedly is that the Gibbs free energy of the crystal is minimized when the point defects reach the equilibrium concentration.
We start by discussing the equilibrium concentration of extrinsic point defects, i.e. substitutional and interstitial solutes, in Section 5.1. The approach is then applied, in Section 5.2, to vacancies, which are intrinsic point defects. In Section 5.3 we discuss the experimental methods to measure the equilibrium concentration and thermodynamic properties of vacancies, and compare the experimental data with theoretical estimates. The chemical potential of point defects is defined in Section 5.4.
Equilibrium concentration of solutes
We consider a dilute substitutional solution of B atoms in an A matrix. Let NA (which is fixed) be the number of A atoms in the system and let NB be the number of B atoms dissolved in the A-rich crystal. The total number of atomic sites in the A-rich crystal is N = NA + NB. Thus χ = NB/N is the fraction of atomic sites where the “wrong” kind of atom is located. χ is also the molar fraction of B atoms in the crystal.We follow the regular solution/quasi-chemical approach in which the formation energy of the point defect is dominated by the energies of the chemical bonds associated with the impurity defect (quasi-chemical, Eq. (5.5)) and where the mixing entropy is that for an ideal solution (regular solution, Eq. (5.19)).
Let the A-rich crystal be in contact with a large B crystal, which acts as an infinite supply of B atoms. For simplicity, we only allow B atoms to enter the A-rich crystal as solutes, but forbid A atoms to enter the B crystal as solutes. Each time a B atom is dissolved in the lattice, the A atom it replaces takes up a site at the A/B interface and extends the A lattice by one atomic volume, as shown in Fig. 5.1a. Note that the number of A atoms NA is conserved, while the number of B solute atoms NB and the total number of atomic sites N for the A-rich crystal are not conserved.