Refine search
Actions for selected content:
53182 results in Statistics and Probability
Epidemiology of respiratory syncytial virus in hospitalized children before, during, and after the COVID-19 lockdown restriction measures in Greece
-
- Journal:
- Epidemiology & Infection / Volume 152 / 2024
- Published online by Cambridge University Press:
- 13 May 2024, e94
-
- Article
-
- You have access
- Open access
- HTML
- Export citation
Perturbation analysis for continuous-time Markov chains in a weak sense
- Part of
-
- Journal:
- Journal of Applied Probability / Volume 61 / Issue 4 / December 2024
- Published online by Cambridge University Press:
- 13 May 2024, pp. 1278-1300
- Print publication:
- December 2024
-
- Article
- Export citation
Genetic testing and actuarial science – ERRATUM
-
- Journal:
- Annals of Actuarial Science / Volume 18 / Issue 2 / July 2024
- Published online by Cambridge University Press:
- 13 May 2024, p. 534
-
- Article
-
- You have access
- HTML
- Export citation
DivFolio: a Shiny application for portfolio divestment in green finance wealth management
-
- Journal:
- Annals of Actuarial Science / Volume 18 / Issue 2 / July 2024
- Published online by Cambridge University Press:
- 13 May 2024, pp. 379-422
-
- Article
-
- You have access
- Open access
- HTML
- Export citation
Overcoming intergovernmental data sharing challenges with federated learning
- Part of
-
- Journal:
- Data & Policy / Volume 6 / 2024
- Published online by Cambridge University Press:
- 13 May 2024, e27
-
- Article
-
- You have access
- Open access
- HTML
- Export citation
Multivariate regularly varying insurance and financial risks in multidimensional risk models
- Part of
-
- Journal:
- Journal of Applied Probability / Volume 61 / Issue 4 / December 2024
- Published online by Cambridge University Press:
- 13 May 2024, pp. 1319-1342
- Print publication:
- December 2024
-
- Article
-
- You have access
- Open access
- HTML
- Export citation
Rainbow Hamiltonicity in uniformly coloured perturbed digraphs
- Part of
-
- Journal:
- Combinatorics, Probability and Computing / Volume 33 / Issue 5 / September 2024
- Published online by Cambridge University Press:
- 13 May 2024, pp. 624-642
-
- Article
-
- You have access
- Open access
- HTML
- Export citation
-
We investigate the existence of a rainbow Hamilton cycle in a uniformly edge-coloured randomly perturbed digraph. We show that for every $\delta \in (0,1)$ there exists $C = C(\delta ) \gt 0$ such that the following holds. Let $D_0$ be an $n$-vertex digraph with minimum semidegree at least $\delta n$ and suppose that each edge of the union of $D_0$ with a copy of the random digraph $\mathbf{D}(n,C/n)$ on the same vertex set gets a colour in $[n]$ independently and uniformly at random. Then, with high probability, $D_0 \cup \mathbf{D}(n,C/n)$ has a rainbow directed Hamilton cycle.
This improves a result of Aigner-Horev and Hefetz ((2021) SIAM J. Discrete Math. 35(3) 1569–1577), who proved the same in the undirected setting when the edges are coloured uniformly in a set of $(1 + \varepsilon )n$ colours.


Valuation of guaranteed minimum accumulation benefits (GMABs) with physics-inspired neural networks
-
- Journal:
- Annals of Actuarial Science / Volume 18 / Issue 2 / July 2024
- Published online by Cambridge University Press:
- 13 May 2024, pp. 442-473
-
- Article
- Export citation
Package CovRegpy: Regularized covariance regression and forecasting in Python
-
- Journal:
- Annals of Actuarial Science / Volume 18 / Issue 2 / July 2024
- Published online by Cambridge University Press:
- 13 May 2024, pp. 474-508
-
- Article
-
- You have access
- Open access
- HTML
- Export citation
Varicella zoster virus outbreak in a long-term care unit of a tertiary care hospital in northern India
-
- Journal:
- Epidemiology & Infection / Volume 152 / 2024
- Published online by Cambridge University Press:
- 13 May 2024, e81
-
- Article
-
- You have access
- Open access
- HTML
- Export citation
Extreme mortality during a historical measles outbreak on Rotuma is consistent with measles immunosuppression
-
- Journal:
- Epidemiology & Infection / Volume 152 / 2024
- Published online by Cambridge University Press:
- 13 May 2024, e85
-
- Article
-
- You have access
- Open access
- HTML
- Export citation

A Practical Guide to Data Analysis Using R
- An Example-Based Approach
-
- Published online:
- 11 May 2024
- Print publication:
- 30 May 2024

Groups and Graphs, Designs and Dynamics
-
- Published online:
- 11 May 2024
- Print publication:
- 30 May 2024
Semantic agent framework for automated flood assessment using dynamic knowledge graphs
-
- Journal:
- Data-Centric Engineering / Volume 5 / 2024
- Published online by Cambridge University Press:
- 10 May 2024, e14
-
- Article
-
- You have access
- Open access
- HTML
- Export citation
Validating operational risk models
-
- Journal:
- British Actuarial Journal / Volume 29 / 2024
- Published online by Cambridge University Press:
- 10 May 2024, e11
-
- Article
-
- You have access
- Open access
- HTML
- Export citation
Long-term outcomes of SARS-CoV-2 variants and other respiratory infections: evidence from the Virus Watch prospective cohort in England
-
- Journal:
- Epidemiology & Infection / Volume 152 / 2024
- Published online by Cambridge University Press:
- 10 May 2024, e77
-
- Article
-
- You have access
- Open access
- HTML
- Export citation
Branching processes in nearly degenerate varying environment
- Part of
-
- Journal:
- Journal of Applied Probability / Volume 61 / Issue 4 / December 2024
- Published online by Cambridge University Press:
- 10 May 2024, pp. 1107-1126
- Print publication:
- December 2024
-
- Article
- Export citation
-
We investigate branching processes in varying environment, for which $\overline{f}_n \to 1$ and $\sum_{n=1}^\infty (1-\overline{f}_n)_+ = \infty$, $\sum_{n=1}^\infty (\overline{f}_n - 1)_+ < \infty$, where $\overline{f}_n$ stands for the offspring mean in generation n. Since subcritical regimes dominate, such processes die out almost surely, therefore to obtain a nontrivial limit we consider two scenarios: conditioning on nonextinction, and adding immigration. In both cases we show that the process converges in distribution without normalization to a nondegenerate compound-Poisson limit law. The proofs rely on the shape function technique, worked out by Kersting (2020).


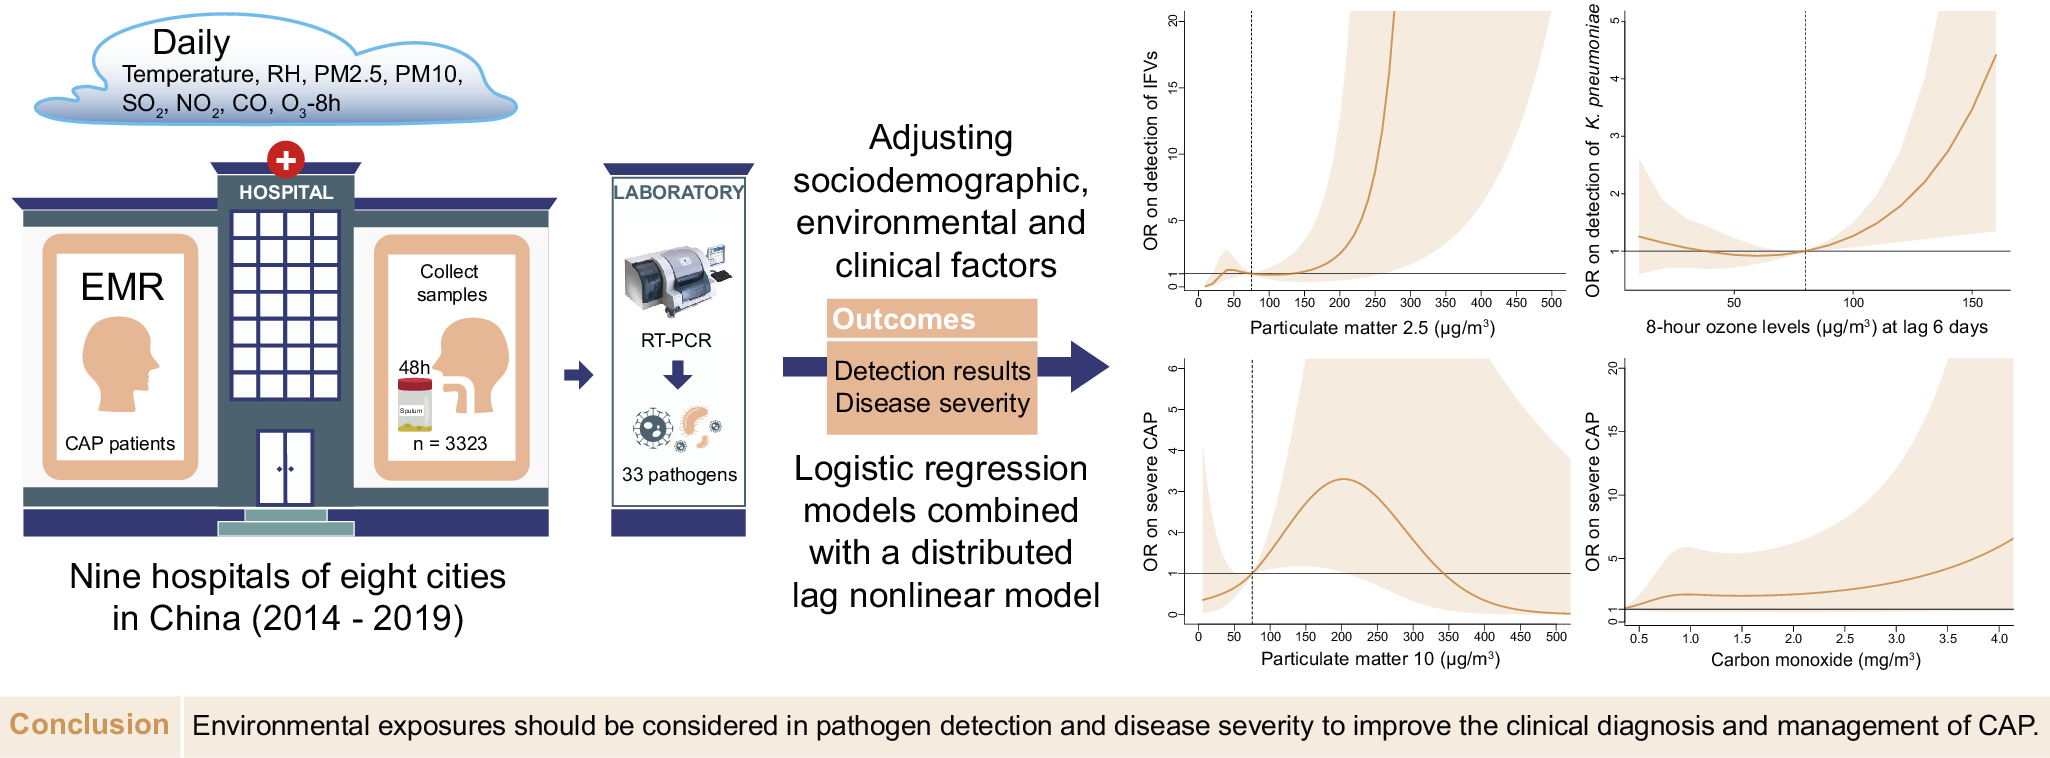
Impacts of environmental factors on the aetiological diagnosis and disease severity of community-acquired pneumonia in China: a multicentre, hospital-based, observational study
-
- Journal:
- Epidemiology & Infection / Volume 152 / 2024
- Published online by Cambridge University Press:
- 09 May 2024, e80
-
- Article
-
- You have access
- Open access
- HTML
- Export citation
Intraday residual transfer learning in minimally observed power distribution networks dynamic state estimation
-
- Journal:
- Data-Centric Engineering / Volume 5 / 2024
- Published online by Cambridge University Press:
- 08 May 2024, e13
-
- Article
-
- You have access
- Open access
- HTML
- Export citation
Revisiting Taylor’s analysis of the Trinity test
-
- Journal:
- Data-Centric Engineering / Volume 5 / 2024
- Published online by Cambridge University Press:
- 07 May 2024, e11
-
- Article
-
- You have access
- Open access
- HTML
- Export citation
