Refine search
Actions for selected content:
53194 results in Statistics and Probability
Index
-
- Book:
- Applying Benford's Law for Assessing the Validity of Social Science Data
- Published online:
- 09 November 2023
- Print publication:
- 23 November 2023, pp 204-208
-
- Chapter
- Export citation
Chapter 3 - Benford’s Law and Assessing Conformity
-
- Book:
- Applying Benford's Law for Assessing the Validity of Social Science Data
- Published online:
- 09 November 2023
- Print publication:
- 23 November 2023, pp 24-73
-
- Chapter
- Export citation
Preface
-
- Book:
- Applying Benford's Law for Assessing the Validity of Social Science Data
- Published online:
- 09 November 2023
- Print publication:
- 23 November 2023, pp xiii-xiv
-
- Chapter
- Export citation
Copyright page
-
- Book:
- Applying Benford's Law for Assessing the Validity of Social Science Data
- Published online:
- 09 November 2023
- Print publication:
- 23 November 2023, pp iv-iv
-
- Chapter
- Export citation
Chapter 6 - Benford Agreement Analysis of US and Global COVID-19 New Cases Data
-
- Book:
- Applying Benford's Law for Assessing the Validity of Social Science Data
- Published online:
- 09 November 2023
- Print publication:
- 23 November 2023, pp 131-168
-
- Chapter
- Export citation
References
-
- Book:
- Applying Benford's Law for Assessing the Validity of Social Science Data
- Published online:
- 09 November 2023
- Print publication:
- 23 November 2023, pp 196-203
-
- Chapter
- Export citation
Tables
-
- Book:
- Applying Benford's Law for Assessing the Validity of Social Science Data
- Published online:
- 09 November 2023
- Print publication:
- 23 November 2023, pp ix-xii
-
- Chapter
- Export citation
Chapter 1 - Introduction
-
- Book:
- Applying Benford's Law for Assessing the Validity of Social Science Data
- Published online:
- 09 November 2023
- Print publication:
- 23 November 2023, pp 1-10
-
- Chapter
- Export citation
Contents
-
- Book:
- Applying Benford's Law for Assessing the Validity of Social Science Data
- Published online:
- 09 November 2023
- Print publication:
- 23 November 2023, pp v-vi
-
- Chapter
- Export citation
Chapter 2 - Validity and Self-Reported Data
-
- Book:
- Applying Benford's Law for Assessing the Validity of Social Science Data
- Published online:
- 09 November 2023
- Print publication:
- 23 November 2023, pp 11-23
-
- Chapter
- Export citation
Chapter 8 - Conclusion
-
- Book:
- Applying Benford's Law for Assessing the Validity of Social Science Data
- Published online:
- 09 November 2023
- Print publication:
- 23 November 2023, pp 188-195
-
- Chapter
- Export citation
Spread-out limit of the critical points for lattice trees and lattice animals in dimensions
 $\boldsymbol{d}\boldsymbol\gt \textbf{8}$
- Part of
-
- Journal:
- Combinatorics, Probability and Computing / Volume 33 / Issue 2 / March 2024
- Published online by Cambridge University Press:
- 20 November 2023, pp. 238-269
-
- Article
- Export citation
-
A spread-out lattice animal is a finite connected set of edges in
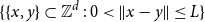 $\{\{x,y\}\subset \mathbb{Z}^d\;:\;0\lt \|x-y\|\le L\}$. A lattice tree is a lattice animal with no loops. The best estimate on the critical point
  $p_{\textrm{c}}$ so far was achieved by Penrose (J. Stat. Phys. 77, 3–15, 1994) :
 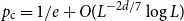 $p_{\textrm{c}}=1/e+O(L^{-2d/7}\log L)$ for both models for all
  $d\ge 1$. In this paper, we show that
 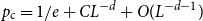 $p_{\textrm{c}}=1/e+CL^{-d}+O(L^{-d-1})$ for all
  $d\gt 8$, where the model-dependent constant
  $C$ has the random-walk representationwhere
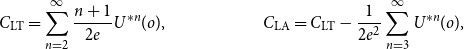 \begin{align*} C_{\textrm{LT}}=\sum _{n=2}^\infty \frac{n+1}{2e}U^{*n}(o),&& C_{\textrm{LA}}=C_{\textrm{LT}}-\frac 1{2e^2}\sum _{n=3}^\infty U^{*n}(o), \end{align*}
 $U^{*n}$ is the
  $n$-fold convolution of the uniform distribution on the
  $d$-dimensional ball
  $\{x\in{\mathbb R}^d\;: \|x\|\le 1\}$. The proof is based on a novel use of the lace expansion for the 2-point function and detailed analysis of the 1-point function at a certain value of
  $p$ that is designed to make the analysis extremely simple.


SUBGEOMETRICALLY ERGODIC AUTOREGRESSIONS WITH AUTOREGRESSIVE CONDITIONAL HETEROSKEDASTICITY
-
- Journal:
- Econometric Theory / Volume 41 / Issue 1 / February 2025
- Published online by Cambridge University Press:
- 17 November 2023, pp. 218-248
-
- Article
- Export citation
-
In this paper, we consider subgeometric (specifically, polynomial) ergodicity of univariate nonlinear autoregressions with autoregressive conditional heteroskedasticity (ARCH). The notion of subgeometric ergodicity was introduced in the Markov chain literature in the 1980s, and it means that the transition probability measures converge to the stationary measure at a rate slower than geometric; this rate is also closely related to the convergence rate of
 $\beta $-mixing coefficients. While the existing literature on subgeometrically ergodic autoregressions assumes a homoskedastic error term, this paper provides an extension to the case of conditionally heteroskedastic ARCH-type errors, considerably widening the scope of potential applications. Specifically, we consider suitably defined higher-order nonlinear autoregressions with possibly nonlinear ARCH errors and show that they are, under appropriate conditions, subgeometrically ergodic at a polynomial rate. An empirical example using energy sector volatility index data illustrates the use of subgeometrically ergodic AR–ARCH models.

A comparative analysis of public transport accessibility to hospitals in Córdoba (2019–2023): Where are we now?
-
- Journal:
- Data & Policy / Volume 5 / 2023
- Published online by Cambridge University Press:
- 17 November 2023, e35
-
- Article
-
- You have access
- Open access
- HTML
- Export citation
Optimal performance of a tontine overlay subject to withdrawal constraints
-
- Journal:
- ASTIN Bulletin: The Journal of the IAA / Volume 54 / Issue 1 / January 2024
- Published online by Cambridge University Press:
- 17 November 2023, pp. 94-128
- Print publication:
- January 2024
-
- Article
-
- You have access
- Open access
- HTML
- Export citation
Frontmatter
-
- Book:
- Interaction Models
- Published online:
- 02 November 2023
- Print publication:
- 16 November 2023, pp i-vi
-
- Chapter
- Export citation
References
-
- Book:
- Interaction Models
- Published online:
- 02 November 2023
- Print publication:
- 16 November 2023, pp 506-523
-
- Chapter
- Export citation
10 - Interactions and Unordered Dependent Variables
-
- Book:
- Interaction Models
- Published online:
- 02 November 2023
- Print publication:
- 16 November 2023, pp 433-492
-
- Chapter
- Export citation
Figures
-
- Book:
- Interaction Models
- Published online:
- 02 November 2023
- Print publication:
- 16 November 2023, pp xiii-xvii
-
- Chapter
- Export citation
Appendix A - Basic Properties of Variances
-
- Book:
- Interaction Models
- Published online:
- 02 November 2023
- Print publication:
- 16 November 2023, pp 493-494
-
- Chapter
- Export citation
