To save content items to your account,
please confirm that you agree to abide by our usage policies.
If this is the first time you use this feature, you will be asked to authorise Cambridge Core to connect with your account.
Find out more about saving content to .
To save content items to your Kindle, first ensure no-reply@cambridge.org
is added to your Approved Personal Document E-mail List under your Personal Document Settings
on the Manage Your Content and Devices page of your Amazon account. Then enter the ‘name’ part
of your Kindle email address below.
Find out more about saving to your Kindle.
Note you can select to save to either the @free.kindle.com or @kindle.com variations.
‘@free.kindle.com’ emails are free but can only be saved to your device when it is connected to wi-fi.
‘@kindle.com’ emails can be delivered even when you are not connected to wi-fi, but note that service fees apply.
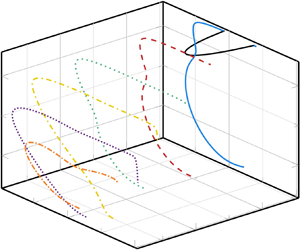
The nonlinear stability of two-dimensional (2-D) plane Couette flow subject to a constant throughflow is analysed at finite and asymptotically large Reynolds numbers $\textit {Re}$. The speed of this throughflow is quantified by the non-dimensional throughflow number $\eta$. The base flow exhibits a linear instability provided $\eta \gtrsim 3.35$, with multi-deck upper and lower branch structures developing in the limit 
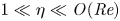
$1\ll \eta \ll \mathit {O}(\textit {Re})$. This instability provides a springboard for the computation of nonlinear travelling waves which bifurcate subcritically from the linear neutral curve, allowing us to map out a neutral surface at different values of $\eta$. Using strongly nonlinear critical layer theory, we investigate the waves that bifurcate from the upper branch at asymptotically large $\textit {Re}$. This asymptotic structure exists provided the throughflow number is larger than the critical value of $\eta _c\approx 1.20$ and is shown to give quantitatively similar results to the numerical solutions at Reynolds numbers of $\mathit {O}(10^5)$.
A super-stable granular heap is a pile of grains whose free surface is inclined above the angle of repose, and which forms when particles are poured onto a plane that is confined laterally by frictional sidewalls that are separated by a narrow gap. During continued mass supply, the heap free surface gradually steepens until all the inflowing grains can flow out of the domain. As soon as the supply of grains is stopped, the heap is progressively eroded, and if the base of the domain is inclined above the angle of repose, then all the grains eventually flow out. This phenomenology is modelled using a system of two-dimensional width-averaged mass and momentum balances that incorporate the sidewall friction. The granular material is assumed to be incompressible and satisfy the partially regularized $\mu (I)$-rheology. This is implemented in OpenFOAM$^{\circledR}$ and compared against small-scale experiments that study the formation, steady-state behaviour and drainage of a super-stable heap. The simulations accurately capture the dense liquid-like flows as well as the evolving heap shape. The steady uniform flow that develops along the heap surface has non-trivial inertial number dependence through its depth. Super-stable heaps are therefore a sensitive rheometer that can be used to determine the dependence of the friction $\mu$ on the inertial number $I$. However, these flows are challenging to simulate because the free-surface inertial number is high, and can exceed the threshold for ill-posedness even for the partially regularized theory.
The amplitude modulation coefficient, $R$, that is widely used to characterize nonlinear interactions between large- and small-scale motions in wall-bounded turbulence is not compatible with detecting the convective nonlinearity of the Navier–Stokes equations. Through a spectral decomposition of $R$ and a simplified model of triadic convective interactions, we show that $R$ suppresses the signature of convective scale interactions, but is strongly influenced by linear interactions between large-scale motions and the background mean flow. We propose an additional coefficient that is specifically designed for the detection of convective nonlinearities, and we show how this new coefficient, $R_T$, quantifies the turbulent kinetic energy transport involved in turbulent scale interactions and reveals a classical energy cascade across widely separated scales.
The evolutionary process of mixing induced by Rayleigh–Taylor (RT) and Richtmyer–Meshkov (RM) instabilities typically progresses through three stages: initial instability growth, subsequent mixing transition and ultimate turbulent mixing. Accurate prediction of this entire process is crucial for both scientific research and engineering applications. For engineering applications, Reynolds-averaged Navier–Stokes (RANS) simulation stands as the most viable method currently. However, it is noteworthy that existing RANS mixing models are primarily tailored for the fully developed turbulent mixing stage, rendering them ineffective in predicting the crucial mixing transition. To address that, the present study proposes a RANS mixing transition model. Specifically, we extend the idea of the intermittent factor, which has been widely employed to integrate with turbulence models for predicting boundary layer transition, to mixing problems. Based on a high-fidelity simulation of a RT case, the intermittent factor defined based on enstrophy is extracted and then applied to RANS calculations, showing that it is possible to accurately predict mixing transition by introducing the intermittent factor to the turbulence production from the baseline K-L turbulence mixing model. Furthermore, to facilitate practical predictions, a transport equation has been established to model the spatio-temporal evolution of the intermittent factor. Coupled with the K-L model, the intermittent factor provided by the transport equation is applied to modify the Reynolds stress in RANS calculations. Thereafter, the present transition model has been validated in a series of tests, demonstrating its accuracy and robustness in the capturing mixing process in different types and stages of interfacial mixing flows.
With its in-depth investigation of the opportunities and obstacles facing the region, this book offers data-driven assessments and policy recommendations to guide the process of energy transition in the Gulf Cooperation Council (GCC) region. It provides a comprehensive analysis of the current state of carbon reduction initiatives in the GCC and the sustainable development practices that are driving progress. Chapters are divided into four sections: circular economy and pathway frameworks; infrastructure; policy and data transparency; and behavioural and human factors. The book includes case studies to offer unique insights into the policy frameworks, technological innovations, and behavioural changes needed to transition to cleaner, knowledge-based economies. It unpacks the interplay between the ambitions of the GCC countries regarding climate change and sustainable development and the challenges they face in trying to achieve these. It is an indispensable resource for researchers and policymakers in environmental policy, climate change, and the Gulf states.
We analyzed the oxygen isotope composition of biogenic apatite phosphate (δ18Op) in fossil tooth enameloid to investigate the paleoecology of Late Cretaceous sharks in the Gulf Coastal Plain of Alabama, USA. We analyzed six different shark taxa from both the Mooreville Chalk and the Blufftown Formation. We compared shark δ18Op with the δ18Op of a co-occurring poikilothermic bony fish Enchodus petrosus as a reference for ambient conditions. Enchodus petrosus tooth enamel δ18Op values are similar between formations (21.3‰ and 21.4‰ Vienna Standard Mean Ocean Water [VSMOW], respectively), suggesting minimal differences in water δ18O between formations. Most shark taxa in this study are characterized by δ18Op values that overlap with E. petrosus values, indicating they likely lived in similar habitats and were also poikilothermic. Ptychodus mortoni and Cretoxyrhina mantelli exhibit significantly lower δ18Op values than co-occurring E. petrosus (P. mortoni δ18Op is 19.1‰ VSMOW in the Mooreville Chalk; C mantelli δ18Op is 20.2‰ VSMOW in the Mooreville Chalk and 18.1‰ VSMOW in the Blufftown Formation). Excursions into brackish or freshwater habitats and thermal water-depth gradients are unlikely explanations for the lower P. mortoni and C. mantelli δ18Op values. The low P. mortoni δ18Op value is best explained by higher body temperature relative to surrounding temperatures due to active heating (e.g., mesothermy) or passive heating due to its large body size (e.g., gigantothermy). The low C. mantelli δ18Op values are best explained by a combination of mesothermy (e.g., active heating) and migration (e.g., from the Western Interior Seaway, low-latitude warmer waters, or the paleo–Gulf Stream), supporting the hypothesis that mesothermy evolved in lamniform shark taxa during the Late Cretaceous. If the anomalous P. mortoni δ18Op values are also driven by active thermoregulation, this suggests that mesothermy evolved independently in multiple families of Late Cretaceous sharks.
Risk-based surveillance is now a well-established paradigm in epidemiology, involving the distribution of sampling efforts differentially in time, space, and within populations, based on multiple risk factors. To assess and map the risk of the presence of the bacterium Xylella fastidiosa, we have compiled a dataset that includes factors influencing plant development and thus the spread of such harmful organism. To this end, we have collected, preprocessed, and gathered information and data related to land types, soil compositions, and climatic conditions to predict and assess the probability of risk associated with X. fastidiosa in relation to environmental features. This resource can be of interest to researchers conducting analyses on X. fastidiosa and, more generally, to researchers working on geospatial modeling of risk related to plant infectious diseases.
Variations in stable oxygen isotopic compositions in sea ice provide information on environmental conditions during sea ice formation and also are important in understanding the regional and temporal aspects of the fresh water budget of the Arctic Ocean. We analyzed the oxygen isotope fractionation between sea ice and sea water using ice core and surface ocean samples obtained in a field study in the Lincoln Sea/Switchyard region of the Arctic Ocean. Using the Sea Ice Tracking Utility, we track the sea ice backward in time along drift trajectories, and use a simple model to calculate ice growth rates. Our results indicate that sea ice at the bottom of the floes that we sampled in the Switchyard Region grew within the past winter along a trajectory extending back to the North Pole. The effective fractionation coefficients from the bottom ice layers and the parent water mass are close to 2.11‰ with a standard error of ±0.06‰. Knowing this sea-ice oxygen isotope fractionation coefficient for high Arctic drifting ice is critical for use of equations for mass balance, salinity, oxygen isotopes and nutrients to calculate water mass fractions and sources to understand freshwater balance.
Both energy performance certificates (EPCs) and thermal infrared (TIR) images play key roles in mapping the energy performance of the urban building stock. In this paper, we developed parametric building archetypes using an EPC database and conducted temperature clustering on TIR images acquired from drones and satellite datasets. We evaluated 1,725 EPCs of existing building stock in Cambridge, UK, to generate energy consumption profiles. Drone-based TIR images of individual buildings in two Cambridge University colleges were processed using a machine learning pipeline for thermal anomaly detection and investigated the influence of two specific factors that affect the reliability of TIR for energy management applications: ground sample distance (GSD) and angle of view (AOV). The EPC results suggest that the construction year of the buildings influences their energy consumption. For example, modern buildings were over 30% more energy-efficient than older ones. In parallel, older buildings were found to show almost double the energy savings potential through retrofitting compared to newly constructed buildings. TIR imaging results showed that thermal anomalies can only be properly identified in images with a GSD of 1 m/pixel or less. A GSD of 1-6 m/pixel can detect hot areas of building surfaces. We found that a GSD > 6 m/pixel cannot characterize individual buildings but does help identify urban heat island effects. Additional sensitivity analysis showed that building thermal anomaly detection is more sensitive to AOV than to GSD. Our study informs newer approaches to building energy diagnostics using thermography and supports decision-making for large-scale retrofitting.
Recent advancements in Earth system science have been marked by the exponential increase in the availability of diverse, multivariate datasets characterised by moderate to high spatio-temporal resolutions. Earth System Data Cubes (ESDCs) have emerged as one suitable solution for transforming this flood of data into a simple yet robust data structure. ESDCs achieve this by organising data into an analysis-ready format aligned with a spatio-temporal grid, facilitating user-friendly analysis and diminishing the need for extensive technical data processing knowledge. Despite these significant benefits, the completion of the entire ESDC life cycle remains a challenging task. Obstacles are not only of a technical nature but also relate to domain-specific problems in Earth system research. There exist barriers to realising the full potential of data collections in light of novel cloud-based technologies, particularly in curating data tailored for specific application domains. These include transforming data to conform to a spatio-temporal grid with minimum distortions and managing complexities such as spatio-temporal autocorrelation issues. Addressing these challenges is pivotal for the effective application of Artificial Intelligence (AI) approaches. Furthermore, adhering to open science principles for data dissemination, reproducibility, visualisation, and reuse is crucial for fostering sustainable research. Overcoming these challenges offers a substantial opportunity to advance data-driven Earth system research, unlocking the full potential of an integrated, multidimensional view of Earth system processes. This is particularly true when such research is coupled with innovative research paradigms and technological progress.
Sea Surface Height Anomaly (SLA) is a signature of the mesoscale dynamics of the upper ocean. Sea surface temperature (SST) is driven by these dynamics and can be used to improve the spatial interpolation of SLA fields. In this study, we focused on the temporal evolution of SLA fields. We explored the capacity of deep learning (DL) methods to predict short-term SLA fields using SST fields. We used simulated daily SLA and SST data from the Mercator Global Analysis and Forecasting System, with a resolution of (1/12)° in the North Atlantic Ocean (26.5–44.42°N, −64.25–41.83°E), covering the period from 1993 to 2019. Using a slightly modified image-to-image convolutional DL architecture, we demonstrated that SST is a relevant variable for controlling the SLA prediction. With a learning process inspired by the teaching-forcing method, we managed to improve the SLA forecast at 5 days by using the SST fields as additional information. We obtained predictions of 12 cm (20 cm) error of SLA evolution for scales smaller than mesoscales and at time scales of 5 days (20 days) respectively. Moreover, the information provided by the SST allows us to limit the SLA error to 16 cm at 20 days when learning the trajectory.
Outdoor air pollution is estimated to cause a huge number of premature deaths worldwide. It catalyzes many diseases on a variety of time scales, and it has a detrimental effect on the environment. In light of these impacts, it is necessary to obtain a better understanding of the dynamics and statistics of measured air pollution concentrations, including temporal fluctuations of observed concentrations and spatial heterogeneities. Here, we present an extensive analysis for measured data from Europe. The observed probability density functions (PDFs) of air pollution concentrations depend very much on the spatial location and the pollutant substance. We analyze a large number of time series data from 3544 different European monitoring sites and show that the PDFs of nitric oxide ($ NO $), nitrogen dioxide ($ {NO}_2 $), and particulate matter ($ {PM}_{10} $ and $ {PM}_{2.5} $) concentrations generically exhibit heavy tails. These are asymptotically well approximated by $ q $-exponential distributions with a given entropic index $ q $ and width parameter $ \lambda $. We observe that the power-law parameter $ q $ and the width parameter $ \lambda $ vary widely for the different spatial locations. We present the results of our data analysis in the form of a map that shows which parameters $ q $ and $ \lambda $ are most relevant in a given region. A variety of interesting spatial patterns is observed that correlate to the properties of the geographical region. We also present results on typical time scales associated with the dynamical behavior.
The Northwest Tibet region is defined by several terranes, magmatic belts, basins and sutures, which were primarily shaped by the tectonic activities associated with Proto-, Palaeo- and Neo-Tethys Oceans. However, the basement nature and Precambrian tectonic evolution of the Northwest Tibet region, particularly within the Tashikuergan-Tianshuihai terrane, remain largely unknown. The Hongliutan area, located in the northeastern part of the Tashikuergan-Tianshuihai terrane, contains a critical sequence of Precambrian metamorphic rock strata. Detailed petrological, geochronological, and geochemical analyses of these metamorphic rocks – including plagioclase schist, quartz schist, amphibolite and nearby leucogranite – reveal the intricate processes of tectonic evolution within the Tianshuihai unit. Combining these findings with previous geochronological results is crucial for re-evaluating the nature of the Tashikuergan-Tianshuihai basement and its Precambrian tectonic evolution of the Tashikuergan-Tianshuihai basement. Our results reveal the following: (1) the leucogranite and amphibolite, identified as Cambrian igneous rocks, display distinct geochemical signatures indicative of a continental arc origin. These include calc-alkaline characteristics, enrichment in Th, U, Pb, Zr and Hf and depletion in Ba, Nb, Sr and Ti. Their εNd(t) values, close to zero, further support this tectonic setting, with the leucogranite and amphibolite formed at 506 and 522 Ma, respectively. (2) The plagioclase schist and quartz schist are interpreted to be Neoproterozoic volcaniclastic rocks that formed in a rifted (passive) continental margin setting. The quartz schist is particularly rich in detrital zircons, displaying a broad spectrum of 207Pb/206Pb ages, ranging from 901 to 3364 Ma. (3) A significant subset of detrital zircons within the quartz schist exhibits oscillatory zoning, high Th/U ratios and sharp-edged, anhedral-to-subhedral crystal forms, suggesting a derivation from proximal or deep-seated terranes. The concordant U–Pb zircon ages of 2468 and 974 Ma from the quartz schist, along with the 978 Ma age from the inherited zircons in the amphibolite, and the 1.2–2.1 Ga T2DM(Nd) from leucogranite and metamorphic rocks, collectively suggest that the Tianshuihai unit is likely underpinned by a Palaeoproterozoic basement that indicates Neoproterozoic reworking.
Therefore, our findings suggest the presence of a continuous, northwest-southeast trending Palaeoproterozoic basement underlying the entire Tashikuergan-Tianshuihai terrane. An alternative scenario posits that the ancient basement, currently beneath the Tashikuergan terrane, could extend into the Tianshuihai region, potentially indicating a Cambrian continental margin arc interspersed with remnants of older terranes.
Snow is a crucial element of the sea ice system, affecting the sea ice growth and decay due to its low thermal conductivity and high albedo. Despite its importance, present-day climate models have a very idealized representation of snow, often including just one-layer thermodynamics, omitting several processes that shape its properties. Even though sophisticated snow process models exist, they tend to be excluded in climate modeling due to their prohibitive computational costs. For example, SnowModel is a numerical snow process model developed to simulate the evolution of snow depth and density, blowing snow redistribution and sublimation, snow grain size, and thermal conductivity in a spatially distributed, multilayer snowpack framework. SnowModel can simulate snow distributions on sea ice floes in high spatial (1-m horizontal grid) and temporal (1-hour time step) resolution. However, for simulations spanning over large regions, such as the Arctic Ocean, high-resolution runs face challenges of slow processing speeds and the need for large computational resources. To address these common issues in high-resolution numerical modeling, data-driven emulators are often used. However, these emulators have their caveats, primarily a lack of generalizability and inconsistency with physical laws. In our study, we address these challenges by using a physics-guided approach in developing our emulator. By integrating physical laws that govern changes in snow density due to compaction, we aim to create an emulator that is efficient while also adhering to essential physical principles. We evaluated this approach by comparing three machine learning models: long short-term memory (LSTM), physics-guided LSTM, and Random Forest, across five distinct Arctic regions. Our evaluations indicate that all models achieved high accuracy, with the physics-guided LSTM model demonstrating the most promising results in terms of accuracy and generalizability. Our approach offers a computationally faster way to emulate the SnowModel with high fidelity and a speedup of over 9000 times.
Sustainability practices of a company reflect its commitments to the environment, societal good, and good governance. Institutional investors take these into account for decision-making purposes, since these factors are known to affect public opinion and thereby the stock indices of companies. Though sustainability score is usually derived from information available in self-published reports, News articles published by regulatory agencies and social media posts also contain critical information that may affect the image of a company. Language technologies have a critical role to play in the analytics process. In this paper, we present an event detection model for detecting sustainability-related incidents and violations from reports published by various monitoring and regulatory agencies. The proposed model uses a multi-tasking sequence labeling architecture that works with transformer-based document embeddings. We have created a large annotated corpus containing relevant articles published over three years (2015–2018) for training and evaluating the model. Knowledge about sustainability practices and reporting incidents using the Global Reporting Initiative (GRI) standards have been used for the above task. The proposed event detection model achieves high accuracy in detecting sustainability incidents and violations reported about an organization, as measured using cross-validation techniques. The model is thereafter applied to articles published from 2019 to 2022, and insights obtained through aggregated analysis of incidents identified from them are also presented in the paper. The proposed model is envisaged to play a significant role in sustainability monitoring by detecting organizational violations as soon as they are reported by regulatory agencies and thereby supplement the Environmental, Social, and Governance (ESG) scores issued by third-party agencies.
Machine learning (ML) techniques have emerged as a powerful tool for predicting weather and climate systems. However, much of the progress to date focuses on predicting the short-term evolution of the atmosphere. Here, we look at the potential for ML methodology to predict the evolution of the ocean. The presence of land in the domain is a key difference between ocean modeling and previous work looking at atmospheric modeling. Here, we look to train a convolutional neural network (CNN) to emulate a process-based General Circulation Model (GCM) of the ocean, in a configuration which contains land. We assess performance on predictions over the entire domain and near to the land (coastal points). Our results show that the CNN replicates the underlying GCM well when assessed over the entire domain. RMS errors over the test dataset are low in comparison to the signal being predicted, and the CNN model gives an order of magnitude improvement over a persistence forecast. When we partition the domain into near land and the ocean interior and assess performance over these two regions, we see that the model performs notably worse over the near land region. Near land, RMS scores are comparable to those from a simple persistence forecast. Our results indicate that ocean interaction with land is something the network struggles with and highlight that this is may be an area where advanced ML techniques specifically designed for, or adapted for, the geosciences could bring further benefits.
Nature-based solutions are becoming increasingly recognized as effective tools for addressing various environmental problems. This study presents a novel approach to selecting optimal blue–green infrastructure (BGI) solutions tailored to the unique environmental and climatic challenges of Istanbul, Türkiye. The primary objective is to utilize a Bayesian Belief Network (BBN) model for assisting in the identification of the most effective BGI solutions, considering the city’s distinct environmental conditions and vulnerabilities to climate change. Our methodology integrates comprehensive data collection, including meteorological and land use data, and employs a BBN model to analyze and weigh the complex network of factors influencing BGI suitability. Key findings reveal the model’s capacity to effectively predict BGI applicability across diverse climate scenarios, with quantitative results demonstrating a notable enhancement in decision-making processes for urban sustainability. Quantitative results from our model reveal a significant improvement in decision-making accuracy, with a predictive accuracy rate of 82% in identifying suitable BGI solutions for various urban scenarios. This enhancement is particularly notable in densely populated districts, where our model predicted a 25% greater efficiency in stormwater management and urban heat island mitigation compared to traditional planning methods. The study also acknowledges the limitations, such as data scarcity and the need for further model refinement. The results highlight the model’s potential for application in other complex urban areas, making it a valuable tool for improving urban sustainability and climate change adaptation. This study shows the importance of incorporating detailed meteorological and local climate zones data into urban planning processes and suggests that similar methodologies could be beneficial for addressing environmental challenges in diverse urban settings.
This article addresses the challenges of assessing pedestrian-level wind conditions in urban environments using a deep learning approach. The influence of large buildings on urban wind patterns has significant implications for thermal comfort, pollutant transport, pedestrian safety, and energy usage. Traditional methods, such as wind tunnel testing, are time-consuming and costly, leading to a growing interest in computational methods like computational fluid dynamics (CFD) simulations. However, CFD still requires a significant time investment for such studies, limiting the available time for design modification prior to lockdown. This study proposes a deep learning surrogate model based on a MLP-mixer architecture to predict mean flow conditions for complex arrays of buildings. The model is trained on a diverse dataset of synthetic geometries and corresponding CFD simulations, demonstrating its effectiveness in capturing intricate wind dynamics. The article discusses the model architecture and data preparation and evaluates its performance qualitatively and quantitatively. Results show promising capabilities in replicating key wind features with a mean error of 0.3 m/s and rarely exceeding 0.75 m/s, making the proposed model a valuable tool for early-stage urban wind modelling.
Comprehensive housing stock information is crucial for informing the development of climate resilience strategies aiming to reduce the adverse impacts of extreme climate hazards in high-risk regions like the Caribbean. In this study, we propose an end-to-end workflow for rapidly generating critical baseline exposure data using very high-resolution drone imagery and deep learning techniques. Specifically, our work leverages the segment anything model (SAM) and convolutional neural networks (CNNs) to automate the generation of building footprints and roof classification maps. We evaluate the cross-country generalizability of the CNN models to determine how well models trained in one geographical context can be adapted to another. Finally, we discuss our initiatives for training and upskilling government staff, community mappers, and disaster responders in the use of geospatial technologies. Our work emphasizes the importance of local capacity building in the adoption of AI and Earth Observation for climate resilience in the Caribbean.
In situ glaciological observations in the Himalaya–Karakoram (HK) region mostly come from small glaciers. Drang Drung (69.6 km2, Zanskar, Ladakh) is the largest glacier in the HK monitored for in situ glacier-wide mass balances applying the traditional glaciological method. During 2021–23, point ablation varies from –1.8 to –8.3 meter water equivalent (m w.e. a–1) in the ablation area, and from 0.15 to 1.70 m w.e. a–1 in the accumulation area. The mean glacier-wide mass balance is −0.74 ± 0.43 m w.e. a−1 over 2021‒2023, corresponding to a mean equilibrium line altitude of 5134 m a.s.l. and accumulation area ratio of 0.53. The mean annual vertical mass-balance gradient of 0.62 m w.e. (100 m)–1 on Drang Drung Glacier resembles that observed on other Himalayan glaciers. These initial investigations on Drang Drung Glacier address the gap for glacier monitoring in the Zanskar Range and will be continued in the long term.