Refine search
Actions for selected content:
48214 results in Zoology
Nutrient density and cost of commonly consumed foods: a South African perspective
-
- Journal:
- Journal of Nutritional Science / Volume 12 / 2023
- Published online by Cambridge University Press:
- 25 January 2023, e10
-
- Article
-
- You have access
- Open access
- HTML
- Export citation
The association between plasma zinc concentrations and markers of glucose metabolism in adults in Cameroon
-
- Journal:
- British Journal of Nutrition / Volume 130 / Issue 7 / 14 October 2023
- Published online by Cambridge University Press:
- 25 January 2023, pp. 1220-1227
- Print publication:
- 14 October 2023
-
- Article
-
- You have access
- Open access
- HTML
- Export citation
Reference growth curves to identify weight status (underweight, overweight or obesity) in children and adolescents: systematic review
-
- Journal:
- British Journal of Nutrition / Volume 130 / Issue 4 / 28 August 2023
- Published online by Cambridge University Press:
- 25 January 2023, pp. 666-678
- Print publication:
- 28 August 2023
-
- Article
-
- You have access
- HTML
- Export citation
BJN volume 129 issue 3 Cover and Back matter
-
- Journal:
- British Journal of Nutrition / Volume 129 / Issue 3 / 14 February 2023
- Published online by Cambridge University Press:
- 25 January 2023, pp. b1-b2
- Print publication:
- 14 February 2023
-
- Article
-
- You have access
- Export citation
PHN volume 26 issue 2 Cover and Front matter
-
- Journal:
- Public Health Nutrition / Volume 26 / Issue 2 / February 2023
- Published online by Cambridge University Press:
- 24 January 2023, pp. f1-f3
-
- Article
-
- You have access
- Open access
- Export citation
Results from the Strong Families Start at Home/Familias Fuertes Comienzan en Casa: feasibility randomised control trial to improve the diet quality of low-income, predominantly Hispanic/Latinx children
-
- Journal:
- Public Health Nutrition / Volume 26 / Issue 4 / April 2023
- Published online by Cambridge University Press:
- 24 January 2023, pp. 890-904
-
- Article
-
- You have access
- Open access
- HTML
- Export citation
Interaction between genetics and inulin affects host metabolism in rainbow trout fed a sustainable all plant-based diet
-
- Journal:
- British Journal of Nutrition / Volume 130 / Issue 7 / 14 October 2023
- Published online by Cambridge University Press:
- 24 January 2023, pp. 1105-1120
- Print publication:
- 14 October 2023
-
- Article
-
- You have access
- Open access
- HTML
- Export citation
Determination of glycaemic response to the consumption of two specialised formulas for glycaemic control
-
- Journal:
- British Journal of Nutrition / Volume 130 / Issue 7 / 14 October 2023
- Published online by Cambridge University Press:
- 24 January 2023, pp. 1137-1143
- Print publication:
- 14 October 2023
-
- Article
-
- You have access
- HTML
- Export citation
Weight trajectories from birth to 5 years and child appetitive traits at 7 years of age: a prospective birth cohort study
-
- Journal:
- British Journal of Nutrition / Volume 130 / Issue 7 / 14 October 2023
- Published online by Cambridge University Press:
- 24 January 2023, pp. 1278-1288
- Print publication:
- 14 October 2023
-
- Article
-
- You have access
- HTML
- Export citation
Relationship between dietary patterns and physical performance in the very old population: a cross-sectional study from the Kawasaki Aging and Wellbeing Project
-
- Journal:
- Public Health Nutrition / Volume 26 / Issue 6 / June 2023
- Published online by Cambridge University Press:
- 24 January 2023, pp. 1163-1171
-
- Article
-
- You have access
- Open access
- HTML
- Export citation
PHN volume 26 issue 2 Cover and Back matter
-
- Journal:
- Public Health Nutrition / Volume 26 / Issue 2 / February 2023
- Published online by Cambridge University Press:
- 24 January 2023, p. b1
-
- Article
-
- You have access
- Open access
- Export citation
Dietary intake of pistachios or mixed nuts results in higher systemic antioxidant capacity with minimal effects on bone in adolescent male rats
-
- Journal:
- Journal of Nutritional Science / Volume 12 / 2023
- Published online by Cambridge University Press:
- 24 January 2023, e11
-
- Article
-
- You have access
- Open access
- HTML
- Export citation
Food insecurity and coping strategies and their association with anxiety and depression: a nationally representative South African survey
-
- Journal:
- Public Health Nutrition / Volume 26 / Issue 4 / April 2023
- Published online by Cambridge University Press:
- 24 January 2023, pp. 705-715
-
- Article
-
- You have access
- Open access
- HTML
- Export citation
Association of household composition with dietary patterns among adolescents in Brazil
-
- Journal:
- British Journal of Nutrition / Volume 130 / Issue 7 / 14 October 2023
- Published online by Cambridge University Press:
- 24 January 2023, pp. 1213-1219
- Print publication:
- 14 October 2023
-
- Article
-
- You have access
- HTML
- Export citation
BJN volume 129 issue 2 Cover and Back matter
-
- Journal:
- British Journal of Nutrition / Volume 129 / Issue 2 / 28 January 2023
- Published online by Cambridge University Press:
- 23 January 2023, pp. b1-b2
- Print publication:
- 28 January 2023
-
- Article
-
- You have access
- Export citation
Development of the Ethiopian Healthy Eating Index (Et-HEI) and evaluation in women of reproductive age
-
- Journal:
- Journal of Nutritional Science / Volume 12 / 2023
- Published online by Cambridge University Press:
- 23 January 2023, e9
-
- Article
-
- You have access
- Open access
- HTML
- Export citation
Long-chain n-3 PUFA given before and throughout gestation and lactation in rats prevent high-fat diet-induced insulin resistance in male offspring in a tissue-specific manner
-
- Journal:
- British Journal of Nutrition / Volume 130 / Issue 7 / 14 October 2023
- Published online by Cambridge University Press:
- 23 January 2023, pp. 1121-1136
- Print publication:
- 14 October 2023
-
- Article
-
- You have access
- HTML
- Export citation
What happened among Japanese children from school closure due to COVID-19 after school re-opening? Changes in sleep habits and dietary intake
-
- Journal:
- Journal of Nutritional Science / Volume 12 / 2023
- Published online by Cambridge University Press:
- 23 January 2023, e8
-
- Article
-
- You have access
- Open access
- HTML
- Export citation
A scoping review of the conceptualisations of food justice
- Part of
-
- Journal:
- Public Health Nutrition / Volume 26 / Issue 4 / April 2023
- Published online by Cambridge University Press:
- 23 January 2023, pp. 725-737
-
- Article
-
- You have access
- Open access
- HTML
- Export citation
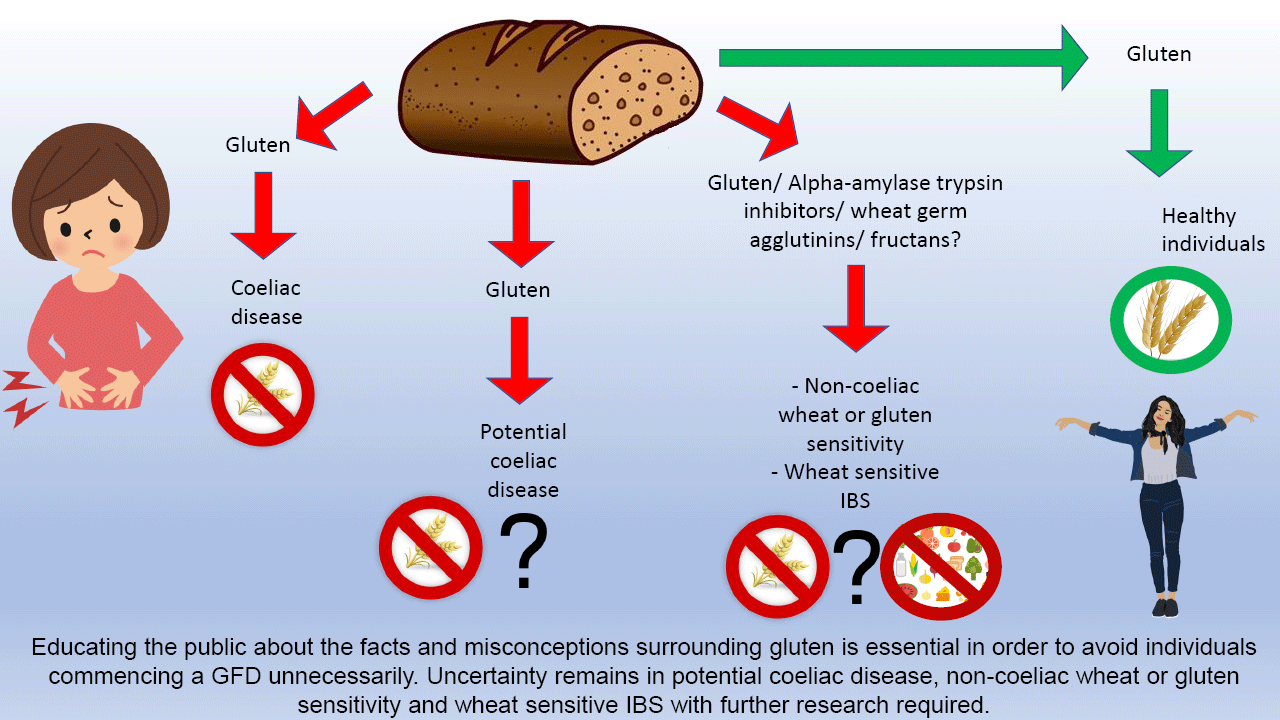
The truth about gluten!
-
- Journal:
- British Journal of Nutrition / Volume 129 / Issue 2 / 28 January 2023
- Published online by Cambridge University Press:
- 23 January 2023, pp. 255-261
- Print publication:
- 28 January 2023
-
- Article
-
- You have access
- HTML
- Export citation
