Refine search
Actions for selected content:
53197 results in Statistics and Probability
Copyright in generative deep learning
-
- Journal:
- Data & Policy / Volume 4 / 2022
- Published online by Cambridge University Press:
- 25 May 2022, e17
-
- Article
-
- You have access
- Open access
- HTML
- Export citation
Open innovation programmes related to data and AI: How do the entrepreneurial orientations of startups align with the objectives of public funders?
-
- Journal:
- Data & Policy / Volume 4 / 2022
- Published online by Cambridge University Press:
- 25 May 2022, e16
-
- Article
-
- You have access
- Open access
- HTML
- Export citation
Differences in service and antibiotics use following symptomatic respiratory tract infections between 2016 and 2021 in rural Anhui, China
-
- Journal:
- Epidemiology & Infection / Volume 150 / 2022
- Published online by Cambridge University Press:
- 25 May 2022, e117
-
- Article
-
- You have access
- Open access
- HTML
- Export citation
On tripartite common graphs
- Part of
-
- Journal:
- Combinatorics, Probability and Computing / Volume 31 / Issue 5 / September 2022
- Published online by Cambridge University Press:
- 25 May 2022, pp. 907-923
-
- Article
-
- You have access
- Open access
- HTML
- Export citation
-
A graph
 $H$ is common if the number of monochromatic copies of
  $H$ in a 2-edge-colouring of the complete graph
  $K_n$ is asymptotically minimised by the random colouring. Burr and Rosta, extending a famous conjecture of Erdős, conjectured that every graph is common. The conjectures of Erdős and of Burr and Rosta were disproved by Thomason and by Sidorenko, respectively, in the late 1980s. Collecting new examples of common graphs had not seen much progress since then, although very recently a few more graphs were verified to be common by the flag algebra method or the recent progress on Sidorenko’s conjecture. Our contribution here is to provide several new classes of tripartite common graphs. The first example is the class of so-called triangle trees, which generalises two theorems by Sidorenko and answers a question of Jagger, Šťovíček, and Thomason from 1996. We also prove that, somewhat surprisingly, given any tree
  $T$, there exists a triangle tree such that the graph obtained by adding
  $T$ as a pendant tree is still common. Furthermore, we show that adding arbitrarily many apex vertices to any connected bipartite graph on at most
  $5$ vertices yields a common graph.


A multi-parameter-level model for simulating future mortality scenarios with COVID-alike effects
-
- Journal:
- Annals of Actuarial Science / Volume 16 / Issue 3 / November 2022
- Published online by Cambridge University Press:
- 24 May 2022, pp. 453-477
-
- Article
-
- You have access
- Open access
- HTML
- Export citation
Protective effect of a first SARS-CoV-2 infection from reinfection: a matched retrospective cohort study using PCR testing data in England
-
- Journal:
- Epidemiology & Infection / Volume 150 / 2022
- Published online by Cambridge University Press:
- 24 May 2022, e109
-
- Article
-
- You have access
- Open access
- HTML
- Export citation
SELECTING BIVARIATE COPULA MODELS USING IMAGE RECOGNITION
-
- Journal:
- ASTIN Bulletin: The Journal of the IAA / Volume 52 / Issue 3 / September 2022
- Published online by Cambridge University Press:
- 24 May 2022, pp. 707-734
- Print publication:
- September 2022
-
- Article
-
- You have access
- Open access
- HTML
- Export citation
SPLICE: a synthetic paid loss and incurred cost experience simulator
-
- Journal:
- Annals of Actuarial Science / Volume 17 / Issue 1 / March 2023
- Published online by Cambridge University Press:
- 23 May 2022, pp. 7-35
-
- Article
- Export citation
NONPARAMETRIC PREDICTION WITH SPATIAL DATA
-
- Journal:
- Econometric Theory / Volume 39 / Issue 5 / October 2023
- Published online by Cambridge University Press:
- 23 May 2022, pp. 950-988
-
- Article
-
- You have access
- Open access
- Export citation
-
We describe a (nonparametric) prediction algorithm for spatial data, based on a canonical factorization of the spectral density function. We provide theoretical results showing that the predictor has desirable asymptotic properties. Finite sample performance is assessed in a Monte Carlo study that also compares our algorithm to a rival nonparametric method based on the infinite
 $AR$ representation of the dynamics of the data. Finally, we apply our methodology to predict house prices in Los Angeles.

Regression for Health and Social Science
- Applied Linear Models with R
-
- Published online:
- 20 May 2022
- Print publication:
- 12 May 2022
-
- Textbook
- Export citation
On approximation of the analytic fixed finite time large t probability distributions in an extreme renewal process with no-mean inter-renewals
-
- Journal:
- Probability in the Engineering and Informational Sciences / Volume 37 / Issue 3 / July 2023
- Published online by Cambridge University Press:
- 20 May 2022, pp. 695-710
-
- Article
-
- You have access
- Open access
- HTML
- Export citation
-
We consider an extreme renewal process with no-mean heavy-tailed Pareto(II) inter-renewals and shape parameter
 $\alpha$ where
  $0\lt\alpha \leq 1$. Two steps are required to derive integral expressions for the analytic probability density functions (pdfs) of the fixed finite time
  $t$ excess, age, and total life, and require extensive computations. Step 1 creates and solves a Volterra integral equation of the second kind for the limiting pdf of a basic underlying regenerative process defined in the text, which is used for all three fixed finite time
  $t$ pdfs. Step 2 builds the aforementioned integral expressions based on the limiting pdf in the basic underlying regenerative process. The limiting pdfs of the fixed finite time
  $t$ pdfs as
  $t\rightarrow \infty$ do not exist. To reasonably observe the large
  $t$ pdfs in the extreme renewal process, we approximate them using the limiting pdfs having simple well-known formulas, in a companion renewal process where inter-renewals are right-truncated Pareto(II) variates with finite mean; this does not involve any computations. The distance between the approximating limiting pdfs and the analytic fixed finite time large
  $t$ pdfs is given by an
  $L_{1}$ metric taking values in
  $(0,1)$, where “near
  $0$” means “close” and “near
  $1$” means “far”.


TREE-BASED MACHINE LEARNING METHODS FOR MODELING AND FORECASTING MORTALITY
-
- Journal:
- ASTIN Bulletin: The Journal of the IAA / Volume 52 / Issue 3 / September 2022
- Published online by Cambridge University Press:
- 20 May 2022, pp. 765-787
- Print publication:
- September 2022
-
- Article
- Export citation
Correction to “On the distribution of winners’ scores in a round-robin tournament”
-
- Journal:
- Probability in the Engineering and Informational Sciences / Volume 37 / Issue 3 / July 2023
- Published online by Cambridge University Press:
- 20 May 2022, pp. 737-739
-
- Article
-
- You have access
- HTML
- Export citation
Network classification-based structural analysis of real networks and their model-generated counterparts
-
- Journal:
- Network Science / Volume 10 / Issue 2 / June 2022
- Published online by Cambridge University Press:
- 20 May 2022, pp. 146-169
-
- Article
- Export citation
Nonlinear and unbalanced urn models with two types of strategies: a stochastic approximation point of view
-
- Journal:
- Probability in the Engineering and Informational Sciences / Volume 37 / Issue 3 / July 2023
- Published online by Cambridge University Press:
- 20 May 2022, pp. 711-729
-
- Article
- Export citation
-
In this paper, we treat a nonlinear and unbalanced
 $2$-color urn scheme, subjected to two different nonlinear drawing rules, depending on the color withdrawn. We prove a central limit theorem as well as a law of large numbers for the urn composition. We also give an estimate of the mean and variance of both types of balls.

Outbreak of STEC O157:H7 linked to a milk pasteurisation failure at a dairy farm in England, 2019
- Part of
-
- Journal:
- Epidemiology & Infection / Volume 150 / 2022
- Published online by Cambridge University Press:
- 18 May 2022, e114
-
- Article
-
- You have access
- Open access
- HTML
- Export citation
Prevalence of SARS-CoV-2 antibodies during phased access to vaccination: results from a population-based survey in New York City, September 2020–March 2021
-
- Journal:
- Epidemiology & Infection / Volume 150 / 2022
- Published online by Cambridge University Press:
- 18 May 2022, e105
-
- Article
-
- You have access
- Open access
- HTML
- Export citation
The Fundamentals of Heavy Tails
- Properties, Emergence, and Estimation
-
- Published online:
- 17 May 2022
- Print publication:
- 09 June 2022
On the Sn/n problem
- Part of
-
- Journal:
- Journal of Applied Probability / Volume 59 / Issue 2 / June 2022
- Published online by Cambridge University Press:
- 17 May 2022, pp. 571-583
- Print publication:
- June 2022
-
- Article
- Export citation
-
The Chow–Robbins game is a classical, still partly unsolved, stopping problem introduced by Chow and Robbins in 1965. You repeatedly toss a fair coin. After each toss, you decide whether you take the fraction of heads up to now as a payoff, otherwise you continue. As a more general stopping problem this reads
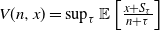 $V(n,x) = \sup_{\tau }\mathbb{E} \left [ \frac{x + S_\tau}{n+\tau}\right]$, where S is a random walk. We give a tight upper bound for V when S has sub-Gaussian increments by using the analogous time-continuous problem with a standard Brownian motion as the driving process. For the Chow–Robbins game we also give a tight lower bound and use these to calculate, on the integers, the complete continuation and the stopping set of the problem for
  $n\leq 489\,241$.


Improper handling of vomitus as a risk factor in the human norovirus outbreak in a kindergarten in Wuyi County, Zhejiang Province, China
-
- Journal:
- Epidemiology & Infection / Volume 150 / 2022
- Published online by Cambridge University Press:
- 17 May 2022, e111
-
- Article
-
- You have access
- Open access
- HTML
- Export citation
