To save content items to your account,
please confirm that you agree to abide by our usage policies.
If this is the first time you use this feature, you will be asked to authorise Cambridge Core to connect with your account.
Find out more about saving content to .
To save content items to your Kindle, first ensure no-reply@cambridge.org
is added to your Approved Personal Document E-mail List under your Personal Document Settings
on the Manage Your Content and Devices page of your Amazon account. Then enter the ‘name’ part
of your Kindle email address below.
Find out more about saving to your Kindle.
Note you can select to save to either the @free.kindle.com or @kindle.com variations.
‘@free.kindle.com’ emails are free but can only be saved to your device when it is connected to wi-fi.
‘@kindle.com’ emails can be delivered even when you are not connected to wi-fi, but note that service fees apply.
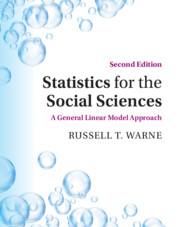
The second edition of Statistics for the Social Sciences prepares students from a wide range of disciplines to interpret and learn the statistical methods critical to their field of study. By using the General Linear Model (GLM), the author builds a foundation that enables students to see how statistical methods are interrelated enabling them to build on the basic skills. The author makes statistics relevant to students' varying majors by using fascinating real-life examples from the social sciences. Students who use this edition will benefit from clear explanations, warnings against common erroneous beliefs about statistics, and the latest developments in the philosophy, reporting, and practice of statistics in the social sciences. The textbook is packed with helpful pedagogical features including learning goals, guided practice, and reflection questions.
We propose, calibrate, and validate a crowdsourced approach for estimating power spectral density (PSD) of road roughness based on an inverse analysis of vertical acceleration measured by a smartphone mounted in an unknown position in a vehicle. Built upon random vibration analysis of a half-car mechanistic model of roughness-induced pavement–vehicle interaction, the inverse analysis employs an L2 norm regularization to estimate ride quality metrics, such as the widely used International Roughness Index, from the acceleration PSD. Evoking the fluctuation–dissipation theorem of statistical physics, the inverse framework estimates the half-car dynamic vehicle properties and related excess fuel consumption. The method is validated against (a) laser-measured road roughness data for both inner city and highway road conditions and (b) road roughness data for the state of California. We also show that the phone position in the vehicle only marginally affects road roughness predictions, an important condition for crowdsourced capabilities of the proposed approach.
The study of the distributions of sums of dependent risks is a key topic in actuarial sciences, risk management, reliability and in many branches of applied and theoretical probability. However, there are few results where the distribution of the sum of dependent random variables is available in a closed form. In this paper, we obtain several analytical expressions for the distribution of the aggregated risks under dependence in terms of copulas. We provide several representations based on the underlying copula and the marginal distribution functions under general hypotheses and in any dimension. Then, we study stochastic comparisons between sums of dependent risks. Finally, we illustrate our theoretical results by studying some specific models obtained from Clayton, Ali-Mikhail-Haq and Farlie-Gumbel-Morgenstern copulas. Extensions to more general copulas are also included. Bounds and the limiting behavior of the hazard rate function for the aggregated distribution of some copulas are studied as well.
Large-scale population surveys have been an important source of data for the study of migration, and in many countries provide the only widely accessible data on migrants’ characteristics and outcomes after they arrive. For immigration policymakers, however, official survey data have some important limitations. Nonresponse to surveys is particularly likely to affect newly arrived migrants, biasing analysis toward more settled populations who have different characteristics (e.g., different fiscal costs), and hindering analysis of how integration outcomes evolve after arrival. Survey data are not well suited to capturing the dynamics of a mobile population, particularly among groups of migrants who spend substantial periods outside the country. And perhaps most importantly, official survey data usually identify migrants by country of birth and nationality (and sometimes self-reported reason for migration) but rarely include information on a person’s legal status either at arrival or at the time of data collection. This significantly limits the possibilities for evaluating policy and the impacts of policy changes: the characteristics of migrants coming for different reasons can vary enormously, so policymakers should be cautious about assuming that aggregate evidence on migrants or migration will be relevant to the specific routes on which they are taking decisions. This article illustrates some of these problems in practice showing how official survey data in the United Kingdom have been unable to answer one of the key questions facing the government, namely how many and which EU citizens need to apply to secure their residence rights after Brexit.
Owing to limited data, we conducted a meta-analysis to re-evaluate the relationship between obesity and coronavirus-2019 (COVID-19). Literature published between 1 January 2020 and 22 August 2020 was comprehensively analysed, and RevMan3.5 was used for data analysis. A total of 50 studies, including data on 18 260 378 patients, were available. Obesity was associated with a higher risk of severe acute respiratory syndrome-coronavirus 2 (SARS-CoV2) infection (odds ratio (OR): 1.39, 95% confidence interval (CI) 1.25–1.54; P < 0.00001) and increased severity of COVID-19 (hospitalisation rate: OR: 2.45, 95% CI 1.78–3.39; P < 0.00001; severe cases: OR: 3.74, 95% CI 1.18–11.87; P: 0.02; need for intensive care unit admission: OR: 1.30, 95% CI 1.21–1.40; P < 0.00001; need for invasive mechanical ventilation: OR: 1.59, 95% CI 1.35–1.88; P < 0.00001 and mortality: OR: 1.65, 95% CI 1.21–2.25; P: 0.001). However, we found a non-linear association between BMI and the severity of COVID-19. In conclusion, we found that obesity could increase the risk of SARS-CoV2 infection and aggregate the severity of COVID-19. Further studies are needed to explore the possible mechanisms behind this association.
Data trusts have been proposed as a mechanism through which data can be more readily exploited for a variety of aims, including economic development and social-benefit goals such as medical research or policy-making. Data trusts, and similar data governance mechanisms such as data co-ops, aim to facilitate the use and re-use of datasets across organizational boundaries and, in the process, to protect the interests of stakeholders such as data subjects. However, the current discourse on data trusts does not acknowledge another common stakeholder in the data value chain—the crowd workers who are employed to collect, validate, curate, and transform data. In this paper, we report on a preliminary qualitative investigation into how crowd data workers themselves feel datasets should be used and governed. We find that while overall remuneration is important to those workers, they also value public-benefit data use but have reservations about delayed remuneration and the trustworthiness of both administrative processes and the crowd itself. We discuss the implications of our findings for how data trusts could be designed, and how data trusts could be used to give crowd workers a more enduring stake in the product of their work.
Cloud storage faces many problems in the storage process which badly affect the system's efficiency. One of the most problems is insufficient buffer space in cloud storage. This means that the packets of data wait to have storage service which may lead to weakness in performance evaluation of the system. The storage process is considered a stochastic process in which we can determine the probability distribution of the buffer occupancy and the buffer content and predict the performance behavior of the system at any time. This paper modulates a cloud storage facility as a fluid queue controlled by Markovian queue. This queue has infinite buffer capacity which determined by the M/M/1/N queue with constant arrival and service rates. We obtain the analytical solution of the distribution of the buffer occupancy. Moreover, several performance measures and numerical results are given which illustrate the effectiveness of the proposed model.
Magnant and Martin conjectured that the vertex set of any d-regular graph G on n vertices can be partitioned into $n / (d+1)$ paths (there exists a simple construction showing that this bound would be best possible). We prove this conjecture when $d = \Omega(n)$, improving a result of Han, who showed that in this range almost all vertices of G can be covered by $n / (d+1) + 1$ vertex-disjoint paths. In fact our proof gives a partition of V(G) into cycles. We also show that, if $d = \Omega(n)$ and G is bipartite, then V(G) can be partitioned into n/(2d) paths (this bound is tight for bipartite graphs).
In this chapter, students learn about the levels of measurement that social scientists engage in when collecting data. The most common system for conceptualizing quantitative data was developed by Stevens, who defined four levels of data, which are (in ascending order of complexity) nominal, ordinal, interval, and ratio-level data. Nominal data consist of mutually exclusive and exhaustive categories, which are then given an arbitrary number. Ordinal data have all of the qualities of nominal data, but the numbers in ordinal data also indicate rank order. Interval data are characterized by all the traits of nominal and ordinal data, but the spacing between numbers is equal across the entire length of the scale. Finally, ratio data are characterized by the presence of an absolute zero. Higher levels of data contain more information, although it is always possible to convert from one level of data to a lower level. It is not possible to convert data to a higher level than it was collected at. It is important to recognize the level of data because there are certain mathematical procedures that require certain levels of data. Social scientists who ignore the level of their data risk producing meaningless results or distorted statistics.
The chapter on visual models discusses basic ways that scientists create visual representations of their data, including charts and graphs, in order to understand their data better. Like all models, visual models are a simplified version of reality. Two of the visual models discussed in this chapter are the frequency table and histogram. The histogram, in particular, is useful in the shape of the distribution of data, skewness, kurtosis, and the number of peaks. Other visual models in the social sciences include frequency polygons, bar graphs, stem-and-leaf plots, line graphs, pie charts, and scatterplots. All of these visual models help researchers understand their data in different ways, though none is perfect for all situations. Modern technology has resulted in the creation of new ways to visualize data. These methods are more complex, but they provide data analysts with new insights into their data. The incorporation of geographic data, animations, and interactive tools give people more options than ever existed in previous eras.
When the dependent variable consists of nominal data, it is necessary to conduct a χ2 test, of which there are two types in this chapter: the one-variable χ2 test and the two-variable χ2 test. The former procedure tests the null hypothesis that each group formed by the independent variable is equal to a hypothesized proportion. The two-variable χ2 test has the null hypothesis that the two variables are uncorrelated. Both procedures use the same eight steps as all NHSTs.
The effect sizes for χ2 tests are the odds ratio (for both χ2 tests) and the relative risk (for the two-variable χ2 test). When these effect sizes equal to 1.0, the outcome of interest is equally likely for both groups. When these effect sizes are greater than 1.0, the outcome of interest is more likely for the non-baseline group. When these values are less than 1.0, the outcome of interest is more likely for the baseline group. However, odds ratio and relative risk values are not interchangeable. When there are more than two groups or two outcomes, calculating an effect size requires either (1) calculating more than one odds ratio, or (2) combining groups together.
Blood-side resistance to oxygen transport in extracorporeal membrane blood oxygenators (MBO) depends on fluid mechanics governing the laminar flow in very narrow channels, particularly the hemodynamics controlling the cell free layer (CFL) built-up at solid/blood interfaces. The CFL thickness constitutes a barrier to oxygen transport from the membrane towards the erythrocytes. Interposing hemicylindrical CFL disruptors in animal blood flows inside rectangular microchannels, surrogate systems of MBO mimicking their hemodynamics, proved to be effective in reducing (ca. 20%) such thickness (desirable for MBO to increase oxygen transport rates to the erythrocytes). The blockage ratio (non-dimensional measure of the disruptor penetration into the flow) increase is also effective in reducing CFL thickness (ca. 10–20%), but at the cost of risking clot formation (undesirable for MBO) for disruptors with penetration lengths larger than their radius, due to large residence times of erythrocytes inside a low-velocity CFL formed at the disruptor/wall edge.
A tight Hamilton cycle in a k-uniform hypergraph (k-graph) G is a cyclic ordering of the vertices of G such that every set of k consecutive vertices in the ordering forms an edge. Rödl, Ruciński and Szemerédi proved that for $k\ge 3$, every k-graph on n vertices with minimum codegree at least $n/2+o(n)$ contains a tight Hamilton cycle. We show that the number of tight Hamilton cycles in such k-graphs is ${\exp(n\ln n-\Theta(n))}$. As a corollary, we obtain a similar estimate on the number of Hamilton ${\ell}$-cycles in such k-graphs for all ${\ell\in\{0,\ldots,k-1\}}$, which makes progress on a question of Ferber, Krivelevich and Sudakov.
This chapter covers fundamental information that students must know in order to correctly conduct and interpret statistical analyses. The first section discusses why students in the social sciences need to learn statistics. The second section is a primer on the basics of research design, including the nature of research hypotheses and research questions, the difference between experimental and correlational research, and how descriptive statistics and inferential statistics serve different purposes. These foundational concepts are necessary to understand the rest of the textbook.
The final section of the chapter discusses the essential characteristics of models. Every statistical procedure creates a model of the data. Models are simplified versions of the world that make reality easier to understand. Fundamentally, all models are wrong, but the goal of scientists is to create models that are useful in explaining processes, making predictions, and building understanding of phenomena. The lesson distinguishes between theories, theoretical models, statistical models, and visual models so that students are equipped to deal with these concepts in later chapters.
Traffic congestion across the world has reached chronic levels. Despite many technological disruptions, one of the most fundamental and widely used functions within traffic modeling, the volume–delay function has seen little in the way of change since it was developed in the 1960s. Traditionally macroscopic methods have been employed to relate traffic volume to vehicular journey time. The general nature of these functions enables their ease of use and gives widespread applicability. However, they lack the ability to consider individual road characteristics (i.e., geometry, presence of traffic furniture, road quality, and surrounding environment). This research investigates the feasibility to reconstruct the model using two different data sources, namely the traffic speed from Google Maps’ Directions Application Programming Interface (API) and traffic volume data from automated traffic counters (ATC). Google’s traffic speed data are crowd-sourced from the smartphone Global Positioning System (GPS) of road users, able to reflect real-time, context-specific traffic condition of a road. On the other hand, the ATCs enable the harvesting of the vehicle volume data over equally fine temporal resolutions (hourly or less). By combining them for different road types in London, new context-specific volume–delay functions can be generated. This method shows promise in selected locations with the generation of robust functions. In other locations, it highlights the need to better understand other influencing factors, such as the presence of on-road parking or weather events.