Refine search
Actions for selected content:
53140 results in Statistics and Probability
Influence of climate variability and seasonal trends on malaria incidence in Dar es Salaam, Tanzania using generalized additive models
-
- Journal:
- Epidemiology & Infection / Volume 154 / 2026
- Published online by Cambridge University Press:
- 23 June 2026, e93
-
- Article
-
- You have access
- Open access
- HTML
- Export citation
New HIV diagnoses and risk factors for late HIV diagnosis, Finland, 2008–2023
-
- Journal:
- Epidemiology & Infection / Volume 154 / 2026
- Published online by Cambridge University Press:
- 23 June 2026, e81
-
- Article
-
- You have access
- Open access
- HTML
- Export citation
Linking data for better evidence-based policy: A landscape review in central banks
-
- Journal:
- Data & Policy / Volume 8 / 2026
- Published online by Cambridge University Press:
- 23 June 2026, e28
-
- Article
-
- You have access
- Open access
- HTML
- Export citation
Mpox Seroprevalence among Sex Workers and Men who have Sex with Men Preceding Sustained Urban Outbreak in the Democratic Republic of the Congo
-
- Journal:
- Epidemiology & Infection / Accepted manuscript
- Published online by Cambridge University Press:
- 23 June 2026, pp. 1-31
-
- Article
-
- You have access
- Open access
- Export citation
Neural delay differential equations: learning non-Markovian closures for partially known dynamical systems
- Part of
-
- Journal:
- Data-Centric Engineering / Volume 7 / 2026
- Published online by Cambridge University Press:
- 22 June 2026, e22
-
- Article
-
- You have access
- Open access
- HTML
- Export citation
Ruin-dependent bivariate stochastic fluid processes
- Part of
-
- Journal:
- Advances in Applied Probability , First View
- Published online by Cambridge University Press:
- 22 June 2026, pp. 1-37
-
- Article
-
- You have access
- HTML
- Export citation
AI Risk Bonds: a market-based mechanism for governing liability
-
- Journal:
- Data & Policy / Volume 8 / 2026
- Published online by Cambridge University Press:
- 22 June 2026, e27
-
- Article
-
- You have access
- Open access
- HTML
- Export citation
Gradient boosted multi-population mortality modeling with high-frequency data
-
- Journal:
- ASTIN Bulletin: The Journal of the IAA , First View
- Published online by Cambridge University Press:
- 19 June 2026, pp. 1-26
-
- Article
-
- You have access
- Open access
- HTML
- Export citation
Risk-of-bias assessment of vaccine effectiveness studies: a scoping review of systematic reviews
-
- Journal:
- Epidemiology & Infection / Volume 154 / 2026
- Published online by Cambridge University Press:
- 19 June 2026, e95
-
- Article
-
- You have access
- Open access
- HTML
- Export citation
Laboratory demonstration of digital twin construction
- Part of
-
- Journal:
- Data-Centric Engineering / Volume 7 / 2026
- Published online by Cambridge University Press:
- 19 June 2026, e21
-
- Article
-
- You have access
- Open access
- HTML
- Export citation
Computing the probability of intersection
- Part of
-
- Journal:
- Combinatorics, Probability and Computing , First View
- Published online by Cambridge University Press:
- 19 June 2026, pp. 1-20
-
- Article
-
- You have access
- Open access
- HTML
- Export citation
-
Let
 $\Omega _1, \ldots , \Omega _m$ be probability spaces, let
  ${\mathbf \Omega }=\Omega _1 \times \cdots \times \Omega _m$ be their product and let
  $A_1, \ldots , A_n \subset {\mathbf \Omega }$ be events. Suppose that each event
  $A_i$ depends on
  $r_i$ coordinates of a point
  $x \in {\mathbf \Omega }$,
  $x=\left (\xi _1, \ldots , \xi _m\right )$, and that for each event
  $A_i$ there are
  $\Delta _i$ other events
  $A_j$ that depend on some of the coordinates that
  $A_i$ depends on. Let
  $\Delta =\max \{5,\ \Delta _i\,:\, i=1, \ldots , n\}$ and let
  $\mu _i=\min \{r_i,\ \Delta _i+1\}$ for
  $i=1, \ldots , n$. We prove that if
  ${\mathbb P}(A_i) \lt (3\Delta )^{-3\mu _i}$ for all
  $i$, then for any
  $0 \lt \epsilon \lt 1$, the probability
  ${\mathbb P}\left ( \bigcap _{i=1}^n \overline {A}_i\right )$ of the intersection of the complements of all
  $A_i$ can be computed within relative error
  $\epsilon$ in polynomial time from the probabilities
 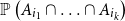 ${\mathbb P}\left (A_{i_1} \cap \ldots \cap A_{i_k}\right )$ of
  $k$-wise intersections of the events
  $A_i$ for
 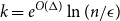 $k = e^{O(\Delta )} \ln (n/\epsilon )$.


A Practical Guide to Time Series Analysis
-
- Published online:
- 18 June 2026
- Print publication:
- 07 May 2026
Tables
-
- Book:
- Developing Theories in the Social Sciences
- Published online:
- 27 May 2026
- Print publication:
- 18 June 2026, pp ix-x
-
- Chapter
- Export citation
Arbitrage-free catastrophe reinsurance valuation for compound dynamic contagion claims
-
- Journal:
- Annals of Actuarial Science , First View
- Published online by Cambridge University Press:
- 18 June 2026, pp. 1-30
-
- Article
-
- You have access
- Open access
- HTML
- Export citation
4 - Types of Reasoning and Definitions
-
- Book:
- Developing Theories in the Social Sciences
- Published online:
- 27 May 2026
- Print publication:
- 18 June 2026, pp 27-46
-
- Chapter
- Export citation
5 - Testing Theory
-
- Book:
- Developing Theories in the Social Sciences
- Published online:
- 27 May 2026
- Print publication:
- 18 June 2026, pp 47-65
-
- Chapter
- Export citation
2 - Concepts
-
- Book:
- Developing Theories in the Social Sciences
- Published online:
- 27 May 2026
- Print publication:
- 18 June 2026, pp 6-16
-
- Chapter
- Export citation
Terms in Chapter 6
- from 6 - Developing a Theory of Status Effects
-
- Book:
- Developing Theories in the Social Sciences
- Published online:
- 27 May 2026
- Print publication:
- 18 June 2026, pp 89-89
-
- Chapter
- Export citation
Logical translation of the status generalization process
- from 6 - Developing a Theory of Status Effects
-
- Book:
- Developing Theories in the Social Sciences
- Published online:
- 27 May 2026
- Print publication:
- 18 June 2026, pp 90-91
-
- Chapter
- Export citation
7 - Public Good Theory and Research: Public Good Theory and Research
-
- Book:
- Developing Theories in the Social Sciences
- Published online:
- 27 May 2026
- Print publication:
- 18 June 2026, pp 92-105
-
- Chapter
- Export citation
